
March 23 – Fridays Trading
DJIA – The DOW was down 724, and THAT is scaring a lot of people. We have been expecting this and so far, it is what it is. At this point I am looking at us on day 27, markets can fall further, watch for support at the 200sma. It CAN BE BROKEN in a shake out, we wont be buying without a swing low in place. I will discuss my experience in later reports.

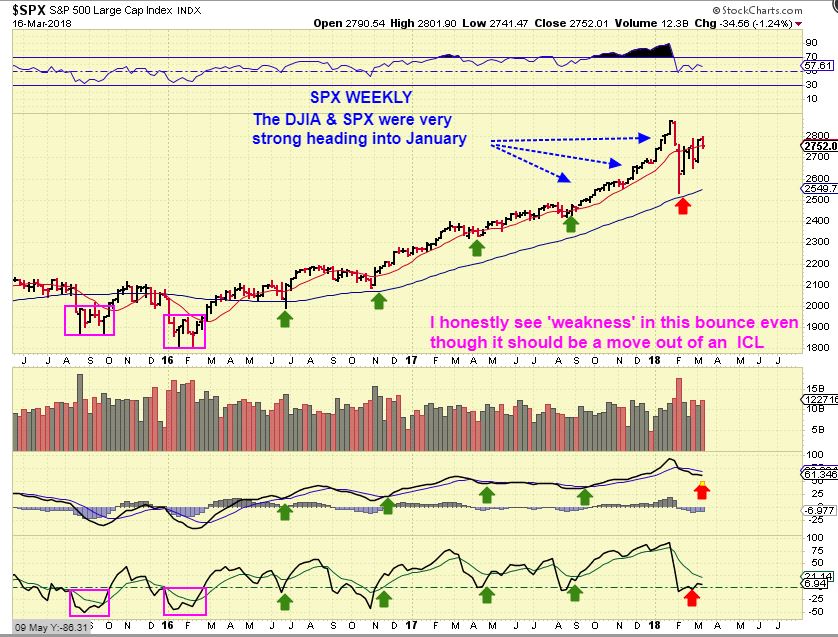
SPX – I have been pointing out a Double bottom possibility for weeks to prepare us for this type of a sell off moment, because when this happens, people panic. I wanted you to be ready and not watching CNBC as they try to pin every reason for this drop. You may hear: “Was it a trump tweet?” “It was FaceBook?” “Is it the FBI probe?” “Is it the Rate Hike?” “New Tariffs are destrying the markets” – The Bulls were just too confident. Even North Korea threatening to blow up NYC financial district last year didn’t rock the markets, so I doubt FaceBook losing some peoples personal info did this. No, we saw weakness was in the weekly charts. All I was reading or hearing on CNBC recently was that this was just going to run higher & higher for months. I pointed out that I was seeing ‘weakness’ in this WEEKLY CHART this weekend.
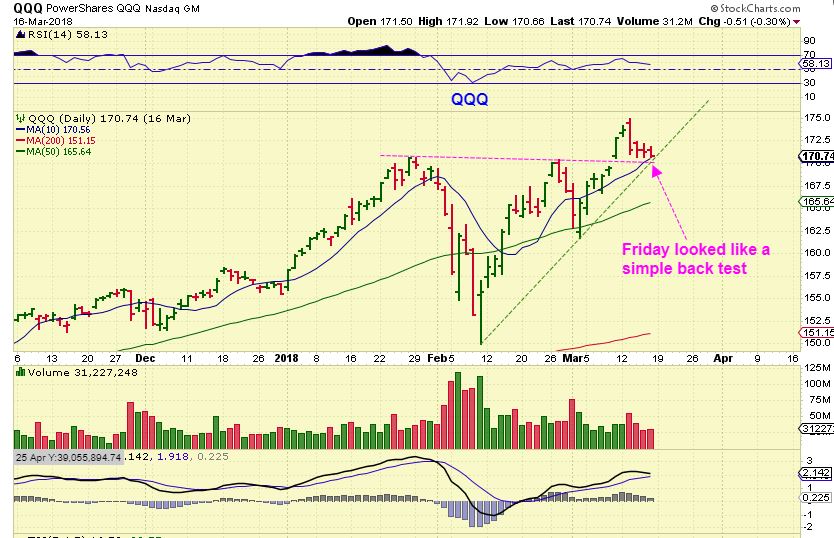
QQQ LAST FRIDAY – Quad witching, and yet QQQ looked fine on the daily charts and 60 minute / 30 minute, etc. It was just going sideways to the support of both the 10sma and the trend line for 3 days ( Wed, Thursday, and Friday) not really dropping. It sat on Support and Mondays Gap down just shocked the Bulls in a big way. The daily chart was an illusion …
Yes, for those not looking close enough, it was just an illusion. Is this lady really floating?

No, It is a shadow of a flag pole on the beach to her side, her platform is also on the beach sand. Just a quick glance without a closer, deeper look, can be deceiving in markets and in life.
.
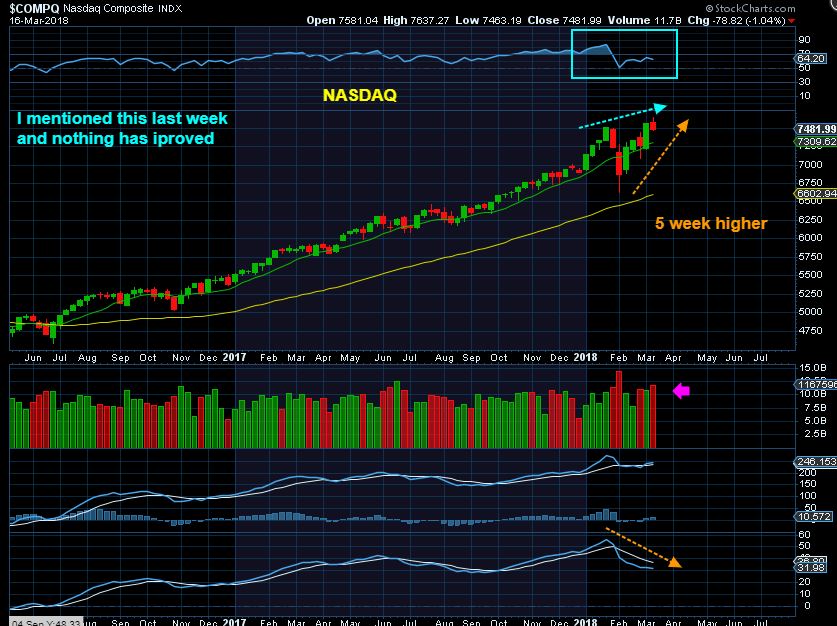
The WEEKLY CHARTS seemed to be the only ones showing weakness, and some of it was pointed out here. A weak weekly will lead to a weak daily and I mentioned this in the weekend report 2 weeks ago too. I used this in last weekends report to show that even though that daily QQQ looked fine Friday, I was still “CAUTIOUS”, due to the weekly charts internals. I still owned some of the stronger stocks.
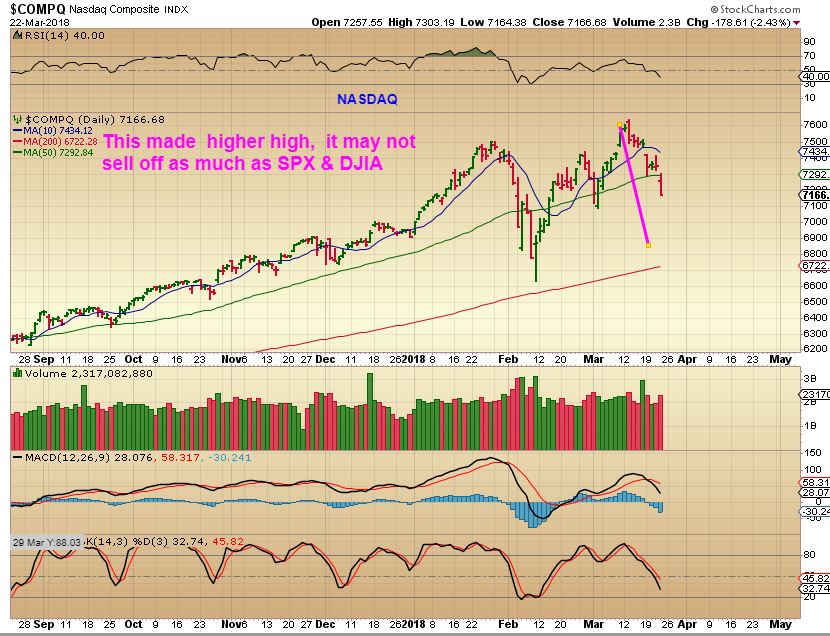
NASDAQ NOW – So currently we have time in the daily cycle for more downside, so lets just expect it. I do NOT advise jumping in on an intraday reversal. We had a good bounce yesterday and then it sold off to lows again, trapping buyers. I will look for a swing low, and for now lets just expect it to be near the 200sma most likely. Don’t panic, this is necessary to clean the Bulls out, and then we will know later if this as a Long Term Double Top, or another double bottom low.
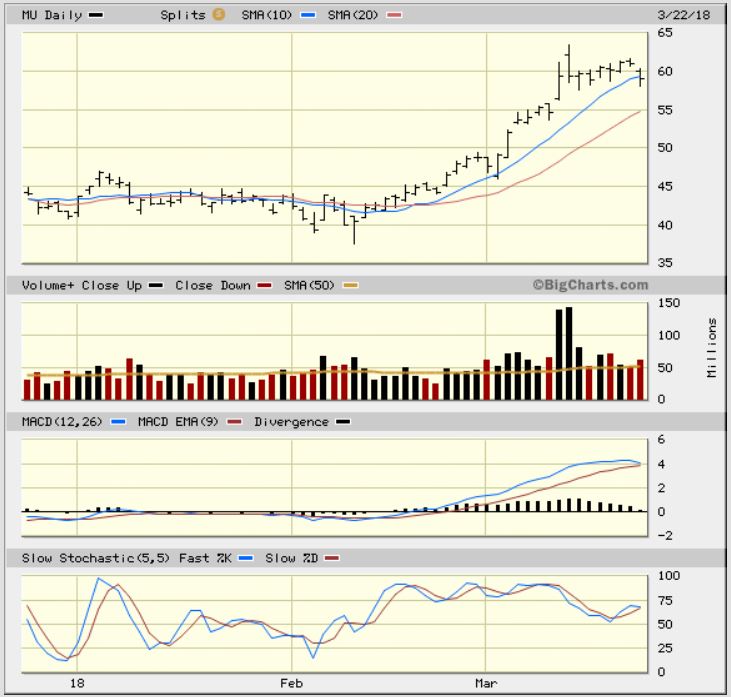
AQ, SQ, MU, HCC, SGH, etc still look pretty nice. I mentioned that I like to watch the leaders as these market pull back – they may be the strongest of the bunch when buying time comes. IF Everything starts to fall apart, we will re-assess things at that time as a possible top.
MU – Even with the Market slam down, this was MU 15 minutes before the close. It then dropped in after hrs and bounced back, so we’ll see how these hold up in the coming days.
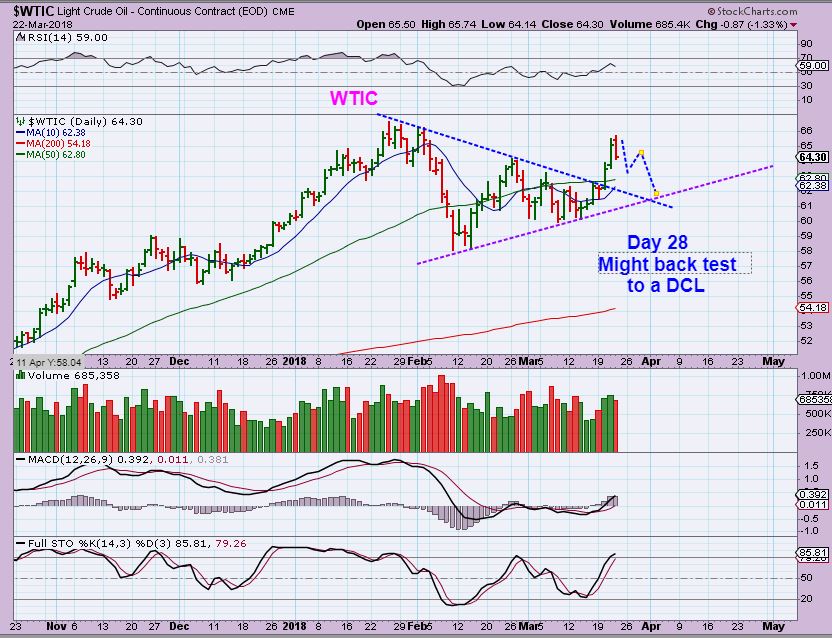
WTIC – I would expect that Oil will pause or pull back sooner or later. Why? The cycle timing, but it may or may not do that now. I am drawing this just as an example of what a dcl in day 30 – 33 or so could look like, but OILS DCL CAN also come at day 40-50! . This means that it could extend higher first before putting in a dcl. So …
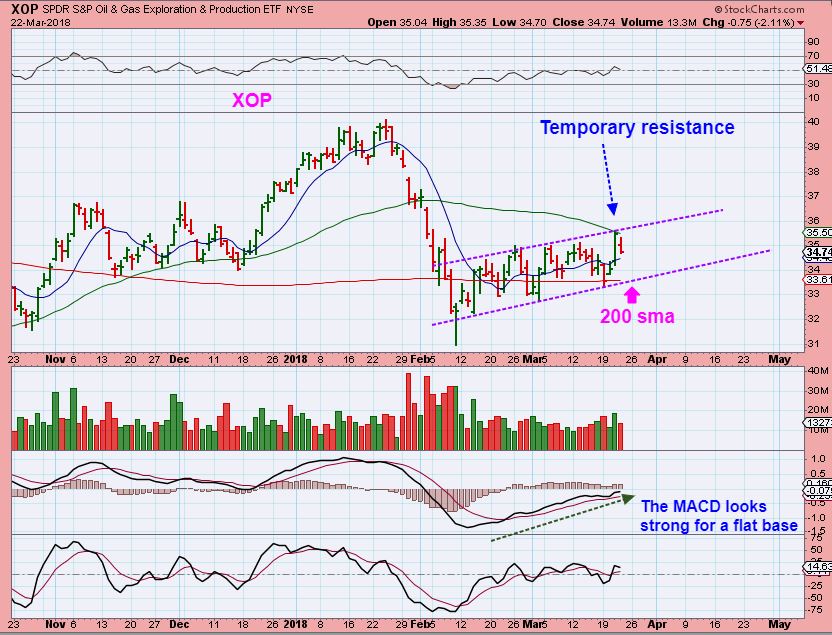
XOP – I took some energy trades and some are still near the lows, that keeps us cautiously optimistic. This is one area of Thin Ice in the opening theme pic. It is when ‘support’ could give way and you need to allow yourself to be taken out of the trade if it does, just in case the waters are deep. I do like the trade set ups in Energy at this point.
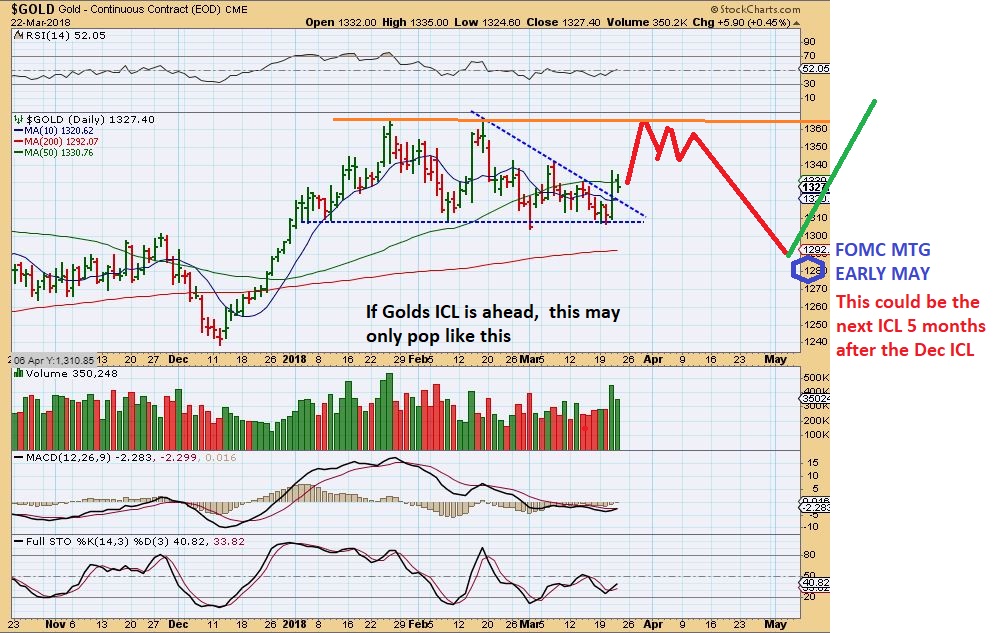
The other area where we need to picture Possible ‘Thin Ice’ is the Precious Metals, until we see a move higher. It is a bit risky this late in an intermediate cycle, but this triangle break is inviting for at least a trade.
2 THOUGHTS –
GOLD #1 – In my experience (Gold & GDX here), triangles can mess with ‘cycle timing’ and a move out of a triangle is often DAY 1. Friday would be Gold day 3. THAT SAID, I did some buying of miners as mentioned yesterday. IF THIS ROLLS OVER AS L.T. , it may top by day 5-8, so keep an eye on this one, and YOU MAY WANT TO RAISE STOPS IF MINERS MOVE HIGHER. You will then be assured to lock in some gains if it rolls over.
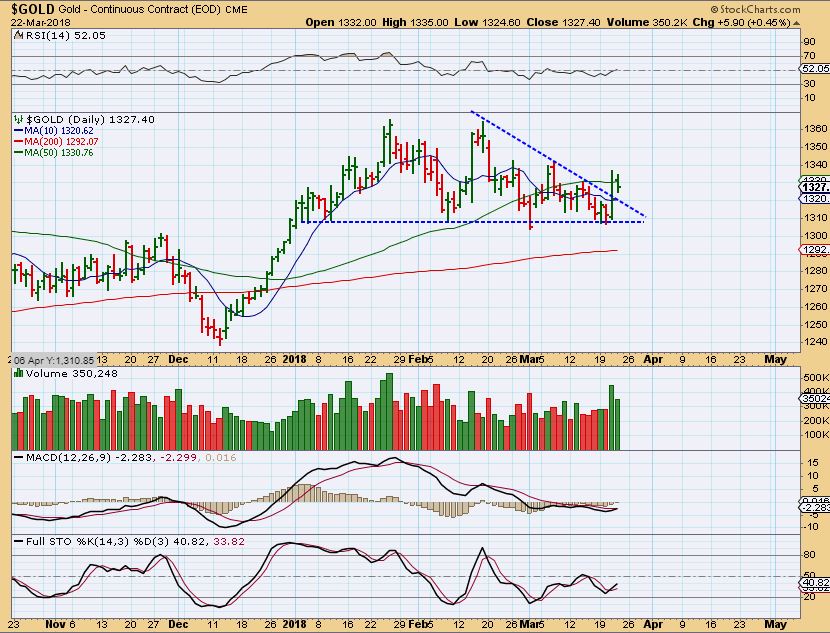
GOLD #2– I will be watching for either a blast higher or just a push back toward highs and then roll over into an ICL (Maybe May). This may be a short trade due to the intermediate cycles timing, I just cant tell if Miners are in sync with Gold or are they acting separately?
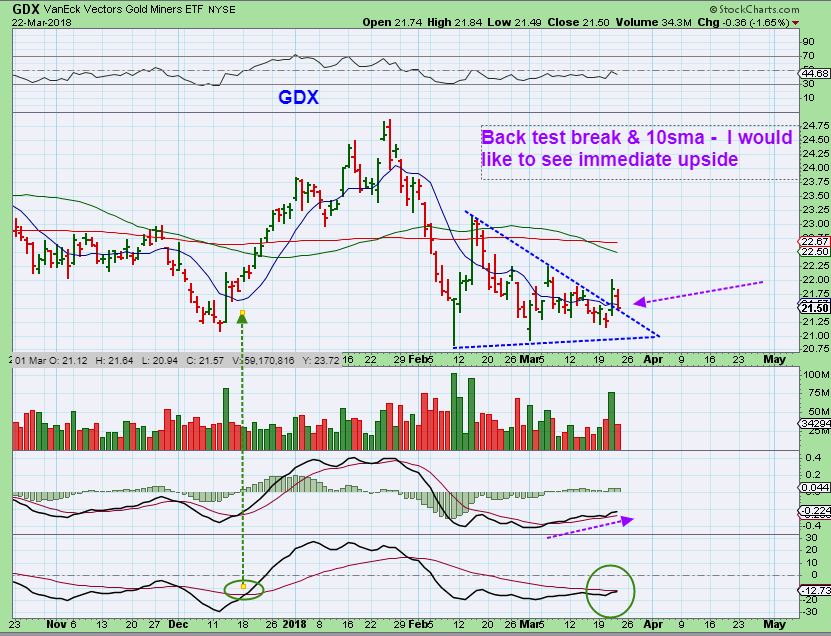
GDX – Thursday looks like a Triangle back test, and hopefully this is it. It just looks Bullish here, but please note that 50&200sma. My style would usually be to possibly sell some of my positions if we get up there this late in Golds daily cycle, but in Dec Miners blew right through it, so let’s see if they can do that again. I have reviewed several Miners Wednesday & Thursday that appear bullish. DO they after Gold dropped Thursday?…
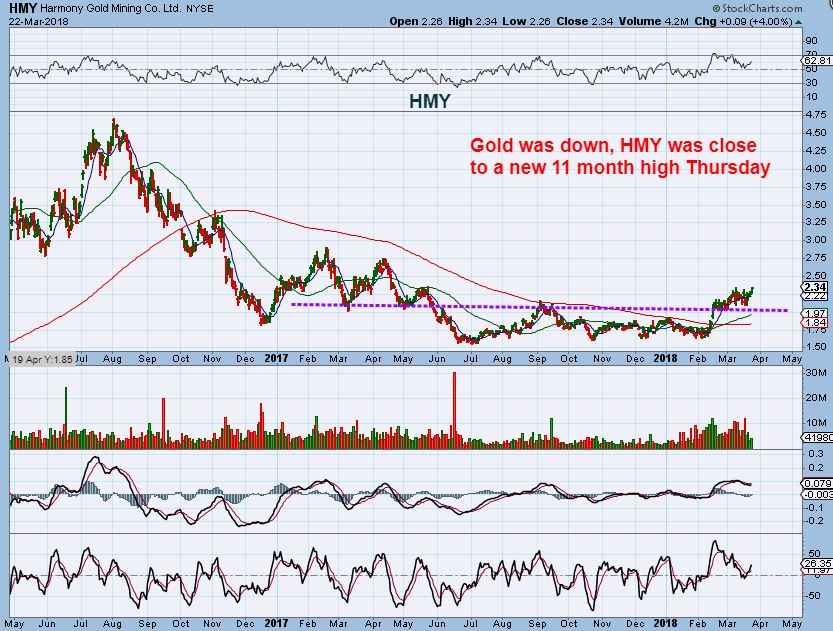
HMY – Does this look like GOLD is ready to drop into an ICL, or does this look like it may be de-coupling from Gold & Silver? HMY actually moved up 4% on Thursday when Gold & Silver were down. This looks like a very bullish chart, it already broke from a lower base that seems to have become support.
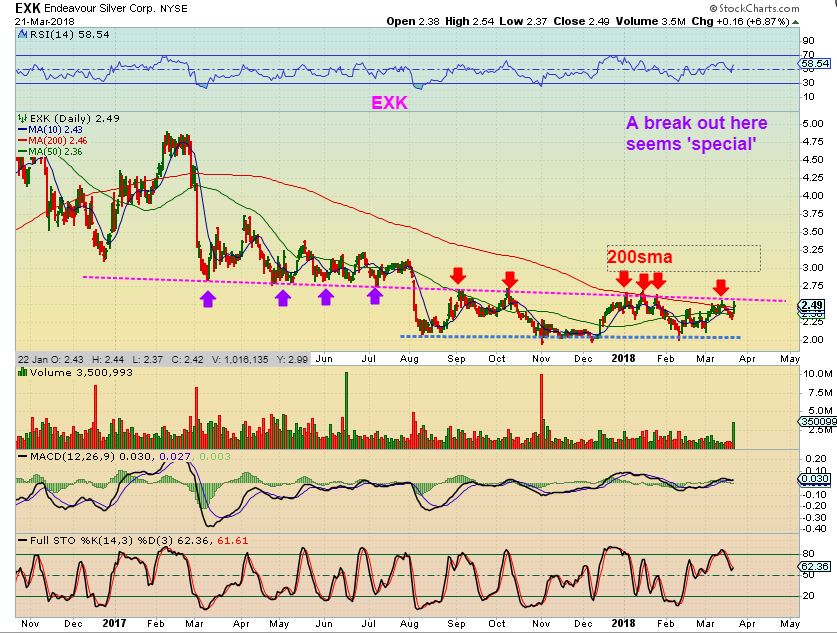
EXKs Chart from YESTERDAY – EXK has a lower base, similar to HMY above in my eyes. I bought EXK and mentioned yesterday that this base could be broken and act as support (like HMY above) too, under favorable conditions.
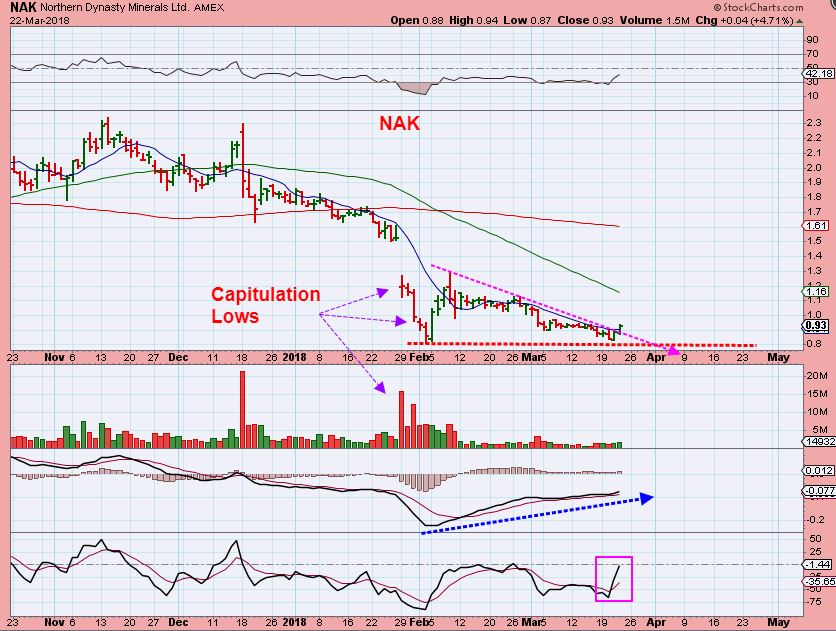
NAK – NAK broke out Thursday with strong divergence. I know that many may hate NAK, but it may be a good trade here. A quick tag of the green 50sma is a 30% gainer. A stop close by protects capitol & can be raised as it rises. Gold was down Thursday, Markets crashed, NAK was up. I own it.
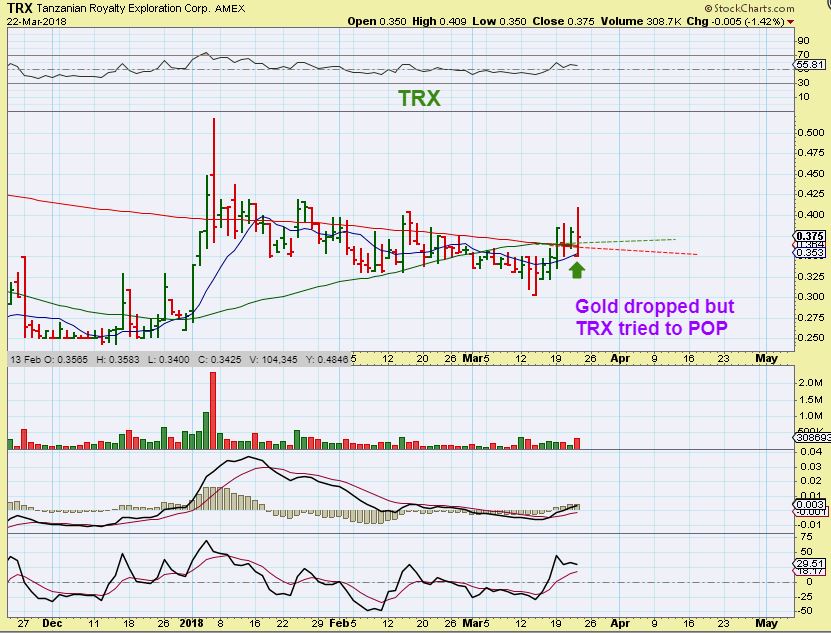
TRX – TRX surged today (Gold was down) and closed above the 50sma. I bought it. Why? From the DEC lows, this ran higher & held in a sideways move. It broke the 50sma and now recovered the 10, 50, and 200sma. I’ll give it a try with the GDX triangle break possibly indicating day 2.
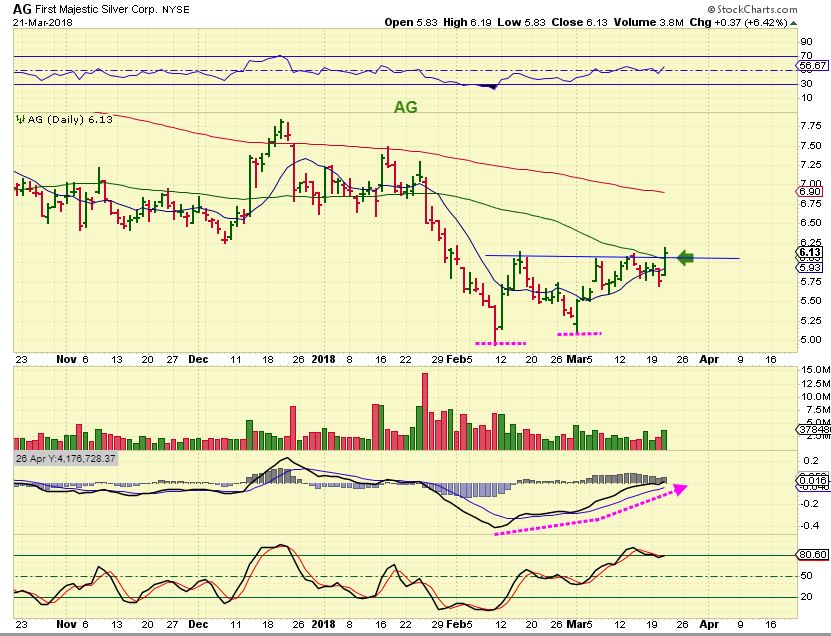
AG – This was yesterday, and it moved a bit higher Thursday. Raise your stops above the 50sma to lock in small gains if this falls. If you bought it and held when I bought it weeks ago, you have plenty of cushion ( I sold that trade & HL for gains as mentioned in the comments, but I’m back in AG)
SO BASICALLY, THE GENERAL MARKETS ARE IN CORRECTION. BE PATIENT.
OIL LOOKS BULLISH, I HAVE ENTERED ENERGY TRADES
I HAVE MENTIONED THE MEDICAL MARIJUANA SECTOR LOOKS TO BE FIRMING UP. IT STILL DOES, BUT I GOT STOPPED OUT OF MY 3 TRADES YESTERDAY . IT WENT FROM NICE GAINS ACTUALLY TO A PAPER-CUT. 🙁 I WILL STILL BE WATCHING THAT SECTOR WHEN THE GENERAL MARKETS SETTLE DOWN.
MINERS ( GOLD & GDX ) BROKE FROM A WEDGE OR TRIANGLE, AND THAT IS OFTEN THE START OF A NEW DAILY CYCLE AFTER A CONSOLIDATION. I LIKED MY CHANCES THAT THE USD COULD CONTINUE TO DROP & MINERS CAN GIVE ME SOME GOOD % GAINS. THIS CAME ABOUT AFTER A FED MEETING RATE HIKE – SO FAR/SO GOOD. IF YOU WISH TO WAIT & SEE, THAT IS FINE. WE HAVE BEEN IN A SIDEWAYS CONSOLIDATION FOR MANY WEEKS. I’M BUYING AT THE LOWS & HOPING FOR SOME UPSIDE, BUT I DO REMAIN CAUTIOUS.
NOTE: I AM NOT “ALL IN”. I AM TAKING POSITIONS AT A POINT WHERE I THINK THAT SUPPORT IS IN PLACE, AND WE SHOULD MOVE HIGHER. STOPS CAN BE RAISED IF WE MOVE HIGHER OVER THE NEXT COUPLE OF DAYS. “RAISE STOPS, SELL POPS”, WHATEVER YOU ARE COMFORTABLE WITH SHORT TERM. IF WE DROP, I AM OUT IN SHALLOW WATERS, I AM NOT DROWNING. START SMALL, BUT IT IS ENCOURAGING TO SEE STOCK CHARTS LIKE HMY THAT SHOW LONGER TERM PROGRESS. FOR GDX / GDXJ? IT IS A BIT DANGEROUS BECAUSE IT SEEMS TOO EARLY FOR AN ICL – SO A L.T. DAILY CYCLE MAY TOP ON DAY 5-8 OR SO. ENJOY YOUR FRIDAY TRADING!
~ALEX


Alex, with the miners, you think its too early for an ICL. Then what would this be? A 4th DCL or are things too muddy with the triangle?
I’m using cycles with Gold, and even that isnt exactly clear daily cycle wise, but this is what is clear:
Gold had an ICL in Early Dec, and I’ve seen usually 5-6 months before another one. Occasionally I have seen 4 months, so it would seem that March is too early for Gold to have an ICL.
Could the FOMC MTG and talk of increasing inflation have sped things up? I guess that anything is possible, but I tend to doubt it. At this point, I’m trying to be open-minded and watch things unfold….it is always what works best for me.
Was FEB an ICL for Miners 1 month later than Golds? I have seen that difference in the past. Miners broke their Dec lows in Feb, so I have toyed with the idea, but just think of this and try to explain it….
Gold was at highs in Feb, GDX was breaking to new lows in Feb. – how does THAT fit normal analysis? It is not normal and is a difference in the 2 sectors that will be clarified over time. For now I will take the triangle trade at lows and try to just trade the possibilities/ probabilities
Thanks
Solid report, I appreciate you mentioning not being all-in, it gives readers an idea of how bullish you are. I happen to agree, it isn´t a screaming buy in the miners, yet they look good in a bad market so not a bad time to buy a triangle breakout.
I am undecided on raising my stops to lock in small gains if miners turn lower, because I am betting the downside isn´t much more than 15% in GDX back from the $21.50 level, which is nothing in minerland. I can ride down a possible 15% on what I have when I have upside potential of 100% or more, so I will keep wider stops and manage risk through position sizes. In the past I could easily be 100% invested here, but at the moment I am only 44% invested.
Yes, raising stops for you ( a longer term holder) trying to accumulate positions near lows would probably cause you to lose position. We do all have varying trading styles – so you may just want to stick to your idea that fits your trading style to avoid possibly overtrading more than you like.
Key for me now is to keep it starter / small and manageable in case the sector sells down .
Alex, great coverage of the general markets the past couple weeks.
I want to mention something I read many years ago about market coverage in the news. A guy who used to be in charge of writing the daily market updates for a major news organization admitted that he didn’t really “know” why the market moved up or down on a given day but he had to write some kind of an explanation every day so he just guessed and “made it up.”
Now I know that trading today is different that it was then because computer algorithms are programmed to react to certain keywords in online news stories, but the fact remains that most of the time analysts are just guessing about what is moving the market. Sure, the China tariffs probably had an impact, but the market sell-off may just have been a continuation of the internal weakness Alex has pointed out for the last couple weeks.
I’m comfortably in cash waiting for another buying opp. I will not jump the gun. I think TQQQ may come close to tagging its 200 day MA again before this is all over. I see lots of traders on other boards anxious to “buy the bottom” today. I agree with Alex, don’t rush to buy a reversal today. Even if the reversal holds into the close you will probably get another chance on Monday as there is often a morning dip down to or below Friday’s close.
As usual, this is just my opinion, check your own charts and make your own trades.
Good trading to all! https://uploads.disquscdn.com/images/62f10070b31660f63d249310492226b42085af9bcb4c1e4e03e35a12e1b2c849.gif
They don’t call them the ‘talking heads’ for nothing.
I like some of the CNBC guys & girls, and they are smart people in their field, but they cant just sit there and say nothing as markets sell off, so they say whatever happened that day is the reason. A Trump Tweet was blamed one day. They dont often use charts , so they dont usually see it coming, they scramble for news & viewer ratings. The other day, all I heard was “FaceBook is taking the markets down fast. The DOW is down 400. Really, the Dow was down 400 because of a Nasdaq Social Media Stock? lol.
C’Mon- we have had so much bad news at the end of last year and nothing could stumble the markets, now facebook subscribers being duped into losing personal info crashed the markets? Is that believable when The REAL DEAL EQUIFAX debacle didn’t even do that, and that was millions losing Name, Date of Birth, S.S. #’s, Tax info, addresses, etc etc.
I do not recommend believing most the news on a sell off day 🙂 Weakness was in the weekly charts 2 weeks ago
Thanks Steve
Thank you for your opinion on TQQQ.
Remember, it’s just an opinion not necessarily a “prediction”
That’s fine. I like to see other people’s opinions. It’s helpful.
UPDATE (3:09 PM ET): The bloodbath in stocks continues … now you see why Alex warned against being fooled by a bounce this morning. Judging by my 15 min charts, it looks like stocks are likely to continue selling off into the close … but a strong bull buying run could change that. Sucks if you are long, but exciting thinking about the great up coming buying opp if you are in cash.
I’m just waiting and watching.
https://uploads.disquscdn.com/images/b6e7b0d926bb619c0cd4f0fca50a1eeecfb5d4273885b0e834e0cf6b8b5705eb.gif
Hi Alex, what is your recommendation for gold if we got stopped out yesterday? Time frame is this intermediate cycle. Thanks.
GOLD #2– I will be watching for either a blast higher or just a push back toward highs and then roll over into an ICL (Maybe May). This may be a short trade due to the intermediate cycles timing, I just cant tell if Miners are in sync with Gold or are they acting separately?
Thx Tess, I went to grab a cup of tea and you pretty much answered that.
Peter, In the report I have been saying that this MIGHT top on day 5-8, if it becomes left translated for Gold.
You say stopped out for Gold, but maybe you meant Miners, because Gold didnt seem to tag the trend line or 10sma.
If it is Miners, there may be individual Miners still near lows that could be bought for a few days, I havent had a chance to look, I am holding a few and wasnt really looking for more yet. I had some in yesterday & the Fed Day report. Bought NAK yesterday and Fed day still near lows for example.
Hope that helps, its hard with gold up $20 at the open to advise buying at this point. I like low risk entries
This is interesting. Possibly break-away gap?
https://www.tradingview.com/x/qT9NTXl9/
GDXJ looks similar
ABX nice gap up PM
Alex, $gold seems to have a lot of energy for a 4th DC?? Or is this reasonable? Thx
Sidenote: Quite a few MJ Stocks up sharply after losing the 10sma ( Figures) 🙂
Hi Alex
I believe we had a second reading in Parliment here in Canada for Pot laws
Thanks You Curtis, I didnt see that. Some popped & now dropping a bit, but overall I think this sector is trying to shape up ( I am still out for now)
scalp UVXY.. out 1/2
Limit on CY hit to the T (minus a penny) filled for an intra day scalp half size 17.26 fill looking for 10-15 cents ….
Out .42
LFIN BO.. 70 target now
AG goin! I knew i still liked miners (lol)
Added to EXK $2.50 – strong volume in many Miners at this point., I like it above the 200 sma
GG is nicely above 200 and 50sma. I dont own it.
Very nicely today, thats a pretty good looking move today
it actually is my biggest position as its earnings were very good. still keeping my eyes open for the stocks you like Alex.
I added this today as well, thanks for the pro tip cf!
CRC BO
Loving the strong volume start on AG. 1.3m in first 40.
Kirkland lake has my attention – 3 month consolidation almost ready to show itself.
THM – Big volume for it
GDXJ is looking to cross the 200 MA back to to the upside. I went back over the last few months, and the juniors not only went up more than the seniors, they also went down less into the pullbacks. Juniors will remain my focus.
I haven´t done anything today, it´s unlikely I will add to positions, and nothing is near my sell stops. I´m going to get outside and enjoy the day, good luck everybody.
I was just watching that, and it did get above the 50sma. Volume at 2.5 million in the first 40 minutes is encouraging, they always add a large lump of volume on GDX & GDXJ at the end of the day.
sold LFIN as close to 70 target..
Hi Alex – Gold’s triangle breakout with a Weekly close above1330 that you noted in your weekend report certainly looks possible today. I recall your target if that happens being 1370. Watching it like a hawk!
In case it’s interesting, here’s a 2-year Daily chart of GDXJ – the price level of 32.90-ish that I noted 18 months ago seems to be important resistance/support. Be nice if it closes today/week nicely above that. Of course, Mr. Market likes to keep it interesting, so we’ll see…
Hmmm, Discus is being ornery – let me try again
Dropbox Shares Indicated $27 On 1.7M Shares
CF:
I have the ICL in WTIC in mid Feb……..Are you seeing the same ?
Yes – It would seem that with the down trend line broken, those Feb lows are it
Thought so….Thanks
Wave 3 of (3) up
There goes the gas prices at the pumps again, but if you cant beat ’em, join ’em!
Unfortunately you would be correct.
WTI should perform well….
HCC:
I am out …………. broke down below the 50 ma.
lonh DBX 29.09.. stop under 28.80
UVXY running.. need SPX break 2635
out 1/2 DBX
UVXY thru 19.. out another slice
DBX target 32.50/33 if goes .. stop under 30.60 rest
when you said ” hard to chart new IPO” – That is so true. no real history.
TWMJF.. nice bull coil.. pops here could run 27+
out rest UVXY as should get bounce.. 2637 resist
CRSP looks like it wants to bounce on its trendline..
https://www.tradingview.com/x/D18UK6B3/
Thats a nice chart really.
Is EGO garbage or what?
Apparently, huh? It must be that Greek Mine holding them back.
As im still learning the options game im going small on with lower volatility tickers… I grabbed some CY April 20 18c for .35 10 contracts. Tryna get my feet wet
Thats the better way to learn, smart to keep it small and safe while you get a feel for it.
keep up the good work.
Yea its pretty cool. I might stat buying more options.. Im up like 25% already
Did you get my email a few weeks back?
Cason is one of the readers here that knows options from — what I have seen
Refresh
Just briefly checking in – It may not look like much, but these are really good moves in Energy and Miners today (Some energy & some Miners better than others) and this small move is 5%. If you look at the last 10 days , there were several of these %5 moves.
I still like the set up so far, and stops can be raised so that all positions entered 2 days ago or yesterday will not be sold for a loss at this point. ( Unless, of course, we get a big gap down Monday ). , Traders could even just totally sell now – step aside – and scalp the gains, but I am holding to see if Oil can break the prior highs.
https://uploads.disquscdn.com/images/ed6f2200eac9ab8bd8c2fe2219ba361d7d072deb001cc726ee6ee8c43243f8ff.jpg
Bottom of Wave (2) in Feb. now working on Wave iii of (3) 😉
Very nice set up …..
Next DC low due mid late April……
USO about ready to break to new highs…..
I have to run out for a bit, but I’ll leave you with this-
I am not certain how to count Oil out of the 2016 lows, but where we are now I was thinking was wave (v) of (3)
I do not know where actually to put 1 , and that would dictate where to place 2, but I thought 3 started last JULY – and this was a 5th wave. I actually thought with the COT that Oil would put in a drop to the 200 or 50 weekly MA, and then 5.
Basically I’m not really concerned with the 1-2 out of 2016, but don’t you see 3 out of July and this would be a 5th wave? I’ll check back later, thx
https://uploads.disquscdn.com/images/8e32e3765eeae4b3981798bb097ec43dbe503462546469426863ac7fd1138df8.jpg
I guess he had to run out too 🙂
I will send you a chart next week…….
I’m still (trying) to go with the marker ICL was early Feb. That puts us in a Wave 2 retrace and we know from metals that Wave 2 is a beast and can retrace up to 100% (double bottom) or could find support near here next week. Looks like we’ll close on the lows so I certainly wouldn’t try anything here, negative energy almost always spills over into the Monday open. If we do break the lows that means this was all Major 4 wave (higher level) and then we start with i of (V). Either way next low is bullish but not until then. I’ve stopped it exited out of all gen market trades, haven’t been this cash heavy in at least 3 years.
Hey C.F. – you were right about SPY, NAZ and friends. Good call, I stopped quickly and got only a few minor scratches.
Yes, I just saw the bottom of todays little ‘come back’ completely fall out while I was away on the road, and that was what I was worried about ( In the report) when I was saying not to buy the reversals intraday. I was worried that people would jump in – go back to work – and get smoked.
Glad you were in front of your screen & stopped out ( place a thumbs up here)
Yeah, the email dialogue earlier this week helped! I stopped out of Feb low positions (@ profit) 2 weeks ago. Got back in just in case we hit DCL this week. I ejected SVXY at profit during Fed and TQQQ stopped me out at the open yesterday. Which means I missed this last 250 point drop or so.
Man, feels SO much better on the sidelines! 😛
23.4 on UUP seems to be support on 7 different days since the beginning of Feb. That’s where it is right now FWIW.
NSRPF finally topping maybe. A pullback to the 200ma would let the 50ma catch up and cross up over the 200. Would re-enter there.
I didnt even realize that it ran over 100% since its January Lows
SO….
I cant explain MIners looking Bullish the other day, and still looking good- since we really out to get an ICL in Gold 5-6 months after Decembers, but they do look good. I’m torn between a quick scalp or let them ride. I’m letting them ride for now.
THM IS A GREAT WEEKLY CHART. When I mentioned the volume this morning here in the comments, I was buying but didnt say anything, because I figured this daily cycle could top L.T ( day 8 or so?) so I might sell it in a day or two – but I looked at the weekly chart and doubled my position.
I DO NOT KNOW if this will get hit or not when Gold pulls back, it did in Dec at the ICL, but it seems to have been a shake out. Those may be THE LOWS.
refresh for the chart
Last Dec lows had this run for 6 months even though GDXJ didnt. And it ran Big – 600%. Just saying, what if?
It almost looks like it wants to break out & run to $0.80 next week, but it also could stall at overhead resistance. Volume is increasing, so I am in & holding. A POP to $0.80 is about 50% from here.
https://uploads.disquscdn.com/images/4575324a511dcd76c5258d2919fc9556c2739811a098ed63faf1eb507acda3a7.jpg
NAK dropped back to the 10sma, trend line break, but volume was pretty light. I’m staying in it.
GDX & GDXJ nice strong volume.
Have a good weekend all!
THE WEEKEND REPORT HAS BEEN RELEASED