March 1 – Choppiness
The choppiness continues, let’s take a look at what we have.
.
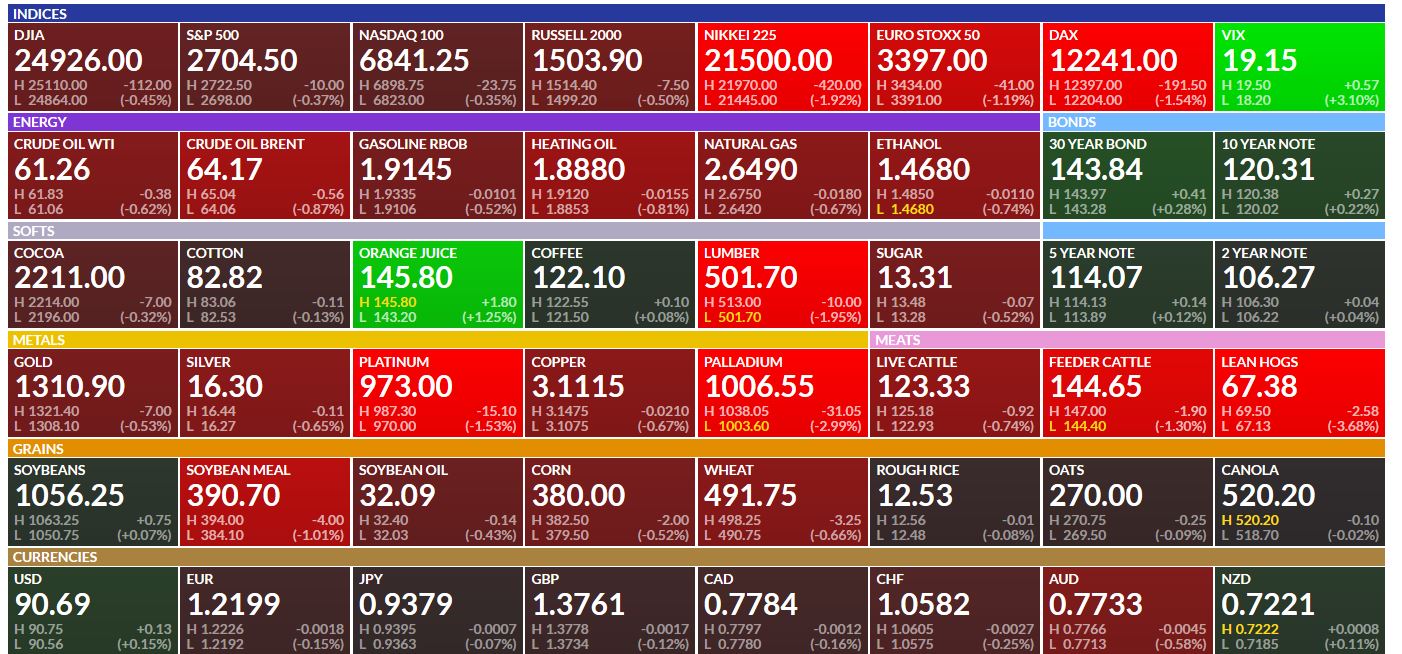
This is a pre-market snapshot, it contains quite a bit of red so far…
.
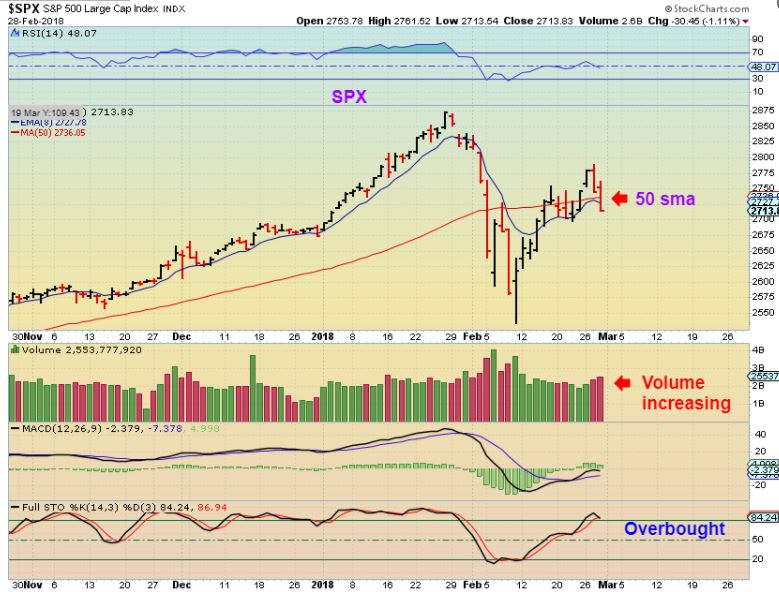
SPX – The SPX broke below the 50sma & Volume increased, so this needs to be watched carefully. Yesterday I reminded readers of my weekend reports ‘lessons’ section at the end, it is worth keeping in mind or re-reading. Day 12 peak so far.
DJIA – SO we have bearish rising wedges forming & over bought stochastics. The Dow also closed below the 50sma with an almost 400 point drop. Look at November & Decembers climb, day after day after day. We are not in that environment right now, things are a bit choppy.
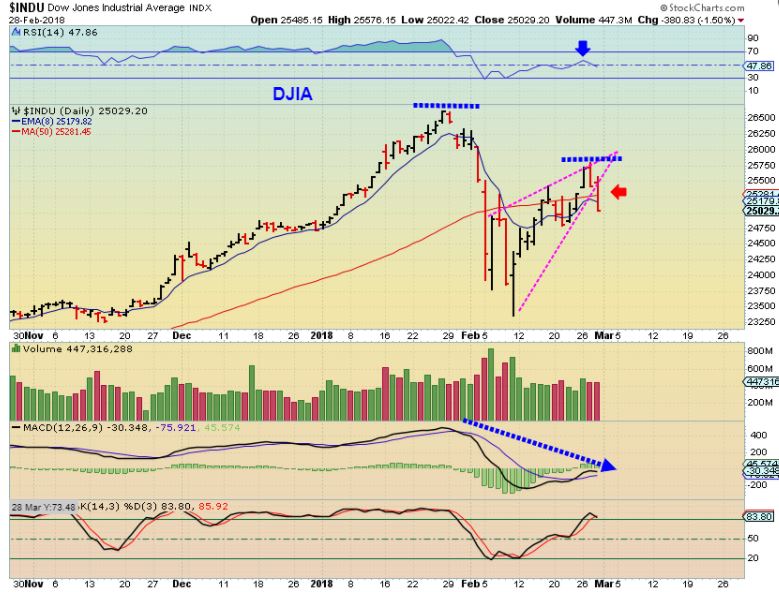
I did mention last week that along with a V-Bottom low, you can also get high volume lows that get re-tested (Double bottom). That is why I pointed out these double bottoms. It can happen.
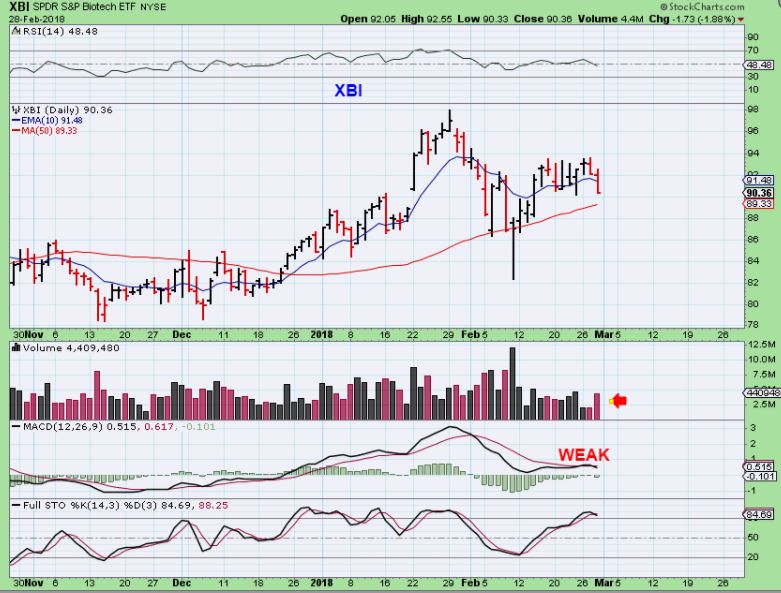
XBI– Biotech is above the 50sma but volume picked up as it dropped too, so watch the 50sma on this one.
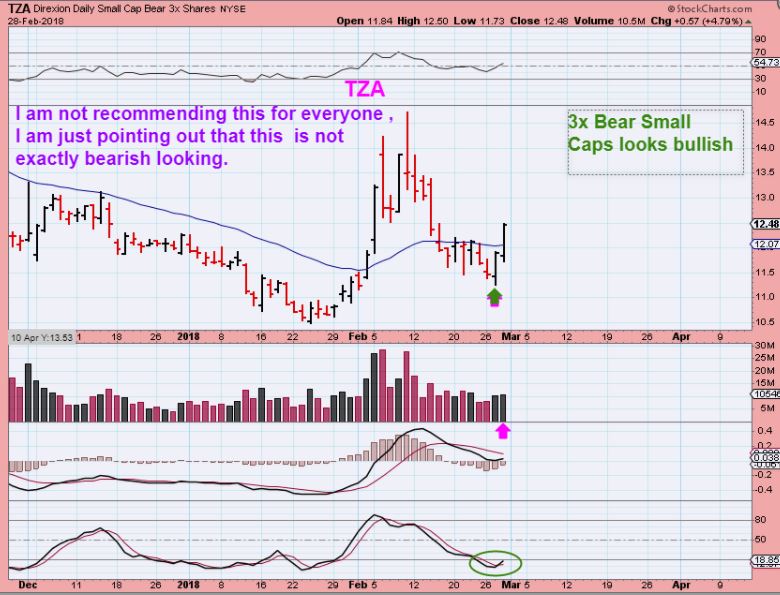
Sidenote: TZA, SQQQ, etc look bullish, and that is bearish for the General Markets. This can change, but the set up does look like follow through is possible ( Not a recommendation necessarily, I dont think that everyone should trade 3x etfs). It could indicate that the Markets will test those lows.
General Markets : I am not shorting the general Markets, but breaking below the 50sma seems a bit unhealthy. I’d be cautious short term.
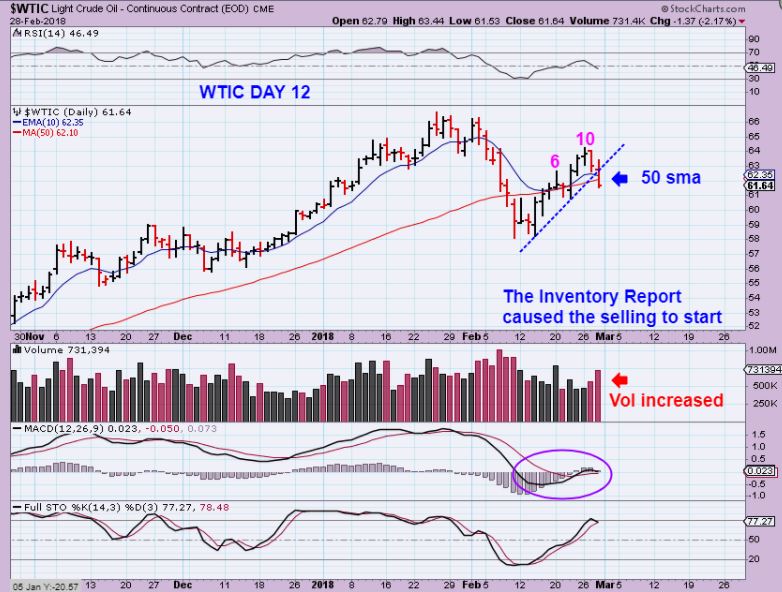
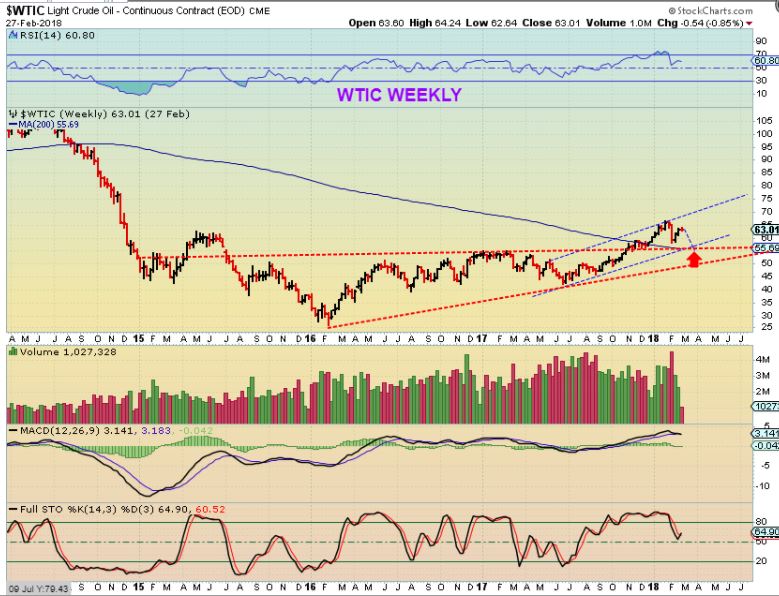
WTIC – Wednesdays inventory report was released and Oil had been climbing in the morning. Suddenly it started to drop at 10:30 Eastern time & I saw volume swelling in USO, UCO, DWT, DRIP, ERY, so I jumped in DWT & ERY for a trade, and ended up holding them overnight. This could drop similar to how it dropped in early February or it could be a shake out, but the COT is bearish.
WTIC WEEKLY- Feb lows were $58. If this drops as the COT seems to imply, Oil could get down to a $55 support or lower. SCO is another option when Oil drops.
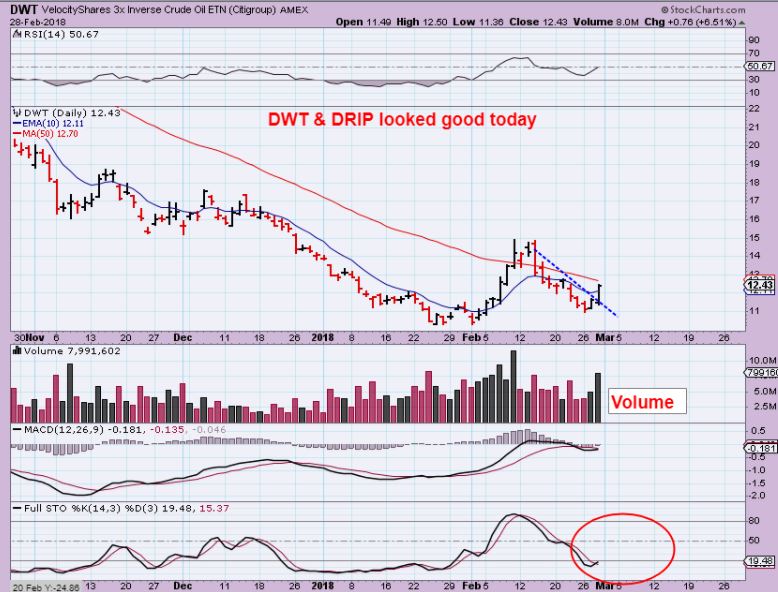
DWT – I bought DWT when it popped on Large volume at 10:30 a.m. & have a dollar cost average of $11.80ish. It can push through that 50sma if Oil is now going to sell down.
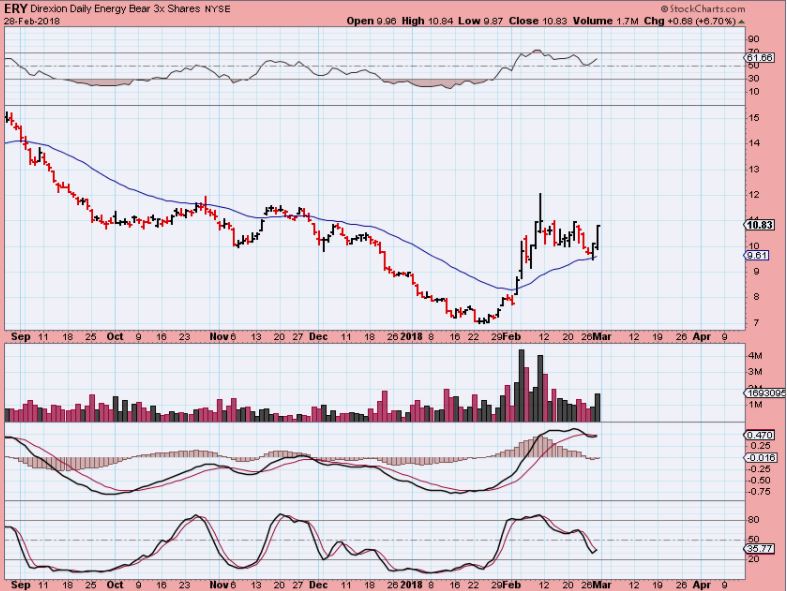
ERY – $7 to $12, and consolidation, and ready to go again? My stop is below $10. We did see a false pop 6 days ago, but this had more volume.
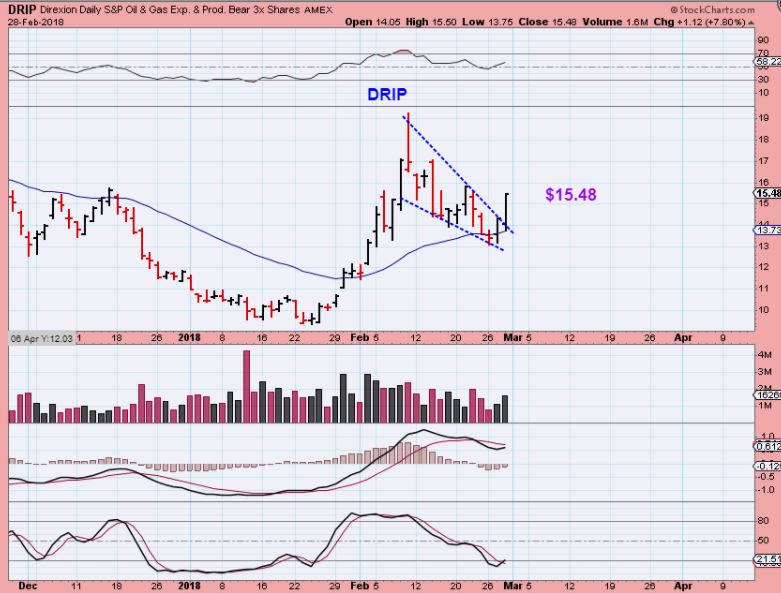
DRIP – This was in yesterdays report, it did break higher too, closing up another $1.12 . See the next chart…
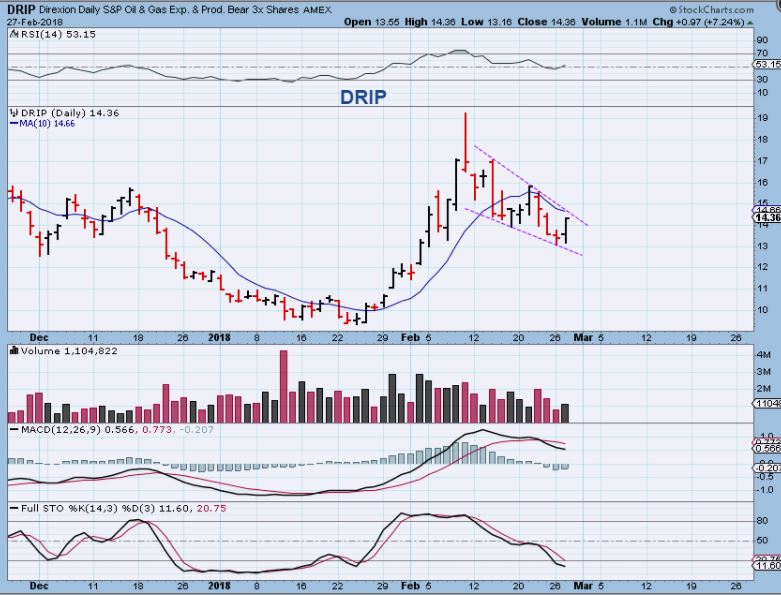
DRIP – Now at $15.48, this can run to the mid twenties if this is the sell off in Energy starting.
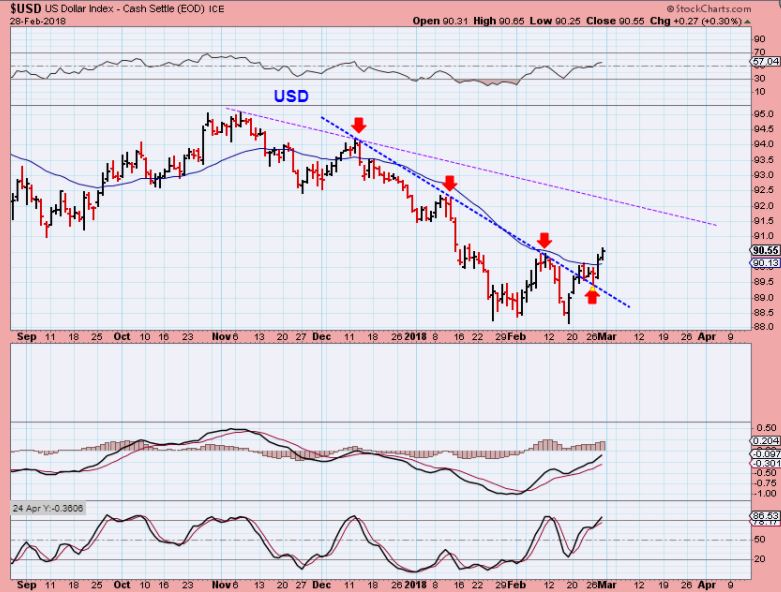
USD – A little more follow through, but not exactly a blast off.
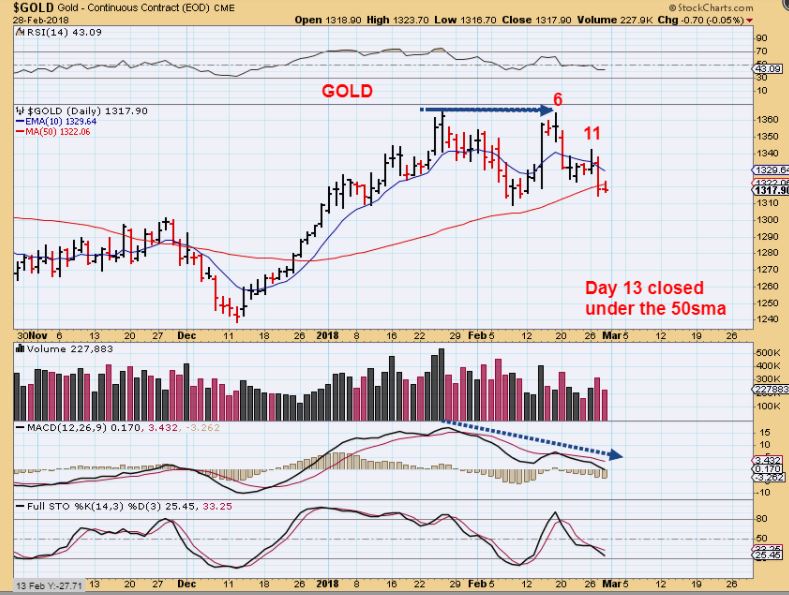
GOLD DAY 13 – Gold dipped down and closed below the 50sma, but this is not exactly a slam down move yet, the volume was even lighter. So is this just going to continue to be choppy or will it sell down? It is a tough call. Either way, this definitely looks like it will be a L.T. daily cycle that will be selling off now or over time.
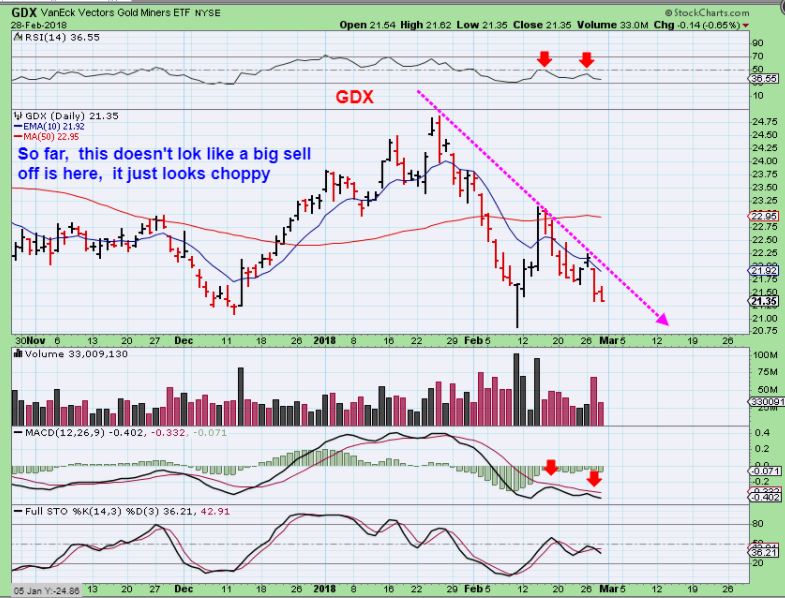
GDX – Same story here. Not a slam down like Miners can do, and volume lightened up a bit. This almost looks like only a re-test of the higher volume lows. I covered DUST in yesterdays report, and bought DUST as a trade 2 days ago & still own it, but I almost sold it because this sell down looked unconvincing so far. I did not recommend it, because for many, Inverse Bearish etfs are very difficult to manage mentally.
So the markets remain choppy and indecisive. You can tell because one day you’re wishing that you went long, and then next you wish you were short. It is not easy and I am not really recommending any action right now, since things can flip so fast day after day. If you are in front of a computer all day, and you have experience in these choppy markets, you can probably find some trade set ups to scalp. It is faster trading & until a trend starts, it can also be choppy and hard to manage. I know many in our comments section do employ that style of day scalping, so that is fine for them. Below I will cover some of the trades that I have mentioned I was in recently, since some indicate that they followed me.
Enjoy your Thursday trading, we’ll see if the general markets can turn higher & just give us a 50sma shake out, or is there more selling in the works?
~ALEX
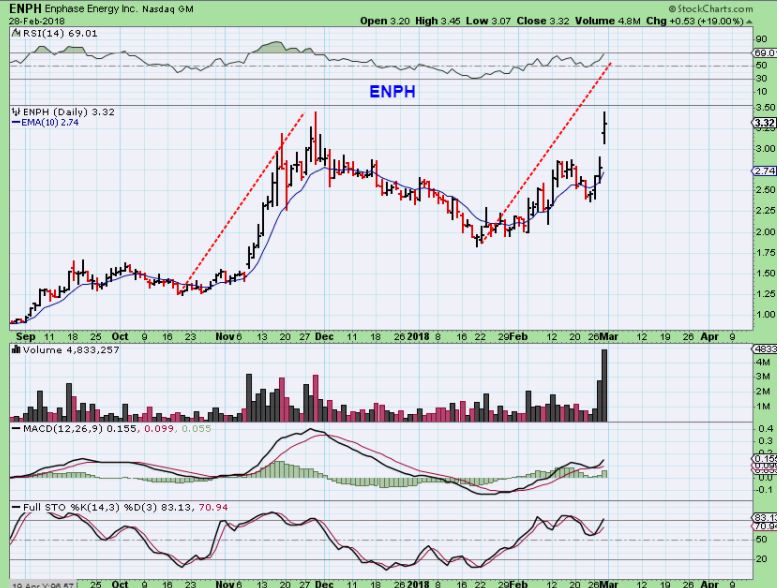
ENPH DAILY – I was heavy in ENPH, because I bought it & added several times, so I sold 1/2 before earnings unfortunately. This is a strong volume follow through post earnings. I added again at a $3.12 pull back when it dropped to $3.07. I saw a small gap around Nov 8th that never filled, so I dont know if this one will either. This did NOT pull back with the markets.
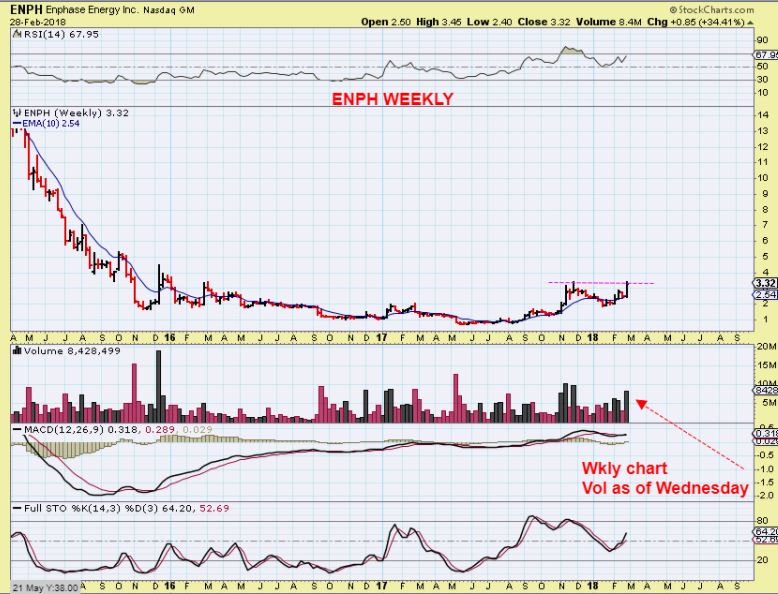
ENPH WEEKLY – And this is why I am still holding it, it did not sell off much when the Markets slammed down.
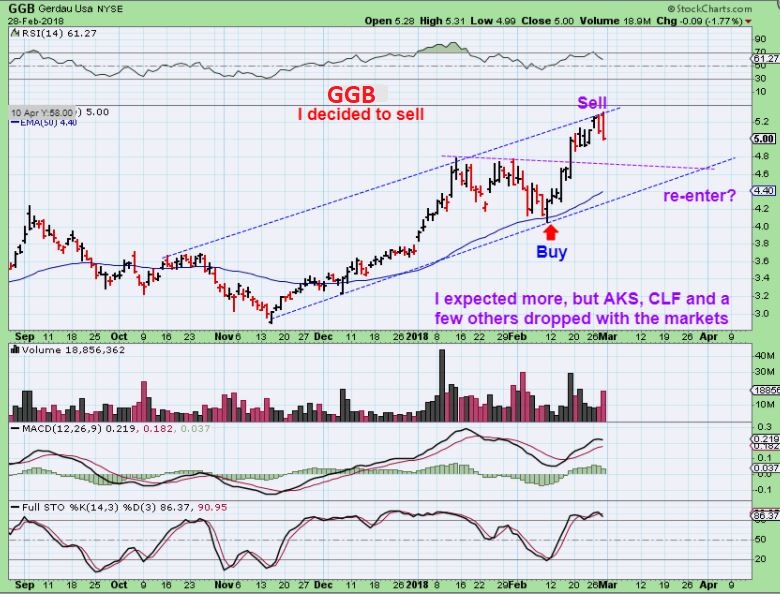
GGB – I Sold GGB, and will look to re-enter. This COULD just climb up along the upper channel, I did expect a higher target than this, but AKS and CLF sold off with the markets yesterday and I took that as a heads up. ‘X’ did not sell off a lot and GGB did not sell off as much either.
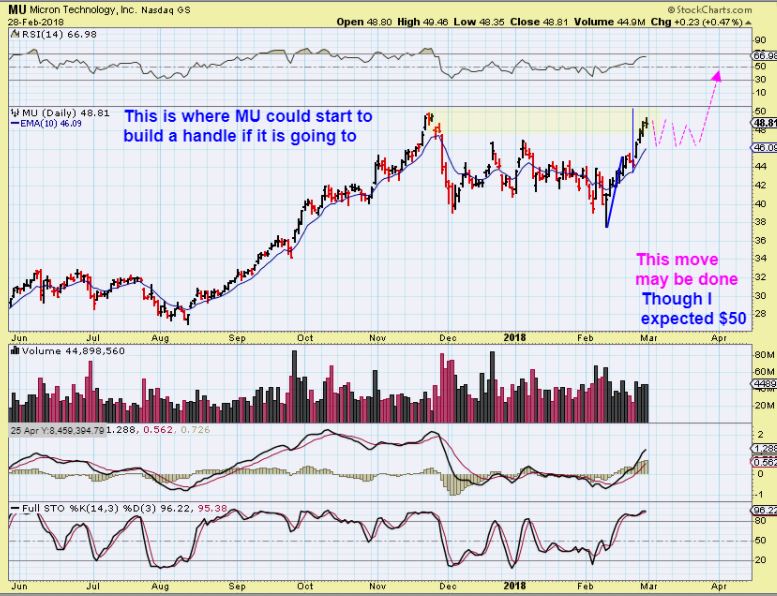
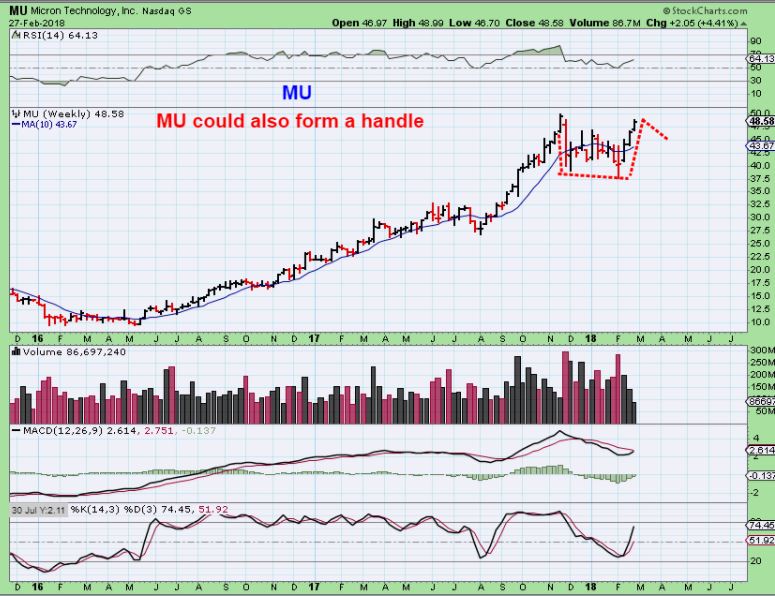
MU– MU ran to about $49.50, this is where it might start to form handle (if it is going to). I sold 1/2. MU was already in a consolidation and also did not sell off in a big way when the Markets did at the end of January.
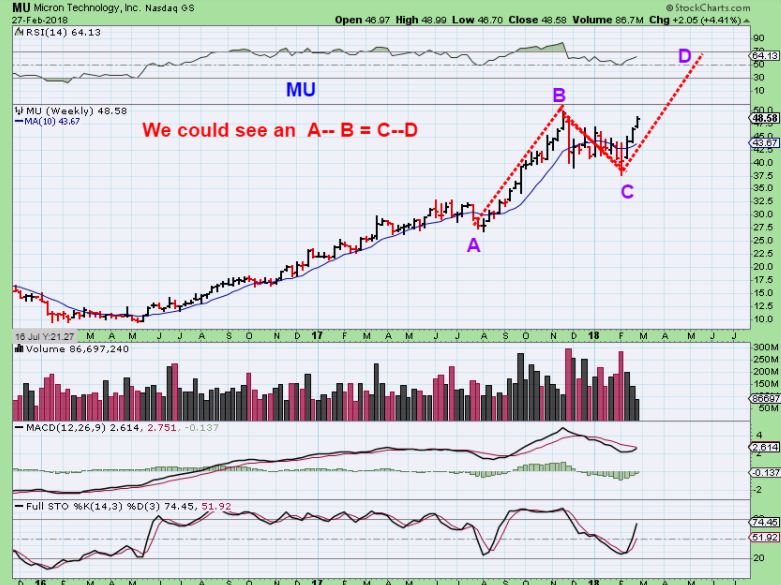
Yesterday I showed a couple of ideas, this one with a handle would include selling…
This one without. It will probably follow the markets though, and if they sell down, we can look to buy this lower.
I HAVE BEEN ASKED ABOUT THE MJ STOCKS- I WILL GIVE MY THOUGHTS
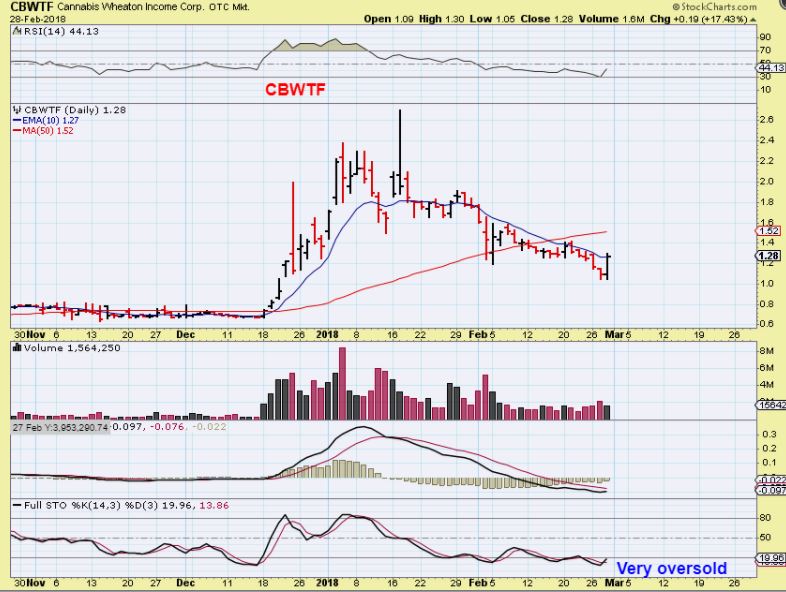
CBWTF – Some of them put in reversals yesterday, and that ALWAYS gets attention. I hear, “Is this where they will run right back to the former highs?” They could, but I will give you a different perspective too. The last reversal Feb 20th tagged the 50sma & 10 EMA& dropped further.
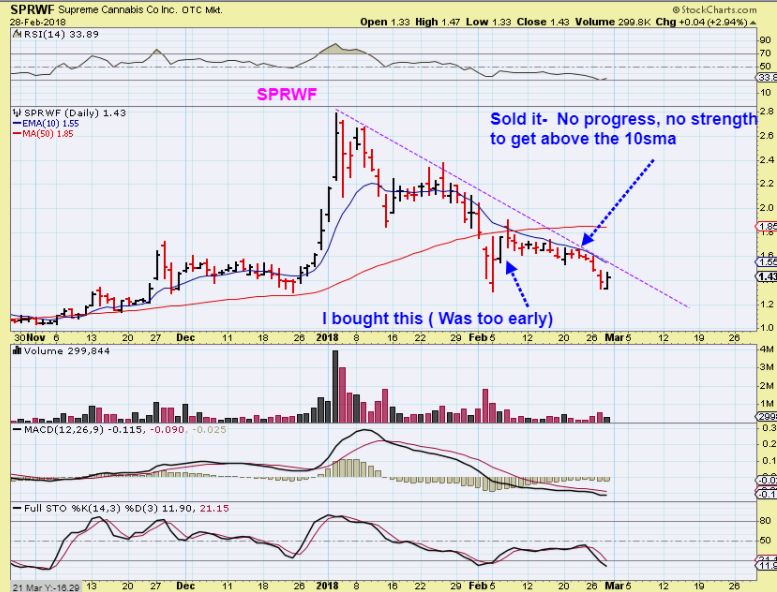
SPRWF – You may recall that I bought this strong looking reversal and I think I added too, but it went sideways , unable to get back above the 10- EMA, so I dumped it. It was not time for the next run. No buyers stepped in for follow through.
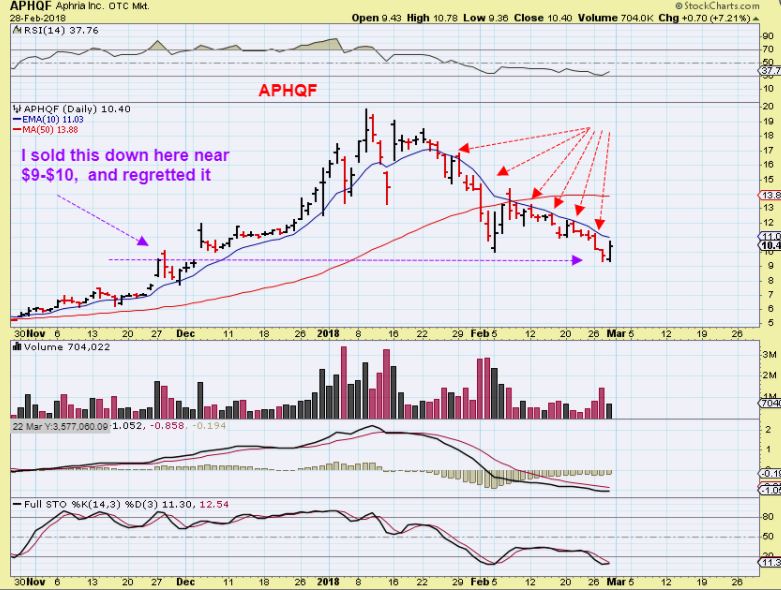
APHQF – I bought this in Oct and sold in November around $10 & then it gapped open and ran to $20! It is back at $10 with a reversal yesterday, is it ready? Again, I am watching the 10EMA ( or 9 sma). Each reversal seems to end there. Look at the chart below , and then let me show you something else that may be happening here…
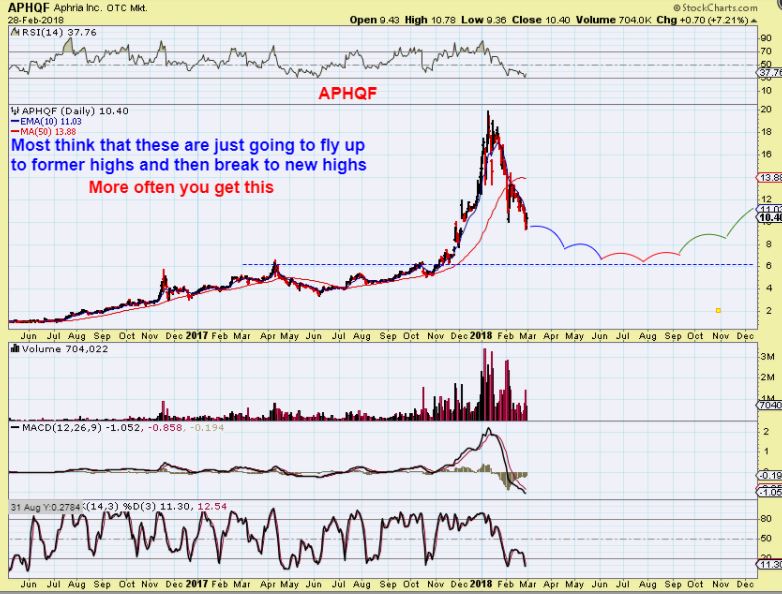
APHQF – If you pull back and look at what many of these did, they look like parabolic exuberant blow off tops. If so, those do not recover immediately. All the buyers were in, those that bought from $12 to $20 likely lost their gains in the sell off by holding on too long. IT went from $12 to $20 to $12 in 1 month. After this fast move, buyers become scarce for a while. IS THAT HAPPENING IN THIS SECTOR? MAYBE.
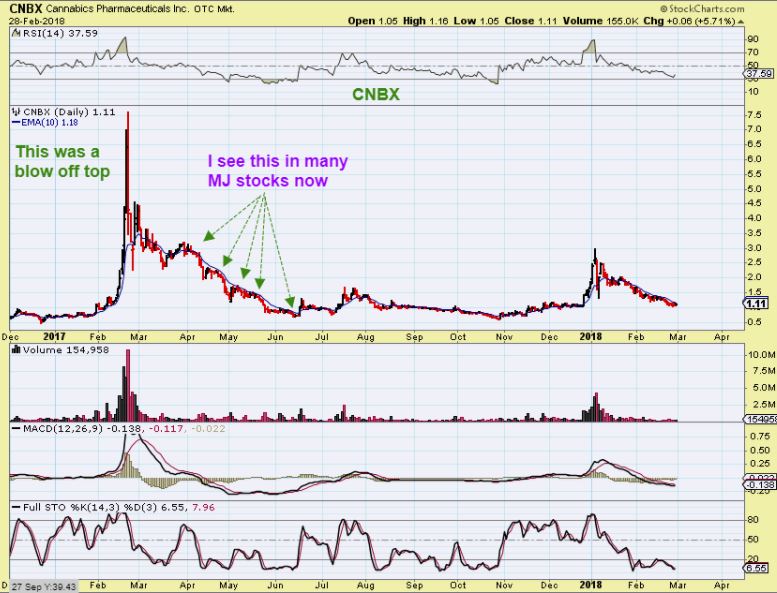
CNBX – So let me show you what I mean. That was a blow off run in Feb 2017 for CNBX. Everytime Buyers stepped in, Sellers stepped up too. They sold the bounce, and getting back above the 10 ema was difficult for months.
CRON -Now this is a different story. JT mentioned this in the comments, I did not have this one on my list. This went from $4 to $12 to $5 quickly and actually shook out at the 50sma and held it as support.
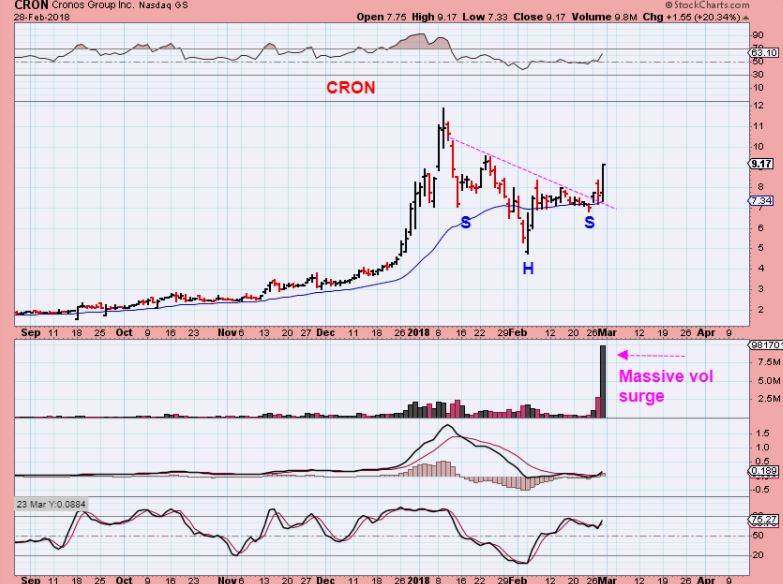
So now we see a break out in this one above (CRON), and some set ups like this may be fine, but I am waiting for a close above the 10 ema and I’d like to see it hold for more than a day. Some MJ stocks may become leaders for the rest.
.
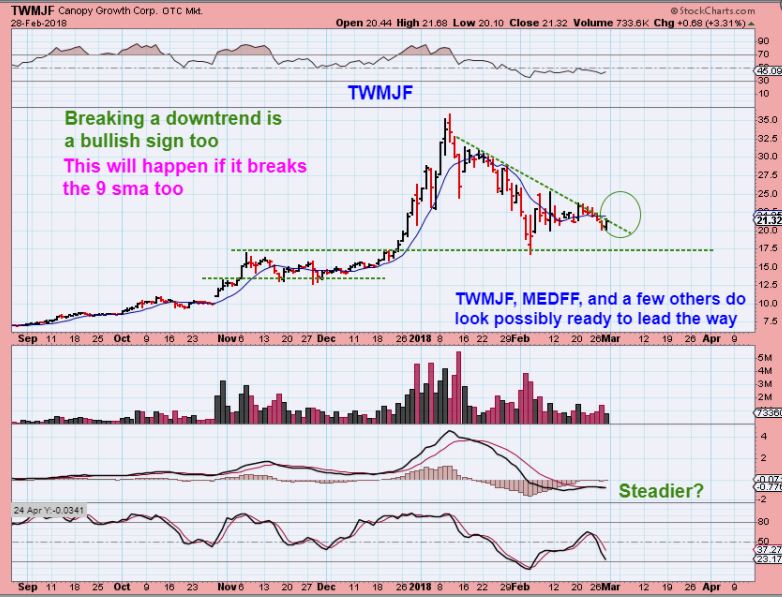
TWMJF – Some do look to be leading the way when it comes to firming up and possibly gaining strength going forward, see the chart below.


Bleak picture………..
It’s actually very good, just not for the ‘Longs’ short term
I might recommend a short if Oil bounces, because it seems like an a-b-c down
I read an article mentioning that a lot of restricted MJ stock is or will be free trading soon.
Hi Ron,
I’m not sure I understand exactly what is meant by restricted and free trading. Is it possible to elaborate? Thanks
it talked about shares from recent PO’s that are typically restricted from trading for a period of time and will now be reaching the date they can start to trade.
Oh, I see, So you mean ones that we have not been trading yet, will become available?
I was thinking you were saying that some that we traded in the past were somehow ‘restricted’ and caused them to under-perform.
Thanks
Yes – I don’t usually read articles like that or trust them, but it did say there were a LOT of these shares that would have a very low initial cost.
I didnt have CRON on my list until JT mentioned it, and I have a long list, so it will get tough to keep track of the good ones if they release a bunch more 🙂
CRON is first Cdn MJ stock with a Nasdaq listing
https://www.theglobeandmail.com/report-on-business/cronos-cracks-the-nasdaq-a-first-for-canadian-cannabis/article38142997/
Gold just broke the Feb lows, so this is a failed daily cycle.
There is a slight chance ( and I will cover the idea in the weekend or next report) that we get an ICL at the next Fed Mtg.
I know that it is short time-wise, December to March would only be a bit over 3 months and it does seem unlikely, but I can picture it.
The regular timing would be closer to 5 or 6 months, and would be May ( there is another Fed mtg in early May).
I have no idea where we are cycle wise with gold
Basically – it just dropped below the Feb lows, so we are now in an intermediate cycle that started at the DEC ICL, and now is destined to decline into the next one over time.
How much time that will take is kind of the big issue.
Choppy markets do not help speed things up, but a crash would
Awesome, looking forward to the report. Finally we are getting some follow through!
CF said it was a failed daily cycle so I sold all my miners and shorted a few more.
Hi Faye
Yes, It is a failed daily cycle in Gold when it breaks prior lows . Gold broke Feb lows. That is a failed daily cycle in Gold.
Miners seemed to be testing the lows, so I also said that I sold my Dust early in the first hour of trading, and posted a chart of the DUST chart finishing a target.
A failed daily cycle does not mean ‘now we drop continually’, they seldom make it that easy, but a failed daily cycle indicates that the trend is now going to be down until an ICL is in place. It does not mean that it will be staright down, there will be bounces in choppy markets
As mentioned in the reports, these are choppy markets
FWIW, I sold MU & SQ at the open, to get out of the General Markets, but ENPH did not really sell off with the late Jan Early Feb market sell off, so I am still in it.
I have been selling chunks of my TQQQ to lighten up, lock in profits and preserve capital. TQQQ and the other indices are bearish on my daily charts, this pullback may last only a few days but I want to keep a good chunk of my gains from buying the Feb 9 bottom rather than taking a draw down. And hopefully, I will buy back in much lower.
Markets recovering – POWELL is speaking or giving live testimony again today ( Now) = Broadcast on CNBC
yeah I see that, I plan to wait until about 12:30 PM ET to see if this bump holds up. Powell talks one day and markets crash, he talks another day and markets rally. Hard to get a read on this. I’m still holding a lot of TQQQ but have raised a lot of cash to buy the dip. In the past, the dips have not been as deep or as long as I expected and I ended up backing back in a little higher This could happen again.
As I expected, the early morning pop in TQQQ reversed and it’s back to a DOWN trend on my 15 min chart. That’s why I try to wait until after 12:30 PM ET (9:30 AM my time) to buy stocks, they typically bottom around that time (but not always). I have been studying the price action on Feb 2 which is similar to where we are right now on this dip, a couple days after price started to roll over. If we follow that pattern, stocks could start selling off hard in the next hour or two. Since I sold some of my TQQQ, I’m now rooting for a deeper drop so I can buy back in lower. No offense to those holding long (I am too).
Wow, I barely finished typing that last post and stocks have broken the LOD and appear to be dropping hard.
Sold my Dust trade at the open, , wanted to grab JNUG for a trade at $12 and missed it .
The General markets are earlyish in their daily cycle, so this dip could be ( Guessing) A 50% drop and would set the next point to draw a trend line out of the lows.
I sold my GGB last night as mentioned in the report.
It is UP 20 cents now, with everything selling off . Sometimes you just never know
AKS up 6% after the drop yesterday . HMMM
Trump Tweet at 4:00 am
Our Steel and Aluminum industries (and many others) have been decimated by decades of unfair trade and bad policy with countries from around the world. We must not let our country, companies and workers be taken advantage of any longer. We want free, fair and SMART TRADE!
I believe AG had bad earnings, but it doesn’t look like it has enough sellers to break the recent lows .
Just talking out loud
SOld all of my dust for a nice trade
now I want to see if the gap fills, and if this is just a “test” of the recent lows for GDX & GDXJ- or will it break down further.
Over time it may break down further, but GDX & GDXJ could bounce here as they test the lows and sellers dry up
This was the DUST TRADE, first target met. Higher targets do exist, as shown in my report Tuesday.
I am wondering if we fill that GAP today with an afternoon bounce in GDX
https://uploads.disquscdn.com/images/a8c41f301e24efcd294cae61277fe3d5a30185d370eca020a73e8aac6dcdcbb2.jpg
As mentioned below earlier, that may have been a 1/2 cycle low, but it is too early to tell. Markets flipped higher quickly as Powell gave testimony that Wage inflation is minimal and Growth is on track.
Again, a reversal so far, but he is still speaking 🙂
QQQ regained the 10sma
DOW & SPX have not and are still under the 50sma
Dust gap filled ( That was fast )
I sold TENX last week for break-even cuz it looked dodgy…
I was right, and it dropped -40%.
today its peaked as high as +150% … now hovering around +110%
so unpredictable
Wow- it is 150% now.
Hi Alex, do you think that the turn around in USD’s strength today might be significant – suggesting that it has hard time clearing the 50MA to the upside. EUR turned up and seems to be ready to resume the climb… bloomberg is full of commentary that the USD ‘has legs’ and might be going up materially. It does not quite look like it. Would you agree? Thank you
I can’t tell at this point, but yes It has failed to hold the 50sma.
These have been very choppy markets, head fakes in each direction.
It will take time to see how this plays out, right now it would probably be a guess
AKS CLF CENX X all on the move again
The volumes on the steel stocks was impressive
Did you saw Gold lower low gdx / gdxj higher high from Feb 8?
Yes I seed that. What does it mean?
Sold the last of my TQQQ to book some very nice profits, avg cost basis was a little over $132. Going to sit in cash for awhile until the dust settles. Stocks look like they may copy and retrace their entire rally from the Feb 9th low. This is certainly NOT what I was expecting when I said I would hold until May, but as Alex says I take it day by day and I will change my long term plan when the charts change. There has been a major bearish change in stocks over the past 3 days. If I were a day trader I could have cashed out much higher like Bay Trader did the other day. My trading plan was to hold longer term and I stuck with my plan until the market conditions changed.
I sold half at 176 and got stopped out the rest at 164 – so 14pts on the first half and 2 pts on the second… I can take it.
Made some gas money on my CY short as well so not too bad… that MMM trade yesterday got me a bit
Making up for some losses from yesterday on MMM –
short CY until the markets bounce.. Lower volatility mover and decent entry I think…
https://uploads.disquscdn.com/images/96f1e3d821ab2ea83b712a06bf2ce3a704ea891c7780797ab80bd0e39413b5bf.png
well Im a day trader at heart, and I wanted to lock gains… so https://uploads.disquscdn.com/images/6d573efc6c3d0b03467f5f9323cfbc330753d10dd87b8bed49eb0a45a06114e0.png
it looks like the new FED chair has spooked the markets and I am wondering how long it will last. On the gold side it looks like at least another 3 months of chop and lower prices, on the GM who knows I don’t know how to count their cycles.
Yes, the FED has become much more of a game-changer for stocks than I had anticipated. That’s why I’ve gone to cash to wait and see what happens for awhile. A lot of stock pundits think that a hawkish FED could create major headwinds for the stock market this year. I did not think the change from Yellen to Powell was that big of a deal, but the markets think otherwise.
Silver, GPL, KL rather nice recovery today. NSRPF holding steady. Everything seems correlated to bonds/dollar
NSRPF looks to have bottomed ahead of all of the rest. It isnt affected by price of Gold lately
NRP had a great day, and
AG missed earnings, sold off and ended as a higher low reversal, bull engulfing.
Some bullish engulfing candles out there too
TWMJF sweet today as it broke the downtrendline on decent volume. Maybe pot stks are finally rebounding:)
FYI … yesterday the P&F Chart for TQQQ was bullish with a price target of $261 but it posted a “high pole warning” yesterday which is one reason why I sold about 1/3rd of my TQQQ yesterday. Now, the P&F Chart has flipped bearish with a price target of $131!
http://scharts.co/2ErgbT6
P&F Charts are not very good short-term trading tools but they are useful for spotting changes in the longer term trend. My charts of TQQQ are also very bearish right now, so that’s why I decided to bail on the rest of my TQQQ to lock in profits rather than riding out a pullback.
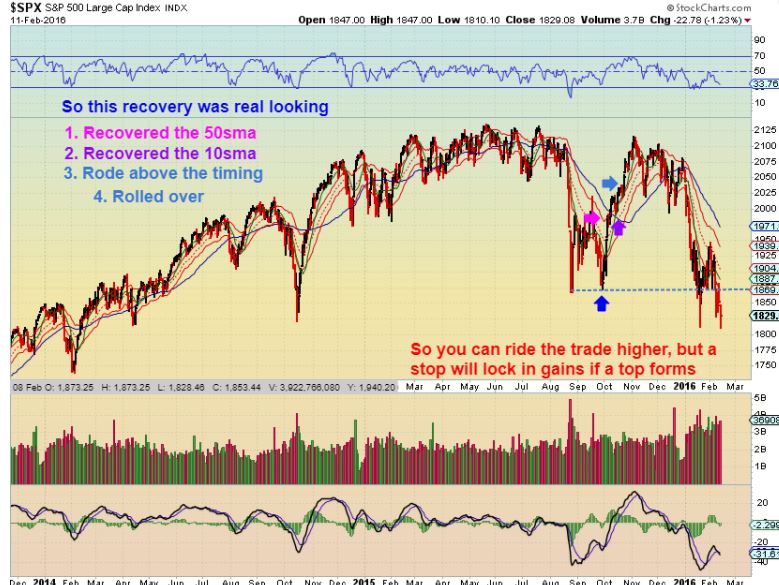
As of now, it looks likes Alex’s warning of a “W” recovery in stocks was spot on. I was in the “V” recovery camp until yesterday and I wanted to see what happened today to make a final decision. Stocks look to be headed DOWN for the short-term.
Good trading to all!
CF – After todays action and getting stopped in most of my positions (some gains some Losses) Im all cash…
Im going to be waiting for your upcoming reports for go time.
One thing Ive mentioned to you before, I dont trade the OTCs or the weed stocks, and as of late, miners have been blahh and hurt me more than a few times…. I really really appreciated you mentioned taking trades on things like CY CREE and MU and discussing others like the QQQs – SOXL etc… and even their inverse brothers.. those are more my cup of tea.
I would greatly appreciate you alerting more things like this in coming reports as the smaller plays can net quite massive % gains (when they act right) but the bigger names even with smaller share lots, net larger dollar gains for me… I know we play %s, but Ive found that going super heavy in the small guys can cause just as much joy/pain as going smaller in these big names and an yield quite similar end of the day cash increases in the accts. I also find that I sleep better when I dont have 5k or 10k shares in some stock over night despite the % gain needed to make the 10 cent move profitable..
I really love that were covering them more and more esp with all of this volatility lately and I hope they keep coming!
Hey BT-
I’m sure that you know this already, but you have to trade what presents itself as a bullish ‘trade set up’.
I dont just throw something up because I like the name – lol.
CY, MU,ENPH, GGB, etc and even DWT, DRIP, ETC were good short term bullish set ups recently, but with markets selling down, I dont expect to be posting trade set ups in Tech in the next report.
I bought a few miners for reversal trades, they look like bullish engulfing, even though Gold sold off and broke Feb lows.
AG came out with an earnings miss, I’m pretty sure, ( Revenues totaled $252.3 million, representing a 9% decrease from 2016. Mine operating earnings of $16.0 million compared to $49.2 million in 2016. ) and yet it dipped, flipped upward, and looks ready to break higher.
It did a bullish engulfing of yesterday, so I bought that for the first time in a long LONG time. Just a trade? maybe, but what miners did today seemed to possibly be that they really slammed down and lead the way down to new lows. Now Gold breaks feb lows, and GDX ^ GDXJ didnt, they flipped green.
I have some interesting thoughts about these crazy choppy set ups, I may mention it in the weekend report.
P.S. Suddenly seems like NO ONE likes Miners anymore
I wasnt saying dont post the stuff that doesnt look bullish!!!! But what i was saying was, I do like that you were posting the bigger boys – and I only expect more of those when they are acting right! I was very pleasantly surprised when you were covering them as trades in the previous reports!
The report for friday has been released