
March 7th – After The Storms
The markets have been choppy lately, and early February was really a bit stormy, but after the market storms clear away, opportunities often present themselves in the manner of trade set ups. We have been taking advantage of many of those lately.
I guess that we can’t really call yesterdays Gap down a storm of its own. Yesterday I pointed out that this is where the markets were set to open ( Purple square). Would they continue to sell off, or would they be bought back up?
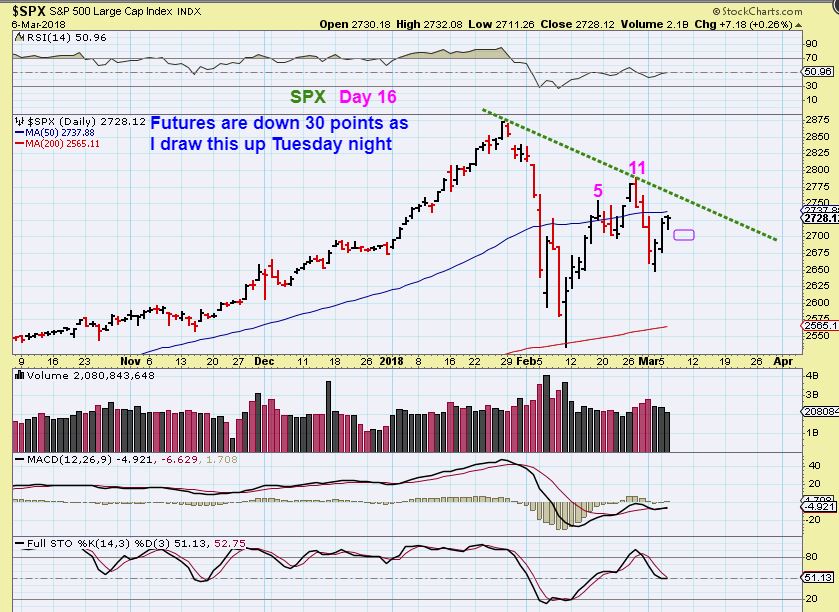
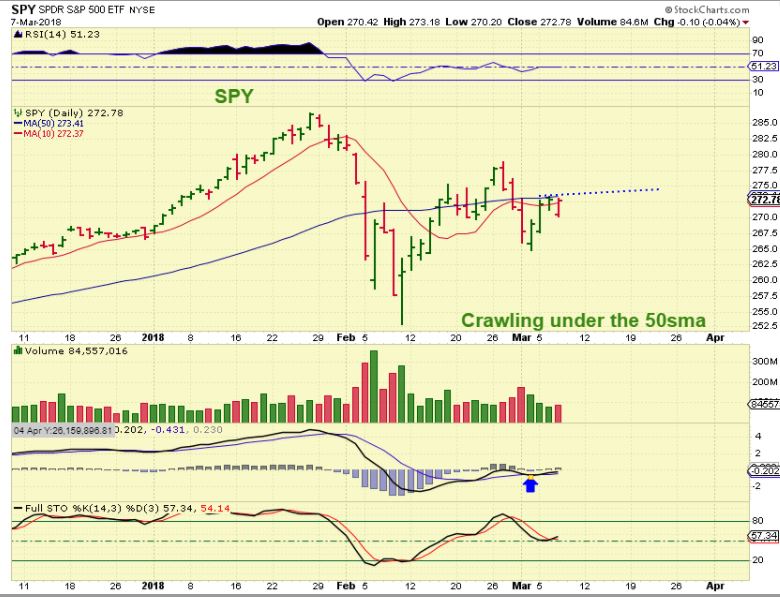
SPX – You can see that the gap open did not sell off further, but steadily climbed through out the day. Adding in this area with a stop below March lows is reasonable. The SPX looks to be crawling under the 50sma, and this is common, but …
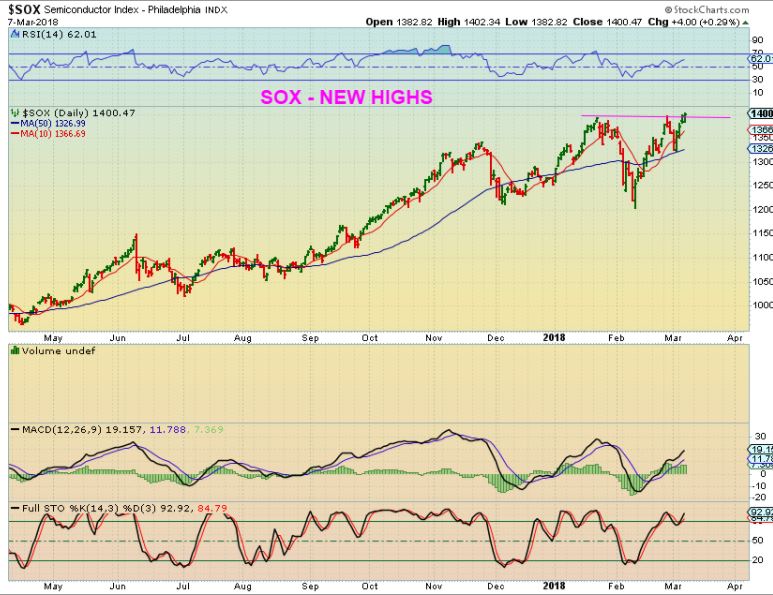
SOX – What Gap down? I have been pointing out the Semiconductors as a stronger sector, and it barely gapped down Wednesday really. The Sox closed at new highs and many semiconductor stocks have too. This is why we are seeing success in the set ups of MU, CREE, CY, and others. I will discuss these at the end of the report.
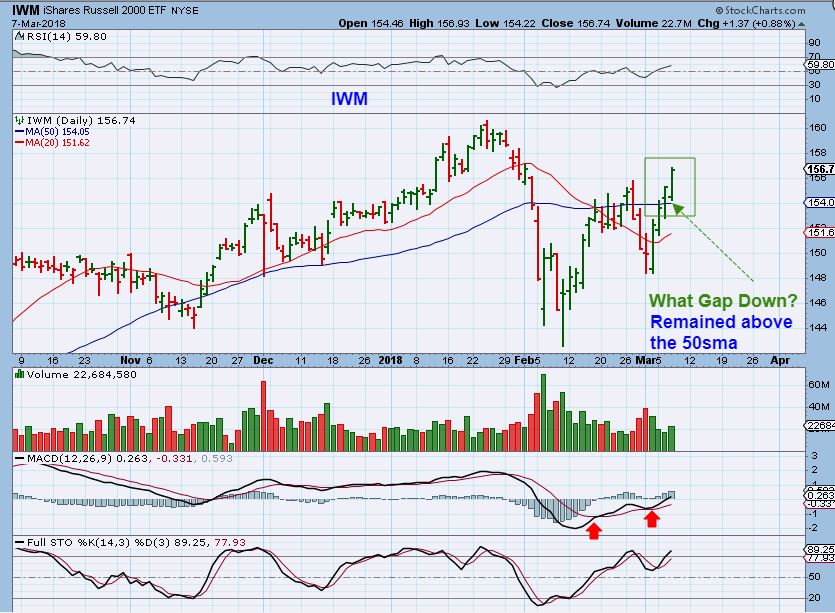
IWM – The RUT or IWM hardly gapped down at the open too, and that is why some of the small cap stock set ups are also remaining bullish. We will look at a few trades at the end of the report. This remains a buy.
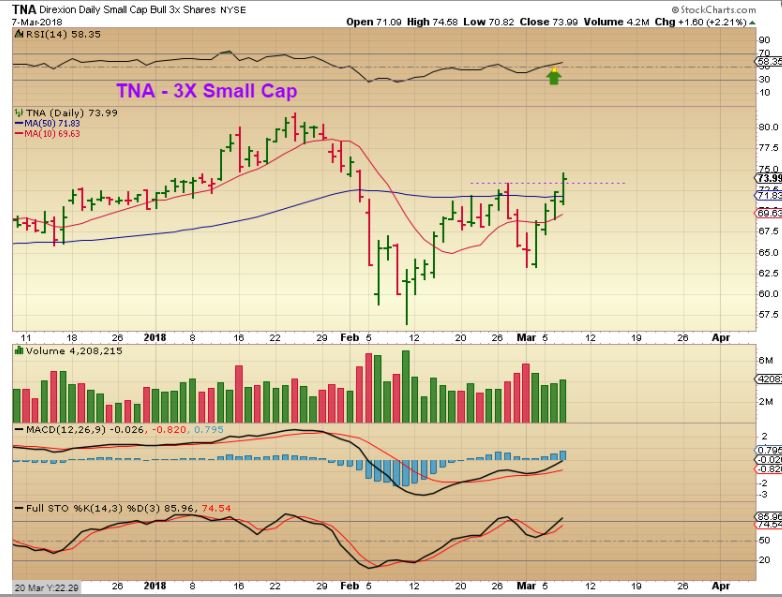
TNA – The RUT or IWM remained bullish, and TNA is a 3x Small Cap Bull leveraged play for that sector. This is a buy.
WTIC – Oils inventory report came out and nothing happened. I was looking to enter DWT, but Oil started slowly rising. Suddenly Oil started to drop and sold off as seen here, now rejected at the 50sma. Read the chart about downside potential. When I saw that…
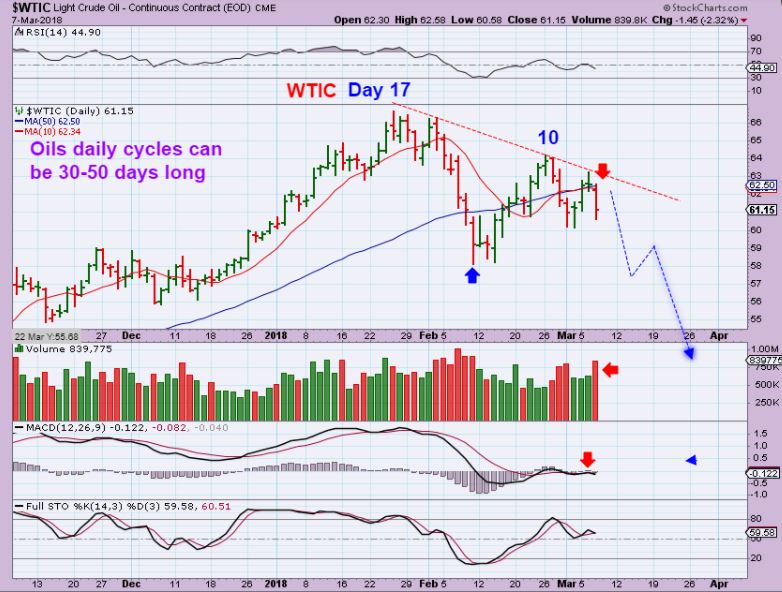
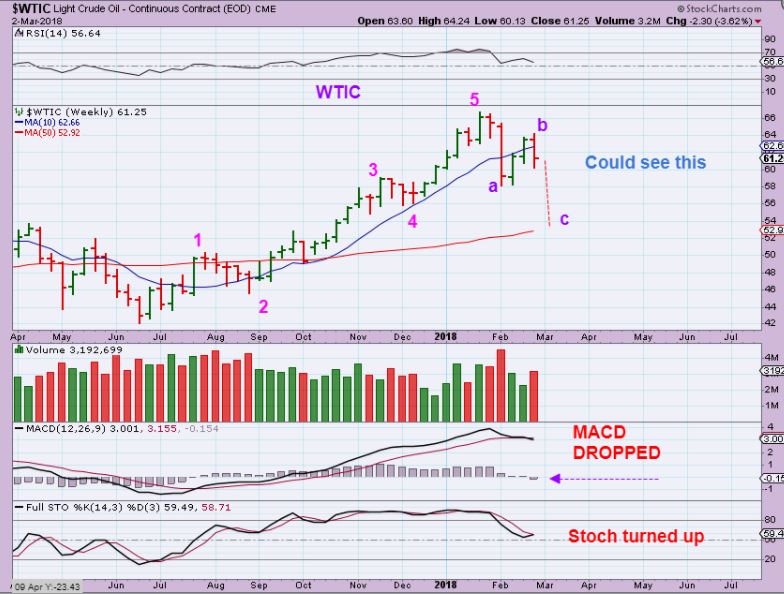
From the weekend report, this would move Oil to around $52- $54ish ( unless we just get a lot of sideways chop).
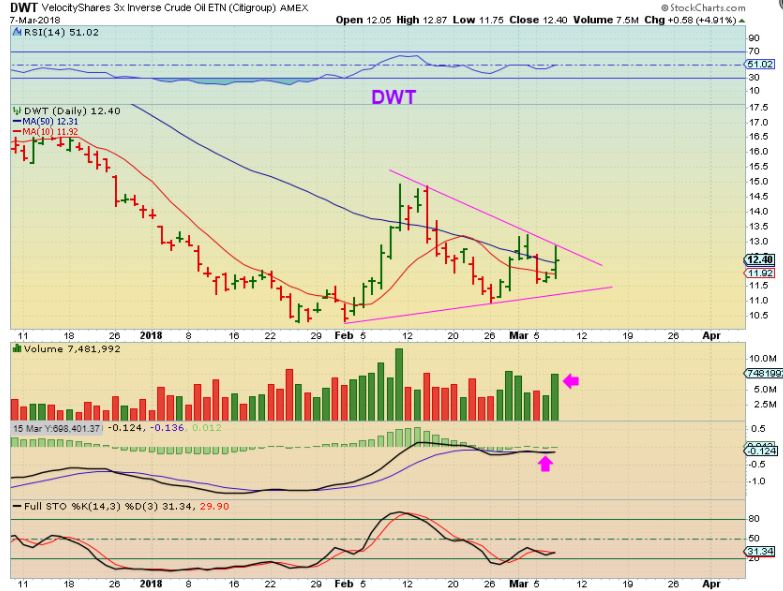
DWT – So when I saw that Oil started to sell down, I did enter DWT, and I am expecting a break out here. This had a surge of volume and remains oversold. Oils cycles can be very long, I am HOPING that this gets to $20. The choppiness in every sector has been difficult.
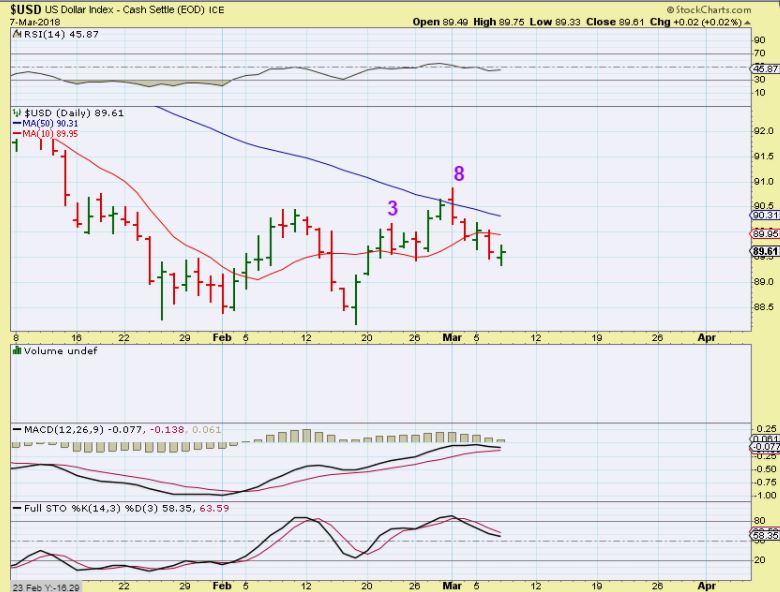
USD – The USD did not change very much.
I mentioned in yesterdays report that I was asked “why didn’t you send out an alert with Gold up $12?”. I basically said, ” A big 1 day Pop alone doesn’t really change anything, this remains Choppy.”
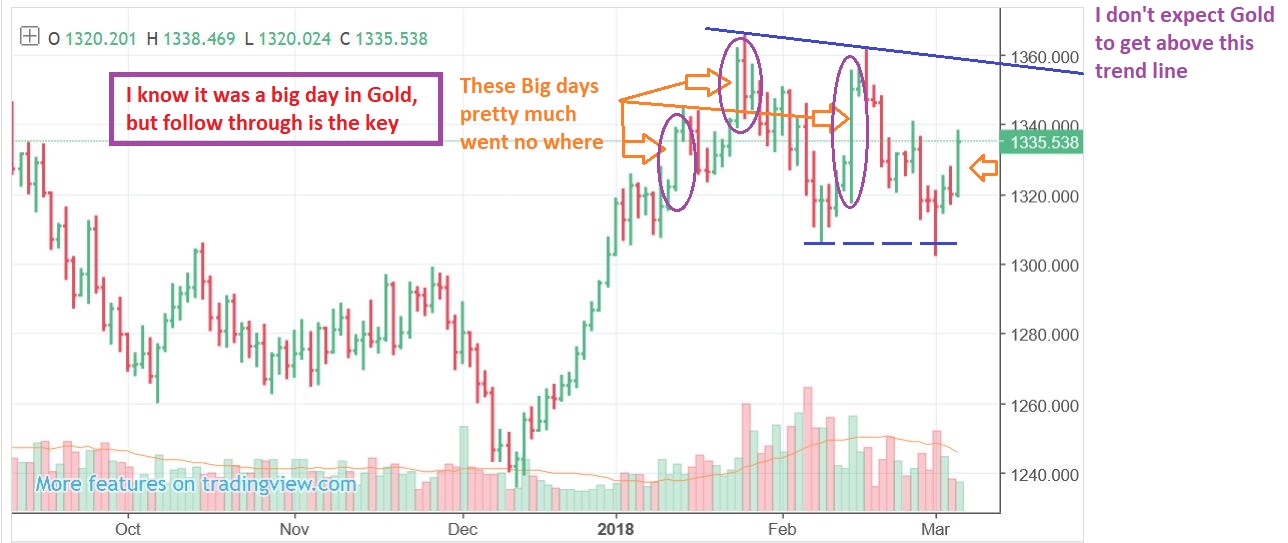
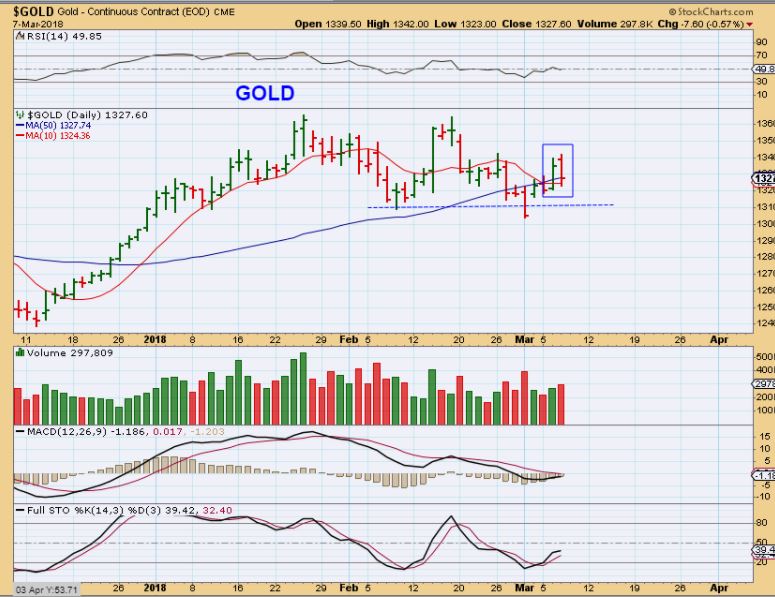
GOLD – And it promptly gave it back on Wednesday. This sector is still choppy.
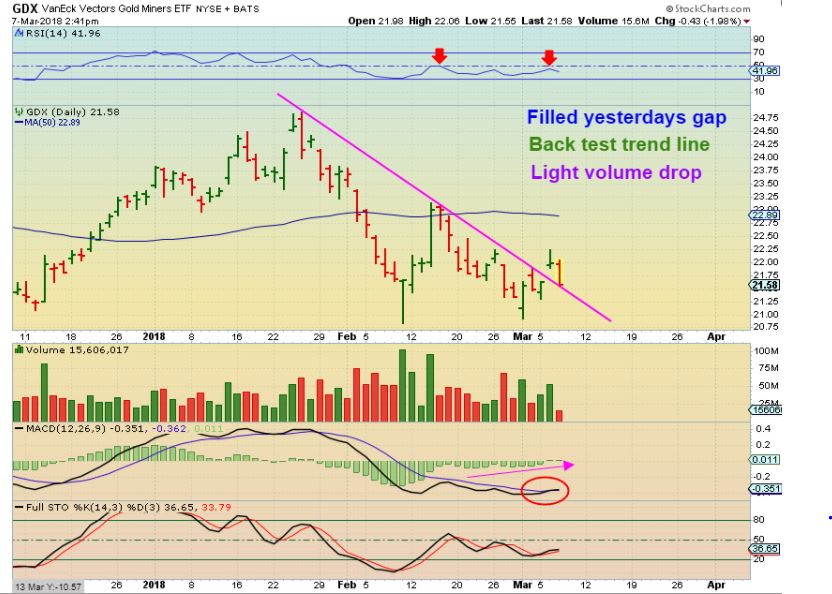
MINERS WERE INTERESTING. So far we have
1. The shake out lows in early Feb.
2. A blast higher and then a drop to a higher low.
3. This week saw a break out above the trend line and that has now done a gap fill and a back test.
GDX -Wednesdays gap fill. NORMALLY, this is a buy with a tight stop. I own some Miners ( AG, HL, AKG at this point), and if this reverses higher, I MIGHT take a trade from here. It is choppy, it has been a real pain in the neck if you dont just lock in gains on the first sign up success.
Edit: I have no power, cable, or Internet, I am trying to edit this on my cell phone . We got over a foot of snow and I don’t expect to have power soon. I will be away for the day helping my parents and if they have internet I will try to pop in later in the comments, but I have to release this report as is without being able to edit it much. I am using my phone to write this final part of the report, but it is tedious. .. especially when people keep calling me!!😁
I purposely stayed up later and tried to complete this report , so I will just release it as is . Enjoy the report, Thursday’s Trading, and we should get upside follow-through in semiconductors and the general markets. TNA does look like it is just starting to break higher, and even though it is a 3 x ETF , I do not think it or TQQQ or SOXL, etc is that much of a high risk . If coil drops DWT should do well . I Use looser stops on 3xetfs.. I’m hoping that some of our trades below see some follow through too.
~ALEX
CREE – STARE AT THIS CHART SET UP. THIS was a strong buy posted by me.
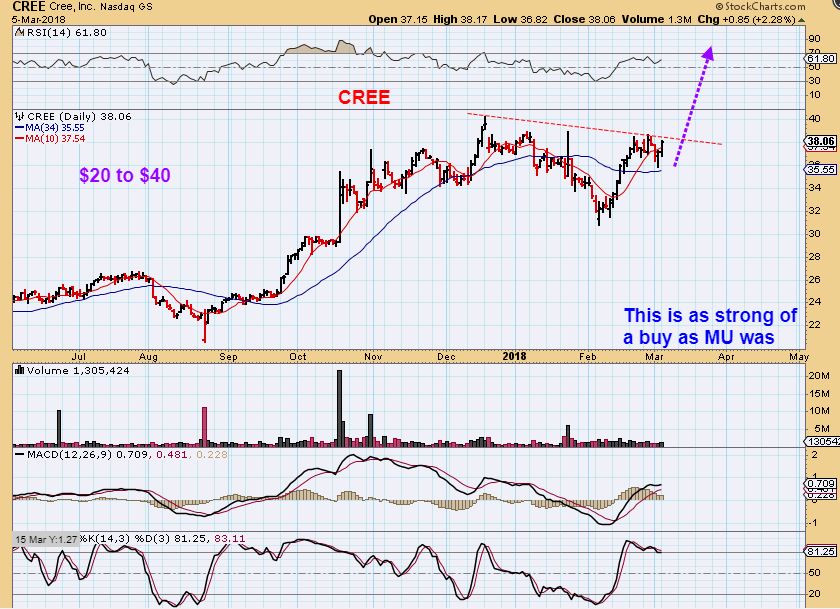
DO you see how similar this set up is?
NUE – I posted this in the comments section as what I consider a ‘strong buy’. It closed slightly above the red line.
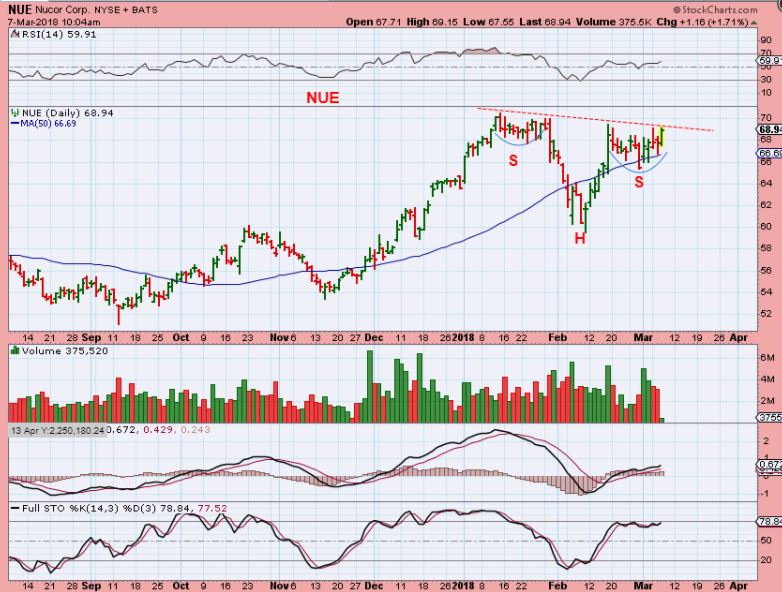
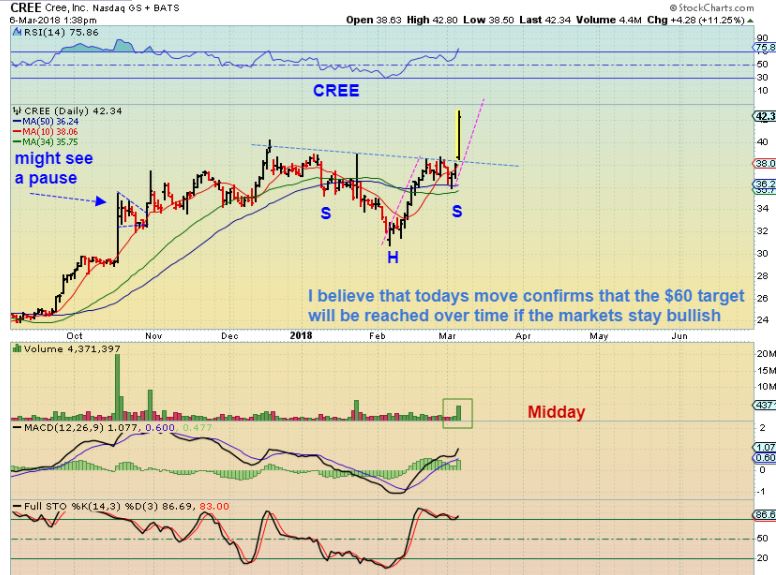
This was CREE the following day.👍
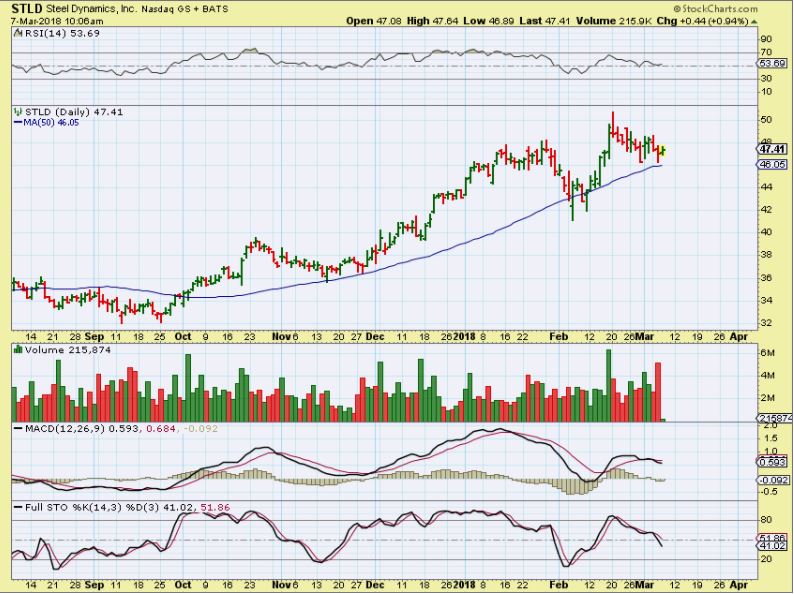
STLD – NUE and STLD are steel stocks and they look quite bullish. This is a buy with a stop a little under the 50sma. It may continue to go sideways, if you want to avoid being ‘stuck’ in a stock still consolidating, Wait for a break of the 3 week downtrend.
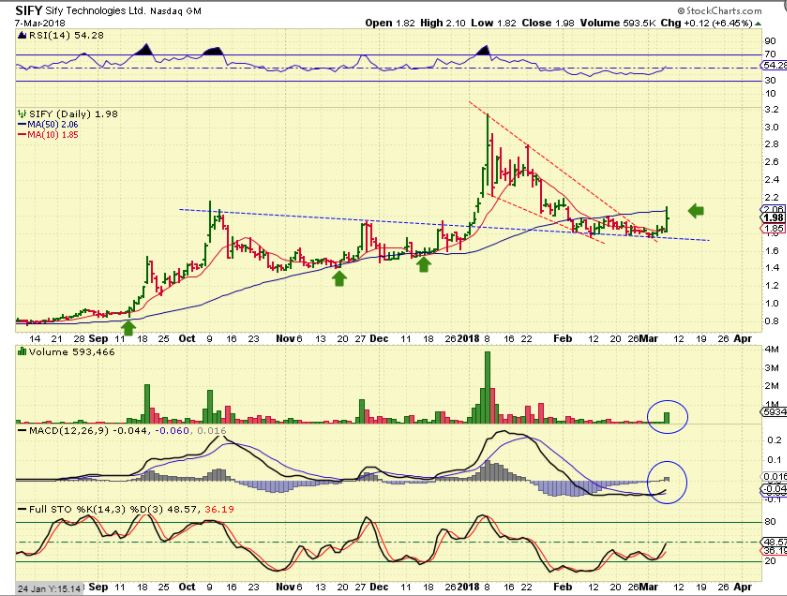
SIFY – I have traded this on the sidefor tbe past year off & on , and I have honestly had trouble locking in good gains (as a trader). Pop & Drop & Pop & Drop, it got choppy and tossed me aside a couple of times. 🙂 It IS in a bull run though, notice that it has tripled from September to January.
Now it seems to have consolidated those gains and looks like it may NOW be ready to go higher again. It may break above the 50sma today.
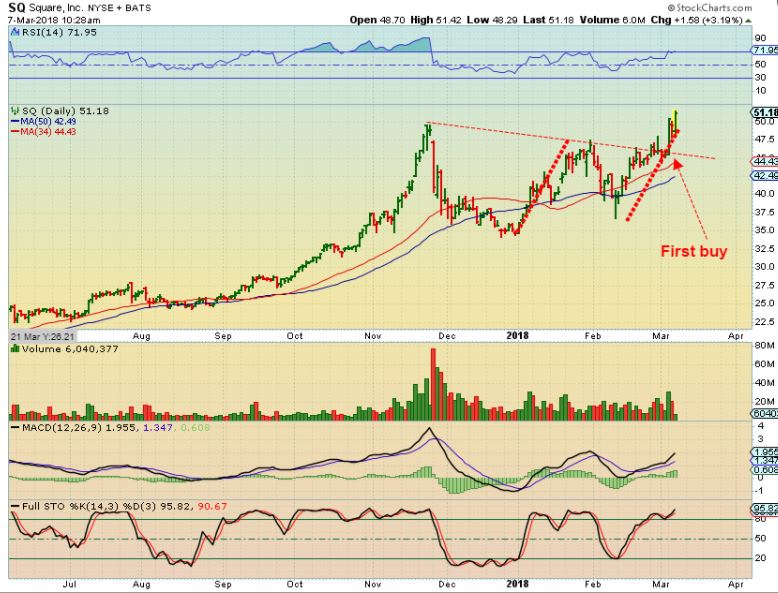
SQ – This should prove to be a bullish break out from a multi-month consolidation, but it also seems to have put in a measured move. It CAN extend from here & just keep running, or build a handle, but the weekly chart is a longer term buy & hold.
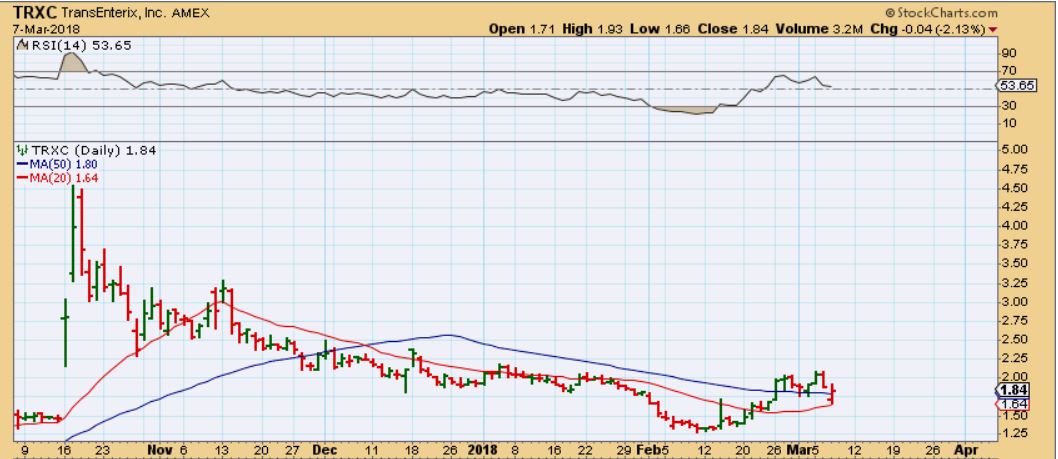
TRXC – I bought this in the $1.7o’s & posted it as a buy on the 50sma. I then sold it around $2 after posting this follow up chart in the report. Tuesday.
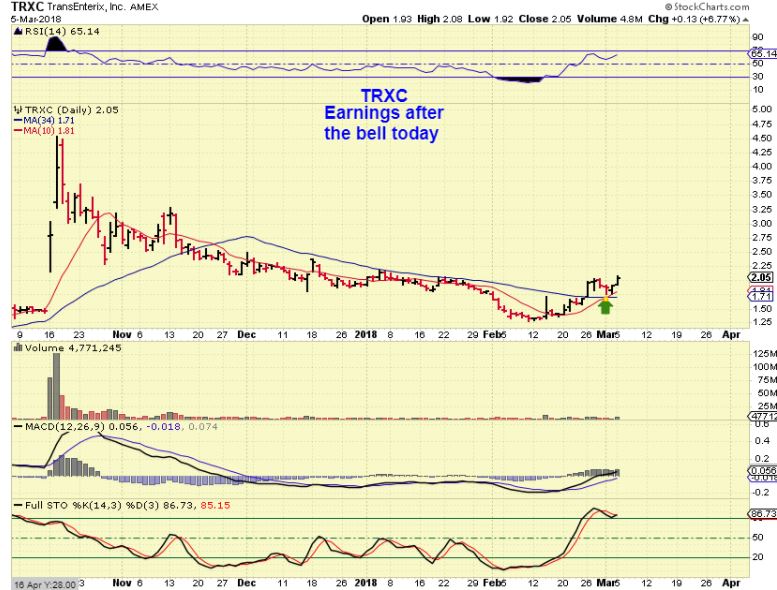
Earnings came out, it gapped down & reversed and I re-entered it after it reversed off of the 20sma, and I posted this in the comments.
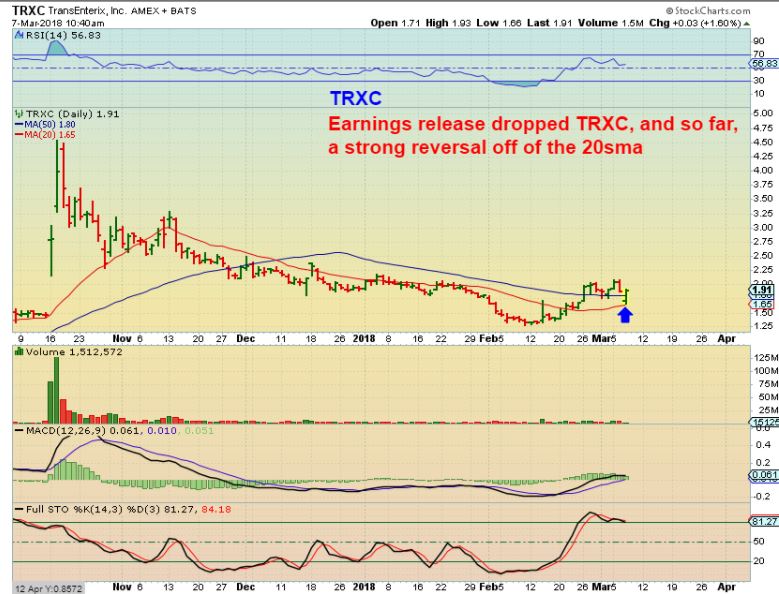
TRXC – It did drop a bit into the close, but it still looks like a bullish reversal holding the 50sma so far. I will sell if it drops further, but I may add if it moves higher. I like their story.
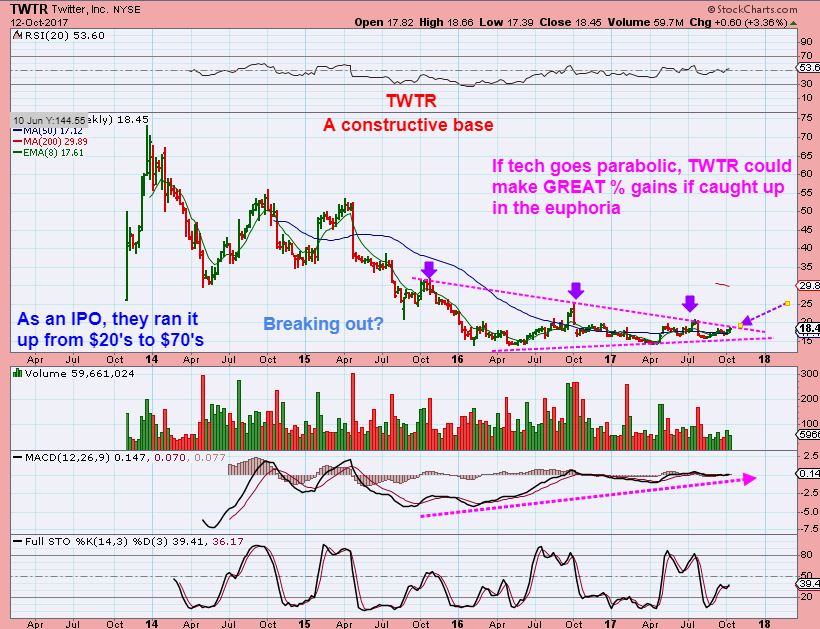
TWTR – I was pushing this as a longer term BUY & HOLD last summer and last autumn. This is an example of why. It was a buy breaking out from this base at $17 & $18. I said that we could see this at $100 in the future, similar to what FACEBOOK did.
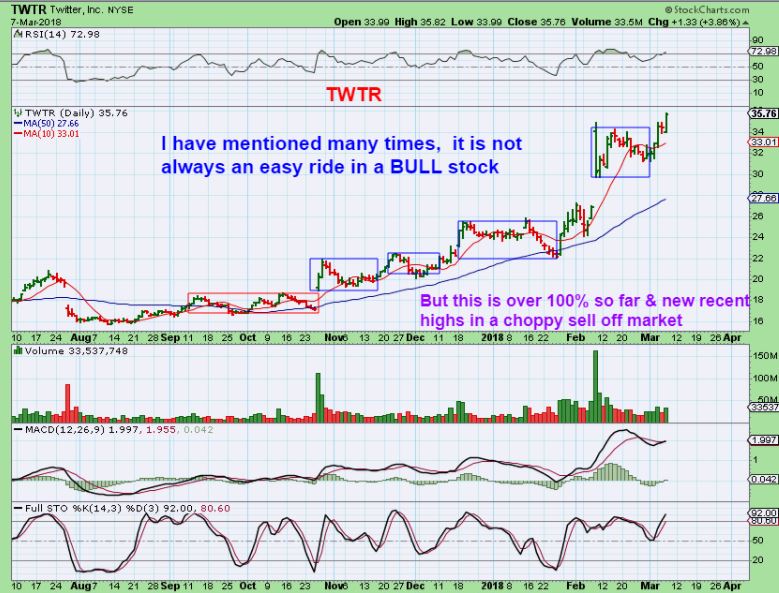
TWTR – So far we have a double and it is at new highs with the markets acting all choppy and sideways. I also have mentioned many times, it is NOT as easy at it looks to buy & hold in a Bull Run. Only in hindsight. Read the chart.
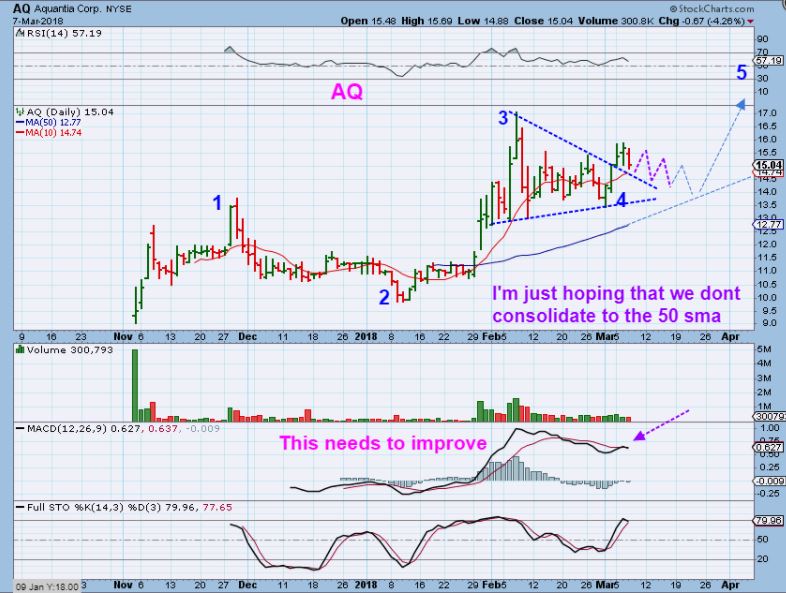
I mentioned the above again because of MU, CREE, CY, AQ, SQ, etc etc . They may be longer term BUY & HOLD too, now breaking out from a recent consolidation.
.
NOTE: Yes, I am still holding AQ and VUZI, but they haven’t taken off higher like MU, CREE, CY. Should I give up? My theory on that is that the SOX or SEMIs are leading, they are already pushing on new highs. The SPX, IWM, DJIA, etc are just getting back above thier 50sma, but I do believe that they will break higher and play catch up. If this is true, These stocks should then follow as they break out of their consolidations. Let’s look at the set up.
AQ #1 – I was expecting a break & run now, and I bought this near the 4. A run to ‘5’ is still expected, but…
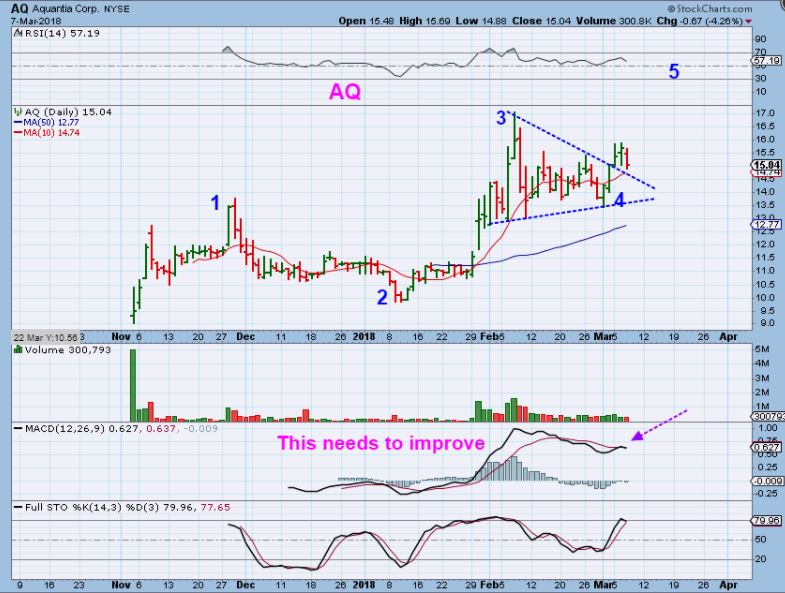
AQ #2 – I cannot guarantee that we wont continue to chop sideways. I do think that with the RUT breaking higher, and SPX about to break above the 50sma, the market can pull these higher then too.
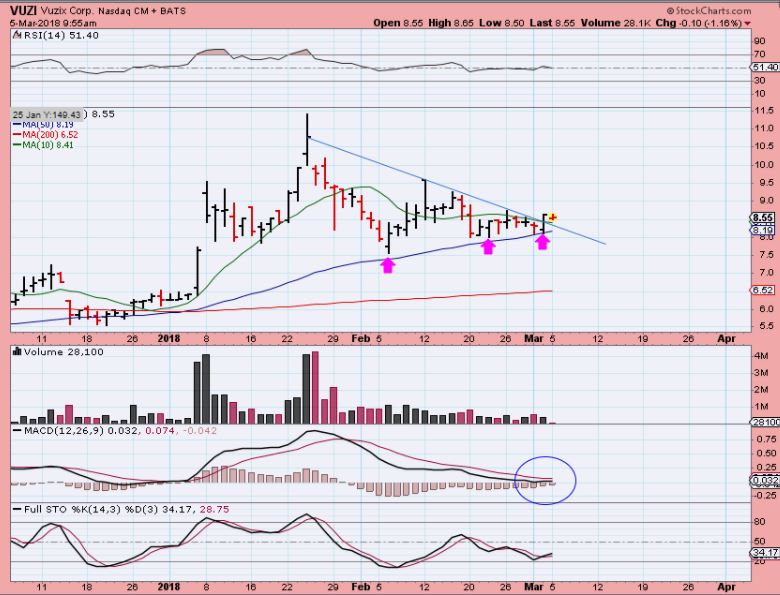
VUZI – This was my chart for VUZI March 5th, a buy above the 50sma.
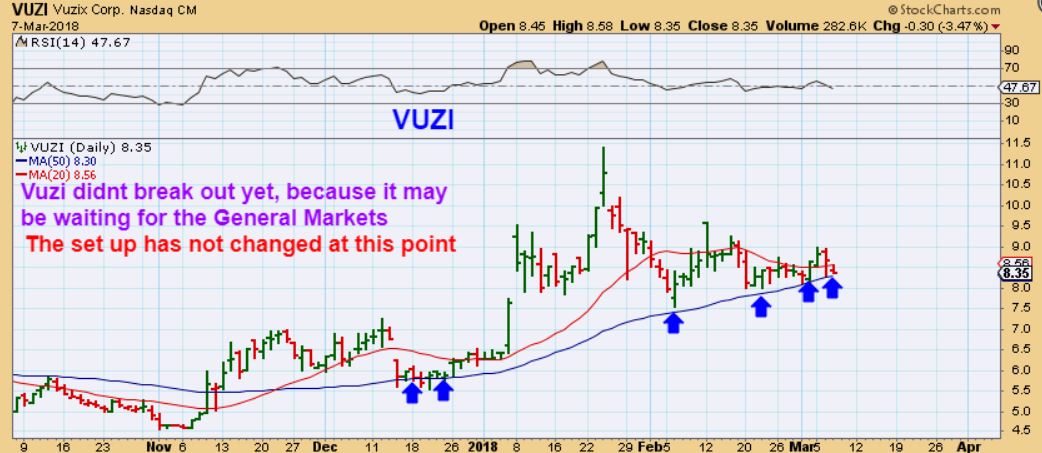
VUZI – This is still above the 50sma, and it may still run with the general markets. I am hoping that we dont get a ‘shake out’.
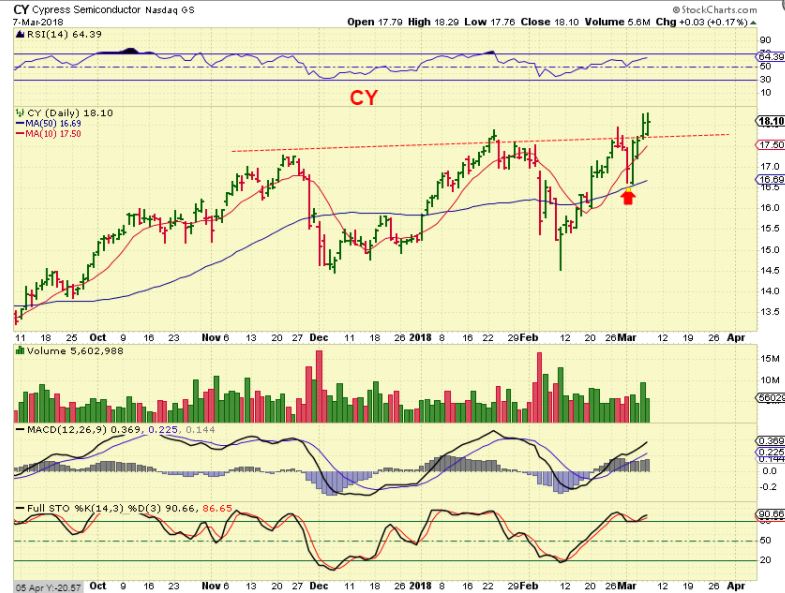
CY – Recommended CY and it is another SEMI breaking to new highs, while the General Markets chop around. The semis, Tech, and Small Caps have been a great place to be since Feb lows.
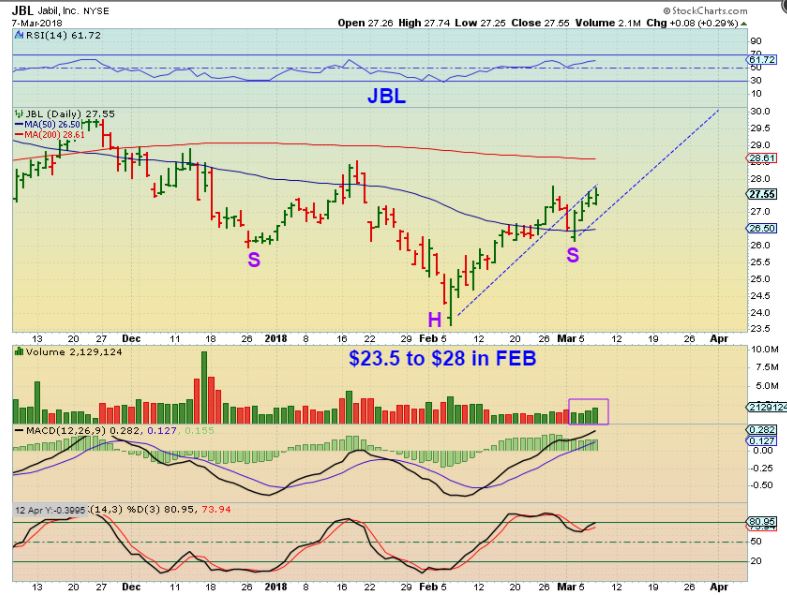
JBL – I haven’t traded Jabil in a long time, but I found an old list that had with tech stocks like NTAP, CIEN, JDSU, SUNW, JBL, etc as old favorites ( JDSU & SUNW are gone now). JBL looks set up to run also, and the gains out of the lows recently were good ( 20%)
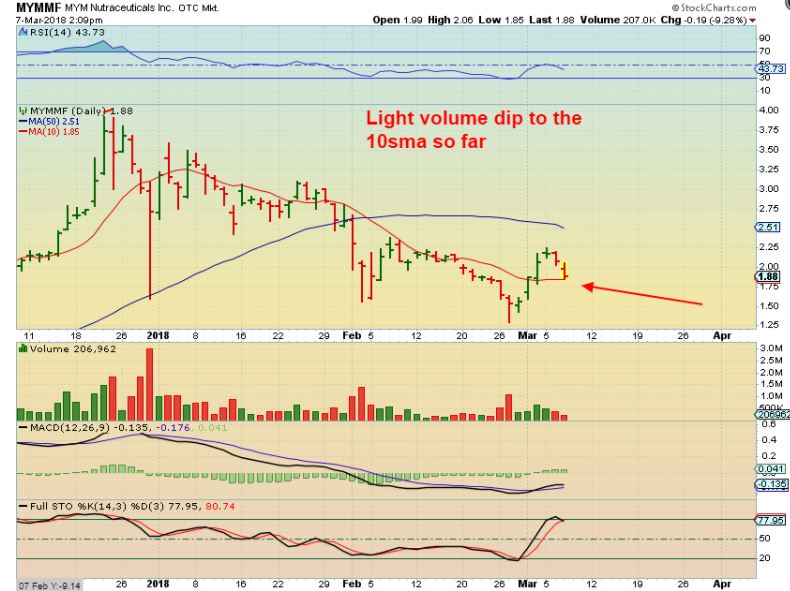
MYMMF – I posted this in the comments too, as a reminder that these move in a big way. Great on the way up, but the dips get big too. Notice that the 4 day run last week was 80% gains! So the pull back now is normal so far. These stocks are not for everyone, they are like 3xetfs.


Good morning ALEX…. Thanks for your thoughts.
Do you have hydro back, and internet is working?
See you later.
Alex am I correct that we should now be on day 18 of this cycle? IWM and SOXX really seem to be confirming this. If I am correct, can you make a questimate as to how many total days to the peak? I think you mentioned that these cycles are around 40 days total now, so are you seeing anything in your crystal ball that warrants caution or is it just a full steam ahead time?
FNV threatening to make new correction lows.
I have been watching and waiting for EDIT, NTLA, and CRSP to pull back. Today’s burst higher might be a top, at least in NTLA. These are biotech companies doing something with CRISPR, highly speculative but trending bullishly.
CRSP = earnings today
Posted about NTLA last week, bought the dip last week to high 26.xx area. Hope someone else was able to get Some. No, didn’t go up 400%, but it pays for 6 months of CF!
NTLA does look like topping candle, but we’re only 40 min into the session. If end of day daily looks like that will certainly tighten stop .
Tightening stop now, this was a huge move last 2 days.
Trimmed 1/2 LABU at $104. Holding 1/2. Selling 1/2 NTLA on the gap open. Trailing the rest.
Added BB at 12.60 half size.
AQ sweet. Nice analysis, CF. Sometimes these IPOs trade in their own world and are not exactly lock step with their sector, thus the reason why I have been patient with AQ.
Does anyone recall what target CF had for AQ? I tried to search back but couldn’t find it. Thanks:)
target looks like 17 retest.. then 19.. support 14.90 IMO ..
AB=CD puts it over $20.
Thanks Bill and Ron. I will tuck some aside. Think it could end up as a surprise sleeper stock due to NVDA partnership.
What’s that about, do you have an article on that?
Here: https://investors.aquantia.com/news/2018/01-29-2018-140541362
ZSAN doing its thing again today.. great trading stock !
long GBTC yesterday at the 50 fib PB under 15… but needs thru 16.30 with vol today …
A little BO on the 5 min. with QQQ
https://www.tradingview.com/x/CLASH2gA/
Added KEM starter 18.55
nice BO PI
out rest ZSAN on spike.. +35%.. traders love these low floaters.. that said could go to 22’s…lol
In hindsight, the solar panel tariffs were a sell the news event for SPWR. The same might be happening for CLF
Yeah, ugly day on CLF. Sad face. 🙁
ZSAN BO micro bull flag… almost reached 22.. amazing
Some of you may already know about this, but I just learned of a retail trader sentiment indicator produced by TD Ameritrade called “Investor Movement Index (IMX)” :
https://imx.tdameritrade.com/imx/p/imx-pub
Last month, the IMX retail sentiment dropped to levels last seen at the beginning of last year.
The “Fear and Greed Index” also currently shows “extreme fear” with a current rating of 20:
http://money.cnn.com/data/fear-and-greed/
So if you are a contrarian investor, these low sentiment readings are bullish signs for the stock market.
I’m currently 100% invested, mainly in TQQQ with a little SOXL (about 17-18% of each account).
If I stick to my trading plan (always a big “if”) I should not make another trade until some time in May or June when I plan to lighten up for the summer, which is usually a choppy sideways trading period for TQQQ.
Have fun following Alex and his great stock picks, you will make much more money than me this year, but I’m taking the “easy” way and just trying to ride the stock market which I believe is in a long-term (10-15 years) bull market that started with the election of Donald Trump, just like the 20-year bull market of the 1980’s through the 1990’s started with the election of Ronald Reagan.
Love him or hate him, there is no denying that Trump is even more pro-business than Reagan ever was, so I think that translates into a strong economy and strong stock market for at least the next few years.
I only need 3-4 good years in the market because I’m planning to retire then and I will become more conservative in my investing. In the meantime, I’m trying to maximize my retirement accounts.
Good trading to all!
https://uploads.disquscdn.com/images/62f10070b31660f63d249310492226b42085af9bcb4c1e4e03e35a12e1b2c849.gif
Thanks for the info…I use Ameritrade but didn’t know about the IMX…guess I need to go poke around a little bit!
Steve, raging bull market started in 2009. You can say extended with Trump and you can’t deny that crazy strong Wave 3, just didn’t start in 2016.
Refresh –
I was kind of thinking the same thing Cason, whenever I hear Trump take credit for the boom in the stock market I just look at a chart and wonder how he could think that He caused it to be bullish. Notably, He did NOT take credit for the Feb Drop that was under his time in office though 🙂
Anyway- Back to charts- his policies would not take affect the day he entered office, and this rally was really a multi year rally from 2009 , but is this wave 3 or 5?
https://uploads.disquscdn.com/images/781b37d26a8a7fe93e890f0b45f7acec47681bce196458d47360f00b388182d1.jpg
Hey Alex. I have the same count. I have us as completing Wave 3 of Primary 5 when we hit last month’s wipeout. The bad news? That would put us in 5 of 5 of 5. But no one predicting the end of the current bull has been right yet. So, I’m not going to be the next to get it wrong. Long until proven otherwise! 🙂
AHhh, yes, 3 of 5.
Thanks, I thought you were thinking this was primary 3.
And unfortunately, I have also seen the 5 of 5 of 5 possibility, but for now it remains bullish with stops 🙂
That said, my feeling is we have plus or minus about 5 days to the peak of this DC – and then we will have a clue if it is likely RT or LT and we will see if the indexes can make higher highs or not. Right now the only group that I can see of significance that has moved higher than Jan 26 is SOXX. Steve I hope you are right about the long term bull, but …..
Some thought-provoking statements there Steve which make for a very interesting debate/discussion. I will say this, both economically and politically the world was a far different place back in 1980 vs. today. I remember 1980 very well, market participation was mainly reserved for and reflective of legitimate economic analysis, such as what text books have advocated over the past 100 years. In today’s world, those rules have simply been tossed out the window with the only criterion driving prices is what the algos and the machines think prices should be given the latest “wiggle” on the price chart. I am not saying this cannot continue indefinitely into the future, but I am saying there is very little that is the same today that was in 1980.
ZSAN another micro bull coil… 24/25 if pops … amazing
Based on the comment indicator at 32 today I think we can surmise that the market will either be up or down tomorrow.
Awesome analysis LOL
That was good 🙂
NETE rips right off 62 fib intraday PB on vol from 7.22 to 9.25.. … what a traders market ..
I saw that too- it did a reverse split, I used to trade this under $1. Look at that chart now 🙂
Refresh:
Crazy day in New England – this was the road on the way to my parents house. The roads were simply Packed ICE, Trees down everywhere, traffic lights clogged solid with snow piled up onside, cars sliding off of the road….in March . I was able to log in and look over my account after the open using my phone, made 3 trades today ….added to AQ, added to DWT near the open. Then had to get to work. Added to VUZI just now, as it was up 20cents off of the 50sma, so …
VUZI turned higher off of the 50sma this afternoon and is taking off higher up 20cents ( Thankfully) 🙂 I added
AQ is AWESOME, I added using my phone this a.m. from my parents house, the volume was very strong as it moved higher. I was only abl to spent 10 minutes with the market on my phone, and then had work to do.
CLF / NUE / X / AKS are waiting for trumps 3:30 tariff announcement?
GALT IS A BUY- I had an order in all day from yesterday and it took off without me, I did not get filled ( Very sad) I think GALT is about to run. I may just buy it now, I may wait to buy it tomorrow if it pulls back. .
I need to go back and review the markets now
Wrong picture above – so I removed it. Refresh
https://uploads.disquscdn.com/images/a7613c232ffb81dfe9f8c0ca64ff77c8da6812911a2467b5be48e7dce9ed2d1c.jpg
OMG……….. that’s amazing… BEEE CAREFULLLLL !!!
we are just starting to have wind and snow… i have 15 deer in my backyard… munching away…
So, you are not vacation Maria anymore?
I’m back 😉
Tried to change my name but discus was barking at me.
You have birdseed out there? I love it when the deer ( and antelope) Roam into the yard
No…. just grass…funnyboy
https://uploads.disquscdn.com/images/bdd5cc42c7a8e63abd20dfe97b6af2c79b15c5cce411dde4e7c2c5d61aa83540.jpg
THAT is sweet!
nice.. winter wonderland!
Yes, but it is March 🙁
We had 70 degrees for 2 days – 2 weeks ago and I got pretty spoiled fast 🙂
Incredible pic, Alex.
Like Canada, eh? 🙂
Ha. Some parts. But not like Toronto right now. It’s dry and cool, but nothing like what you guys are experiencing.
wow… beautiful except for driving 🙂
I DO CONSIDER VUZI A BUY – it MIGHT be ready now
refresh
https://uploads.disquscdn.com/images/b4af86876265b779c2a8ba09e6a67af7cca670811c2984e02b6b9d92c1f4c9c0.jpg
Do you have a PT On VUZI?
Much higher than you will hold it for 🙂
I’m not trying to be funny, or maybe I am being funny, but you always seem to ask me that. If I say it could run $8 higher, you still sell after the first $1 higher
I locked in some decent gains on my HMY a few days back, and today it hit 9 month highs?
Nice.
Well shoot, wish I’d been in THCBF here at end of day….zoomed up into end of day…many MJ’s started turning up end of day…
I sure hope they get legs. Like you, I have some for a long time and want some results.
So…I was just now studying THCBF…to try and find out if there was a “tell” that would have let someone know it was going to zoom up here at end of day….I started to get it a couple of days ago but held off….so I’m looking and thinking….maybe there was something that would give a hint…look at the MA’s on a 5 day chart/even the 10 day…..10 minute/15 or 30 minute even…….they all seem to be converging….lines aren’t too far apart….the 200 and 50 are rather steady (easy to see on the 30 minute chart)….then this morning the ten day starts to curl up a bit….and the 34 and 50 are pretty close by…the 200 not very far away…..and then …..price starts climbing….til the EOD and boom….I checked some other random charts…MA lines are further apart, etc…..don’t know if this is a tell or not (maybe everyone else already has this figured out and I’m just slow )……but I’m searching for other charts that look somewhat similar…to see if they also get a good pop…..I’m sure it might not always hold true….and surely aren’t the only conditions under which a good pop might happen…but….it’s an experiment :)……..look at OGRMF….5 day, 10 minute chart….averages converging and turning up…..who knows? Look at GALT, 5 day, 30 minute….how close the lines are….?
Thats good training Tammie…
This is something that I usually do for ‘entries’ too if I have time.
When I see a daily chart that I like, I for smaller time frames and look for Volume, MACD and MAs.
The reason that I do it is because I have looked at a dily chart ( Like VUZI) and see it moving higher and jump in, but then on a smaller time frame you may find ( 15 minute for ex) that it is very overbought, MACD does not make a higher high when price does on a stairway higher all morning & volume gets very light with each step higher. Often it then pulls back & tries again. I enter on that pull back.
Almost too much micromanagement – the daily chart is fine, but I like to do it for the mental exercise too.
Great observation, Tammie. Thanks!
NIce – this wasnt on my list either. Right under the 50sma
A little late on this post – but I just noticed VUZI is set to report on the 14th which is Wednesday next week
Fridays report has been released