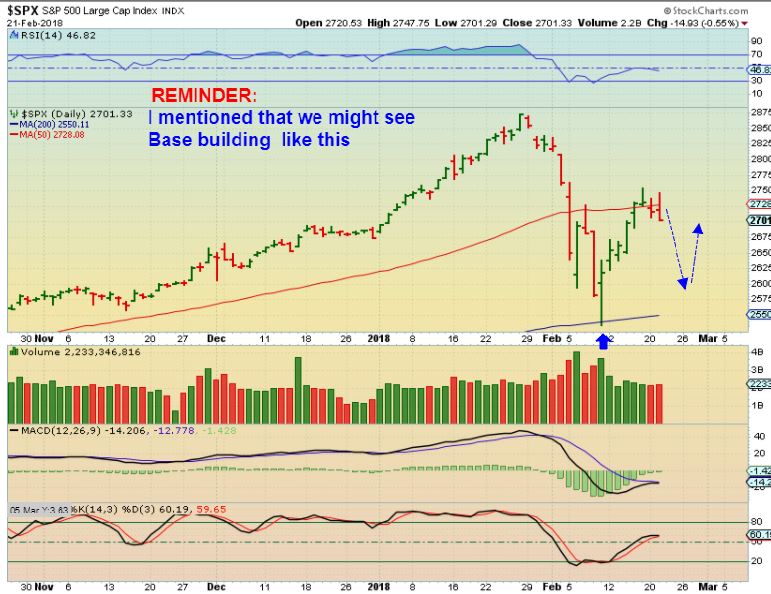
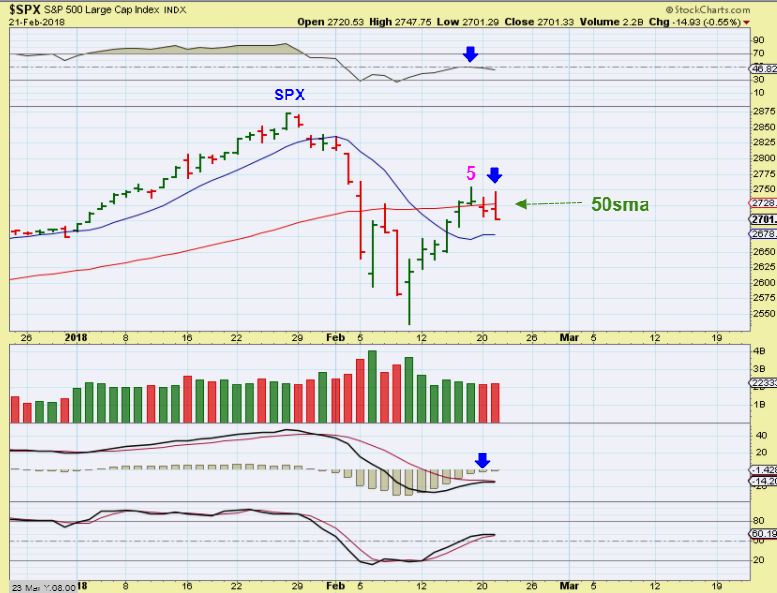
SPX – REMINDER: 2 weeks ago I showed how the Markets can base build after such a sharp drop & added volatility. I mentioned that they may drop to the 200sma in an A-B-C type drop and then even go sideways. SPX actually did drop to that 200sma after I posted this , so this may be base building. See the next chart…
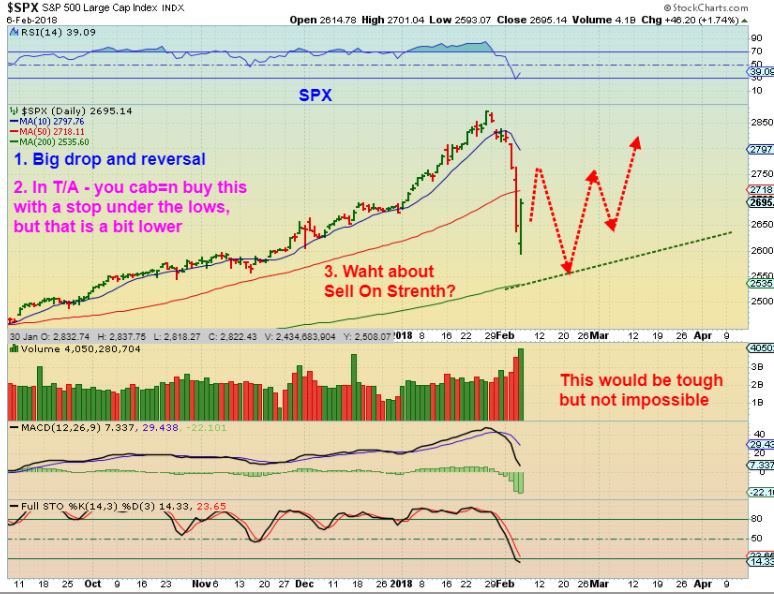
SPX – So far, the above pattern is playing out. Drop to the 200sma and now we wait and see.
I will be on the road for a few hrs this morning, so I am releasing this without a proof read. Please ignore any typos.
The markets were very volatile after the release of the Fed minutes yesterday. With that knee jerk reaction and then an opposite end of the day reaction, it left behind a very mixed picture for out Thursday trading. Let’s take a look at the various markets with that ‘FED MINUTES’ reaction to see where we are.
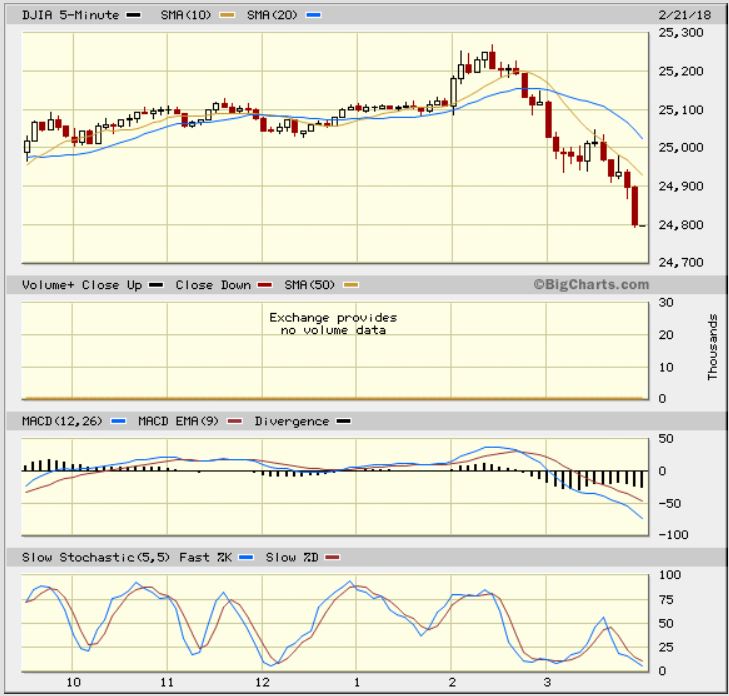
DJIA 5 minute chart – We saw the Dow rising up over 100 points during the day, then when the Fed minutes were released, it rallies up another 100 points. Very shortly after that rally, it sells off from 25, 267 down to 24, 792. The ‘rally’ and then ‘the sell off into the close’ leaves things a bit confusing….
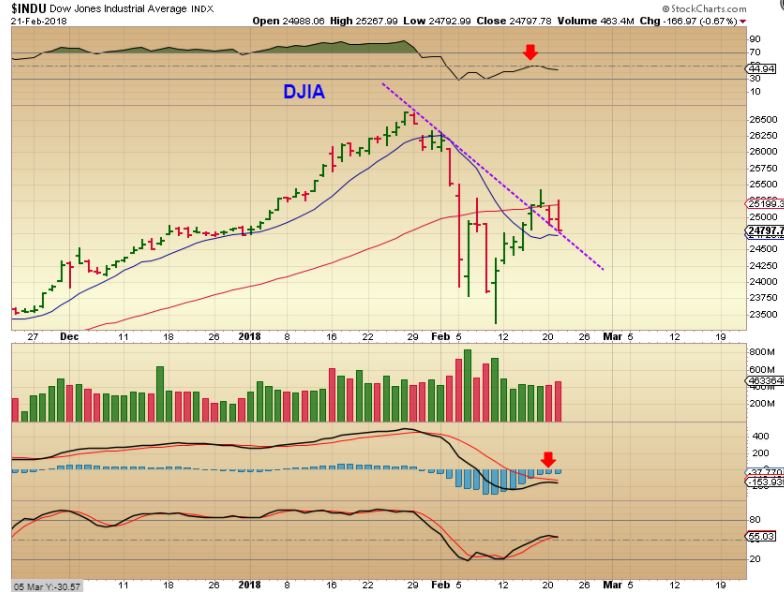
DJIA DAY 7 – As you can see on the daily chart, the Dow ran to the 50sma, and turned down dropping to the 10sma. The MACD looks weak, and the RSI 50% was rejected. This also may be base building.
SPX – You can see resistance at the 50sma so far and a reversal in that area. Again, we may be building a base.
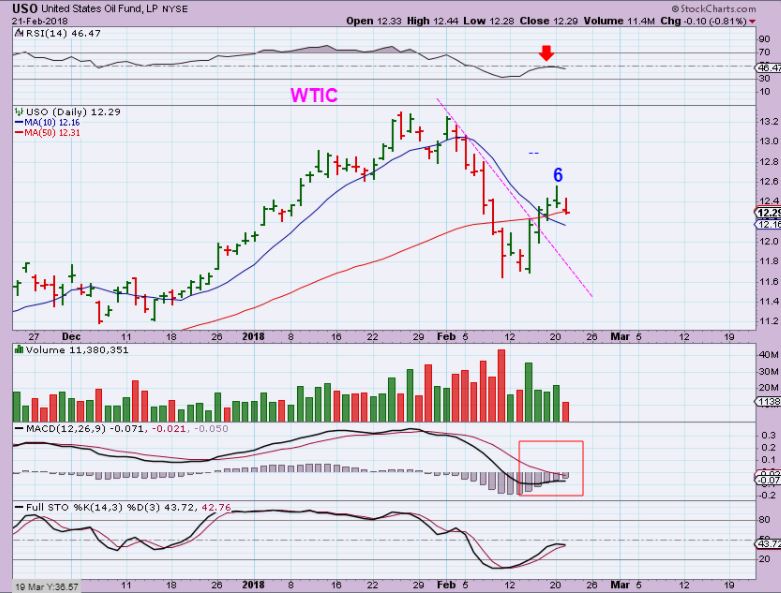
USO FOR OIL – Not much has changed with Oil. It still may be early to short it, but we also see short term weakness in the RSI & MACD.
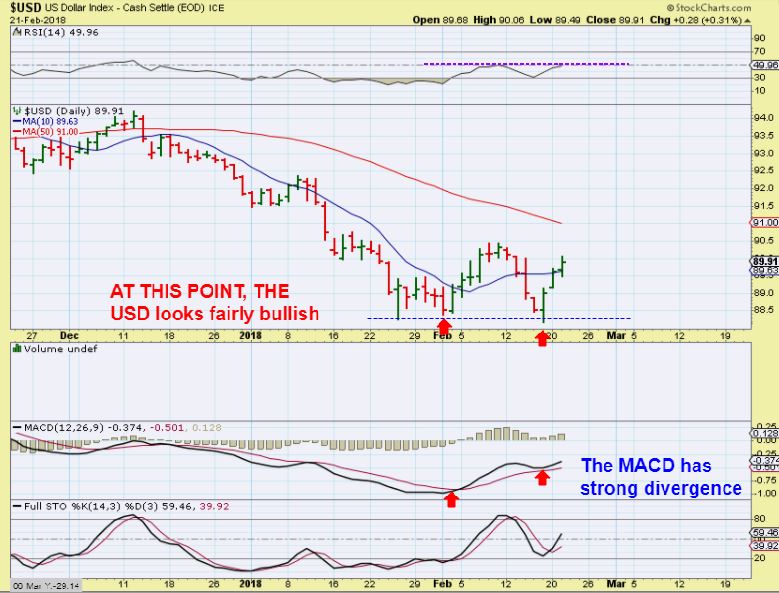
USD DAILY – If you watched the USD, it sold off after Fed minutes and Gold, Silver, and Miners put in what looked to be a convincing rally. By the end of the day, Precious metals sold off sharply and the USD closed higher, above the 10sma. Now the USD looks bullish. See the chart.
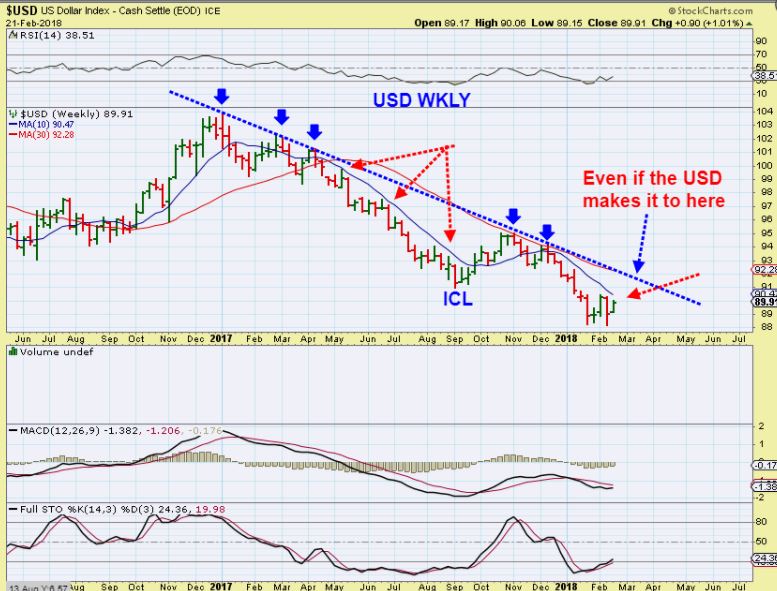
USD WEEKLY – If it closes above the 10 Weekly MA, that new low Tuesday could be that ICL. We wont know for a while.
GOLD INTRADAY – After the FED RELEASE, Gold rallied sharply, and miners did too for 1/2 hr. In real time it looked very convincing, but then it rolled over and sold off almost straight down for the rest of the day as seen here. $1336 to $1323 is ugly real time. Look at that chart, THAT is acting unpredictably.
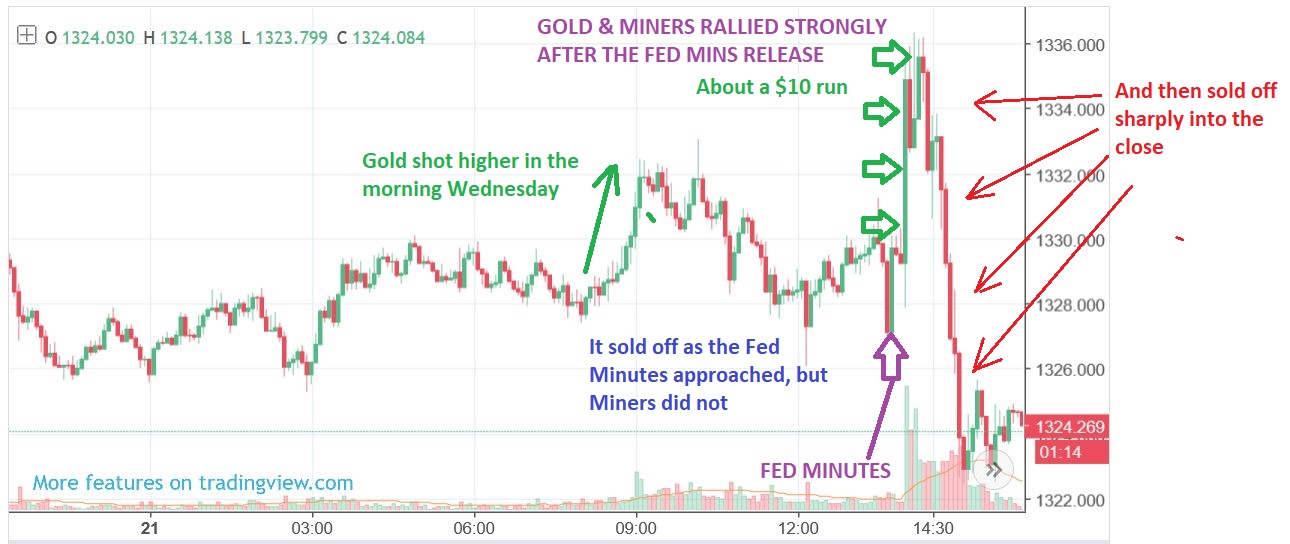
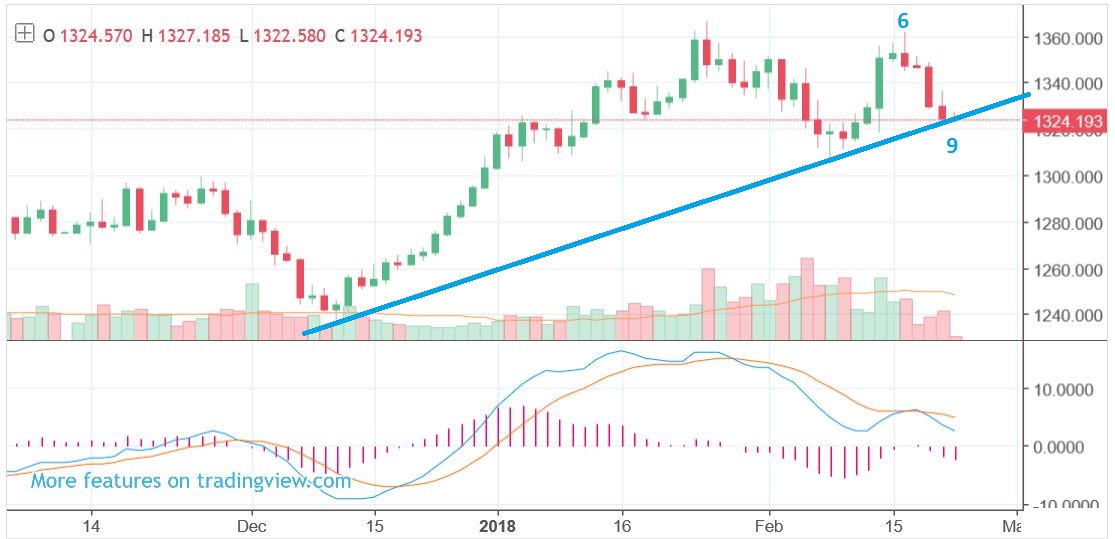
GOLD – So Gold daily now looks like a double top.
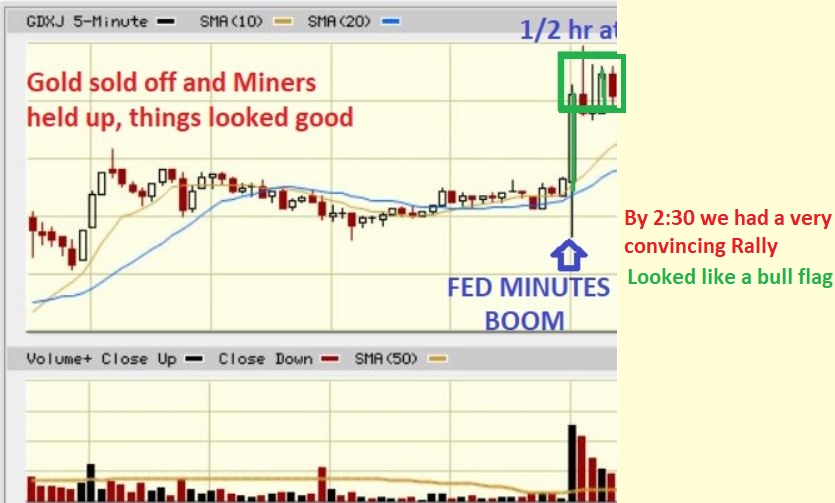
GDXJ – SO here is a 5 minute chart of GDXJ yesterday. After the Fed minutes there was a very strong POP in miners for 1/2 hr. By 2:30 P.M., it looked like a very strong rally was in place, and a possible bull flag. This looked quite encouraging!
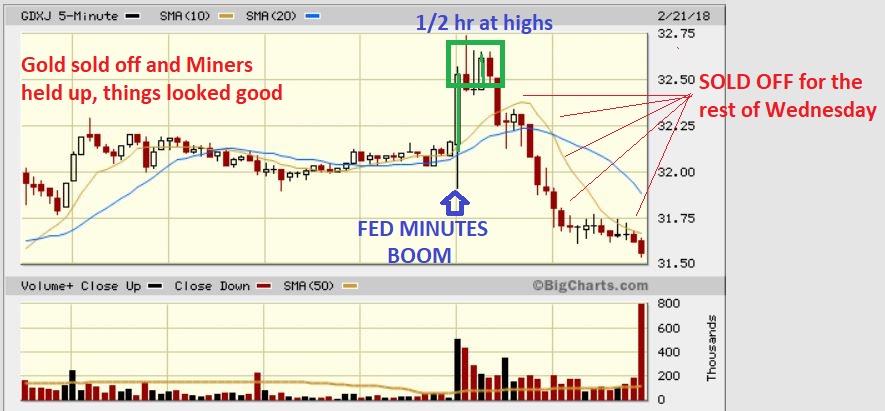
GDXJ – And this is how it ended, selling off relentlessly. So far, the rallies can’t be trusted. Lets go to the daily chart.
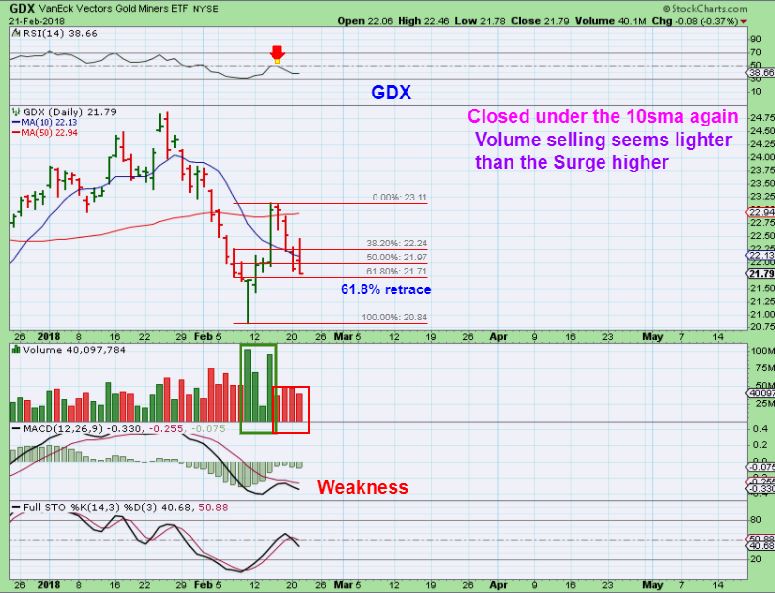
GDX – So this chart gives mixed signals now. That was a buy-able strong reversal higher, and the drop is on lighter volume than the rally. The drop is only 61.8% retrace, however the rallies have not been enjoying follow through. We are under the 10sma and I am much lighter with my leverage now due to being stopped out on 1/2 of the JNUG that I bought around $12. Before jumping back in, I am going to watch how this plays out.
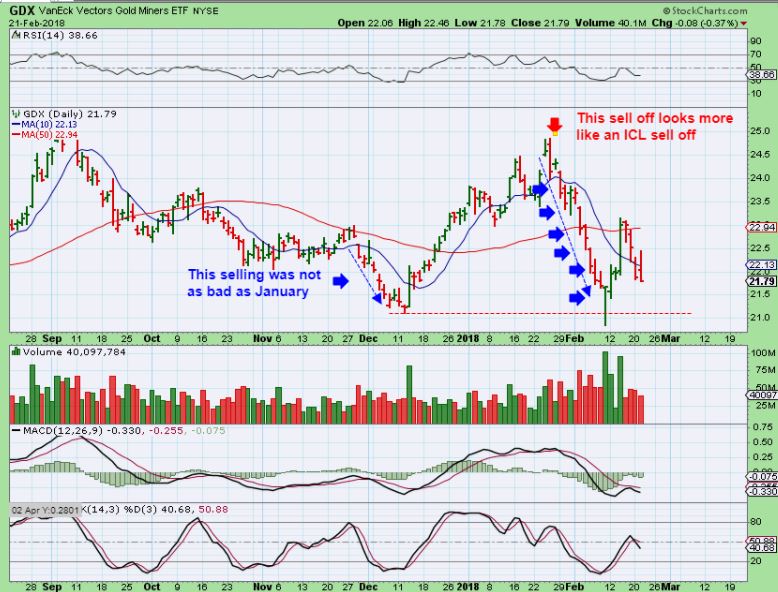
Just a sidenote on GDX – When I look at the SELL OFF in Miners in DEC compared to the sell off into February, the one in Feb still looks far greater than the Dec selling, and looks more like an ICL type sell off.
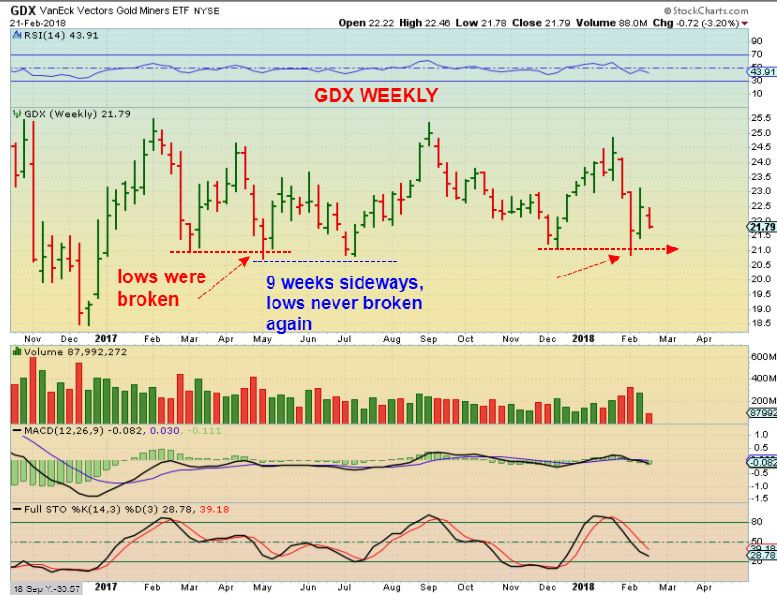
GDX – I was noticing that the MAY 2017 ‘Failure’ reversed, rallied , and went stagnant for weeks, but those lows were not taken out. I’m wondering if this is just going to go sideways until the USD rolls over?
Did you see that intraday action? If you worked all day away from the screens, you may not have even realized how the day went looking at a daily chart, but real time that kind of indecision and volatility is difficult to digest and understand.
So at this point, I am getting mixed signals where the volatility in the markets is causing them to ‘react’ or even ‘overreact’ to every news flash. If GDX or GDXJ were to just continue sideways like the above weekly chart, 3x etfs can decay. In addition to that, I knew that I will be away for a small portion of the morning, so I felt it best to reduce my leverage further. For now, I am not adding anything until I get a little more clarity, but I am still holding HMY, AUMN, SVBL, THM, and a smaller position of leverage. I also still have positions in other sectors, such as ENPH, GGB, EDXC, POTN, and SPRWF.
Lately, due to added volatility, my trading style has been to simply cut leverage when too much uncertainty pops up or reasonable ‘stops’ are triggered – I use mental stops. I locked in profits for now and basically bought JNUG in the $11’s and $12 area (at an average of $12ish) and sold out at only $13.65ish average. I missed getting out at the top of the recent run and realize that that may not be the top, but circumstances have been much like the Theme Picture of this report. Usually you can buy a low and hold for weeks, and those days will return, but for now I will take what I can get and play it a bit more safely, especially since I need to be away this morning. Enjoy your Thursday trading!
~ALEX
Again, This GDX intraday chart looked fine, this rally after the Fed Meeting seemed to be the follow through expected…
And then this sell off was just ridiculous, but you have to take what the market gives you and go from there, so…
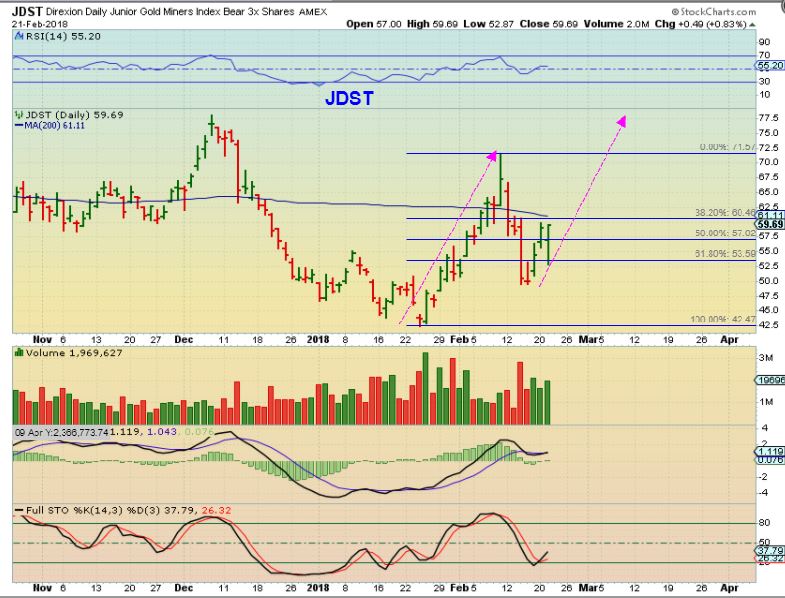
JDST – I didn’t buy it, but I was looking at JDST & DUST into the close and they rallied the way JNUG sold off. Straight up into the close. Even though GDX and GDXJ daily charts do not outwardly look ‘bearish’, these do look rather bullish, though still trading below the 50sma.
Just another set of things to watch as we go forward today.
Yay Or Nay? Wednesday Fed Minutes Release 
 Friday – Carrying A Lighter Load
Scroll to top
I’m probably dumping all my leverage today…after a month and a half of trying to be patient. In the past, selling leverage too early was a mistake, especially with the cyclical nature of commodities. Looks like this time it would have been the correct move. I violated all my stop rules trying to keep the big picture in mind (daily cycle, intermediate cycle outlook) and now I’m paying for it in large sums. Now it’s time to recover losses with patience.
Hey Peter
Your patience has been exceptkonal, but this has been jittery.
I am usually good with leverage, buy at the lows & you can usually
Hold for 3 weeks (15. Days ), but this sideways chop & volatility has
Been relentless. Maybe we get a pop for utoo sell into
With this sideways action.
I’m away from my screen this a.m., soI had to lighten up after
Yesterday’s sell down. I’ll try again when conditions
Set up.
Thanks, Alex. Given where we are now, are there any tips to differentiating a pop from the start of a potential rally? I guessing that impossible to answer, but I figured I would ask in case.
I still dont see the lower IC trend line broken Peter
Really? That’s good news. I’m not sure what I’m doing wrong.
I’m with you. Should have dumped on 1/25 at the first sign of a turn down when I was up 14%. Now I’m down 25% from the top. Must now go slow, small, and cautiously so as not to decimate account.
Oh yeah, I hear ya. Hindsight 20/20 yada yada.
All the analysts I follow have basically turned bearish or uncertain, so at this point I’m just gambling if I keep holding. As I write this though, I do see a potential H&S forming on the 30 minute with the dollar….
I’m watching 89.65 on the dollar. That would be a move back below the falling trendline from Dec that turned it down last week. It broke and closed above it yesterday and is now dropping to back test it. A break of that with close under it may be the start of its drop again. A move above 90.25 and it’s headed for 90.75 . It could even flag or slide down the black trendline, just have to adapt ones bias as you see it. Alex does a an amazing job at that and try ro keep others on the right side. So far its still short term bullish chart on the dollar in my opinion but todays close can change rhat.
Disregard writing on the chart , that was from couple of weeks ago.
https://uploads.disquscdn.com/images/a48ebe1a93ece43b9363465d5375e0c3023502d7039991602f7a26cff9d394de.png
Thanks, Miller. Very helpful.
Well we broke through 89.65. Now the question becomes was it a false breakout, or will it back test and continue down.
The 10d ma was at 89.63, that may act as support as well, though usually not a strong one. I can’t get real time dollar data but tradeview shows 89.82, is that correct? We did get big candle and tail down to .65 area, looking like a back test, but may bear flag now,
We also tagged 90.24 and reversed so that’s a good sign for you so far. May flag around between the two also though.
That is where I am at, though I am not going to do any selling here, I did mine into the last selloff. I´m just going to be patient and keep a lot of powder dry, miners will set up something special before long, they always do. Maybe the late April into May window.
Over the years time again when something unusual happens or unexpected it only seems to be in metals sector. Have seen everything from 1 day cycle tops a few years ago to right translated cycles failing etc. this is why I am waiting for 25.71 in gdx to go big. These moves in here have chopped many to pieces as a swing trader as most don’t have your discipline Alex. I really respect the way you are able to move and stay nimble.. that’s why you are the best I have seen. Ty for all you do here for so many!
I’m in front of the screen A LOT, others just can’t be. IN less volatile times, we get a DCL & ride it comfortably, but these volatile choppy waters make it very tricky. I watch many time frames, I think that is why I can write a bullish report ( daily charts and cycles), but I see a violation in 30 or 60 minute charts start to appear and get more cautious.
Above and beyond that is the uncalled for, absolutely stupid ( Seems rigged) Rally in everything after the Fed Minutes (there was no real new news) and that lasted for a good 1/2 hr, then suddenly a constant sell off in Gold, Miners, SPX, DJIA, etc . THAT is unavoidable ‘crap’.
I know. That’s why I have been upset- I had a great trading plan for this ICL and we just didn’t the move we should have. I held uncomfortably (at times) so that we could rally and didn’t happen. Ugh!!
Has anyone studied the relationship between treasury yields and gold? The reason I ask is that 10 year treasury notes are at a multi-year 50% retrace level looking back to the bottom in 2007. Could be strong support. I also noticed that 10 year treasury note prices peaked in September 2017 on the exact day gold peaked.
I have specifically been waiting for the 10 yr to rise faster than the 2 yr.
fwiw.. i’ve posted this before some time ago, but its from Screwtape’s gold blog.. and its a chart to show the almost exact inverse nature of $TNX (measured in $SILVER), versus $GOLD.
an update shows there has been a breakout to the upside in TNX:SILVER of that hsr line, which should according to the theory, signal a decline in GOLD
https://uploads.disquscdn.com/images/a1c1a5c0c38d3e7a2376fdf921da76f50115d8daa3d8ae6412e6636f29439f03.jpg
Na There is no correlation between Bonds and Metals….lol 😉
o no u dinnnnt …;)
Could Not Resist 😉
MmmHmmmmm …
… u must be bored .. …
Isn’t there a mountain somewhere u need to conquer? 😉
#instigator
I can’t resist either…. so as a reminder-
All I ever said was “Stop telling me that TLT is a good trigger to enter GOLD. They bottom together.”
They do not always run together…as I stated.
DO NOT USE TLT as a trigger to enter Gold
As you can see- NO CORRELATION LATELY. TLT crashed, Gold ran higher since Dec.
HAHAHA, LOL 🙂 🙂 🙂
https://uploads.disquscdn.com/images/7096f7ef55ed4681cc47f8c644b1184df4ebe2dfc1a85c10b2b454beed4eb317.jpg
🙂
Ha ha ha
#watchdog 🙂
https://uploads.disquscdn.com/images/cf54e8c92c885dd84d97bb82c82819d5e88179fb79d2a258e800cd91f263e3fd.jpg
think it was more a matter that there are TLs/etc on the tnx:silver that could give advanced clues to gold’s whereabouts, and therefore, what it was about to do next
I have for a couple of years, they used be pretty correlated until the beginning of this year when yeilds rose, treasuries collapsed in Dec yet gold rose. I never found either to a leading tell really, but they were very price related. Here is an old chart and I have quite few more of the idea. https://uploads.disquscdn.com/images/b4d039137c4d96a093f87fd249687c2c1aea2e1b55f4a6b7e8d40cd706cf3fba.png
Well My IAG was still green een after yesterday.. With this PM action, im teetering red..
My HMY was about to start breaking to new highs with the post Fed Minutes rally, then sold off to the days lows again 🙁
I’m on the road, trying to get caught up, and didn’t even know that the markets opened! Boy, is this how it is when you’re away from the screen all day?!!
Dow up 216 s&p up 20.70 gold down 2.30
Thx ….and now I would use the charts in this report to see where that 50sma is, because it keeps going there and being rejected.
See if it can close above again
No.. worse. ;-/
Draw a trend-line on POTN, and it dropped there and seems to be rising off of it
It is kind of hard to tell from my phone
* EDIT- HEAVY VOLUME
WHOA- did anyone read the news on POTN?
” PotNetwork Holding, Inc. (OTC Pink: POTN)
announced today it’s wholly owned subsidiary, Diamond CBD, Inc., has
reported that the Company has generated over 3 quarters of a million
dollars, just within the first 10 days of February.
Eclipsing last year’s sales of $163,000 for the same interval, revenues
reflect year-over-year growth in the range of 363 percent.”
$250,000 in 10 days?
This doesnt say what their losses or costs are, but it does seem to indicate growth
Just an FYI: I added
The above comment was edited – you may need to refresh to see it
HBM had a good report, stock is up
wkhs had a giant POP on news of a deal with UPS, but it is closing the gap now
CSTM looked pretty good too
TGB dropped like a rock
wow WLL … OAS …hmmmm
And LGCY still looking good, the buy was the gap down this am
CHK up big
NOG & SN pushing on 10sma,
Oil just popped
Yes, thats why it was too early to short it
Yeah I mentioned I thought they’d squeeze the early shorts and not make it obvious, but I still foolishly tried sco the other day for a quick trade but stopped out for a loss.
Well, I think Oil rose up back to the 50sma , so it wasn’t actually a bad attempt. You were at a possible turning point & a reasonable stop. I was tempted too 🙂
Did JNUG just gap up over the declining trend line?
https://www.tradingview.com/x/q5NMffXC/
CF. I just noticed that Oil maybe be looking to tag the upper trend line connecting the Oct. 2016, January 2017 and the recent highs. That would bring Oil to about $67.90 ish in the beginning of March ( Day 17 or so ) Also a Fib. extension to that area would also put the recent bottom (Feb. 9th & 14th ) at a 38% Fib. retrace. 10 DMA is just starting to turn up here as well.
Thanks
Ok, here’s probably the stupid question for the day….but…could oil have already completed the ICL and has now started a new intermediate cycle? Which means I should be buying the low priced oil plays now…?
You can buy it with a stop, but that COT is still very bearish.
Alex is it possible the COT is simply reflecting the hedges the oil companies put in place when oil spiked?
I would have to know what you mean by “When Oil Spiked’?
When did Oil spike?
And when we look at the COT, we see that The COT has grown week after week.
Remember that is not what the COT is telling us (at least as of last Wednesday a week) ?
Anything wrong with this picture in your eyes?
https://uploads.disquscdn.com/images/2a087ee4c61e7af07b944dfd9d361540861935b04a27a3e064cd94d8e88cbc94.jpg
HUI for sure. I wonder why…more stop clearing?
jeeze ….
hey… im watchn TNDM for a break ….. whattaYahStink?
https://www.tradingview.com/x/GWSUD3to/
I like the base & the volume. Looks good
Ahhh, I’ll take a guess.
Gold up $7 and rising all day, Silver rising all day starting to turn down,
The USD is down-
Yet HUI, GDX are Red?
And the message is?
When Miners do not lead the move, it is seldom going to be a strong move or sustainable for Gold
Miners not acting strong
Miners usually lead, right? Down we go?
Yes!
Alex, is this a break of the downtrend in gold?
https://www.tradingview.com/x/xhRFVIqp/
It appears to be one on a shorter ( 4 hr? ) time frame
CF, I’ve been selling a few covered calls on my miners. Should I sell more, less, none. Thanks,
At this point, I am not thrilled with the way Miners ( GDX GDXJ) are acting with Gold rising or even just holding up better.
I would definitely have a line in the sand and mine is basically running out of room. I think it was a smart idea.
Are those cup&handles forming on the daily charts of some of the “non-ferrous metals” stocks like FCX and TMQ?
They are pretty good looking charts, but I am not sure 1. What exactly you are looking at 2. If you are asking me or being rhetorical 🙂
Look at GGB on a 6 month daily chart- THAT is a cup & handle.
If you mean the little possible cups on a 3 month chart for FCX & TMQ? They could be forming a cup.
If you mean on a 1 yr chart?
TMQ on a weekly looks to be a slightly jaggard form of a large Cup & Handle
DNR … giggle
Looks similar to mid December
This looks kinda good to, maybe? https://uploads.disquscdn.com/images/52d7f01aa3ae8d94736284b2f429c15090b1bcd6b265845424b411114c913637.jpg
Even though the dollar closed right at trendline support, the pattern on daily chart looks positive for gold If continuation of pattern plays out on 5 min chart, could be looking at .30 drop..89.38 maybe for first drop, , which would well back below trendline. But it’s got to break 89.63 support first.