
Friday – More Than Just A Few Sprouts
Earlier this week I wrote a report entitled ‘Sprouts’, indicating that things were settling down and buying opportunities were sprouting up. Here we are at Friday, the last day of the week, and things are really shaping up now. Let’s take a look…
I have a lot of charts for this report, so I want to be short & as ‘to the point’ as possible with most charts.
SPX – This was in yesterdays report. I thought that it was fairly clear that I was saying that things were turning bullish as a buy, but I was asked “When would you go long the General Markets ?” – Now click to enlarge and re-read what I wrote in yesterdays report…
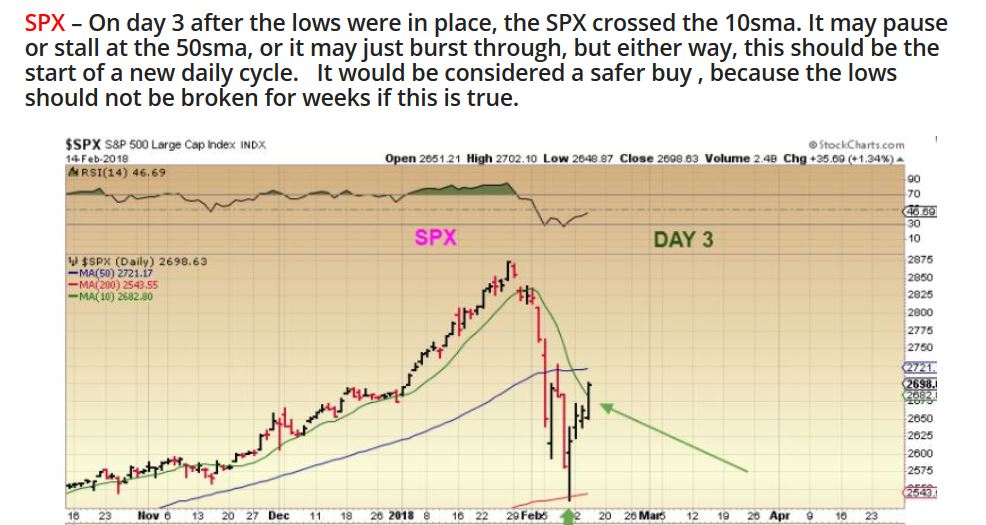
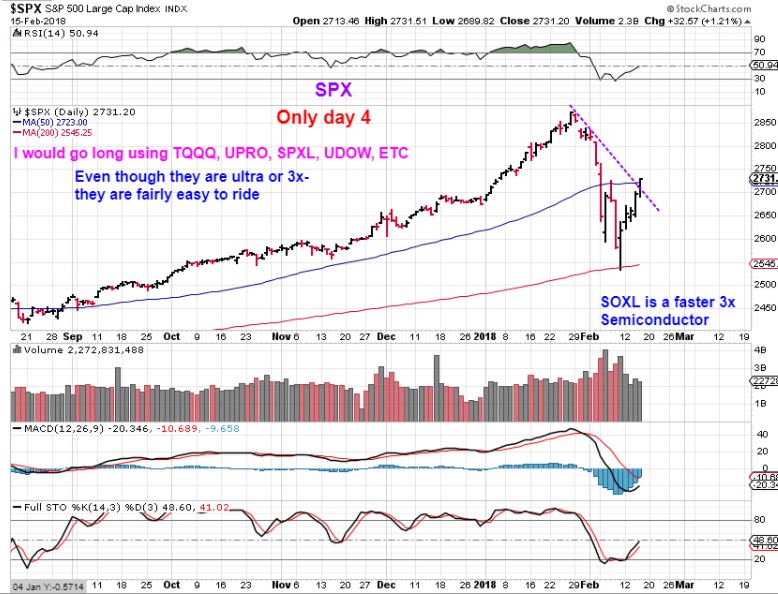
SPX – Some didn’t get the message, so I want to be clear & to the point, read the chart…
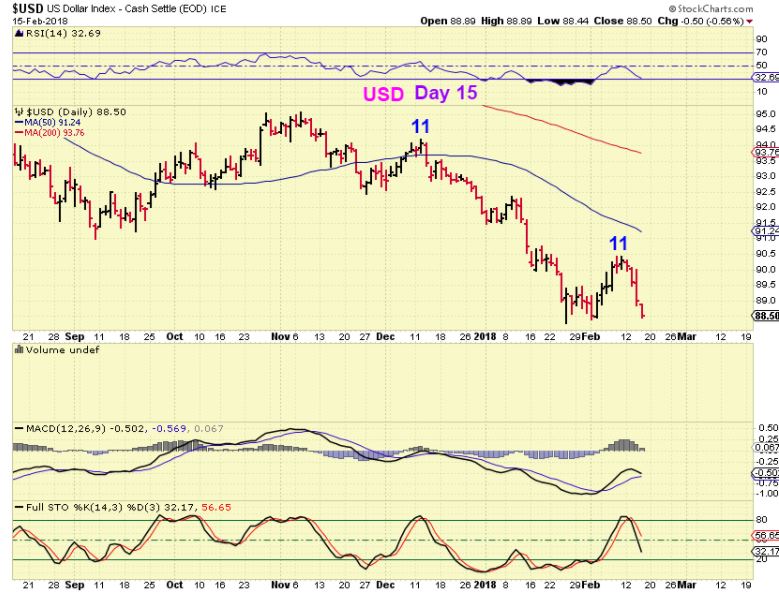
USD – To be clear & brief = I still feel that the USD is breaking down again.
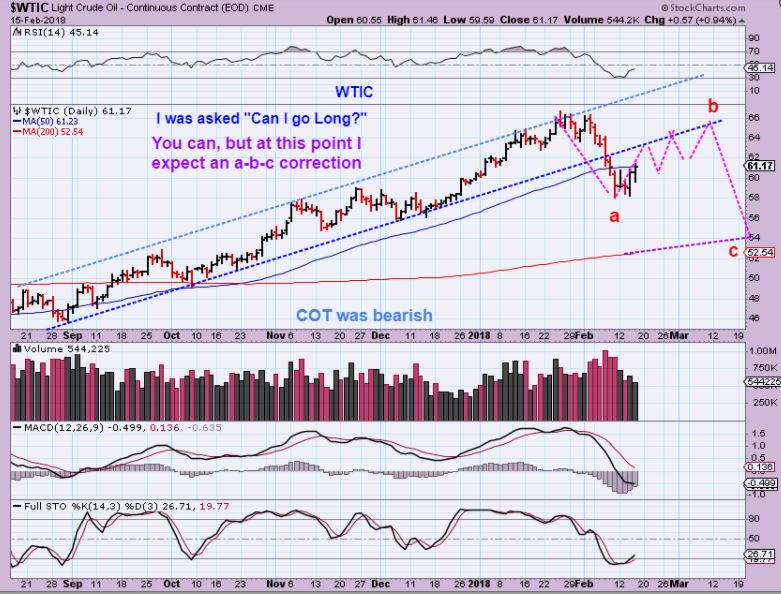
WTIC #1 – I Still feel that Oil bottomed with a dcl, and I still feel that it could roll over as L.Translated into an ICL.
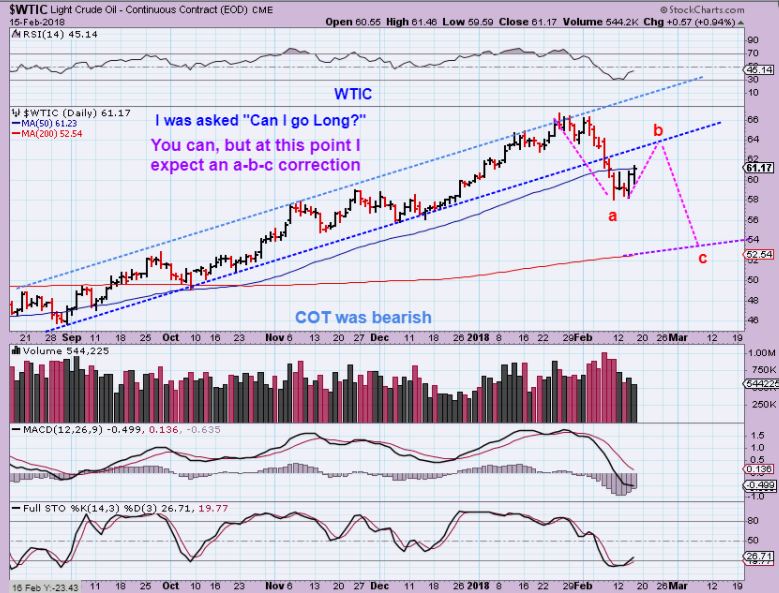
WTIC #2 – Do not think that just because I draw a straight line in my charts, that I expect price to move in a straight line. If I show point a – b – c like the chart above, it certainly can look like this in a period of choppiness as it plays out.
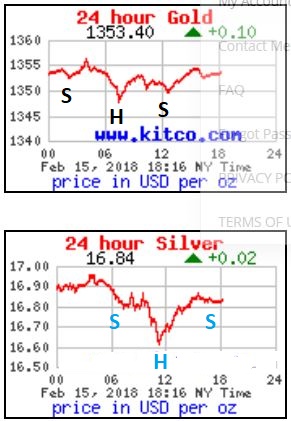
I noticed this as I was writing tonight ( Thursday Night). You may recall that the last time I noticed an inverse H&S in Gold and posted it in a report- it broke out higher, so I am going to try it again. 
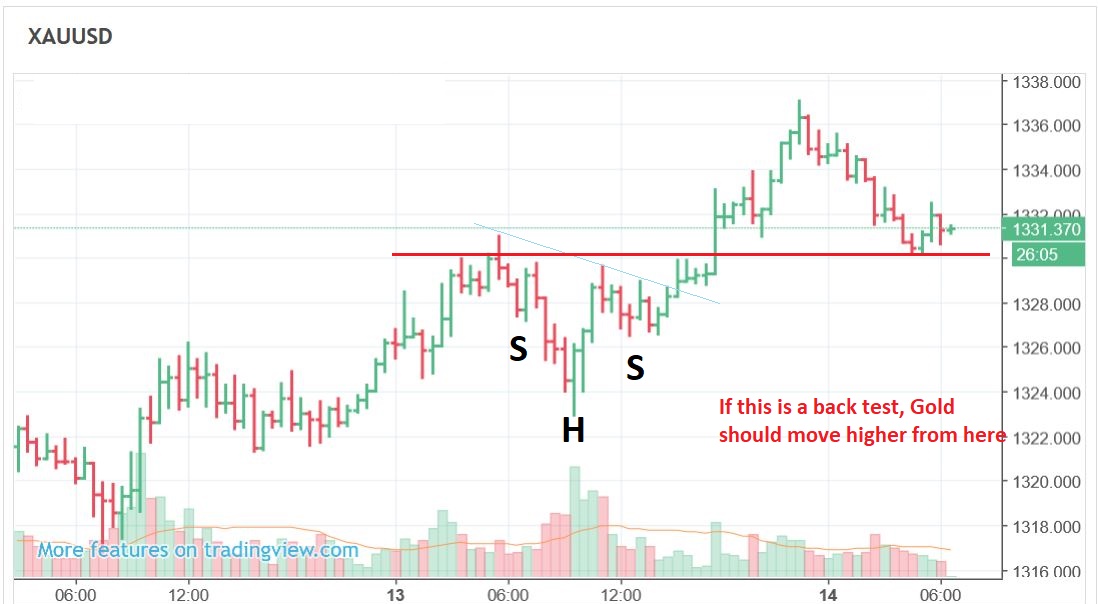
ACTUALLY – I remember now that it broke out higher over night and then BACKTESTED in the morning. We might want to expect that too. It went like this …
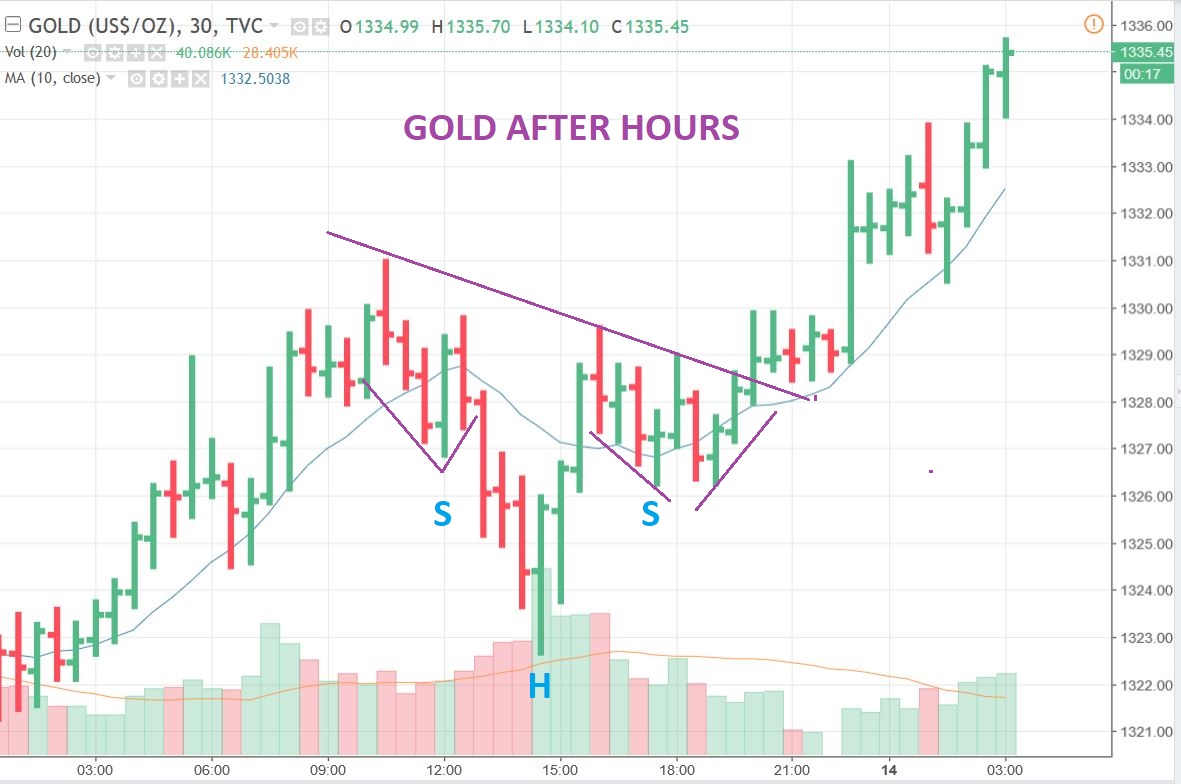
And back tested in the morning. If Gold rallies overnight & drops in the morning? Not to worry.
GOLD – GOLD DAY 5 , it may pause for a day or so, but I expect higher prices. The Next run could be as long or longer than the DEC – Jan run, it will be the break out run.
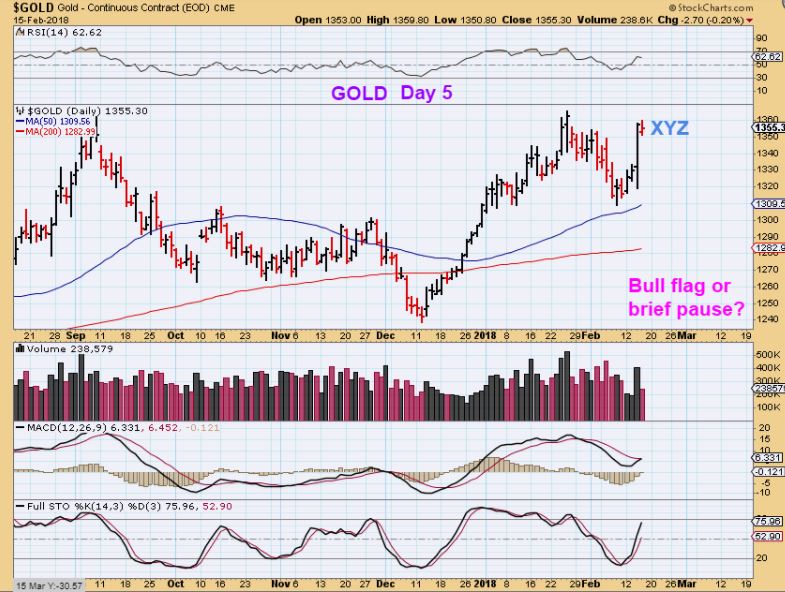
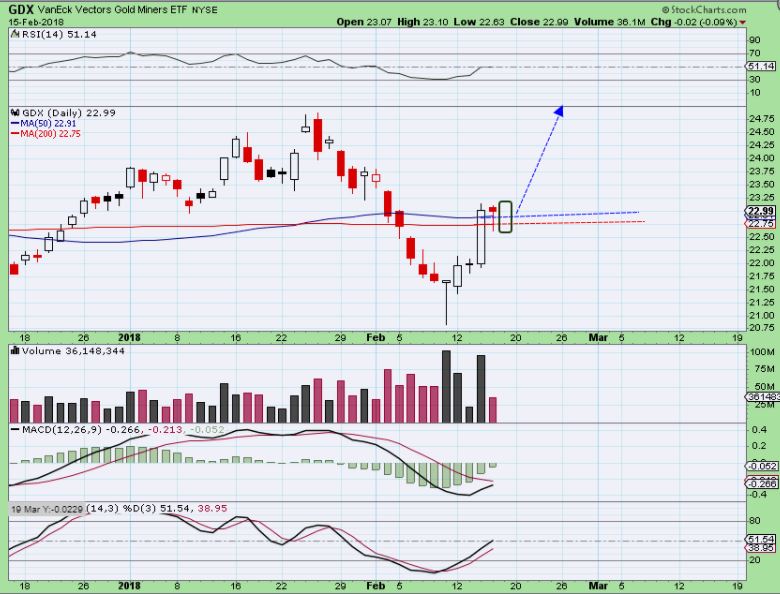
GDX – I drew in a square where we could see GDX Friday. It is option expiration and MAX PAIN was reading at $30. Often price will end around there, but if Gold runs higher, I expect that this will too. TO BE CLEAR, THIS IS BULLISH, STAY LONG.
To help traders to see things the way I look at them if I am hoping to ‘add’ to my position, I posted these 2 charts in the comments . This is how I personally view things to buy a pull back.
JNUG would have been bought around $15. It closed at $16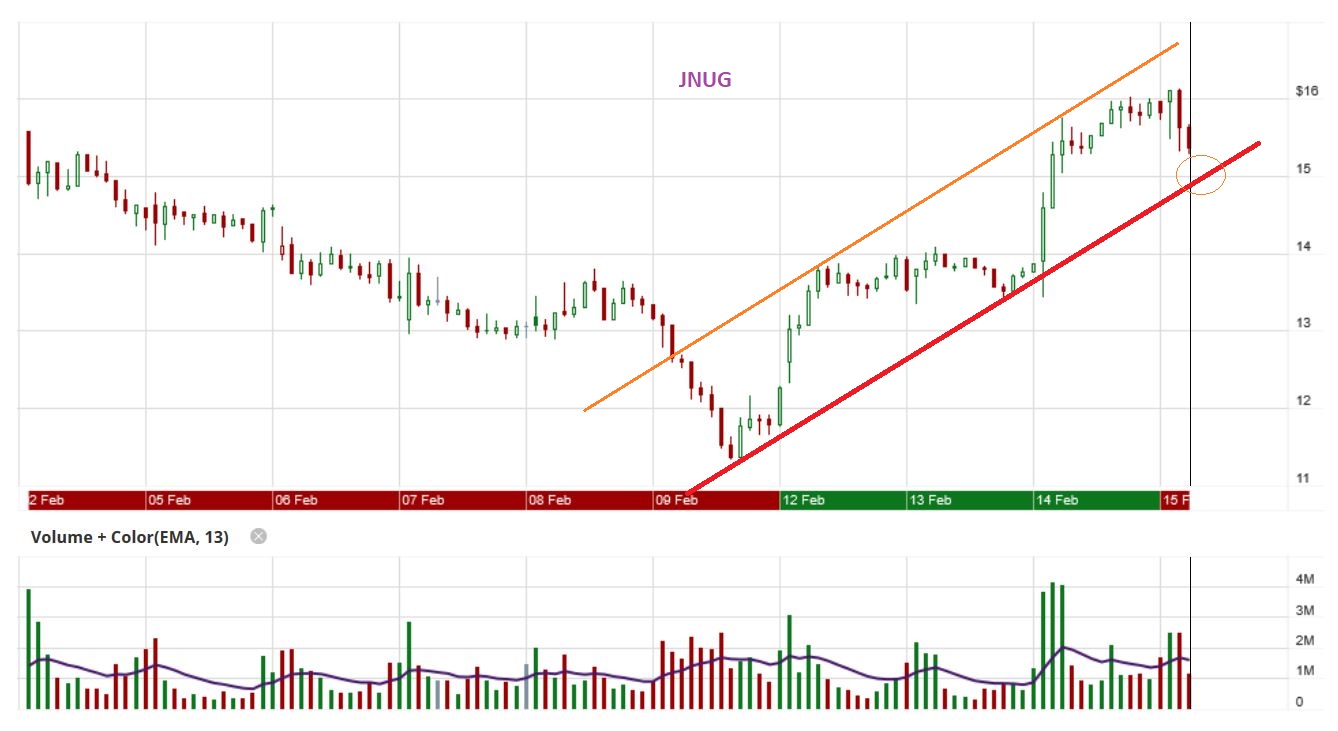
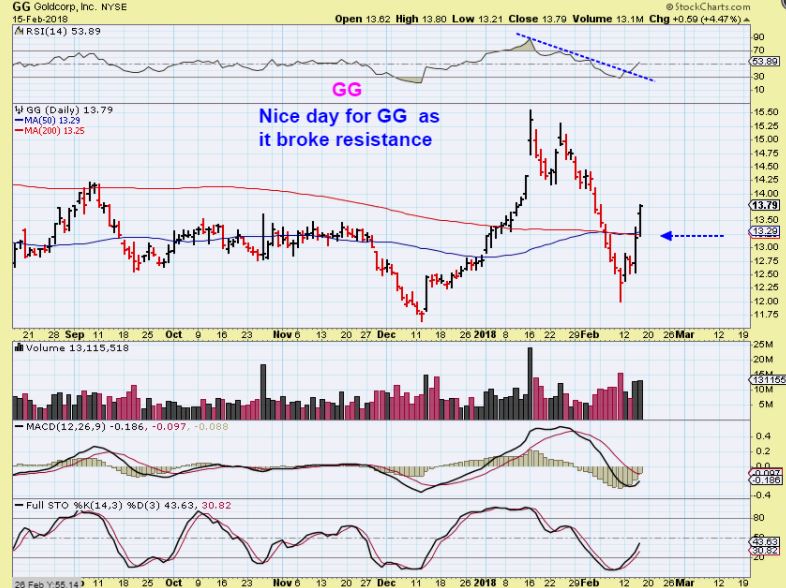
GG – GG as a part of GDX did not pause like many Miners did, even though it was at resistance. This is bullish action.
I am now going to just load this page with chart set ups. Don’t forget, I had a bunch of Miners in yesterdays report from Uraniums to SAND, NGD, VGZ, AUMN, BTG, TRX, THM, HMY, GORO, etc . If that doesn’t ring a bell, you may want to review yesterdays report, they remain valid. You could even start a ‘watch list’ of ones that interest you so you can look them up later if you want.
Please DO NOT let a long list of charts overwhelm you. I do this by request, we have lots of ‘traders’ as well as medium term investors. Do NOT Feel that you have to buy all of these or even any of these, I certainly don’t and CANT buy them all. Pick 1 or 2 or 3. These are opportunities for those in cash, trading short term, etc. I am loaded up in precious metals.
.
I will start with a couple of Miners and go from there…
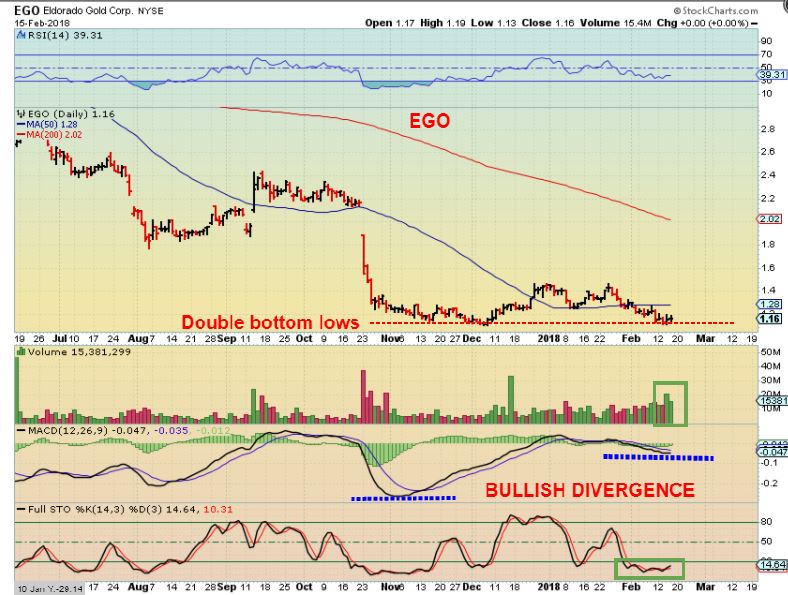
EGO – A DOUBLE BOTTOM with very big MACD divergence. Fundamentally , they seem to be doing good, but it sold off with some troubles with their Mines in Greece – Action was initiated by Greece’s Ministry of Finance and Ministry of Environment and Energy (the “Ministries”) against the Company’s subsidiary Hellas Gold S.A. They are currently trying to work things out. If they do, this will fly. If they don’t, The rise in Gold price will probably still pull it higher as a lagger.
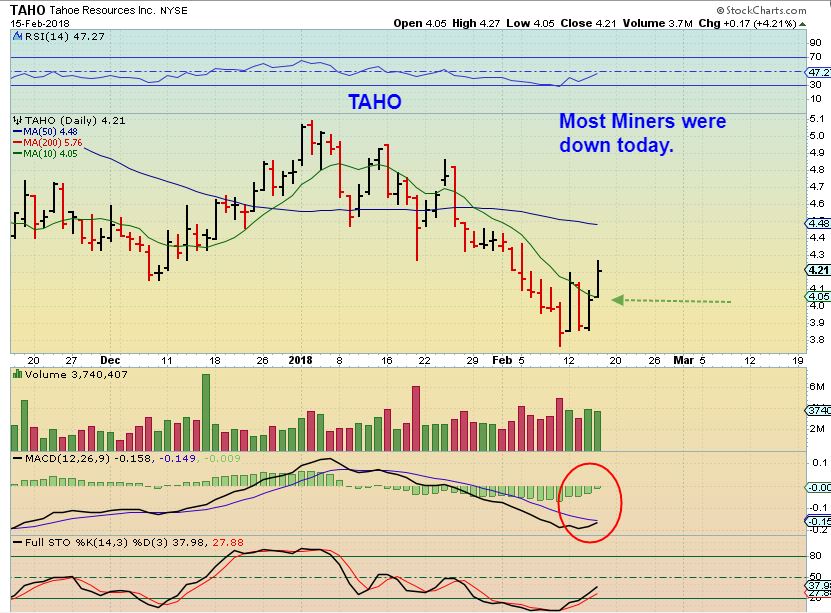
TAHO – Rising off of the bottom, it had good volume, broke above the 10sma, & ran higher on a day when Most miners were down.
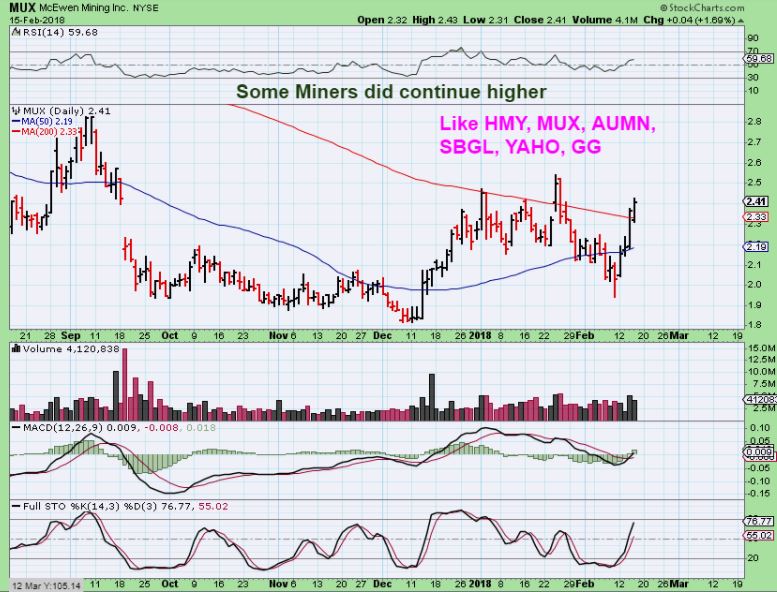
MUX ( & honorable mentions) – Please read the chart
TECH
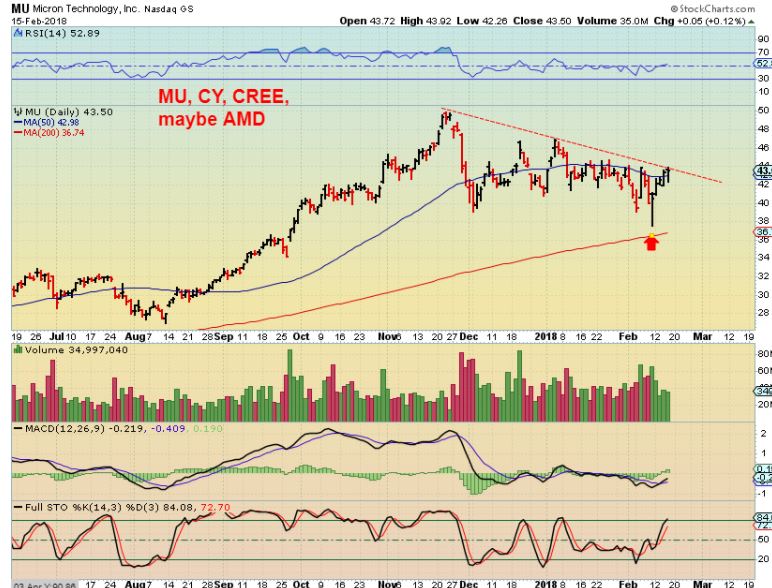
MU & The Semiconductors are bullishly aligned. The General Markets look good for now, and many stocks also look to have based out and could be ready to run. This one Runs strong.
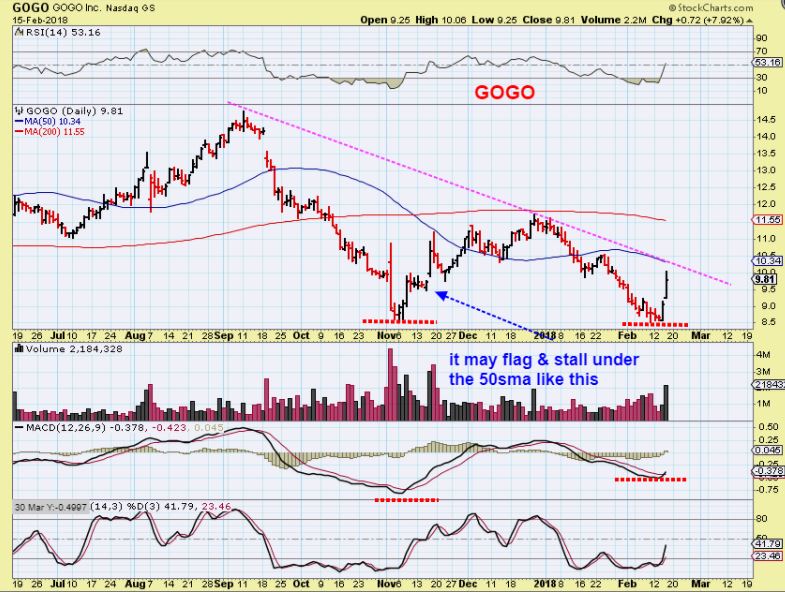
GOGO – Another double bottom with divergence. Might be best to wait for a break out (Watch list)
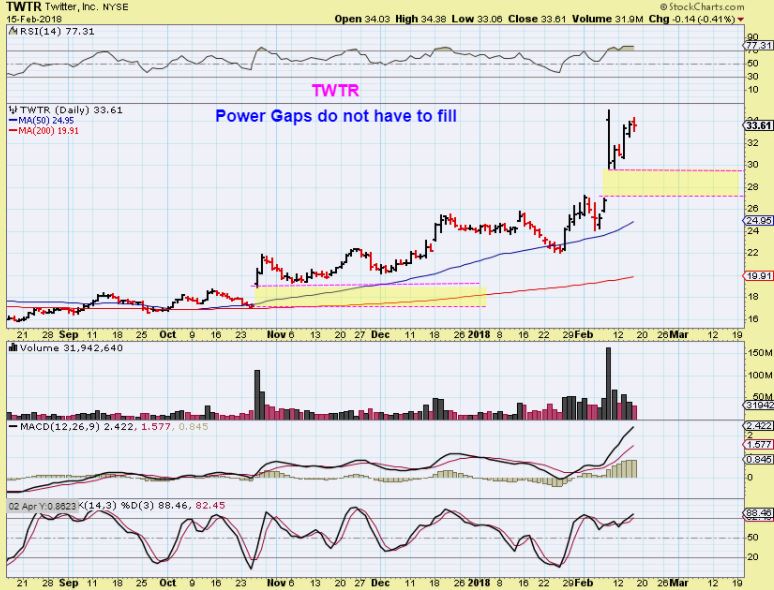
TWTR– I have been saying that TWTR could become the come back kid in the same way that FB did. I love the base and have pointed that out too. From last summer, I pointed out this base as it ran from about $15 to $20.
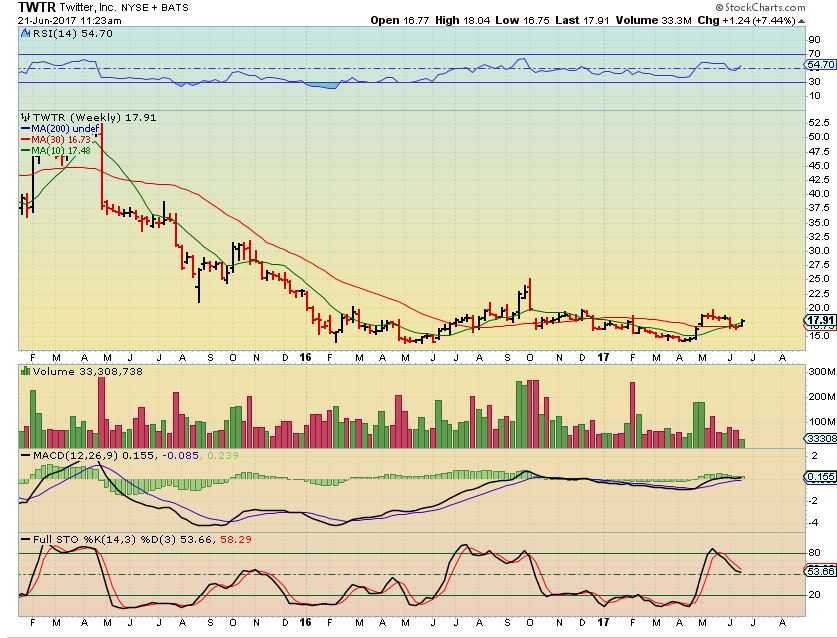
TWTR – Then last month it popped and was at $25. The reason I am discussing this again is…
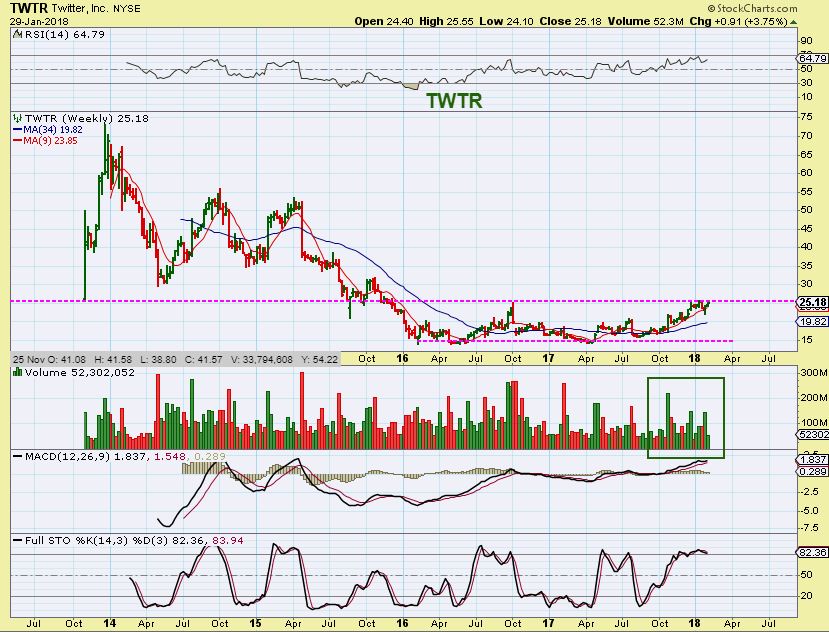
TWTR – To show that at times a company has excellent news and GAPS open and never fills the …what I call power gaps. Again though, why an I showing you this?
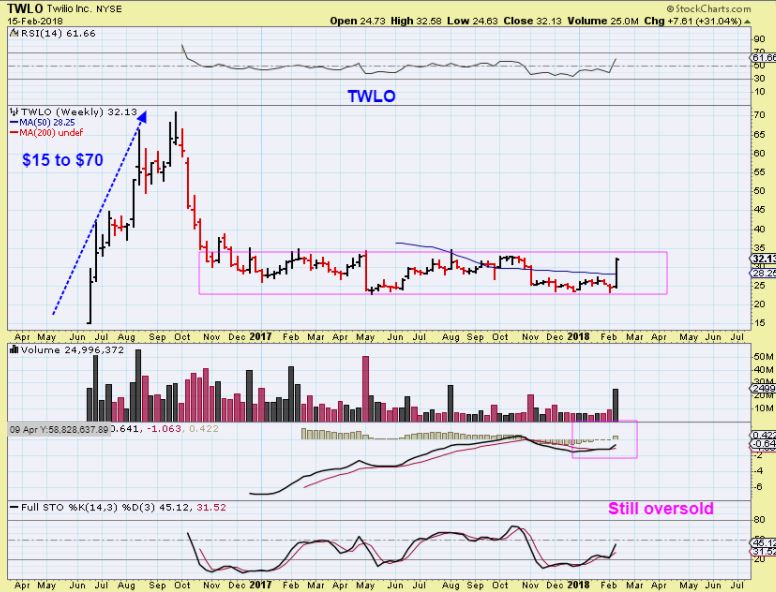
TWLO WEEKLY – A great base, but TWLO gapped up on the daily too, similar to what we have seen with TWTR. The weekly chart is a thing of beauty, but I do hate the gap up on the daily. So the choice is:
1. Either wait & buy the gap fill if one happens ( See a daily chart) , or
2. Buy a smallish starter and add along the way.
3. Or put on a watch list like I have. I have been watching this for a long time. 🙂
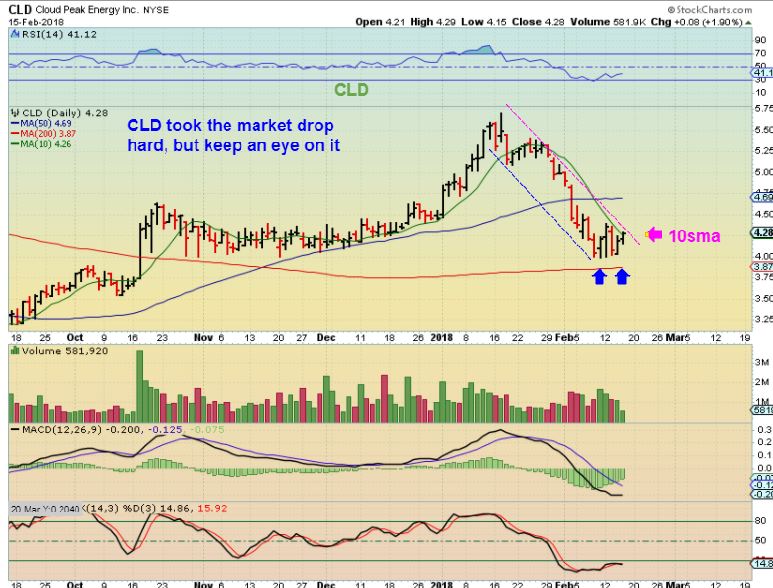
CLD – CLD fell apart with the market sell off. These stocks are starting to run again, so a break above the 10sma could be considered a buy.
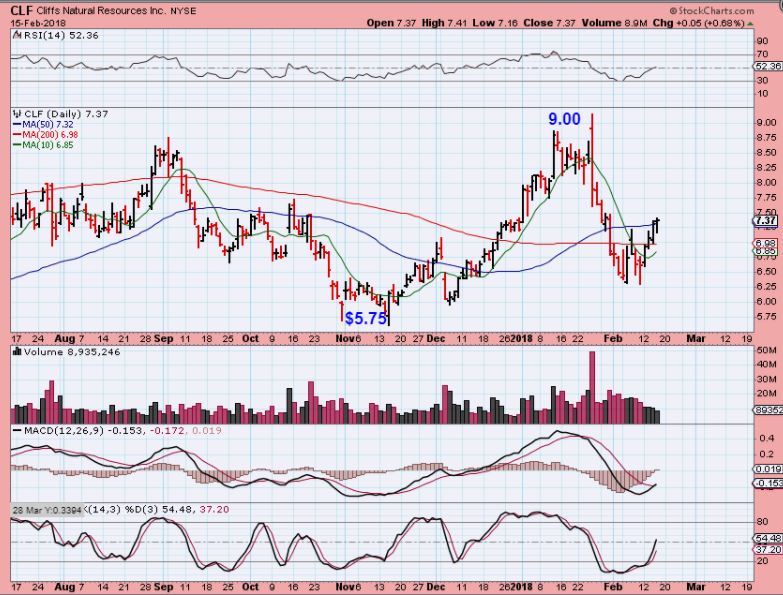
CLF – CLF is recovering too. It moves nicely under bullish conditions and probably overdid it during the market sell off. This looks good even for just a 1 – 3 week trade.
GGR– This stayed bullish in my opinion. It looks ready to break out soon after consolidating an excellent run in November.
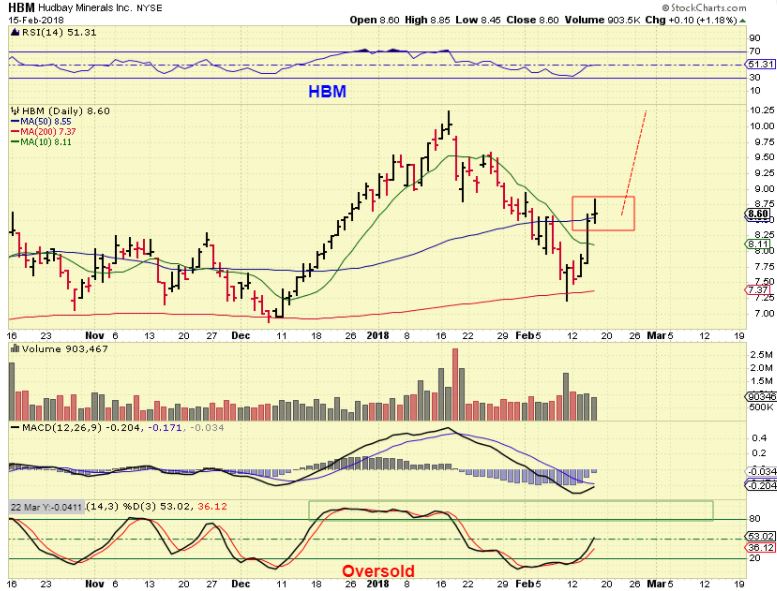
HBM – This Copper stock also ran very nicely in December, but almost gave it all back in the market volatility. After tagging the 200sma, it is breaking above the 50sma and I would buy it. Notice that in the last 3 or 4 days, it gained roughly what took about 15 days on the Dec run higher.
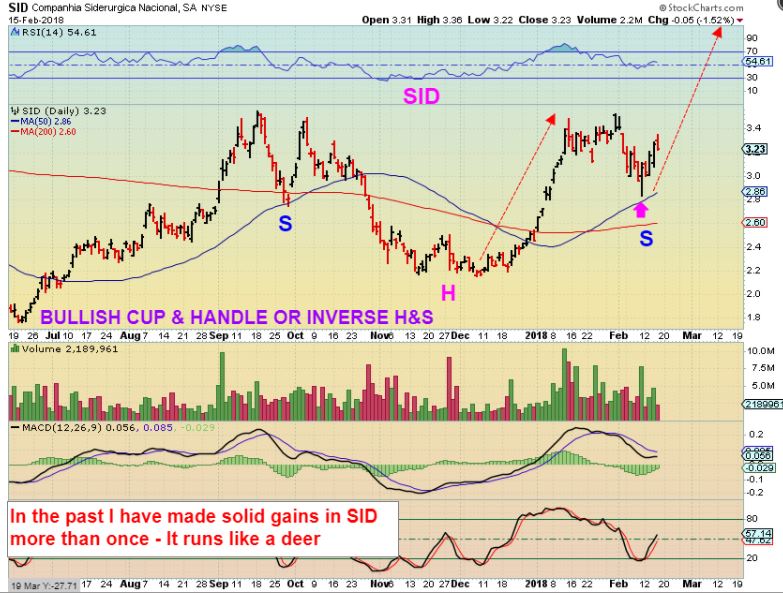
SID – I have enjoyed this runner a few times since the 2016 low. This now looks like a monster inverse H&S or a large Cup & Handle
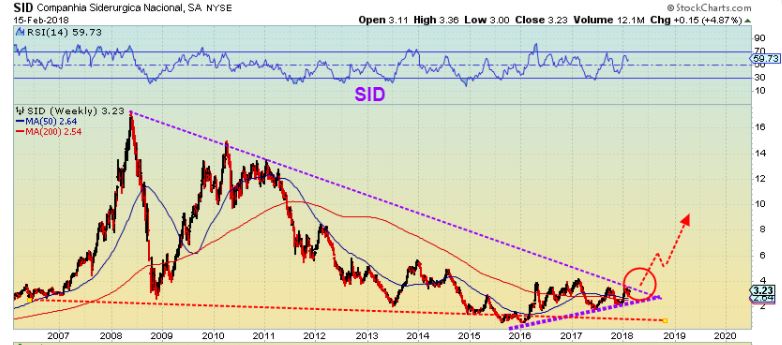
SID WEEKLY – Yes, this will take a while to recover former highs, but the big picture shows that it has been in a large base. It looks ready to break out.
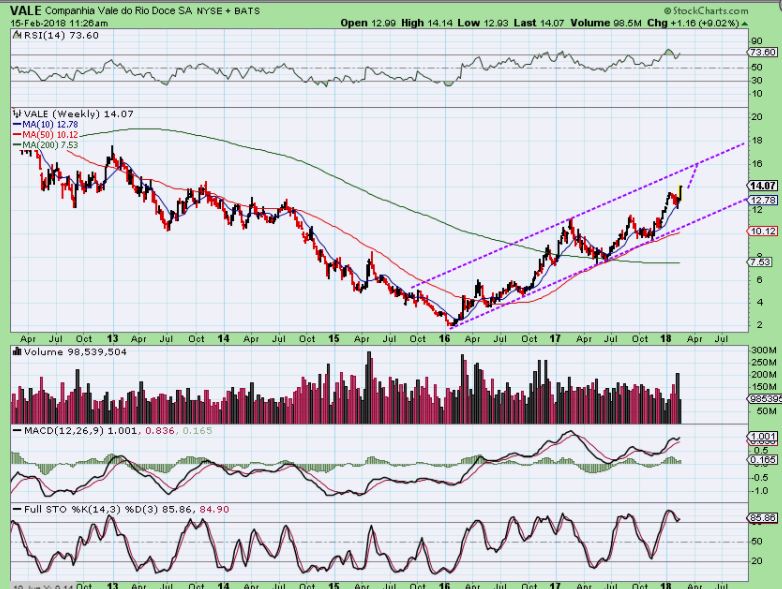
VALE – We were buying VALE, X, AKS, CENX, FCX, AA< etc etc out of the 2016 lows, and at other times too. One of our readers bought VALE at $4 and asked what I thought a higher target might be so she could sell a portion of it (Congrats Nancy, nice trade! 🙂 ). If you still own it too, this is what I am thinking, but I like many of these even longer term too.
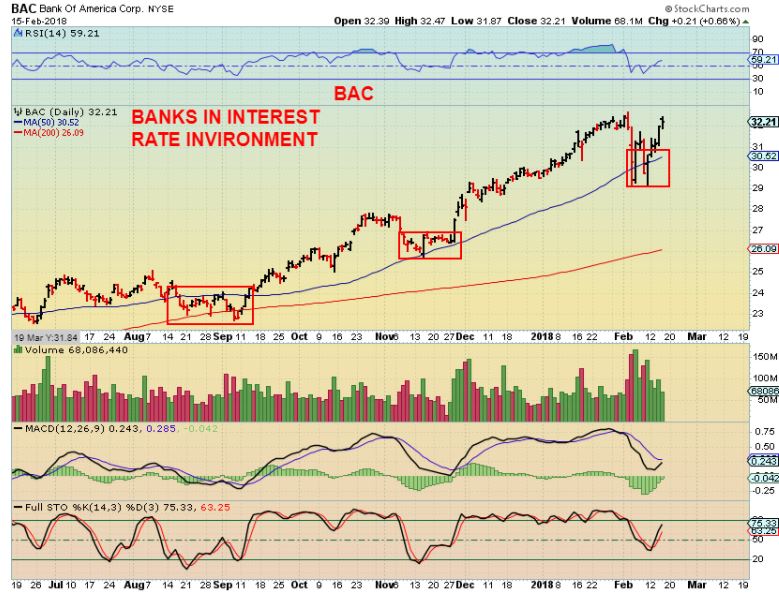
BAC – Last summer I wrote about the BANKS as being bullish in a rate rising environment. You can see a BASE, a RUN, a BASE, a RUN, we now have another base. What is next? See also JPM, similar chart. GS too.
Some may want to skip this final part of the report: I have been watching the charts of Cryptos regularly and Block chain companies. WARNING: THIS IS A HIGH VOLATILITY AREA WITH MASSIVE SWINGS %-WISE. IT IS ONLY FOR THE EXPERIENCED AND THOSE WHO CAN SELL IF A STOCK GOES AGAINST THEM.RIDING THESE DOWN CAN DAMAGE AN ACCOUNT.
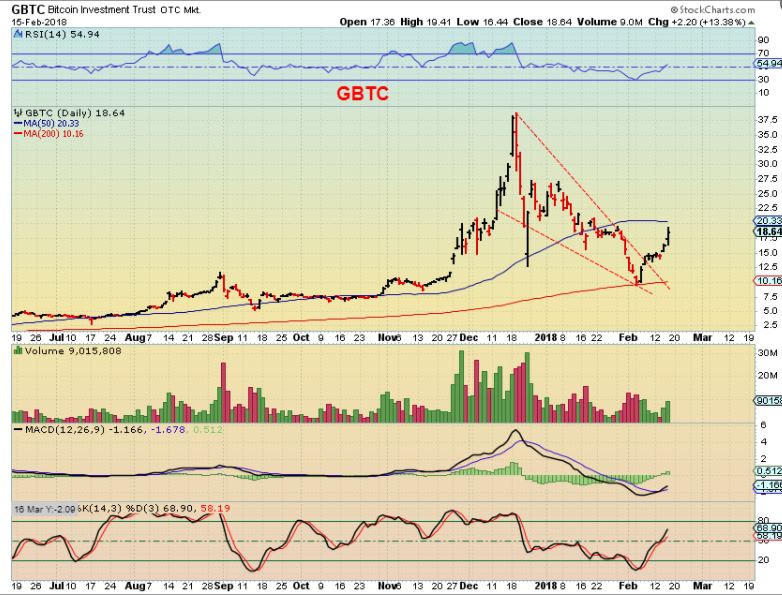
So BITCOIN is finally starting to look good, but RIPPLE and ETHEREUM are still a bit off. That makes sense, because I think that Bitcoin started selling down first, and may lead the way higher when the time comes too. So I have been watching the old Block chain trades and some are starting to give a more bullish appearance after selling off. I wanted to start by pointing out technically what I am looking at in the charts, in case we start buying later…
GBTC – This actually bounced right off of the 200sma and headed for the 50sma. It doubled just doing that. I want to see how it acts around the 50sma, these seem to be acting correctly, as you will see.
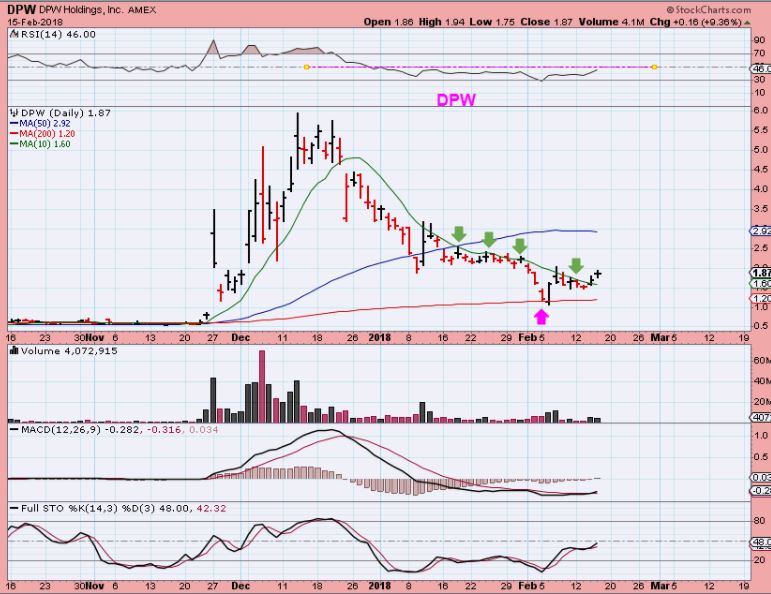
DPW – I have been waiting for these to break above the 10sma, that is key. The MACD is curling up and volume is starting to increase too. A few have started acting this way, and DPW is one of those. It also bounced right off of the 200sma. They are acting correctly.
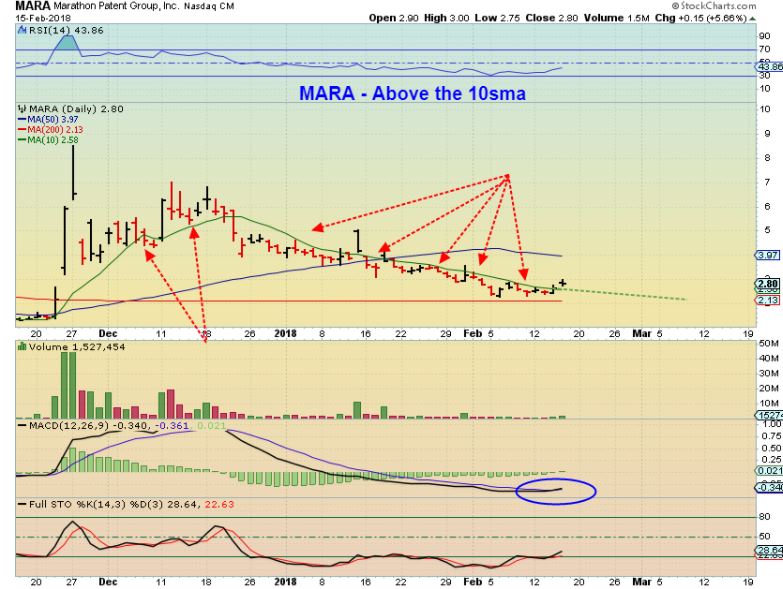
MARA – Mara also bounced off of the 200sma and is above the 10sma. These are acting technically correct.
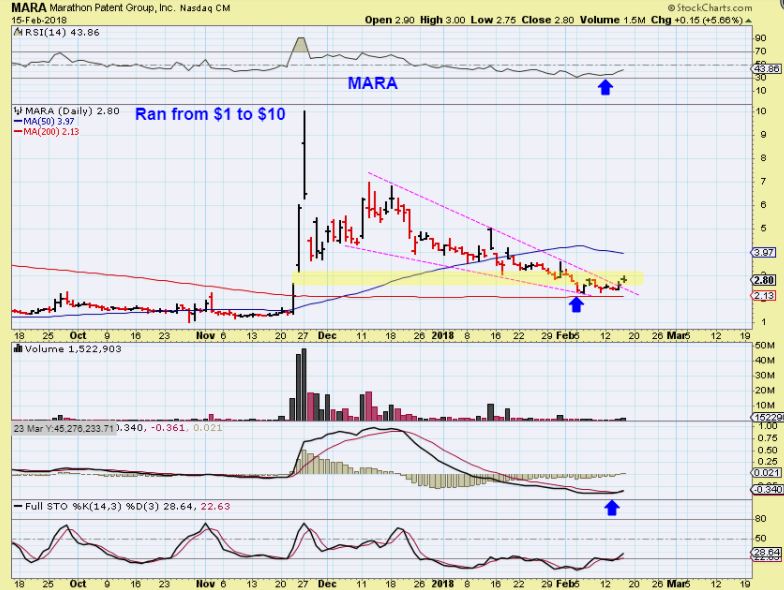
MARA Closer shot – So MARA has moved above the 10sma yesterday after bouncing off of the 200sma, we’ll have to see if it can stay there this time. If so, it could start rising to the 50sma, which is a 100% move off of the 200sma.
RIOT – Riot dropped to the 200sma ( almost) and broke above the 10sma where it began to rise toward the 50sma. It too has doubled in 2 weeks.
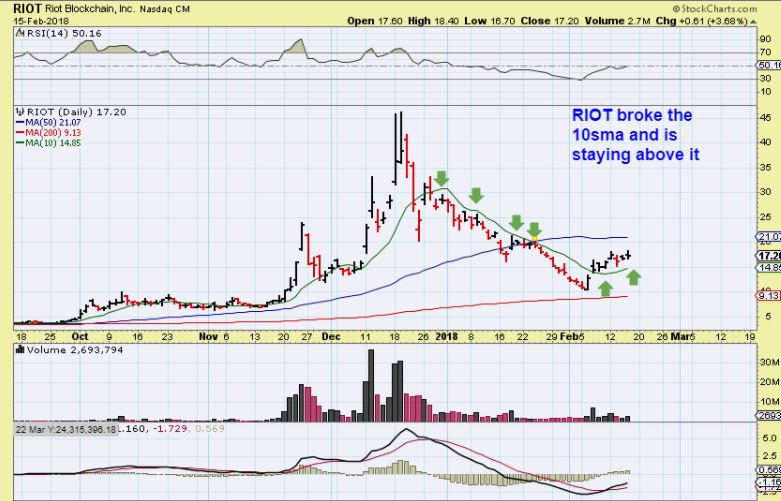
CONCLUSION: SO I HAVE BEEN WATCHING BLOCKCHAIN TO LEARN FROM THEM. THEY MOVE RAPIDLY, BUT SO FAR FOLLOW TECHNICAL PARAMETERS. PRICE BOUNCES OFF OF THE 200sma ( Buy?), THEN IT CLIMBS ABOVE THE 10 SMA (And that might be a buy or place to add), and they tend to move toward the 50sma. That can be a big %-Gainer at times. I have been watching GROW, MGTI, SSC, SRAX, RIOT, DPW, etc . to follow this pattern. They are safer above the 10sma in my opinion.
FINALLY …
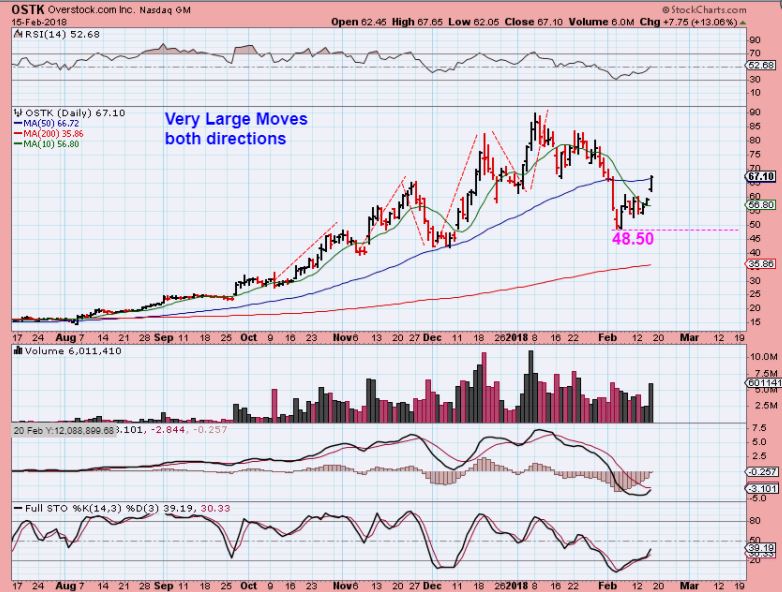
OSTK – Back in January I warned that this one ( Everyone wanted to own this one) was doing excellent, HOWEVER, it gains and loses $20-$30 in days. I was warning about the dangers of the ‘dips’. See the chart. Days later…it fell from above here from $85 to $48.
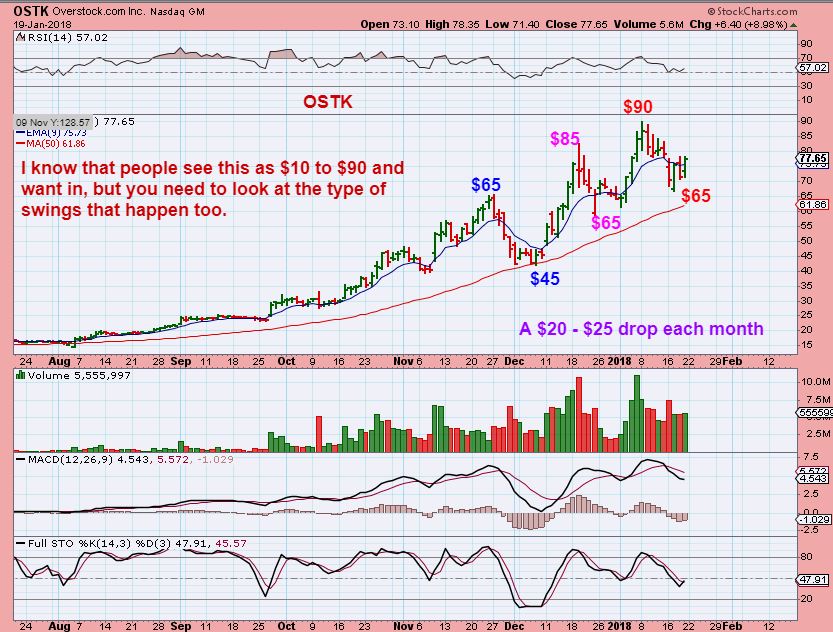
OSTK – Now that you know what you are dealing with, OSTK crashed with the markets, based out, and recovered the 50sma yesterday with strong volume. BUYER BEWARE, but it may run to $100 now.
I am pretty much loaded up in Miners, with the exception a couple of other stocks like ENPH, POTN, and APRI ( Thx to Chuck for APRI). NVAX ( below) is very tempting too. This above list should keep the ‘traders’ busy on this Friday. Enjoy your trading Friday and your weekend!
~ALEX
.
NVAX DAILY – NVAX looks like it is breaking out now and…
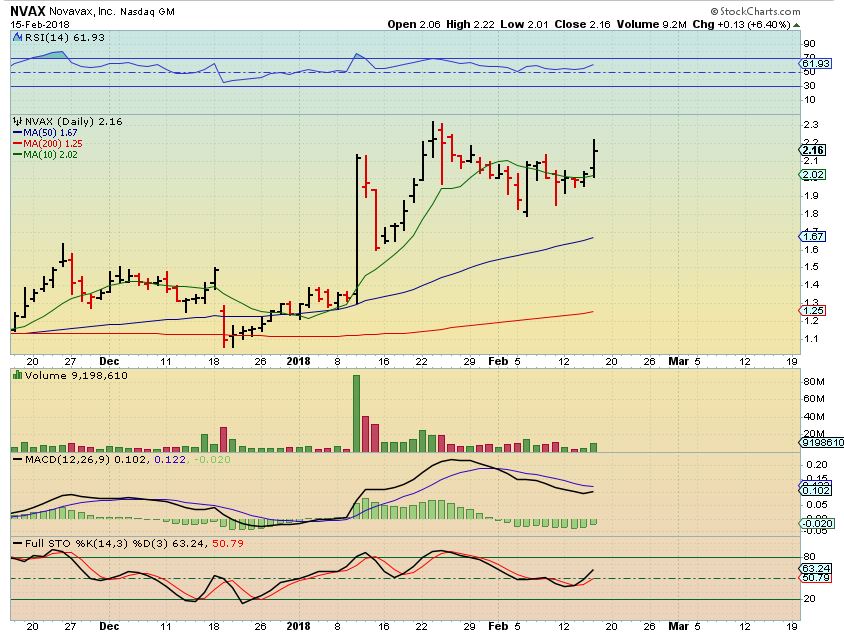
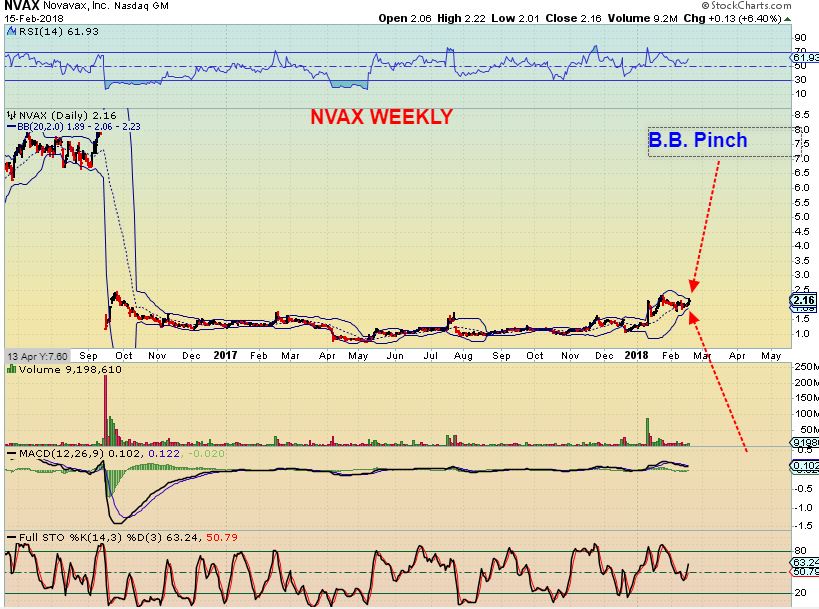
NVAX WEEKLY – The Bollinger band Pinch is tight & RSI was at 50%.


https://uploads.disquscdn.com/images/d8104f3da04b00507c5e6885761659be52cb837caf70dced3799521b677daae0.jpg
Great report! Appreciate the directness and clarity!! Is the last chart and the one above showing JNUG, 15 minute charts over 7 days?
Hi 50,
Were you able to get back in some miners? I´m not as heavy as I normally go in this group, it was tough to do a 180 degree change in just a couple days, but made easier by the fact I was already a firm bull on miners. I´m eager for a dip to add.
Yes. Very small amounts of VGZ, NGD, SAND, TRX , AUMN, and NSRPF. I also have small TQQQ and JNUG.
Hey H50 – Thx – Each block in the charts mentioned is a day, and one is 30 minute, one is 15 minute
Stay long miners, buy/add dips. Glad CF got me turned right side up, and long my favorite group to trade again. That recent pullback really confused me, not happy about letting a majority of my shares (and profits) go into the weakness, but I´m back on track.
When we finally break out & run ( similar to 2016) it’ll just be a distant memory 🙂
Gains will be very good at that point
CF felt like a morning workout…completely out of breath with all those charts! Thx for the great work. Bought a smallish tranche of AUY yesterday…no beuno (didn’t realize earnings). Oh well..back to the drawing board.
So for AUY – I actually got 2 emails plus your mention of it, I’ll just post a couple of thoughts here…
refresh
AUY earnings released and price dropped 20 + cents last night. RIght now, I only see it down 11 cents, and that isnt bad ( 3%). BUYERS might be stepping in pre-market to the rescue.
On this chart, it broke out & back tested one area, but if it sells off now, it could drop to what looks like $2.80ish to back test another area . I Do not think that it needs to do that, and it might GAP DOWN and then slowly recover with buyers stepping in, especially if Gold went higher today.
There is no way of knowing if the selling will pick up or dry up on a market open, so one would have to decide
1. ” Do I want to risk it, with a stop somewhere & see how it plays out all day?” Or
2. “Do I want to sell pre-market – take the current price, and maybe get back in if it recovers knowing that the earnings are already behind us?” or
3. Move on.”
https://uploads.disquscdn.com/images/52324d1d10263239d8ee36dc611aaa26748c93236a755a01e6728356dd8a7e04.jpg
Thanks Alex, clear report!
So Bill
You were looking for a longer 1 month buy & hold. MU ( Chart in the report) Could break out from recent consolidation, and it ran very well last year. You may find another in the report.
TWLO is a great chart longer term, but the daily is choppy & has a big gap, so I am waiting for a bit on that one.
I did see those, and I couldn’t help think you were talking directly to me. I didn’t follow your advice with TWTR and that went higher. I may jump into MU.
Gee gosh things are starting to look kinda bullish aren’t they
😉
I have been thinking similarly the next leg thought on Gold – next 4-6 weeks could be hot
uggh APRI …. 😡
sorry guys…
ACTUALLY – we both got out, we knew the report was coming out & they had failed it before, BUT…
I had an A-B = C-D price target of $3.20, so I sold at the close. Chuck got out also knowing that they would report about their test drug (cream?)
In the report what I meant was that I was basically just loading up on Miners only – BUYING ALL MINERS, except for the others APRI, ENPH, POTN that I bought and traded too ( I am still in ENPH & POTN) . I was eyeing NVAX with my APRI money
see chart
https://uploads.disquscdn.com/images/9de78dbea56e87ae7d3c4e1a65594711c26dfec01d9b15d9398dc6fb2d2916da.jpg
oh phewwwwww :o)
my heart sunk a little there….
I didnt even see it until he emailed me and said they released early – yikes!
I thought their chart ( long term weekly) was great, I was going to jump back in after the release. It got absolutely crushed.
I usually will NOT stay in a biotech if they are releasing news, FDA trials, etc. It is always BOOM or BUST!
It as just lucky getting out on the a-b = c-d tag, because I think their report was due out later
So Alex, what do you make of the pre-hours pullback in JNUG? Thanks for your thought here
Hi Paul,
I am not really expecting a straight up move, that is why I mentioned that it could bull flag here or go sideways (And I drew the square in the GDX chart). The chart looks good, and price can trade around. We are well off the lows, so at this point It is just normal movement.
Good morning, Alex –
The US$ is up $0.75 from its overnight low
Think dollar strength may weigh on miners today? …something worth watching? …or just noise
Dollar up, Gold still slightlygreen, Miners within the box that I drew in the report, looking like a bull flag
Options expiration, I’m expecting volatility.
Thanks, Alex – I added in the first 5 minutes (which is unusual for me – I usually wait for opening jitters to pass) thinking it provided a close stop for the added shares.
Now sit and watch – probably should go ride a bike… until Tuesday
LOL- Thats a LONG bike ride, but i do expect this higher into next week.
I added some more a few minutes ago, too.
Me too.
lol! mostly red but EGO green…go figure. 🙂
There goes NVAX ( last 2 charts in the report)
i jumped on board, 2.35….i like that huge gap, will hold at least a week or two to see if it goes for a fill (or partial 😉
I missed it 🙁
I was going to use the APRI funds , but I missed it for now- added a bit more to my to ENPH instead, kind of looks to be flagging over toward the 10sma again
Added to ENPH
ha!
same
Kind of flagging sideways
Deos anyone know what cycle we are on? DC #2 Im thinking? https://uploads.disquscdn.com/images/029b03c008539d25faac6ec5967745c46c6abe495e3e69444e7612641381fc33.jpg
https://uploads.disquscdn.com/images/469a5912966dec234a68e7f339fa1e3e3d5da8e08e741f2eec5f997aeeb054aa.gif
Yes, Gold had a right translated first daily cycle, expecting a higher high on the 2nd daily cycle over time
Alex do you ever try to forecast when the next ICL will come our way?
Yes, when the time is right.
I do it in the reports, and in a recent report I mentioned the next one possibly in May or June.
In September / October I was discussing an ICL coming due in November or December, but there are variables along the way that can affect the timing. Daily cycle lengths affect it, and how many daily cycles you will have ( you can have 3 long ones, 4 average or even 5 average) .
It has to play out and often is dictated by sentiment.
For GOLD it used to be ROUGHLY every 6 months, but now we see 4 month runs, 7 month runs, etc
Awesome thanks.
Investigative CNBC report on RIOT. I wouldn’t be surprised if the SEC gets involved. Dicey. Hold at your own risk.
https://www.cnbc.com/2018/02/16/public-company-changes-name-to-riot-blockchain-sees-shares-rocket.html
So True, caveat emptor
It’s funny, back in early 2000’s, companies started changing their name to ‘GOLD XXXX’ or ‘Something Mining’ or ‘XXXXXexplorer company ‘ too, when Miners were flying higher. They were not ‘listed’ companies, they were OTCBB so they got away with it for a while. The SEC didnt get involved.
With Blockchain, The best one was probably that Long Island Ice Tea turned Blockchain company – and it shot up to the moon.
When BITCOIN was heading to $20,000 – everyone wanted to say that they were cool and involved with the latest thing – Mining bitcoin, etc. Thats when all these stocks really started ripping higher, just because they had blockchain or bitcoin associated with it. The Hype. It is true that many of those claims were blowing smoke.
RIOT stock dropped good today, but I dont know if it is the CNBC story, or that they are discussing purchasing another ” 3,800 S9 Bitcoin Miniers” . They released this story this week too, maybe it might make them more legit and refute whatever CNBC was reporting about the SEC, in addition to the other purchase they made to become a bit coin miner. I guess so far that is a costly mistake that they made.
As you said, “At risk”
https://www.marketwatch.com/story/riot-blockchain-enters-definitive-agreement-for-the-acquisition-of-3800-s9-bitcoin-miners-2018-02-15?siteid=bigcharts&dist=bigcharts
Down a nice chunnka change on AUY – but holding thru this mess… Went Long AMAT at 54.75 – makig up some of the losses for now
Out 55.65 ill take the win..
Placed a bid for JNUG at 14.01, off to go snowboarding.
Where are you?
Breckenridge, CO, last riding day of trip for me.
How is the snow? I’m headed out in a couple of weeks
Snow is great, had a great powder day yesterday.
That’s great – have fun!
That break away Gap & run in HMY is not quitting.
Shh..;)
STEEL stocks looking pretty good
X, AKS, STLD, CLF
CLD went Thud, but that was NOT a buy until it broke above the 10sma, and it never did
You recommended SID Yesterday.
yes, I like the large cup & handle on Sid
When I wrote this, they were barely up- X and AKS took off on news of the new tariffs proposed on imports.
CLF & STLD looking good too
Very nice 3 month charts
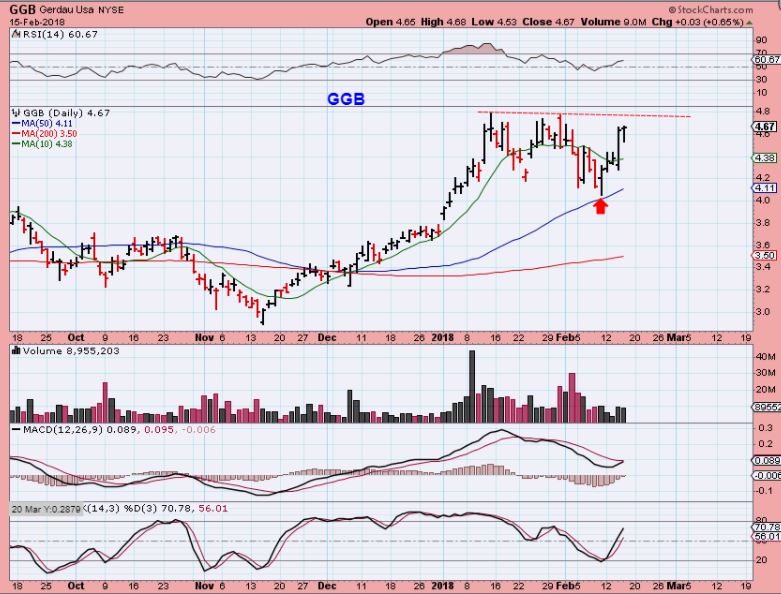
GGB – also mentioned, looking great
TMST – not mentioned this time, aslo moving higher
pretty lousy MJ day. I cut out of Aurora a few days ago as the momo waned, did not expect this tho….looks like they are heading quite a bit lower, time will tell – if they get oversold again I will be looking
Yeah,, CANN breaking at resistance channel as well. Should all be on sale soon enough
NVAX ooooohnice call CF – if it can get into the gap who knows
Looks good!
is this option expiration pain mentioned? buying opportunity!!!!
Market closed Monday? Im havn a brain cramp….
20 or 30 percent day in JNUG?? I hope it’s not today
Ehhhhh …. I stopped out quickly.. was happy to snatch profit and sleep well for the long weekend…..
Buttt thennnn ……… I couldn’t resist jnug in 13s??
Kill me now
BadMariaVacaTrader
i’m still holding from 12.62 stop 13.30 woulda shouda couda had a closer stop I guess.
Wow… I always sayyyyyy im gonna hold …buttt then the lady at the gate of MVF gets to naggin at me for her share….. that’s one beotch im happy to obey ….
Giggle….
I believe it is
Added some GDXJ here.
KC, Thanks, you woke me up from a stupor and I bot more JNUG. And it’s up now.
GDX back to it´s 10 day MA, adding some miners here.
right move!
What the heck. Added to ABX, NSRPF, NGD, AG and AUY for cost averaging.
Alex……in the GDX chart above
, you indicated $30 as “max pain” reading for GDX. Can you clarify what that means please?
Great spot to load more leverage…………..Added NUGT
Is no one concerned this is the start of a LT daily cycle in gold? I’m still in miners, but remember we got caught the first time. I get we are early in the daily cycle and the dollar still has room to run, but this seems like a big drop for a pause or flagging period.
*big drop in miners
I admire the optimism show on our site but I’m hurting! I’m up to my gills in miners that have folded.
Didn’t we have a 2-day cycle in Feb last year?
I try to be vigilant, but boy this is dizzying lately
Think the market makers will get GDXJ back to 33 for OEX closing?
MAX PAIN would argue ‘yes’ 🙂
Usually I hate MAX PAIN, but I’m rooting for it today
#badboy
Meow
Eying nattyyy …..
Yeah, what the heck just happened. Expected some pullback but not a clubbing to erase Wed candlestick. Not a warm and fuzzy feeling, for sure
I’ve been pondering if this is a 3rd DC…CF is the expert though. Not a DCH by any means and definitely early but I took my chips off the table. IF last DC was LT then I think this one would not be expected to hit a high and yes would also be LT. I tended to favour CFs alternative of testing the lows which was in a report some time ago…maybe that happens earlier than we think.
I suppose the good news is that GDXJ stopped dropping above it’s 10-day MA, and SO FAR the move down looks corrective (good ol’ EW can change in a heartbeat though)
The volume is much lighter than Wed up volume so far!
5 min GDXJ chart says rally into close
just another options expiration shake and bake brought to you by your friendly neighborhood big boys
Ok, so we have a buying opportunity here not setting up for another clubbing next week, right?
that is my belief yes, Sticking to the story
CF you weren’t kidding when you said bulls are hard to ride!! All ready feel the chaps burning..
Charts will tell you that coming out of the lows, volatility is not uncommon.
Anytime there is a dip, fear will take over, but the 10sma wasnt violated, and in the past, these even recover going into the close. We’ll see what happens today.
REFRESH – CHART # 1 . We are seeing a $1.50 ish drop today- IMAGINE WHEN Day 7 had a $3 drop in GDXJ last year
Chart 2 – Todays drop looks like a test of the 10sma, very light volume vs the run higher. It is OK so far
JNUG IS BOUNCING NOW- if this was too much to hold to be able to sleep at night, you could “Lighten up’ on the bounce.
So far this isn’t out of character though.
https://uploads.disquscdn.com/images/0d356cb7e205a175592a3cf4c4c83d9129d831bdb89092034dedbf04d9d105a5.jpg
https://uploads.disquscdn.com/images/8596cc2761e39efd70ffac773d7024fa6a4eed307a5b2c0cc7fcbc0d95e8792a.jpg
Yes..that light vol was my tell ….
Giddyup
CF any thoughts on US dollar … might have a swing low?
Sorry David, I missed this comment.
I cannot rule it out, but it is not confirmed and I do doubt it.
All I can say is that we have bounces on the way down, and dips on the way up.
Until it gets above the 10sma, it is a swing, but it is probably a 1/2 cycle bounce.
I still see things the same until something violates parameters, and GDX & GDXJ stayed above the 10sma – they actually can break below and still be ok, Gold is near highs and the USD is near lows.
This is a little more than I expected, I got my limit order filled. This is a blip, Im convinced we will be at a new cycle high next Friday.
Sure hope Mr. Bill is right. I want to go on a cruise one day, too!
Cool as a cucumber you are Mr. CF.
The first several times I ride this roller coaster, especially when they grease the track with 3X leverage, I may have thrown up all over myself
The next several times you just try to hang on and enjoy the ride. IT IS NOT EASY, but I have done this drop
early in a daily cycle before and sometimes it breaks down & stops you out, but most of the Miners charts I am looking at are relatively normal.
I wasn’t even aware of this dip in Miners – lol
I was watching CNBX, they played that story on RIOT BLOCKCHAIN.
That was actually a great story, and even though RIOT claims to be buying some more BITCOIN MINER S now, and they bought some before , but lost money on it- they seemed VERY Shady in that story about the depth of their intent before the SEC started watching them.
They apparently have done this with another company, changing a company name & business model, and watching the stock ramp up, then they sold 100,000s of their own shares ( probably knowing that earnings wouldn’t live up to the hype).
If you get a chance & care – it is probably on video on the CNBC website
it is a scam, bad people…it will drop back to 2 bucks in time…not good news for other cryptos, I will bail DPW at first sign of weakness next week
Only one to play until a better vehicle comes out is GBTC for me
Actually they are playing that story now on RIOT again.
I WILL NEVER FORGET THIS FOR AS LONG AS I TRADE.
I show my readers and they honestly think… “I could have easily stayed in, it didnt break the lows”
Easier said then done, right?? Refresh
https://uploads.disquscdn.com/images/7f516258a37acf4aee08db4368059c11c5faf37cbab6bed2f893f0e4b493e733.jpg
AND THIS IS NOW- WHICH ONE LOOKS NORMAL, AND WHICH ONE IS SCARY
REFRESH FOR 2 CHARTS
https://uploads.disquscdn.com/images/7f516258a37acf4aee08db4368059c11c5faf37cbab6bed2f893f0e4b493e733.jpg https://uploads.disquscdn.com/images/edda5b28d51d8402aa7c620b5d499c221fa58e3c8be15205e321f42374fe073e.jpg
The first one is more scary.
Thank You = )
Dude, if I can pick the scary one, you know we have something! #RealLifeFearBarometer!
Markets in US are closed Monday.
COT report http://www.cftc.gov/dea/futures/other_sf.htm
Check out HL, obviously the little rebel of the group = )
Wow, just noticed AUY down 10% – probably mentioned already, but I’ve been distracted
VGZ got smoked today too. Down 9%.
But yes, HL holding strong.
Weird, but it did that same thing 5 & 10 days ago.
Is it going to do that every Friday?
yes, Earnings last night
Right now it dropped below the 50sma, but looks like it is trying to get back above it. That would be encouraging
I wonder if GDXJ needs to close below 32.5 to void that strike price. I don’t know a lot about options, though.
Ok, that’s it. In 3rd and final tranche for miners this time around. See you all Tues. Need another huge RIP upside next week!
FINAL 5 minutes to unload a little on this bounce if that volatile dump made anyone feel that they might be too heavily invested.
I haven’t sold anything, but honestly I did get in lower. That would have been MUCH harder to ride if I Bought JNUG at this level,
so you can decide now – we are closed on Monday…see what happens Sun to Tuesday & get back in if all is clear.
It is just a choice that one may want to make,
Still under water but you know better than me. I’ve held since that flag broke down in DC#1 and added along the way. What the hell; if I can hold through that washout last Friday, I can do this. Have a nice weekend everyone.
no doubt THAT was a memorable drop for your trading story telling, especially if this blows higher and you can say how you rode a cut wrenching drop & made big money on the other side ;
Have a great weekend!
OR lighten up in after hrs.
I’m holding. Positives: 10 SMA retest and hold, low volume, predictable Fib retrace level. Negatives: that was more overall percent than I am comfortable all right at once. Some juniors really got drug through the mud, albeit on lower volume.
CRAP – I posted GGB in the report, and meant to post this earlier and got side tracked
refresh- it is a really good looking break out on the 1 yr chart too
CLF, X, AKS< STLD< etc all looked excellent.
https://uploads.disquscdn.com/images/03c9627c44479d516d9d11aa357302b986a9b5c07ac2e68f868f6825c0e495bd.jpg
Worst trading day of my career. Not money wise, I actually made a good deal which is totally odd. Instead of riding the trend on X and AKS, I spent the day shorting its dips. IDIOT moves, very upset with myself – broke a bunch of rules but came out negating the AUY hit Im currently taking…
…. what made u want to short ..?
I missed the big run up and hate trying to play the smaller waves up… so my idiot self started shorting…
.. a sooooo revenge trades?
write that in ur little black book ..
*spankings4u
lol done
Crap I was out skiing and my stop for JNUG was hit. Maybe that is a good thing just in case it misbehaves this weekend. Out with a nice profit, but definitely not what I had planned.
Breakout from a multi-month ascending triangle in the gld vs gdx – ratio, meaning gdx is about to underperform gold, usually bearish for both:
http://schrts.co/zQhT2t
(Something similar is visible in the spx &oil vs gold -ratio).
Short term, next week is new year vacation in China, and hence all the chinese, and also many japanese, korean etc east asian traders/buyers are away…
I do see the correlation and is definitely something I will follow but it seems it may be getting turned back at the moving average, which would bode welll for miners, Time will tell. Something to keep an eye on for sure.
I’d like to the chart of the spy/oil gold ratio you have as well when you have time.
The oil vs gold chart (weekly)
http://schrts.co/tWKrCD
Reversal formation.
Spx/gold (weekly)
http://schrts.co/BGbfBN
Seems it has broken out of a cup-and-handle and now backtesting. But here the rsi has bit negative divergence whereas on the gld gdx weekly ratio chart it is strong and confirming.
However, note the massive breakout of gld vs gdx in the end of april 2011. After that gold went parabolic and gdx rose impressively too, but not as much as gold, so they may temporarily rise together, but it was a pre warning of the impending end of the bull.
Silver vs gold also started laggin at that same time, just as now.
However, gold vs spx was stronger than now at that time.
-Slv vs gld looks to be breaking down from a reversal formation? Now already below the recent double bottom:
http://schrts.co/rE5Psp
So how are you playing this call? Are you shorting here?
I’m long Aumn, 15k shares. (The interesting thing about them is that at Velardena according to the prefeasibility 2015 study 7.5 mill lb of zinc and 5 mill lb lead + iron, can be produced yearly, however this is under the radar of everyone. W zinc up 0.8 usd a lb and lead up ~0.5 usd + iron also up since that 2015 study their profit ex silver and gold – just on basemetal offset – will increase 9 mill usd a year, i.e almost 1/4th of their current market cap!
So Velardena may soon be restarted w pleasant surprises.
Try download the 2015 prefeasib from their homepage, the yearly production table is toward the end of the study, see if you agree? Mentioning this since you have (wisely, imo) highlighted Aumn.)
As to those ratio charts, discovered them just very recently. Don’t like what they show, still contemplating entering a Dust position on Tuesday just in case..
So the first ratio chart in your first comment – the thing that I didnt like to see was as a Bull ( I’ll call it a double top in 2015) the double top had very bearish divergence at the 2nd top in 2015 , before dropping down. So thatt was bullish for Miners .
The peak that is there now, as you mentioned, has RSI rising. That is not what I would like to see, but what I did was zoom in an it looks like at this point, maybe it is turning down at the 200sma weekly.
Last weeks Drop in Miners with Gold holding up likley caused that peak, not we would need to see Miners run higher next week.
I’ll attach the close up of GLD:GDX , it needs Miners to rally to keep this turn downward going, but again, That RSI was a bit strong.
https://uploads.disquscdn.com/images/2a9a7b020a8f43e3b9e25a6ed37344dc6ea3f8f77e21de5aeb7f7f0a84317499.jpg
I am still long AUMN too, will check out there page, thx
But you saying that you are contemplating a dust hedge- That is a good idea if we get more downside drop next week. I still like Gdx & GDXJ bouncing off of the 10sma and being early in the cycle count. I am still overall bullish.
I am working on charts for the Weekend report- I do see bullishness. I also had a Large number of emails on the Chinese new yr, many are aware of it, so that’ll be in the report too.
Its a long report 🙂 Probably release it tomorrow afternoon.
Of to bed, now – Late here. Cya!
Ok, interesting. Those ratios reflects in part the current large Quantitative Tightening + rising yields policy. Trump and the new Fed chairman will possibly halt both, as rapid rising bond yields and general higher interests threathens his ambitious infrastructure plan as well as may disrupt the economy in front of the 2018 elections.
In that case these patterns will completely abort and gold explode.
Link to the Aumn page w the technical mine reports:
http://goldenminerals.com/explor2-resources.php
They only lists silver and gold on their homepage so the basemetals ‘hidden’ inside the report is completely under the radar.
I posted opposite chart above.
My comment was directed to Trond
You stuck your comment in between mine & his
I know. I put that sentence there so you’d get an email alert from Disqus. Otherwise didn’t think one would see on a Sunday. I felt that chart better backed the position you had so wanted to share. Good Discussion!
Gold:Silver weekly past 5 years. The opposite view. Anytime this ratio has been over 80 it pulls back. Lower ratio = better for junior miners and “risk” assets in PM sector. https://uploads.disquscdn.com/images/6430378aed972611ba1c042f6e18ce47821bc14806217f68ee1c436f2104dcdd.png
I’m trying to gauge how much conviction the bears have….are you shorting Gold or Miners here?
https://uploads.disquscdn.com/images/d99c83c3bd2faaa4e0561253ab459946e846f0cad8975ac1574c2cbd7bc1a818.png
target $47.21 by March 31…..JNUG ~$35.00
Man, I sure hope so! That is a pretty lofty target. But I’m loaded to the gills so if we make it there…!
https://uploads.disquscdn.com/images/12af8fac5f59b3c5bc891a911c410cd56a6fa3185efbbbeab31c2eafaca9e1e3.png
$20 from multi year break out. Picture speaks 1000 words
Tjat could also be viewed as a large ascending triangle. If it breaks out, IF, the target would roughly 1650-170. If it does break out, that pattern is notorious for back testing, depending on volume on break.
Yeah. My base case stands. JNUG $33-35 in six weeks
Notice how the MAs are there for support right now while they were resistance over past 18 months (hence no breakout), very positive development.
Sounds like there is a delay in the Canadian MJ legalization……haven’t read all about it so don’t understand it all from the short blip I read…….but sounds like it will be August or later before they are able to legally sell…..
I wonder how many knew that and maybe that’s why the fall in prices last week…..or maybe this is just yearly cycle low or something….?
Thatvis why everything turned down l
Weekend report is out 🙂
I’ll be gone most of the day, wanted to get it out early. Please excuse any typos, I think I got most of them 🙂