With recent market volatility and a potential V-Type Bottom in place in the General Markets, I wanted to review the current markets, but along with that, I will also have a separate ‘lesson’ at the end of the report. It will address why it is a set up to play long out of those lows, but it is also prudent to proceed with caution. Why use the trailing stop?
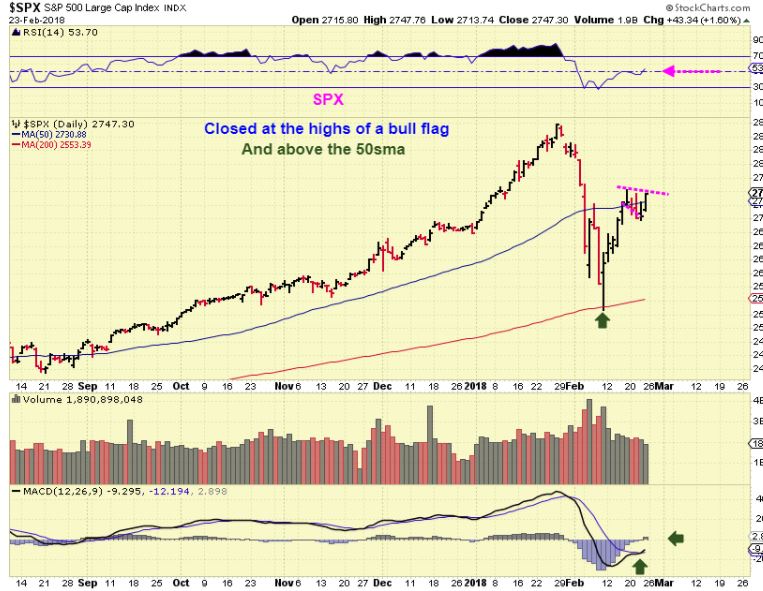
SPX DAILY – Day 9 and the SPX closed above the 50 sma Friday. Many here bought this reversal off of the 200sma when it was mentioned 2 weeks ago, and after stalling for a week in a bull flag, it looks like it may give additional follow through next week.
AGAIN I GOT AN EMAIL, ” IS IT SAFE TO ENTER THE GENERAL MARKETS YET? I HAVE BEEN WAITING TO BUY?” Well, you missed the first buy at the lows & the second one with confirmation of lows, but a 3rd chance is here. I was extremely clear on this over a week ago, and I am going to COPY / PAST from my reports back then what I said. GENERAL MARKETS: The reversal was a buy with a stop under the lows, and confirmation that came soon after was another safer buy- click and read the 2 post below from reports well over a week ago . Then I will discuss more going forward.
REMINDER: AFTER I MENTIONED AN INITIAL BUY – A SAFER BUY WAS HERE. Click to enlarge.
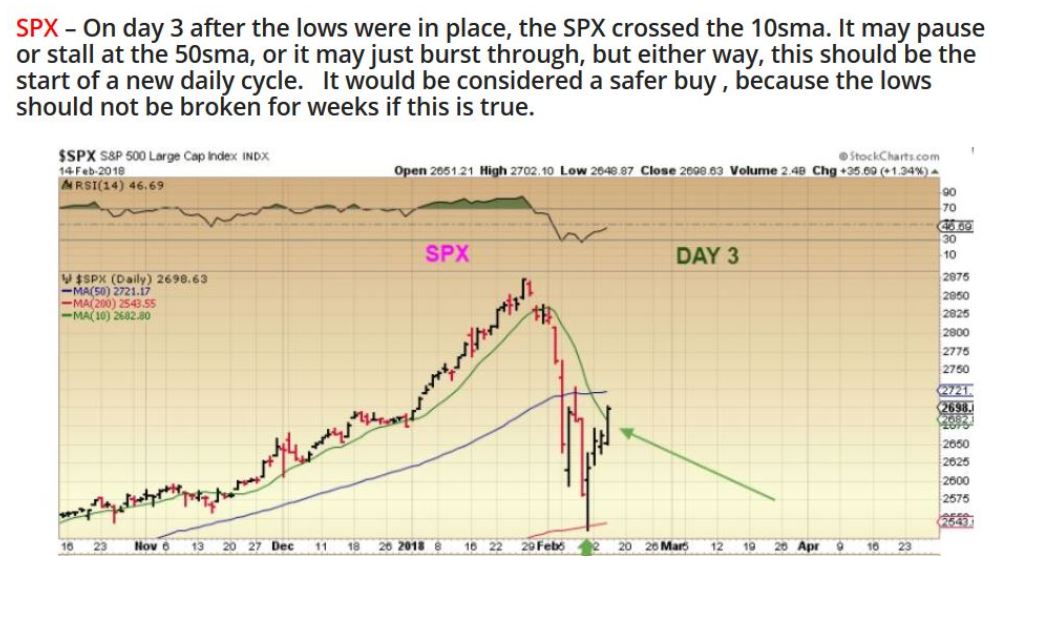
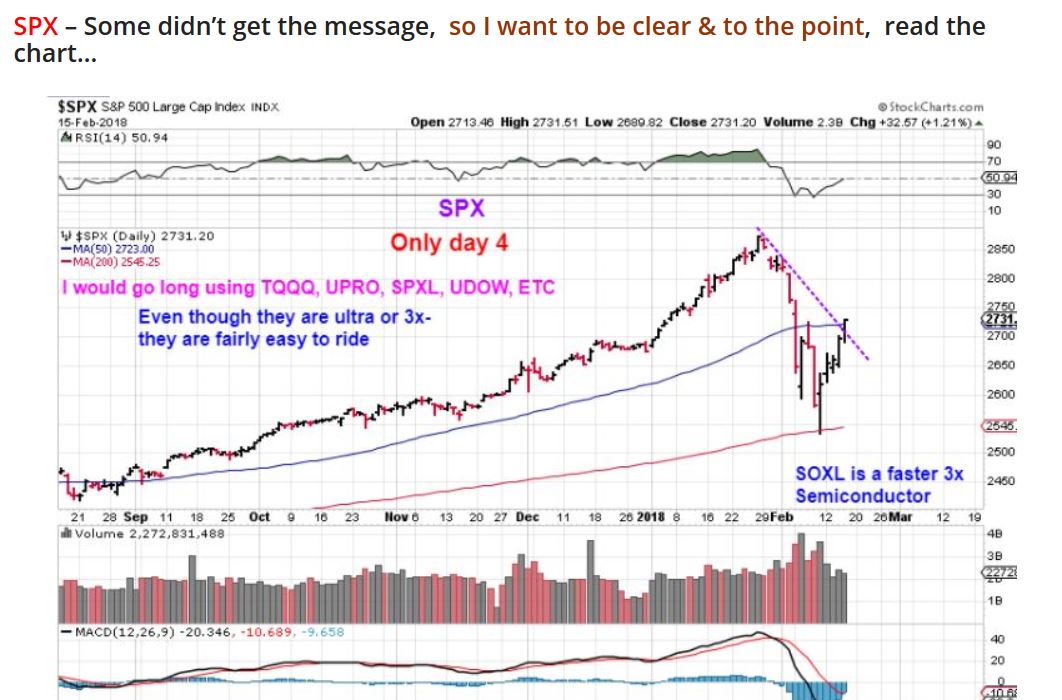
THEN I WROTE THIS THE NEXT DAY:
SO THOSE WERE 2 BUY POINTS AT THE LOWS MENTIONED HERE, NOW That this Bull Flag has formed, it also is a good place to ‘add’ or ‘start a position if you didn’t ‘ for a possible 2nd leg higher, and use a reasonable stop.
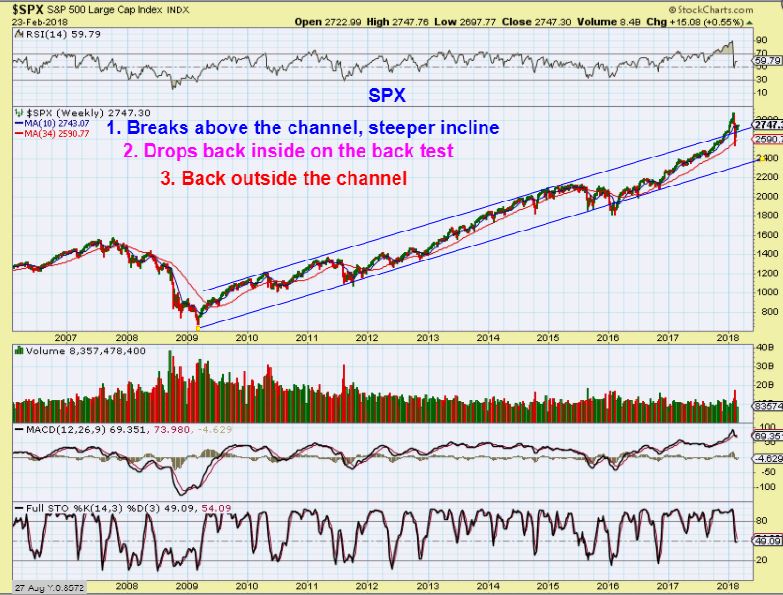
SPX WEEKLY – Read the chart. This is bullish, but I always recommend a trailing stop and will discuss this at the end of the report.
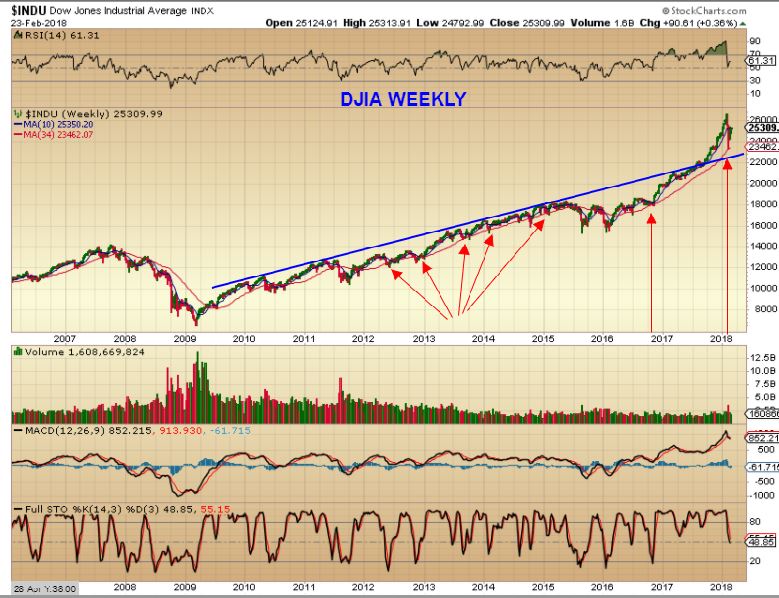
DJIA WEEKLY– The Dow had that steep incline and actually remained above the prior uptrend channel, even with that sharp drop.
As mentioned in prior reports, the General Markets have been a buy with a trailing stop. I also mentioned that I like Semiconductor stocks (and SOXL) like CREE, MU, CY, and maybe AMD as the Markets came out of the lows. Now I need to send a small cautionary warning shot across the bow…
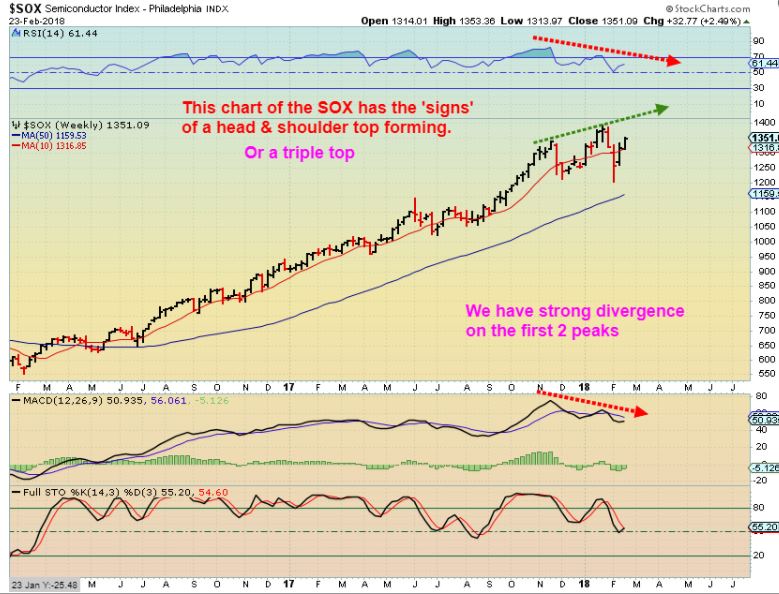
SOX – Short term bullish, longer term a bit cautious. This may resolve with ‘strength’ in the future weeks, but now it shows a bit of weakness.
This is saying that the markets could triple top, H&S top, or just churn sideways, unless this changes. Semiconductors usually lead the way, so even though I liked MU, CREE, CY out of the lows (and they still look good, I actually bought MU) they need to be watched.
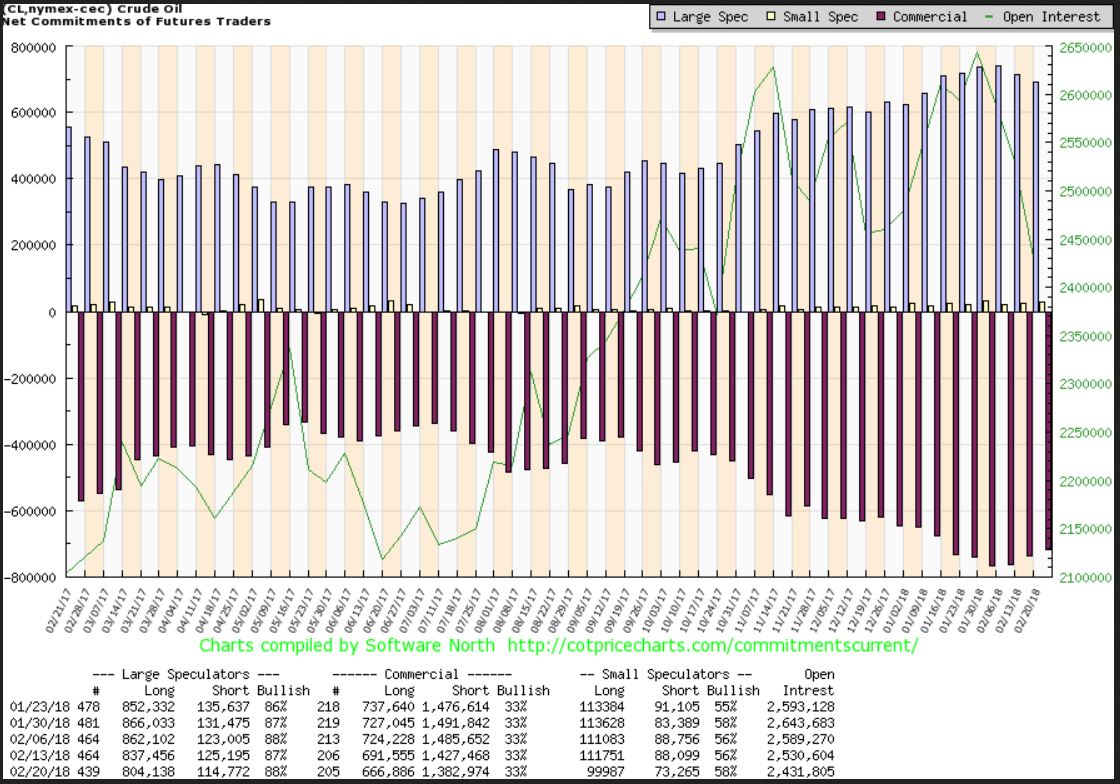
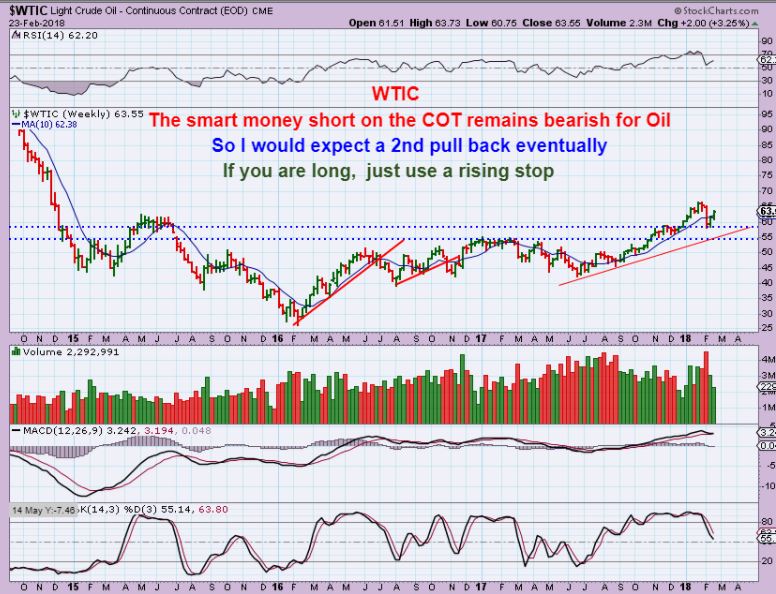
OIL COT – The Oil COT improved but remains highly shorted by smart money. They appear to expect another drop.
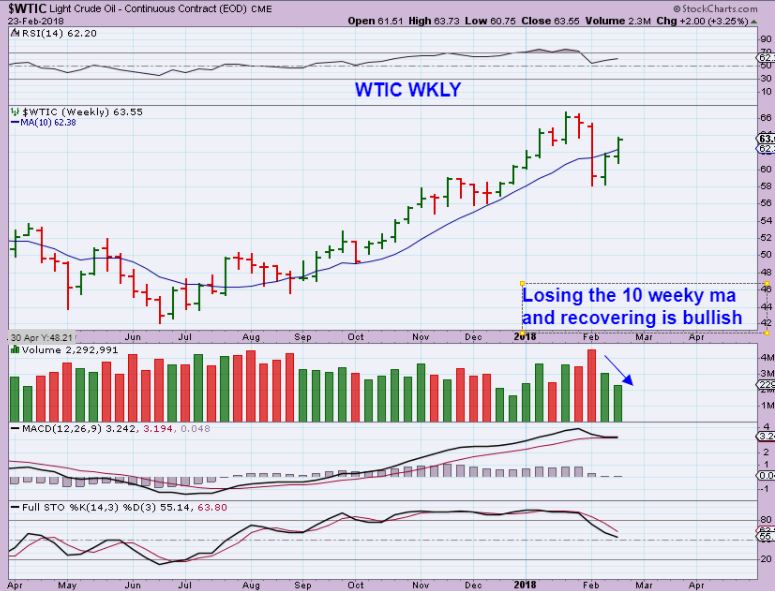
WTIC #1 – The Daily chart put in a swing low, and then this Weekly chart also has a weekly swing low. Oil is recovering from a sharp 1 week drop.
WTIC #2 – This can still happen, and you will see at the end of this report that Oil CAN break to new highs out of these lows and still break to lower lows. The COT is bearish, so the way that this can be played is to ride it higher and use a stop to lock in gains.
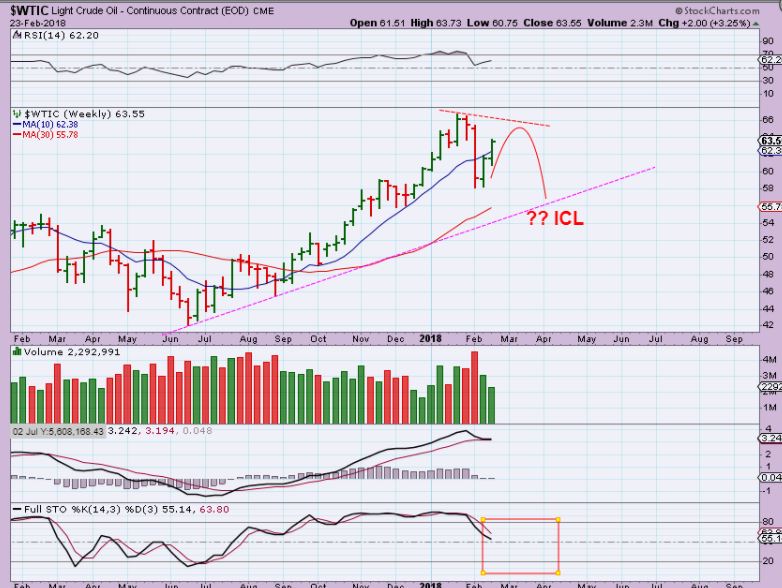
WTIC #3 – An A-B-C drop could still take place. Again, the end of the report will be eye opening for some, when it comes to recent lows being viewed as an ICL. It could be, but that can fail. You will see.
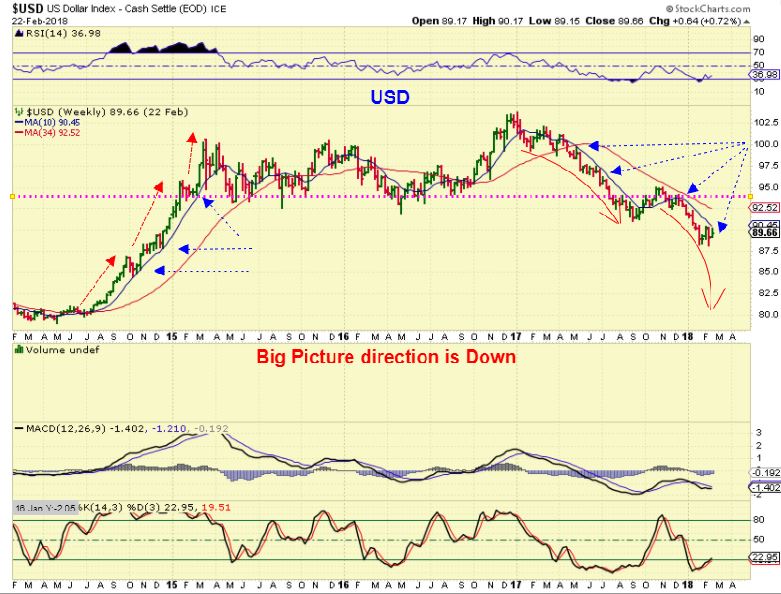
USD BIG PICTURE – Breaking down big picture.
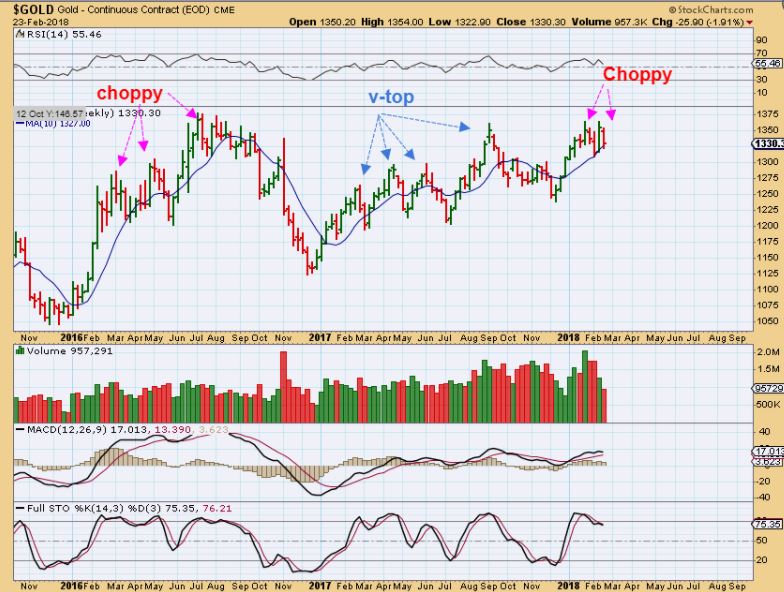
GOLD COT – The GOLD COT remains rather high, while Silvers is very low.
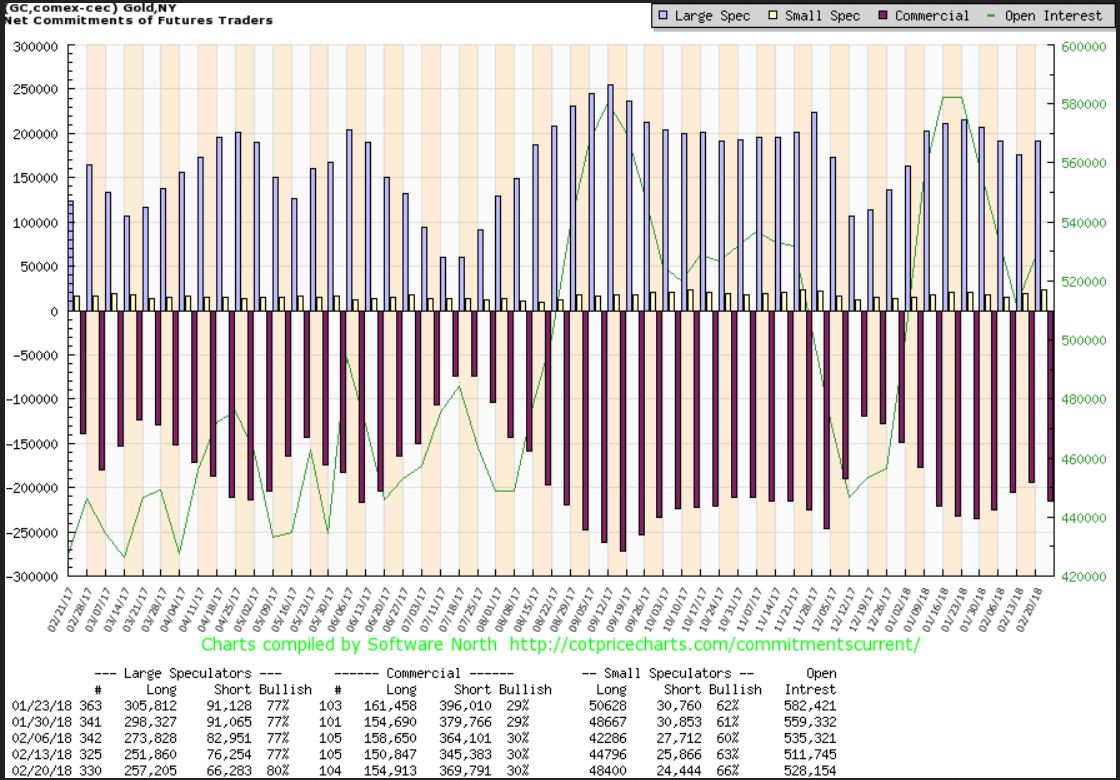
GOLD COT – Gold is ‘holding up’ but has become choppy. It remains above the 10 weekly MA, but Miners seem to be signaling weakness. I would call this long term bullish, short term neutral, but up near the highs it could produce a false break out & then roll over into a dcl if the miners are telling us what to expect.
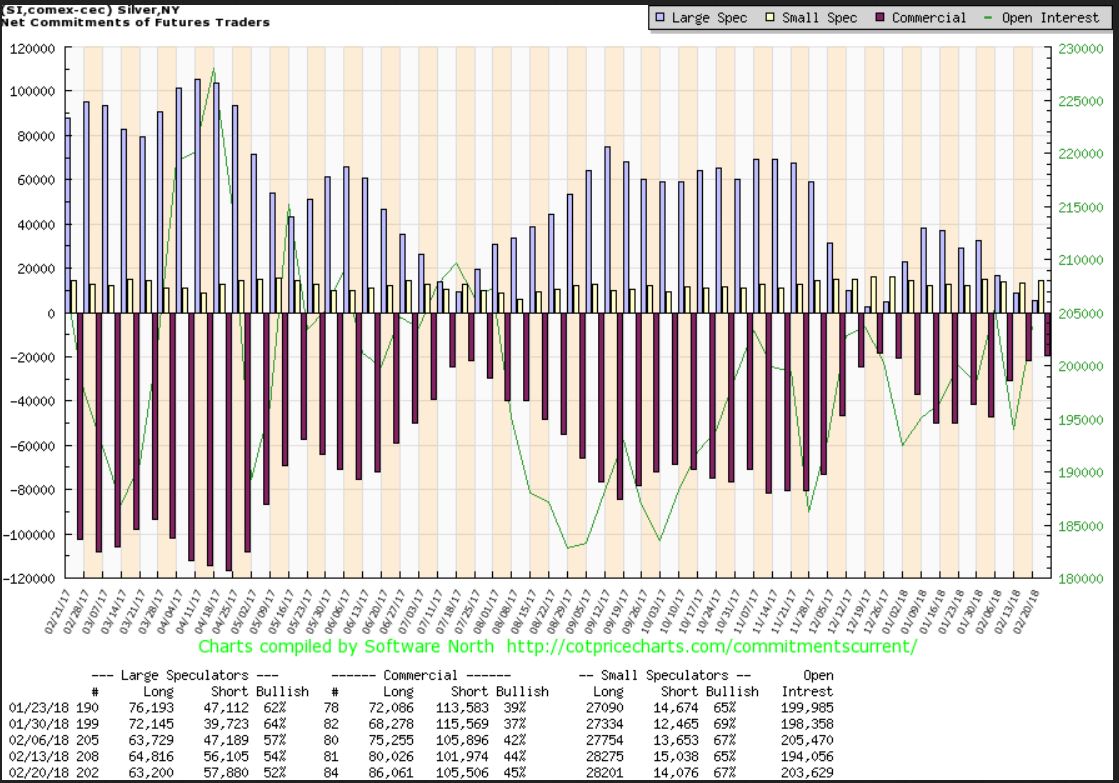
SILVER COT – The Silver COT shows smart money is NOT heavily shorting Silver like they are Gold. I don’t remember seeing this big of a difference before, but it may have happened. Are they expecting a run higher in Silver? They certainly do not seem to be expecting a big silver drop. It’s another piece to the puzzle.
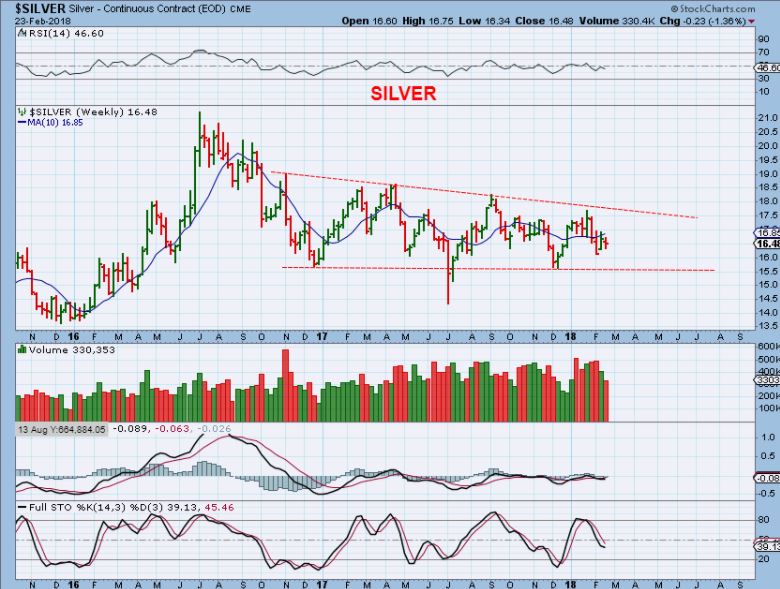
SILVER – Silver did not rally to former highs like GOLD, and this may be why Smart Money is not shorting it. The down side possibilities are another stop run, but the lows of July 2017 may be ‘The Lows’ in Smart money opinion.
NOW WE GET TO THE MINERS
I will use several charts to tell the story here too.
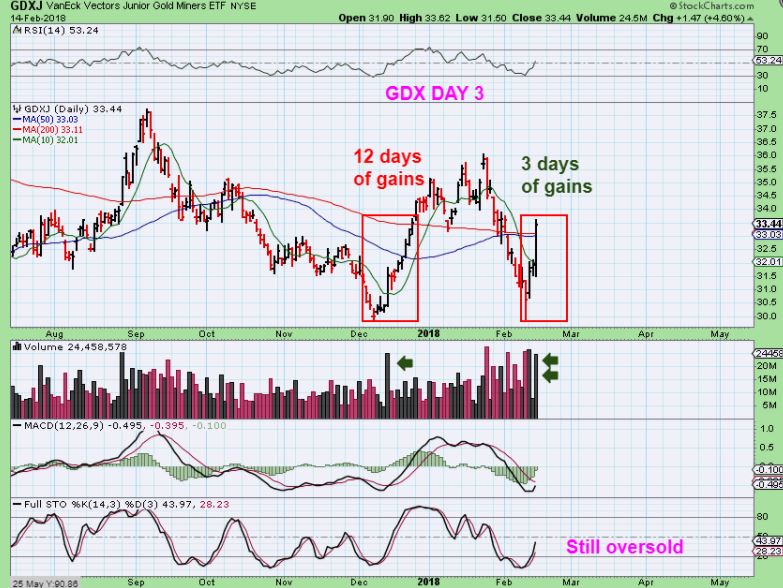
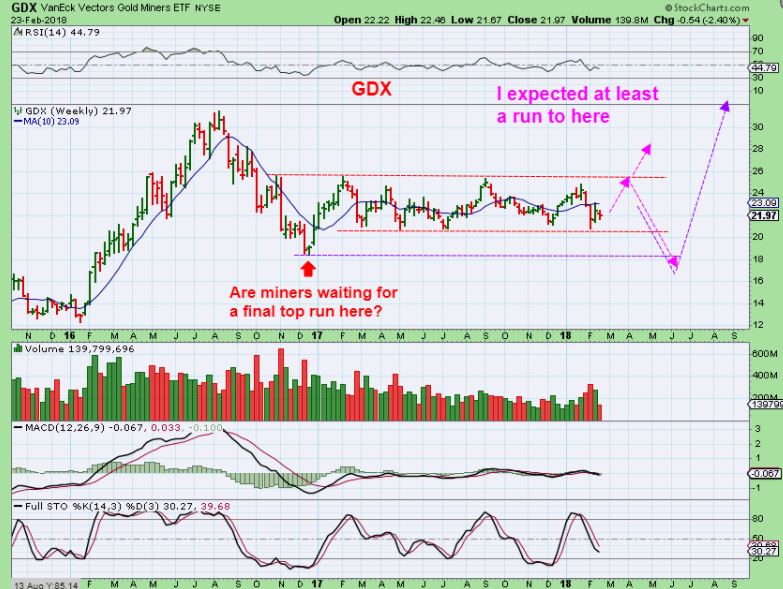
GDX DAILY FEB 14 EXPECTATIONS – I expected at least a run to the prior highs after Miners broke the lows, reversed, and rallied strongly back. They were capturing 12 days of gains in only 3 days . Things looked good, and possibly a late ICL came in, similar to DEC GOLD ICL (lows) in 2015 and MINERS ICL (lows) in Jan 2016.
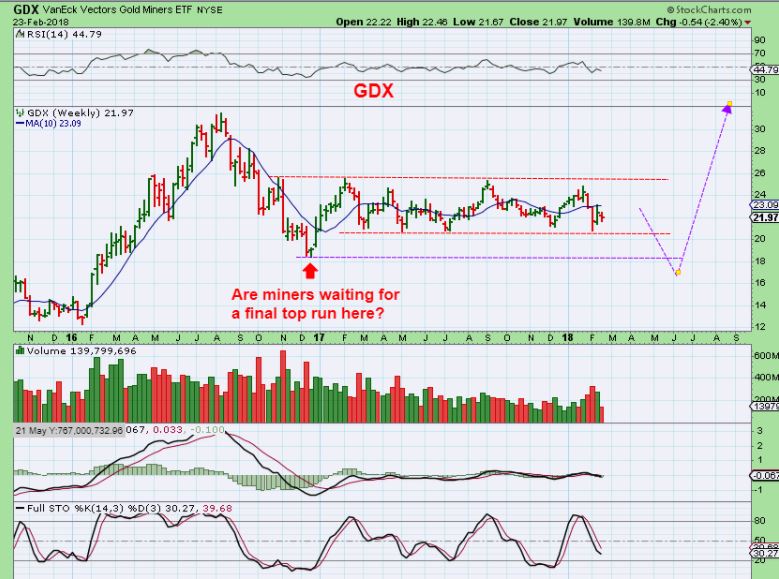
GDX WEEKLY – So I expected
1. A possible run to the Upper Red Dotted line, maybe even more. Or
2. A a run to that upper red dotted line run, and then a STOP RUN DROP.
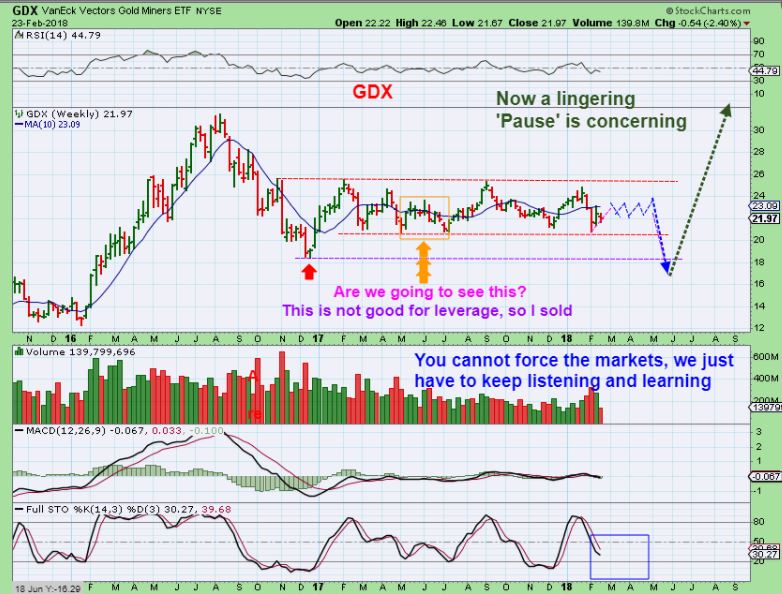
GDX WEEKLY – So far, Gold moved higher last week & miners stalled, dropped, floundered around, and I had to wonder ‘Why the delay so early in this daily cycle’? Gold was up $7 one day, Miners sold off. I cut my leverage until I could get some clarity…
So, I wanted to keep in mind that a complete stop run is possible, and Miners may be hinting at that…
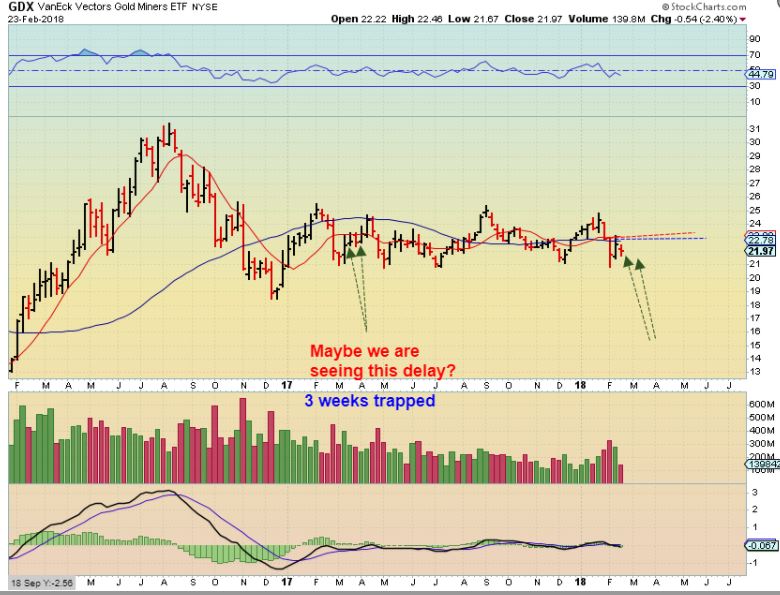
GDX WEEKLY – I also did notice price trapped under the 10 weekly MA for 3 weeks in early 2017 before Popping. So that could happen, but then it rolled over. We may not get THE LOWS until the next ICL. Also we have a FED MTG in March.
I then realized something else to at least keep in mind…
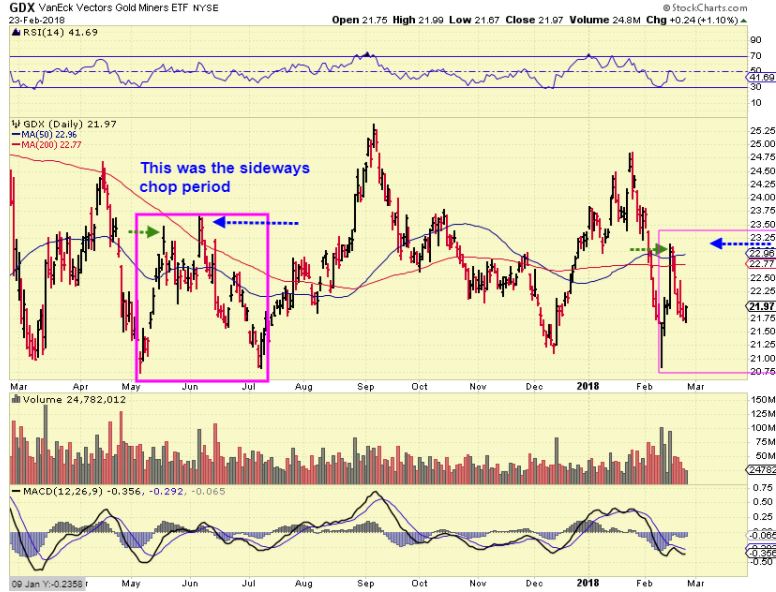
GDX WEEKLY – In MAY 2017, Miners broke below the Feb lows and then went sideways week after week after week. Stagnant & Choppy action took place. Could we see that again? And then get a drop into that ‘Stop Run’ ICL? Let’s examine that daily chart of that time period…
GDX DAILY – It is just an idea to keep in mind, after looking at recent Miner action, it does resemble that stale sideways chop. It may not be pleasant in JNUG if we only bounce around here.
GDXJ – GDXJ was threatening to break above the 10sma Friday, so I captured this wedge, but it did sell off a bit into the close. So where does this leave us with Miners ?…
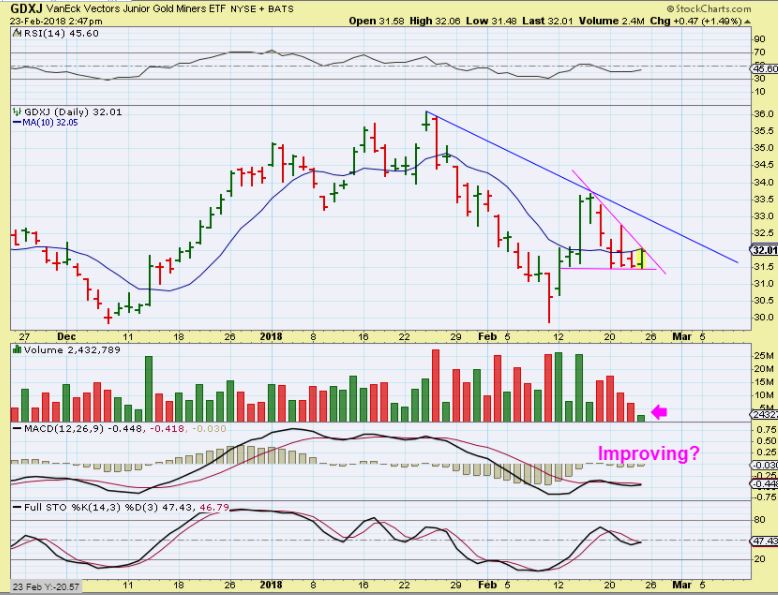
So where does this leave us with Miners ?
MINERS – AFter that very strong reversal higher, they are not acting as expected when Gold was rising this week. After putting in the Strong reversal and surging higher for the first 3 days, they have simply drifted lower. I cut leverage and want to see how things play out, but they looked weak when Gold was up $7. This could do a sideways chop like it did last May, June, July.
The General Markets – are rising out of the lows and acting bullishly, regaining the 50sma and flagging sideways last week. Are they ready for a 2nd run higher? They seem to be. It was mentioned that the reversal lows could be bought with a trailing stop and so far there has been no big pull back to trigger stops, so the green light remains on. THERE WILL BE AN INTERESTING LESSON at the end of this report that can be used while riding the General Markets or even Oil right now.
OIL – This is a 2 week move out of the lows, and I have pointed out that with that BEARISH COT, I have to remain cautious. The lesson below will help you to see why, but at the same time, a long position can be held with a stop under price at a reasonable distance of your choice. Please see the end of this report for a bonus lesson to give you the view that I have in the back of my mind too. The markets are still a bit choppy and difficult, but they can be managed as the high volatility seems to be dying down.
Enjoy the rest of your weekend!
~ALEX
LESSONS: Why stops are important, even under this bullish set up similar to what we have now…
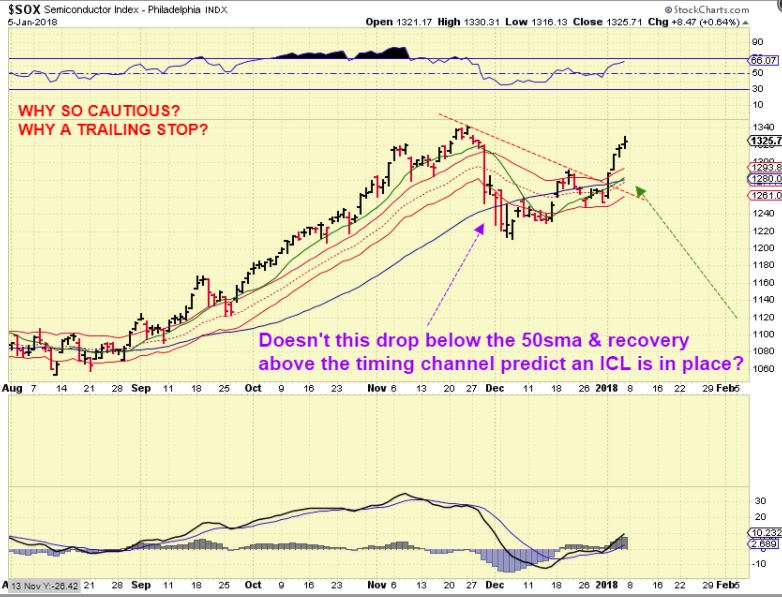
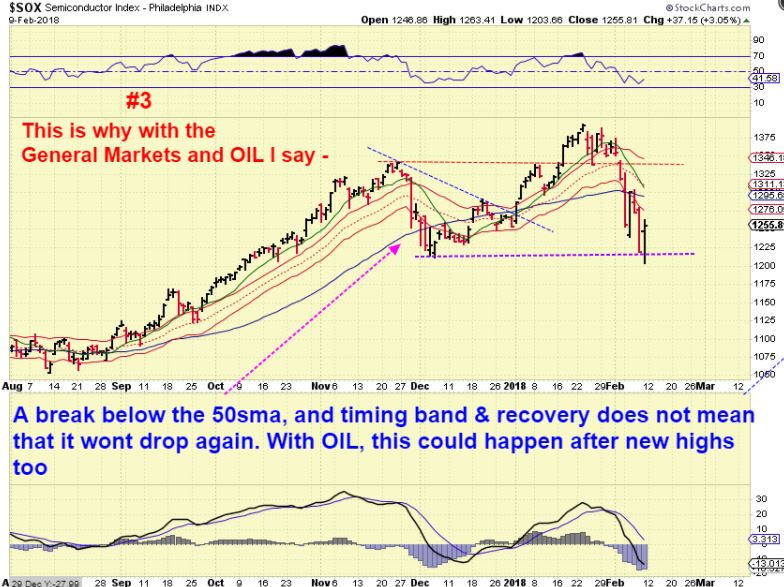
SOX BREAK DOWN & RECOVERY#1 – The Concept that it is a ‘safe’ trade. We see a Shake out at the 50sma, and recovered to the former highs, back above the cycle band. That must be an ICL, and thus a safe trade for the next 2 – 3 months in peoples minds, right? It could be…
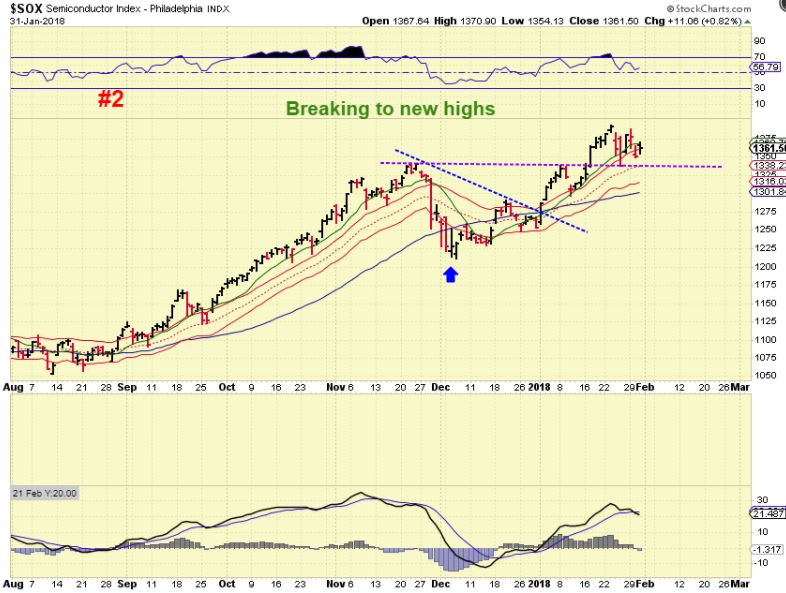
SOX – BREAK DOWN & RECOVERY#2 – And then it even broke to new highs and back tested, so this looked like clear blue skies ahead, very Bullish.
SOX – BREAK DOWN & RECOVERY#3 – It then experienced a drop to a new low only 2 months later? So was that first drop really the ICL? It made new highs and then new lows? This was another case of ‘volatility’ and the shake out at the 50sma and recovery to new highs failed. It can happen, but you can’t be afraid to trade at all of the possibilities. A trailing stop of protection would have locked in gains.
This one is similar and will again impress upon us that we can take a trade, but we still need to use stops.
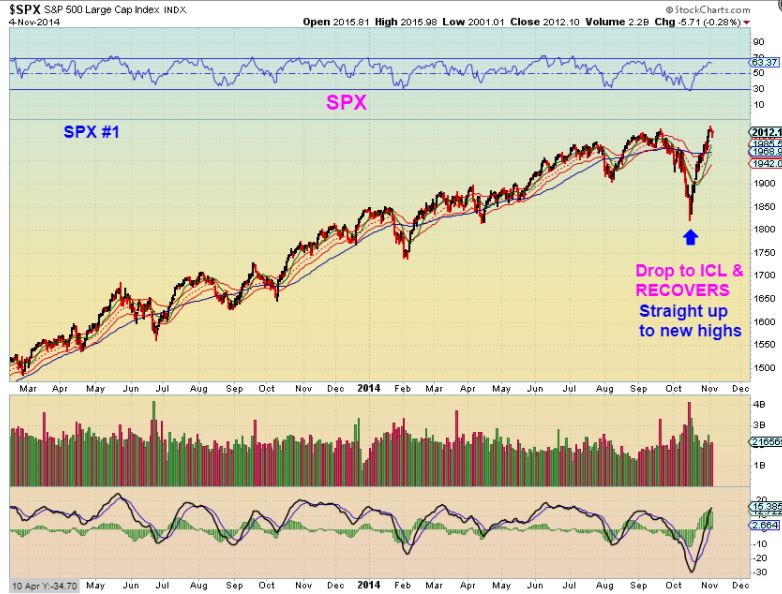
SPX #1 and The ICL – OCT 2014, Look at this drop, then we got a V-Bottom and strong recovery! This is similar to what we see unfolding now. The ICL was in, and it was breaking to new highs! This should be 3 – 4 months straight up, right?
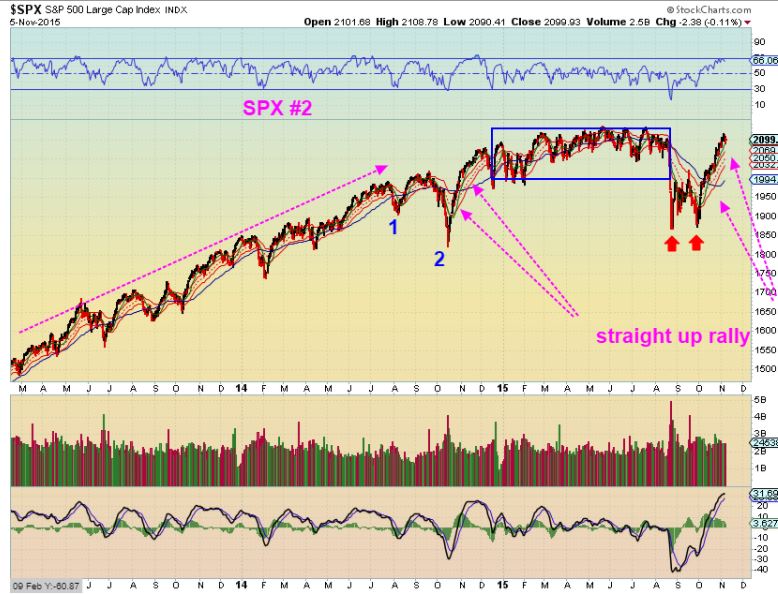
SPX #2 and The ICL – Nov 2014 eventually dropped and we saw sideways chop for 7 months and then another crash (Twice, a double bottom crash). NOW look at that double bottom with 2 red arrows and THAT RALLY HIGHER. Ready to blast off higher & higher…
SPX #3 and the ICL – No big follow through rally there either. That straight up shot out of the lows probably fooled many that the ICL was in and everything was thus ‘safe’. We have to look at charts like this when we buy the lows and make some gains and think that the markets volatility is all behind us.
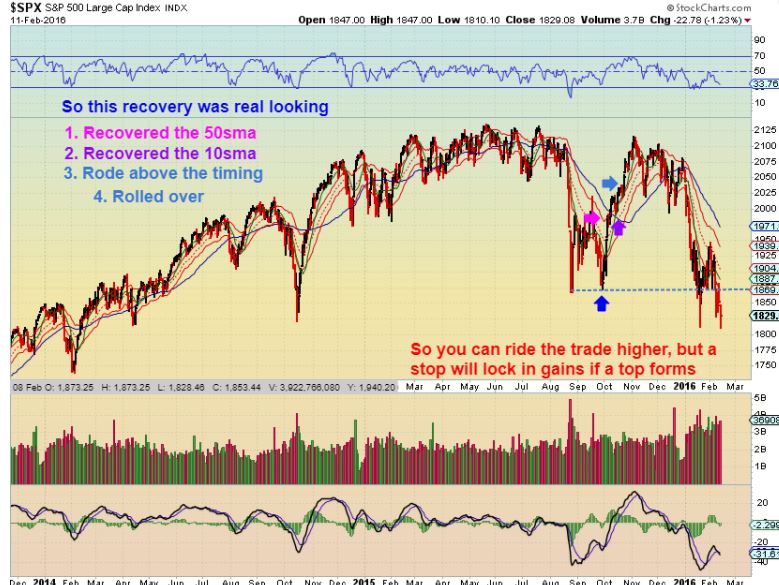
Maybe volatility is behind us, but I tend to doubt it. What caused it? Are we entering a period of uncertainty, choppiness, inflation concerns? Earnings have been mixed, so it is fine to ride the run higher, just please use a reasonable stop & lock some of your gains in if things head south. I have seen V-Bottoms roll over & crash too. Currently the SOX has strong weekly divergence.
Some of those rallies above that occurred out of the v-Bottom lows were straight up, but that didn’t make them invincible. This is just a lesson of awareness – Stay Frosty and use reasonable stops .
Again, unless this resolves with strength in the future weeks, this weekly SOX chart could be indicating that a period of sideways cop will still be with us in 2018, even if we make a new peak. Time will tell. 🙂
EDXC By request – Yes, I still own it because I bought it with the intention of holding for years. When it is $1, maybe I’ll sell it. 🙂 As it dropped Friday Morning I captured this for a reader. I am simply saying that in the past, we saw a break out, and then a sideways consolidation for a month. Notice how I drew this possibly playing out.
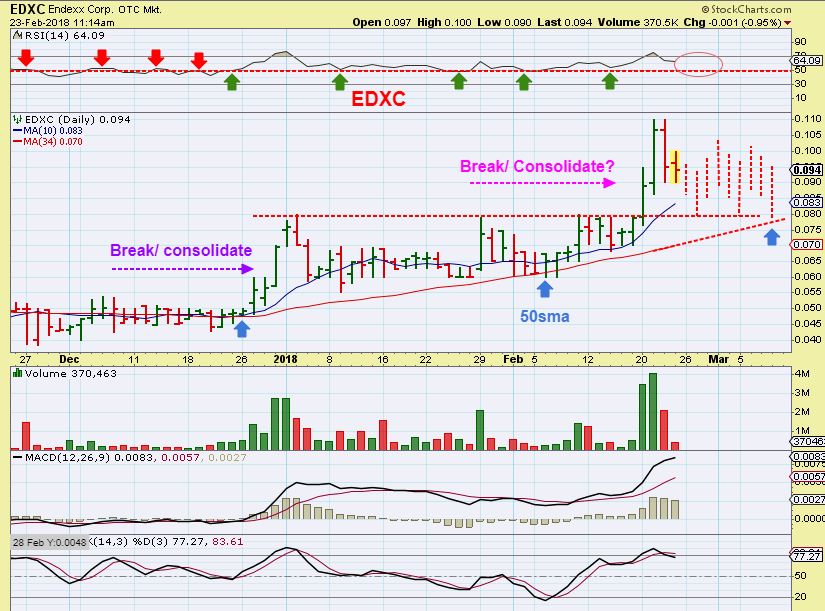
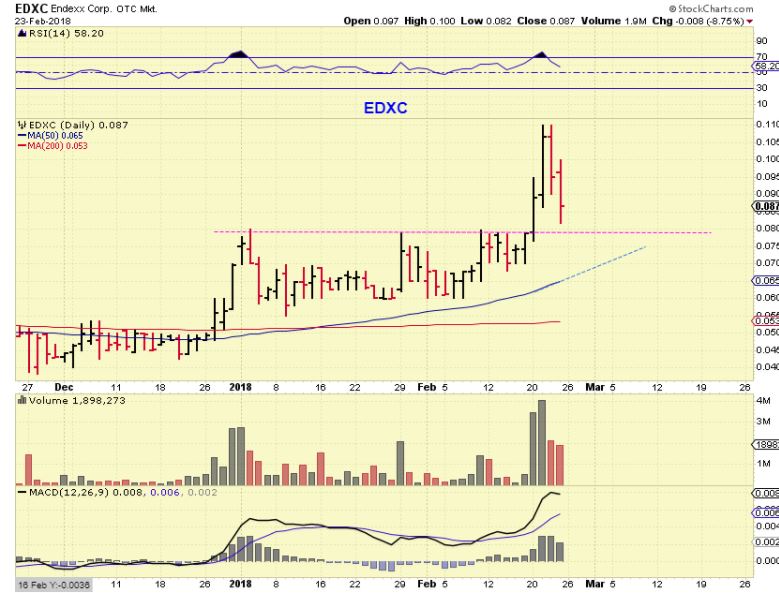
EDXC END OF THE DAY – So it closed lower and volume is lighter than the buying. This could just take off higher, but I want to put the expectation out there that these also can also climb in a period of consolidations until it really breaks free.
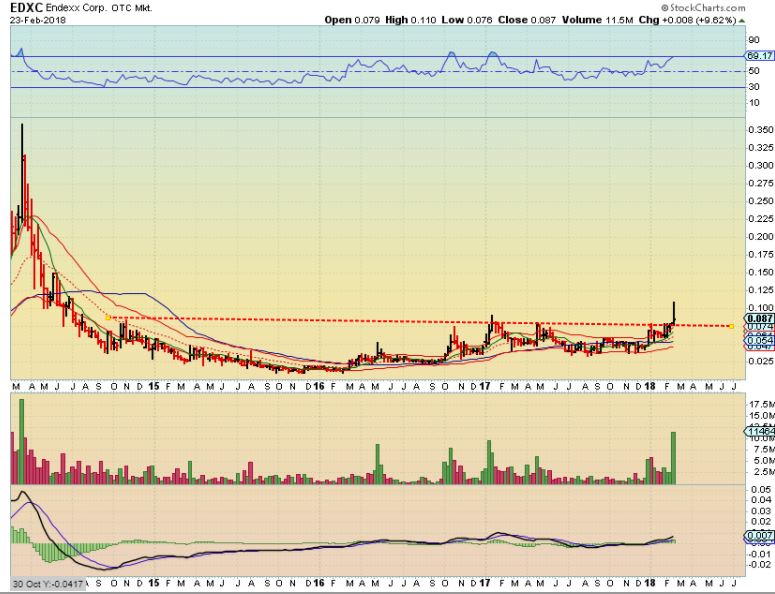
EDXC BREAK OUT- Personally I think that this wants to break out of their growth potential. The weekly MACD is rising, volume increased, and this could just keep on rising over time.
BY REQUEST- LATE ENTRY
I mentioned BITCOIN Feb 21 in a recent report as possibly breaking out from a downtrend. Email request asked for update…
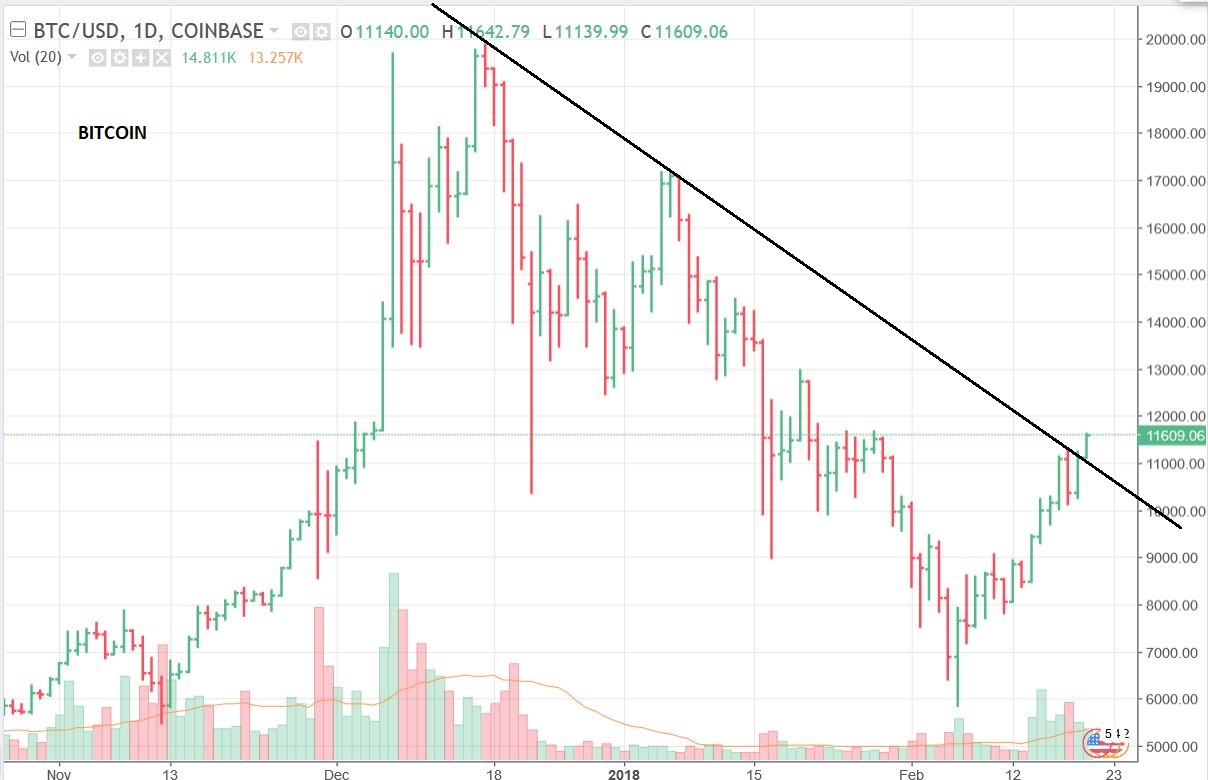
BITCOIN seems to have broken out and is possibly going for a back test on the next drop to a dcl. The DCL would not be due until March, so it may bounce around or this is a 1/2 cycle low and it could bounce off of the 10sma. This does not mean that it is just going to take off higher….
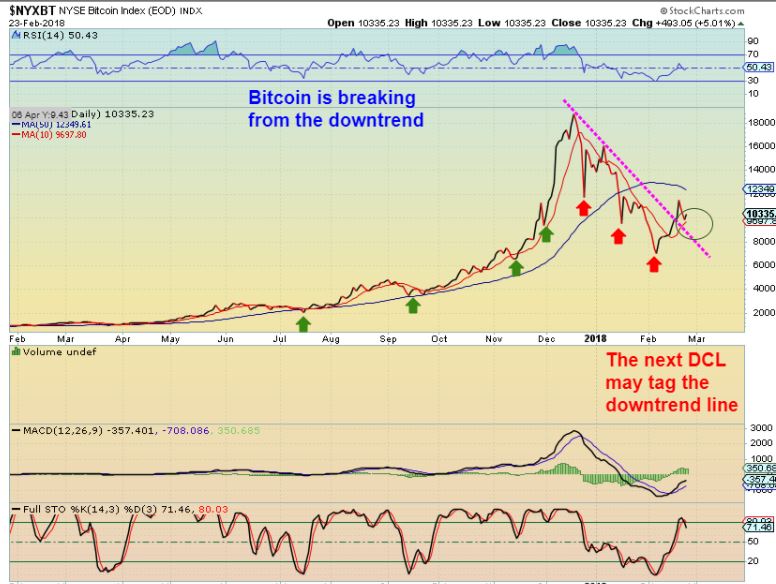
…This does not mean that it is just going to take off higher.
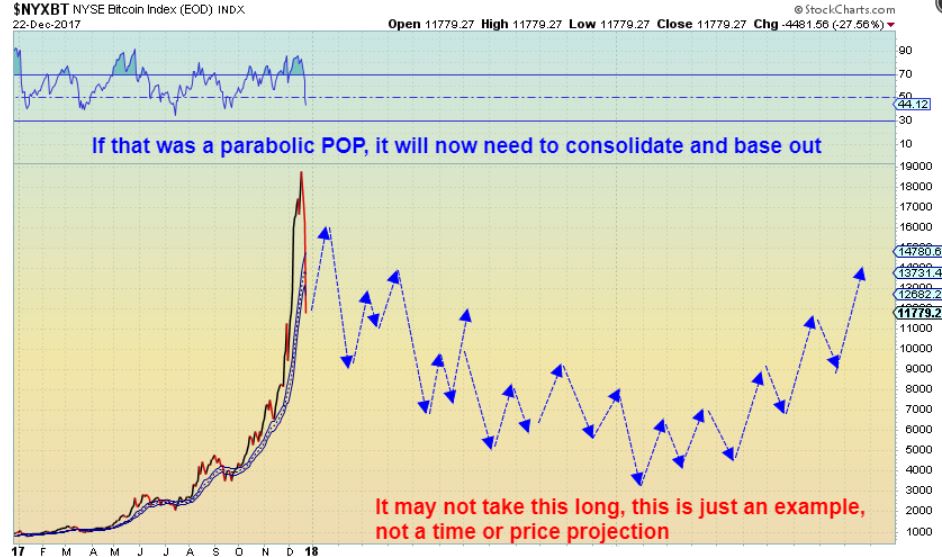
My prior thoughts were that it could continue to drop, and this could happen even after a trend line break. How?
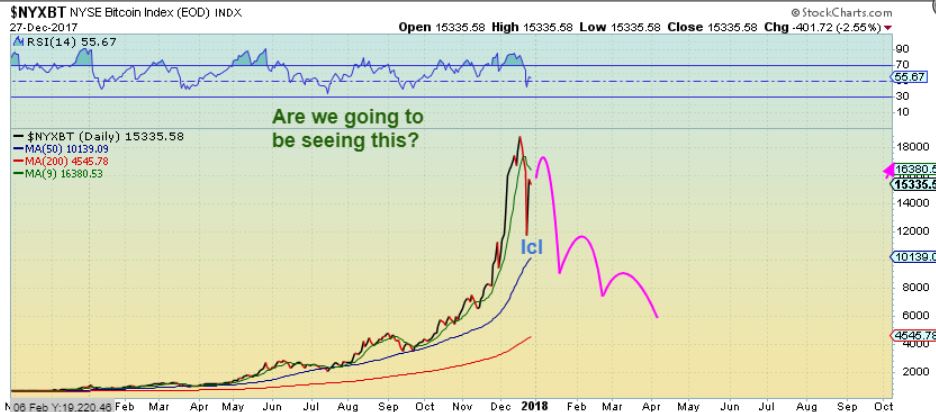
BITCOIN – I drew this in December and this still could be “Roughly” how BITCOIN plays out, even with a trend line break. So yes, the next bounce (Dcl) could be bought with a rising stop, expecting either follow through higher , or a possible pattern as shown below.
Friday – Carrying A Lighter Load 
 Feb 27th – Tuesdays Ideas
Scroll to top

BY REQUEST : AFTER RELEASING THE WEEKEND REPORT, AN EMAIL ASKED ME TO COVER BITCOIN, SO IF YOU READ THE REPORT BEFORE 10 A.M. EASTERN TIME & DID NOT SEE THAT AT THE END OF THE REPORT, PLEASE SCROLL UP AND LOOK AT THE END OF THIS REPORT
CF. In regards to the difference in Silver/Gold COTs .. silver is used more extensively in industrial production . Maybe silver is viewed more positive in an economic context as banks are positioning for better economic growth because of the tax cuts and overall market conditions.
Hi Brian,
I’ve thought of just about everything, and that idea crossed my mind, but I seriously doubt that that is it. This is an anomaly that I have not seen before, and I have seen economic growth.
That doesn’t match past ‘economic growth’ periods.
could do with a silver-cot : gold-cot ratio chart for the past 40yrs, see if current conditions occurred in past, and what happened next.
any ideas where you can get that sort of info?
I looked back at yrs of Silver COT charts& it is acting in a way thst I have not seen in three past…. it is very interesting to me.
Alex. Are you holding any miners or all cash? I understand the no JNUG.
I am holding some the Miners, My positions were not that big anyways I cut my leverage when Gold went $7 higher, MIners dropped . My leverage was a large position out of the lows.
Alex, great lesson on trailing stops to ride a rally. I used stops to sell TQQQ during the big drop and it took me a couple trades of “sell low and buy lower” but I finally got my avg cost down to under $137 (now $139 after adding some on Friday). I am very bullish stocks right now, but I always keep the possibility of a big drop in mind because I have seen it many times. Just curious, where would you set your trailing stops if you were in TQQQ right now?
Alex/Steve, That TQQQ trailing stop question is of intrest to me as well.
Thanks, Alex.
I’m still very heavy in leverage and individual miners. A number of charts, both in gold and miners has me optimistic for this DC. Although, if that is true, it will need to happen in the next 1-2 weeks as we are maybe a 1/3 through this current DC. I believe you said day 10 on Friday? I have a stop a bit below the 13 level in JNUG as it appears a strong base is building. Momentum trading is obviously the best way to go vs. speculating like me (because I have to). But I generally think the dollar is weak and will fall to that bull market trendline in this IC, causing miners and gold to break out a bit in this IC. If golds breaks down from here though, I’m ready to bail as we are right on decision point of a LT or RT DC.
I’m looking at adding a position in gdxj tomorrow as I agree with Alex that the dollar looks ready for a drop down soon. My stops would be tight.
I hold a core position in SLV and GDX, but have sold my trading positions.
My concern here is the dollar flagging at resistance after breaking through falling trendline and finding support there now. While I still believe the longer term trend seems to be down, I think it could as easily rally to 90.75 from here as break down, and short term momentum is up right now.
Thanks Alex. I’ll toast to that! Up $8.10 and change as we speak. $1336.60
Looks like the Chinese PM buyers came back from vacation. And it was on SALE!
Alex living in the uk, I often look randgold which is traded both in the UK FTSE and the nasdaq, since the UK is 6 hours in front of the US it often gives an early clue on how the us mining shares will open, anyway it gapped up this morning.
Hi Manny or other Europeans Does any one have an update on the trading embargo on US etfs without KID documents.
What alternatives do you suggest for NUGT, JNUG, Uslv and other leverage etfs
Thanks for any update or suggestions
the only thing you can really do is make a basket of miners or junior miners that Alex recommends, that will give you leverage and spread the risk.
its a pain not having the inverse etf
THX MANNY
4. Gap fill please
Alex, if you wouldn’t mind, could you let us know in real time if and when you get back in to JNUG?
Hi Ron,
I wouldn’t be personally advising anyone to buy JNUG late in a daily cycle, so as time goes forward and we are getting later in the daily cycle- leverage is less and less beneficial.
If I entered it, it would probably be for a quick trade. I dont think I would post that trade
Makes sense, thks
OK RON- I’LL TRY JNUG HERE, JUST FOR A TRADE. :- )
I really dont want anyone to follow me thinking that I know something or expect a huge rally,
this will be a trade. I dont know how long it will last. I dont know if it will work/
Thanks for letting us know. I just knew you couldn’t hold back! I can almost guarantee this is the time that it will go because I bought only 1/2 the position I had been playing.
I knew I’d get back in, but it is just a trade unless it really took off. I bought close to 1/4 what I had , since it is just a trade.
I’m watching GDXJ attempt to close over the 10sma, but we still have this trend line that could be resistance
refresh
https://uploads.disquscdn.com/images/27ae427157a7b163aa7de0193d6f862ae0a1ff6fcf8b530447a60a2f6390f5e7.jpg
So far a back test of the neckline…. https://www.tradingview.com/x/2RfFSuQo/
Really was hoping for gdx/j to gap fill on that drop. Wishful thinking.
nice TAHO recovery today
…. but only back to where i bot it 4 months ago
https://uploads.disquscdn.com/images/1334a744f459fd3da1408726015e80ada25106ad6c64be4a1b4d53f8a2112e97.gif
LoL, you are funny 🙂
don’t encourage me Tamster
😛
Is that a chicken Hawk? 🙂
Egghead Jr!
https://uploads.disquscdn.com/images/9403c9a337733cdeb7748f1faa243d4e9f5739e6d85747a853e488c42717b977.jpg
So far not much fireworks, looking to me like some time will have to pass before miners get anything going. That´s alright, as long as we are on for the ride when it gets going.
Let’s see what new home sales does in a few min.
sold 1/2 of my qqq’s and associated tech positions this morning.
didn’t get any gdxj. decided to see how it trades through the day.
I added to my MU
Note – I would have posted that earlier, but I thought everyone was away….Disqus not working for me today, I didn’t see any of the comments for the last 1-2 hrs without refreshing
TAHO & CRK looking good
CRK had good earnings.
WOW on TAHO now – up 20%
So far- The choppiness in precious metals remains
Wondering when the Mary Jane stocks will be a good buy for the long term? The MJ etf dosen´t get much bounce, and stocks like CBWTF look like they are trying to make a trip down to the 200 MA.
http://schrts.co/yTeXC4
For now, I think I will just treat this lull as a vacation and enjoy the time off. Miners will double and triple again, just have to be patient and ready to buy heavy if they fall out of bed. I will keep what I have while I wait.
you are too patient ralph, i am a bit jealous…but of course you are right. can’t force things, never seems to work out well. the runs will return again, need to find other pursuits in the mean time. i personally am deep diving into cryptos, they too are in the chop
I am watching the 10sma on many of those MJ STOCKS and they seem to be riding down underneath them.
When we get a good pop over the 10sma in a few of these at once, I would imagine that it should signal a sector interest.
Yeah, many of our fav sectors from recently are grossly out of favor here. Tough sledding, gotta find somewhere else to park my cash.
I have mentioned stocks like CREE, MU, CY as semiconductor , but I haven’t posted charts for a while.
This is MU and it has been consolidation for a while, a break could be in the making, or tag of the highs and a handle.
I took the trade over the 50sma ( 34 is shown, sorry) and added today at $47.25 – I figured even a run to $50 is fine.
https://uploads.disquscdn.com/images/3532d73f63dfab521aec85c8f6339763abb735a67fe4f269d1a2aa82abbd8aaf.jpg
Im still in CY and added MU PM due to your add last week. Nothing big this time… I love MU (you know that) but man this thing can be volatile at times…
I know, but it seems tame to me, even when its up a buck, its only like 3% 🙂
I added to my ENPH too, reversal off of the 50sma, as mentioned below earlier today
Oh yes, I added this morning as well. It is sweet:) Thank you, CF!
I bought MU a week and 1 half ago when you recommended it.
SO far – so good 🙂
CLF may be a bull flag drifted down to and stopped on the 50sma
sure looks like a convincing double bottom breakout on xle daily
I tried to post about ENPH this morning, and I dont see it on here, so
ENPH reversed off of the 50sma. BUY with a stop a bit under the 50sma
( I own it, and added)
Just noticed earnings after the bell tomorrow
LGCY has been rather relentless.
SID – Is that a BUY? I want to buy it, jumped above the 50sma, but that gap has me holding off, but I so think that SID may keep going.
Kind of torn on that one (Especially since ‘X’ AKS, GGB, etc gapped up & dropped to fill it today )
Looking at the chart of FIT
Looks bullish with increasing volume as it moves out of the lows ,
BUT they release earnings after the bell.
Is this chart a BUY or a SELL? https://uploads.disquscdn.com/images/85f78cf51c865cf9b3344b8caa2264924c3b9d1fe61d02b87da1edf0f8259b91.jpg
sell
Looks like Gold Long term
As you have it, that chart is a sell.
THat chart is gold
It’s amazing to me that the “Fear & Greed Index” is still at 18 show showing “extreme fear” even after the big rally in stocks since the Feb 9th bottom. Personally, I take that as a bullish sign that my TQQQ is on track for an extended UP trend.
http://money.cnn.com/data/fear-and-greed/
I know most of you don’t care about trading the general markets, but thought I’d pass that on. And as always, please don’t follow me, check your own charts and make your own trading decisions.
Steve, as always , I really enjoy your stories. Just keep em coming.
Many of us, including me, do trade general markets. Made a lot more of TQQQ last few weeks than I did miners. I wad WAY too worried about another wave down (larger ABC) and stopped out by pennies last Monday. Now I’ll have to chase. Grrr…
Steve – Even though I don’t talk about it here, most of my trades are in high price names in the general market and I try to apply cycle analysis to those holdings. I’m sure you have had to spend less time in front of your screen the past few weeks than I have, and that appeals to me. What are you going to do when a correction time comes? Do you try to play the short side, or just go onto the sidelines?
Added a starter in SAVE…
I like it
Rrally sorry that I held EDXC. That won’t happen a 2nd time if I get another chance.
The report is out