We rode out some choppiness this week, so the weekend report can act as that ‘beacon in the storm’ that guides us along. Let’s review our Markets…
.
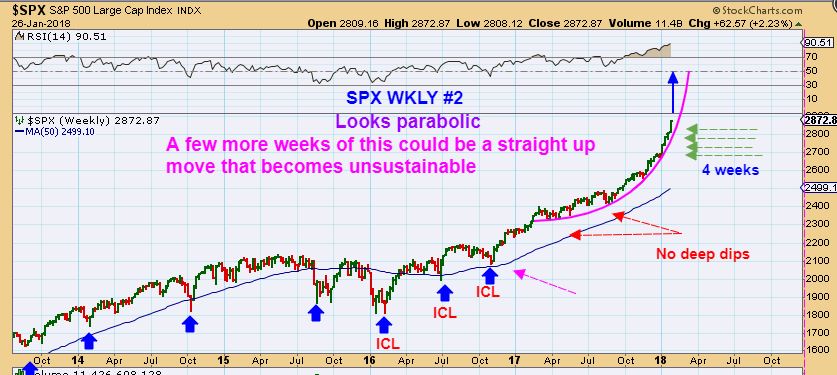
SPX WEEKLY #1 – As expected, the General Markets are accelerating and this weekly chart shows the last 4 weeks as strong green weeks. A trailing stop has been very effective for those riding this ‘long’.

SPX WEEKLY #2 – Please read the chart, this could be a parabolic future blow off top in action. A straight up move is unsustainable after a while. We need a pull back sooner than later.
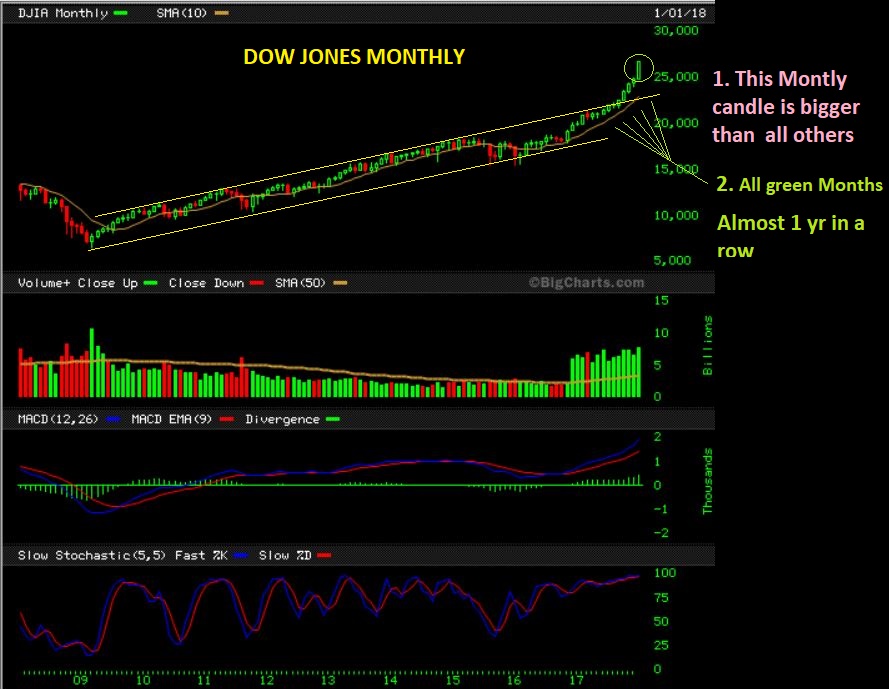
DJIA WEEKLY – Please read the chart as we’ve now seen 11 of 12 of the last months close green. Jan is not over, but it will end Wednesday and this month was the longest weekly candle – I doubt it will go red.
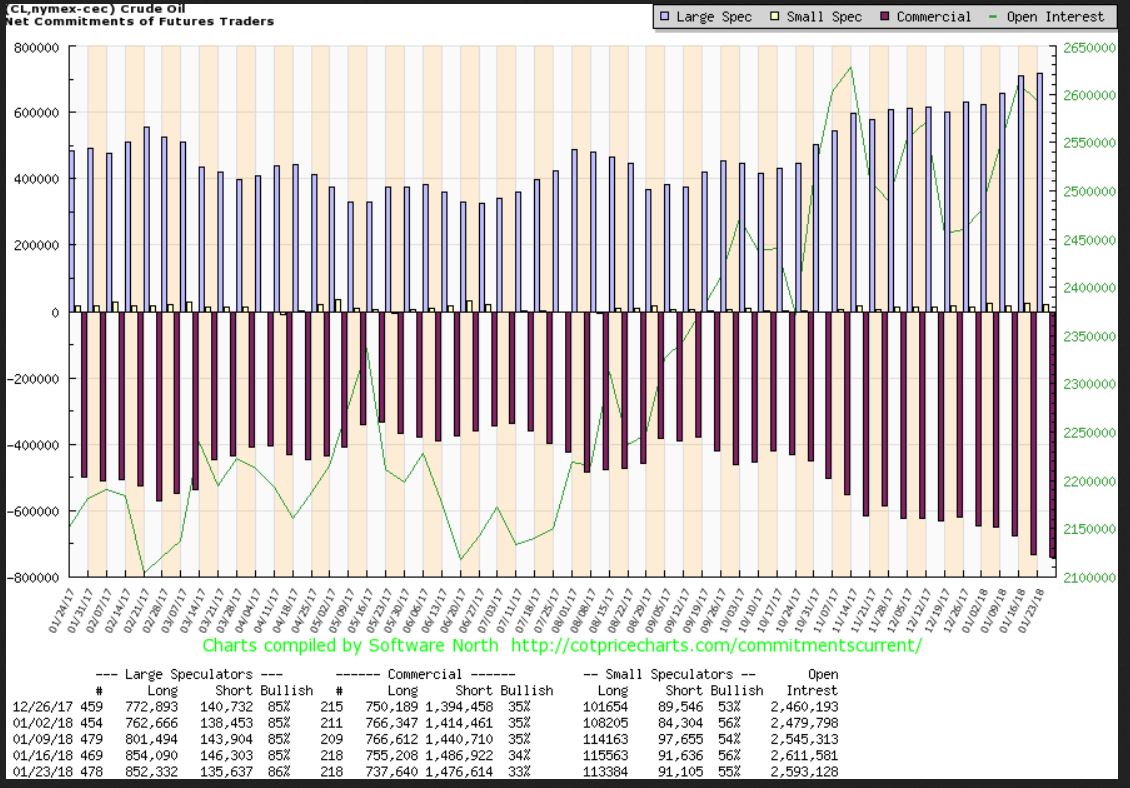
WTIC COT – What can I say? Smart money added to shorts again, and Oil dipped for a bit, however…
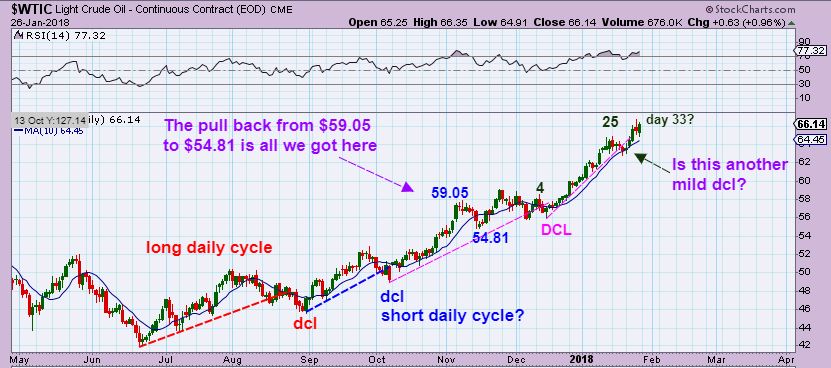
WTIC DAILY – That was a short lived dip & Oil climbed higher again. We MIGHT Have even seen a dcl with the trend line breaking. Please read the chart. The last big pull back was $59 to $54 & then sideways.
WTIC WEEKLY – I expected a bigger pull back with that COT, but Oil just marches on.
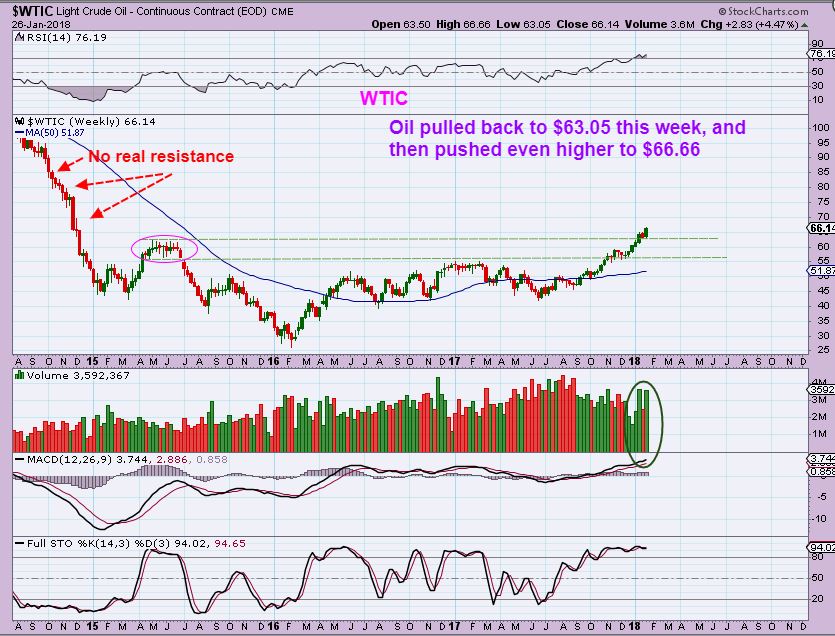
Conclusion: Oil has been due for a deeper drop (ICL), but it has continued higher after smaller pull backs. I stopped trading energy heading into the end of 2017, when I switched to Blockchain, Medical Marijuana stocks, and started really focusing on a Low ( ICL) due in the MINERS. It is now difficult to enter unless one looks for an energy stock that is not extended or near support and absolutely uses a stop. You may want to raise stops as price rises. I personally am still focused on Miners and am invested in Medical marijuana stocks from September, so I have as many ‘positions’ as I like to hold at once.
3 NEW USD CHARTS
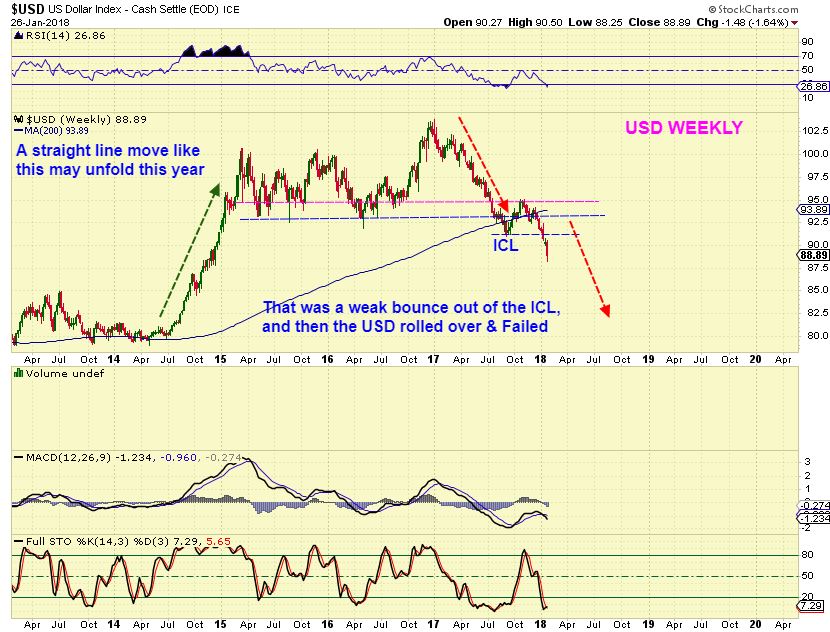
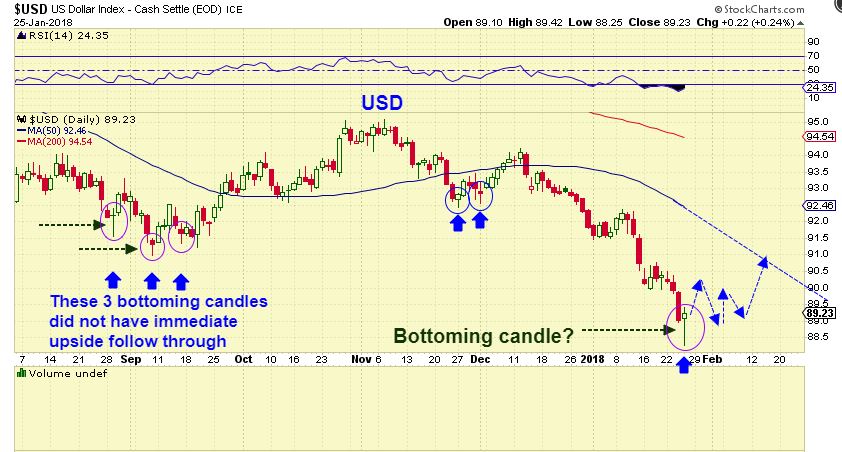
USD WEEKLY – I have discussed the big picture for the USD as a break down after that ICL bounce. I also have pointed out that selling from Jan 2017 to Sept 2017 selling was fairly steady, with no visible ICL. It could happen again. Please read the chart.
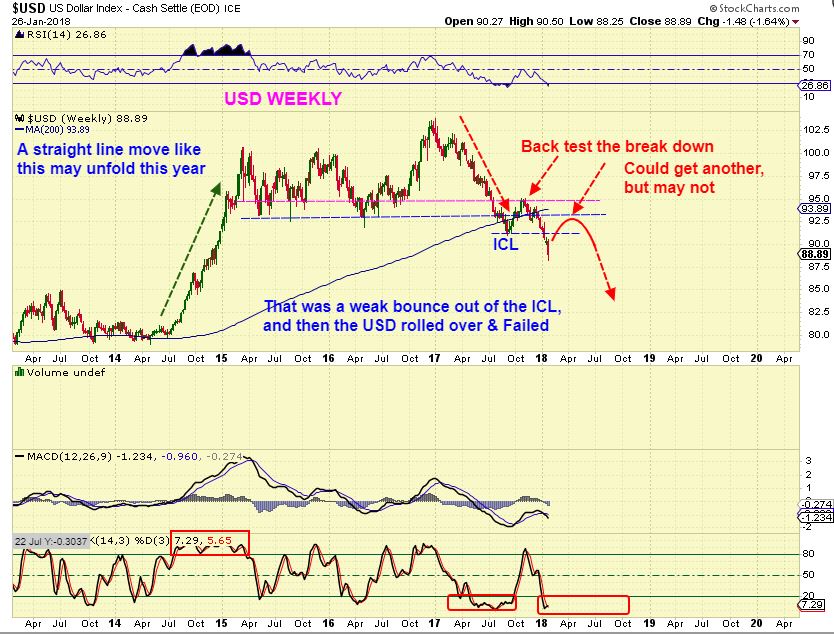
USD WEEKLY – Notice that even straight line moves have ‘bounces’ or DCLs however, so we could get another back test as shown if this is an ICL forming …
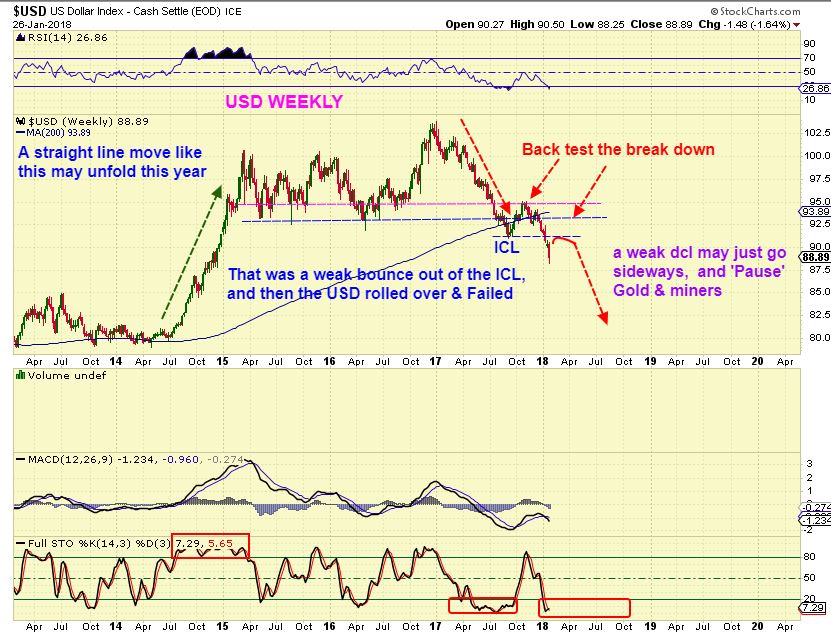
USD WEEKLY – A weaker bounce out of a ‘dcl ‘ might simply look like this and could cause a dip in Gold ( I will discuss a dip in Gold next) .
USD WEEKLY – This was in Fridays report showing how the selling might unfold, similar to Jan through Sept.
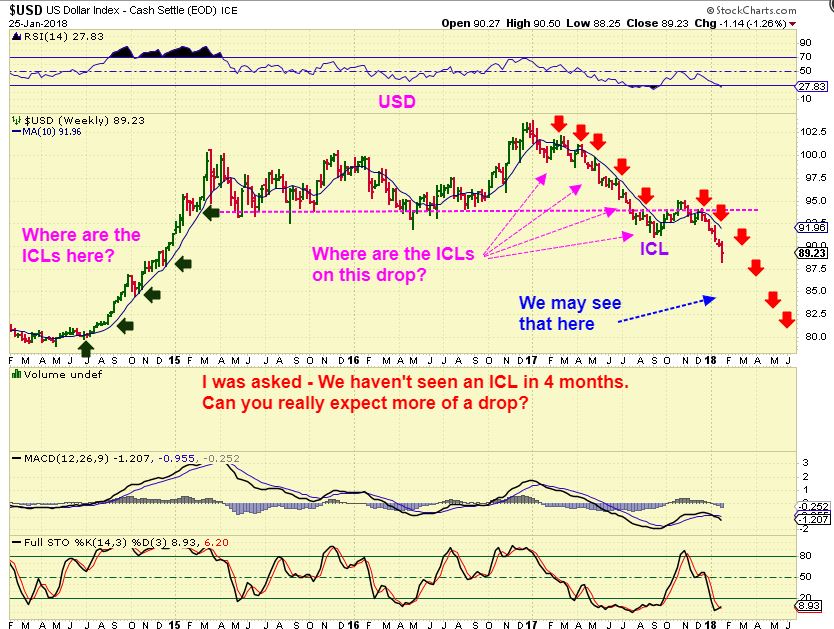
USD – And I pointed out that if we get a dcl, it may just do this, and if it did…
GOLD – Golds dip could match the USD bounce.
4 NEW GOLD CHARTS
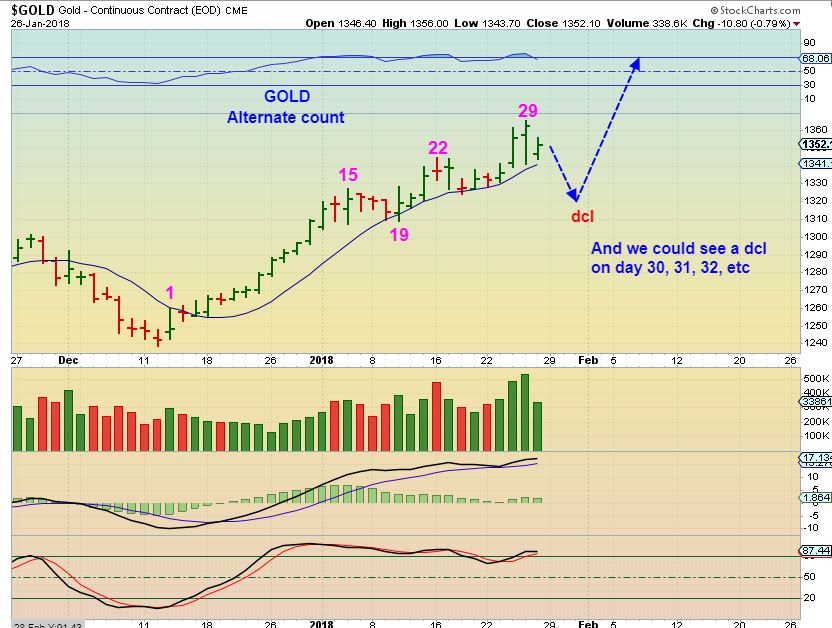
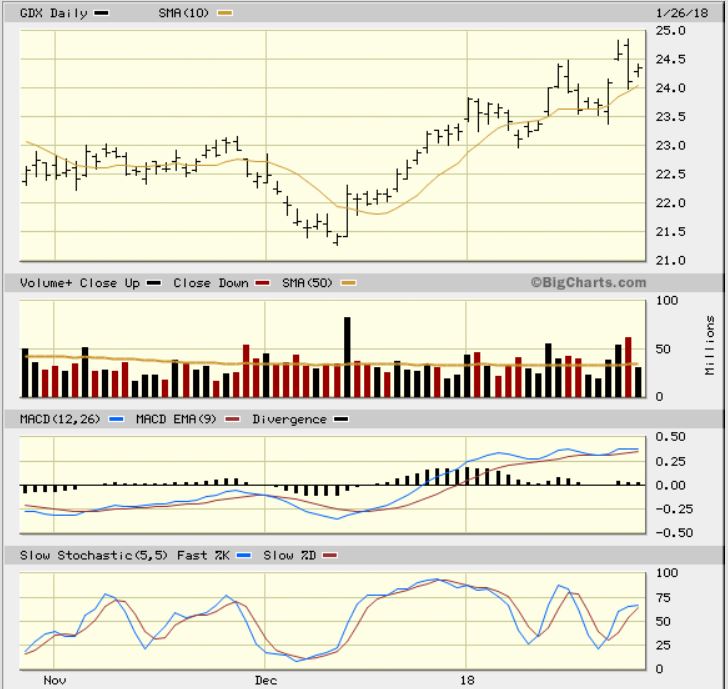
GOLD DAILY MOVEMENT – When looking for a dcl, you look for a trend line break. I believe that we do have that, as shown at blue arrows.
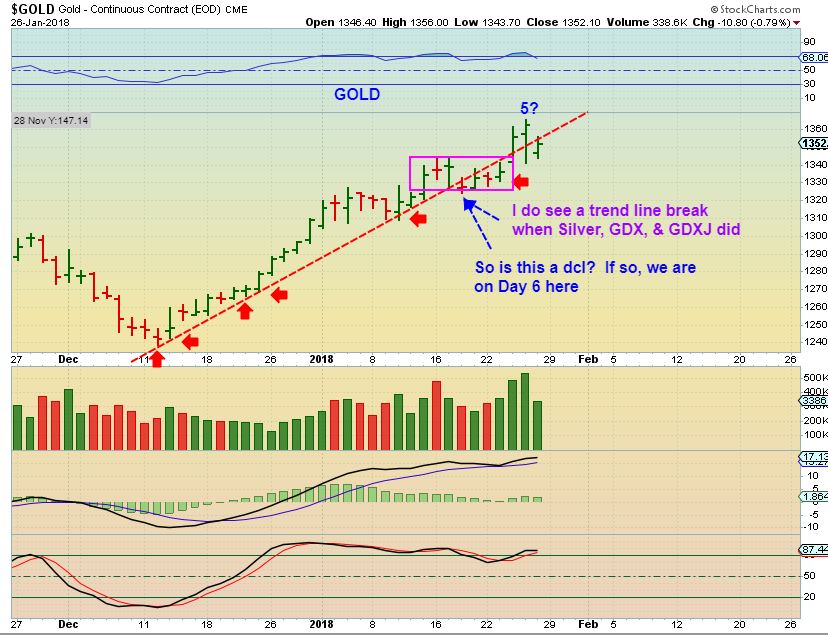
GOLD DAILY CHOPPINESS – On stockcharts, which is the charting service that almost all of us use for past dcls, we did not close below the 10sma. So IF we do drop below that 10sma, we are on day 31 starting Monday and a dcl could come at any time as an extremely right translated daily cycle. It remains very bullish. (Ignore where I wrote we could get a dcl on day 30, I was thinking we had day 29 Friday, Friday was day 30). EVEN A DIP LIKE THIS DOES NOT REMOVE BULLISHNESS.
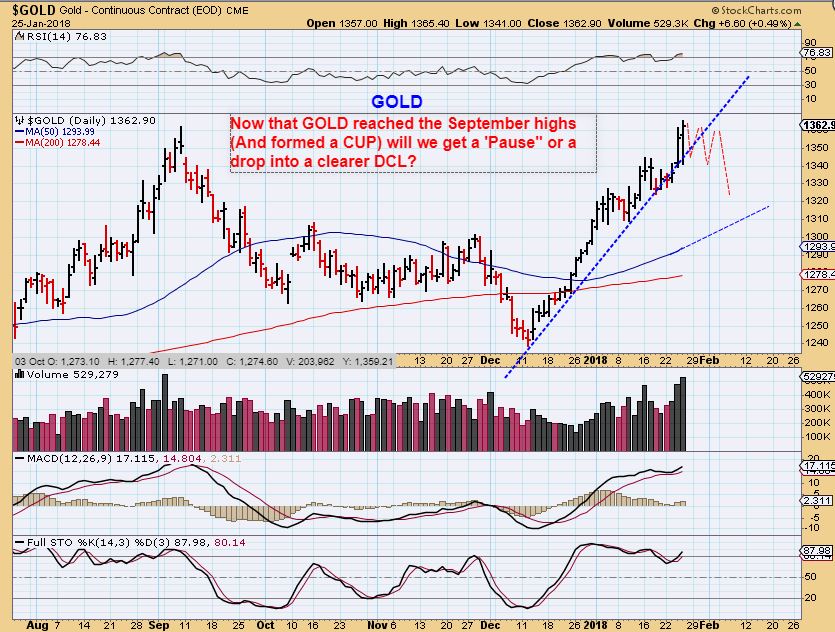
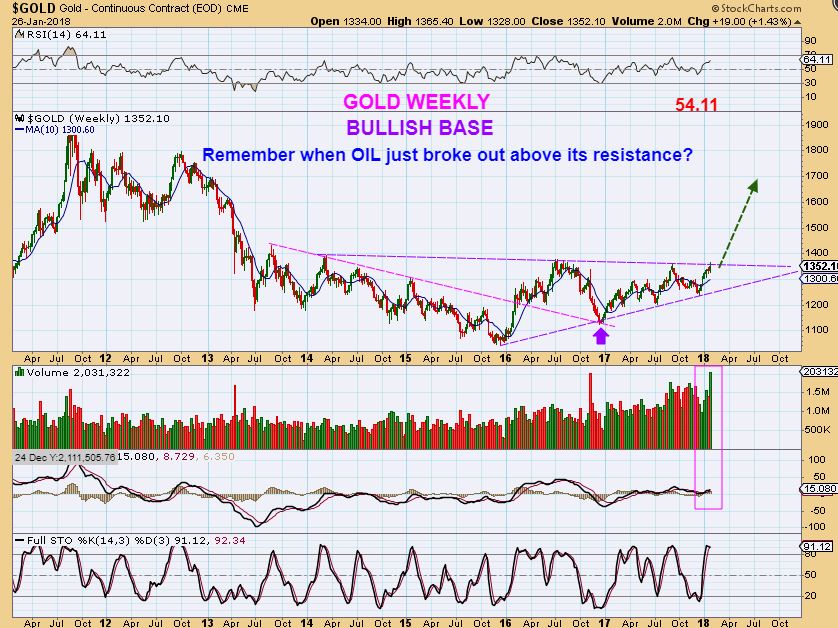
GOLD WEEKLY – GOLD looks ready to break out from a very bullish looking base. Do you remember when OIL just broke out, and the COT was Dead Against it running higher? It just kept running higher, so Gold is expected to do the same on a break out. Upside possibilities over time are very impressive after this break out occurs..
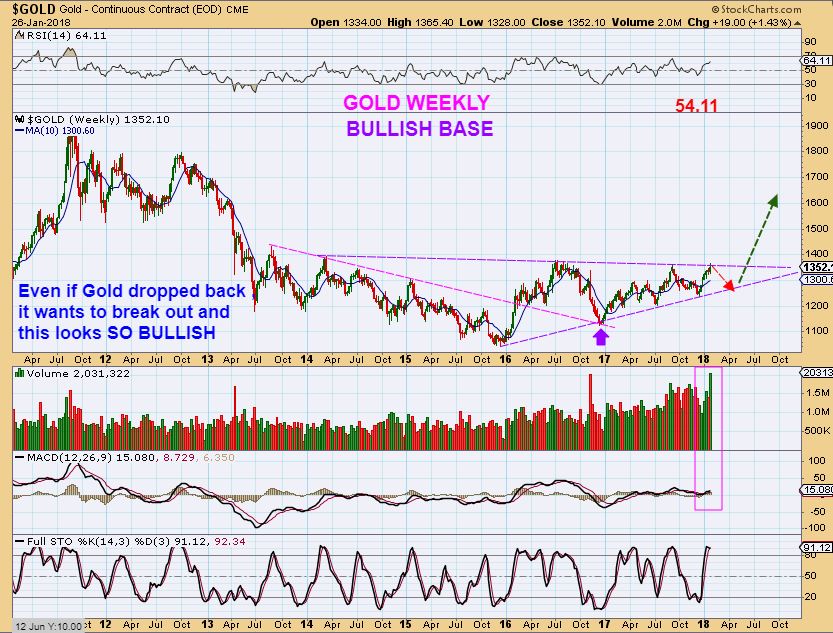
GOLD WEEKLY – Even if it paused, dropped, or got choppy as shown, this is still a BULLISH set up.
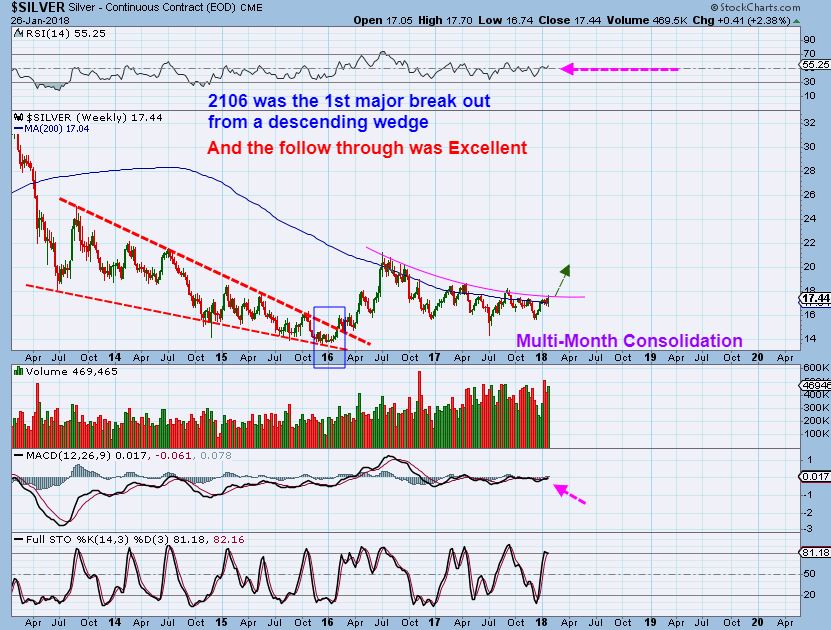
SILVER WEEKLY – This Big Picture remains the same as the last 2 weekend reports. A break out is very bullish.
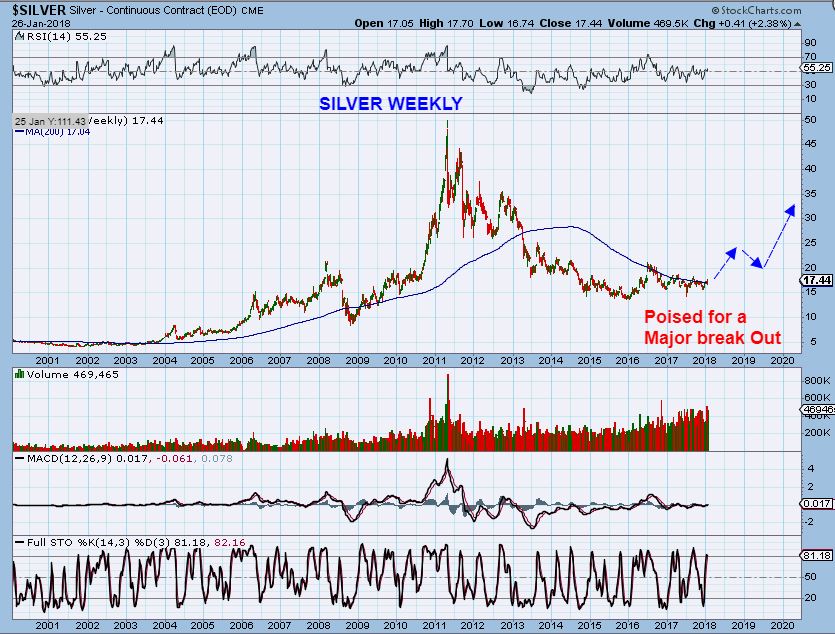
SILVER WEEKLY – See the chart ( Sorry, I meant to write that the year 2016 was the first major break out)
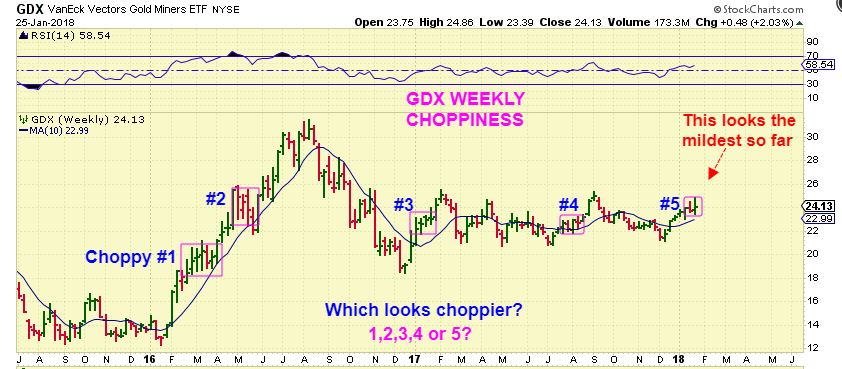
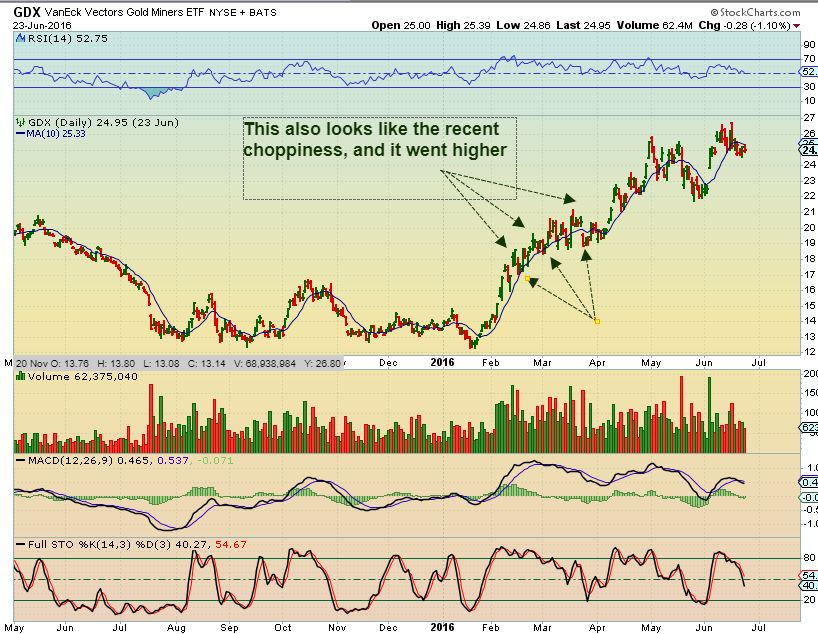
GDX WEEKLY FROM FRIDAYS REPORT – This current choppiness is NOTHING compared to what we saw in 2016, and who didn’t LOVE that run?
GDX DAILY – I have been pointing out for weeks that mid point choppiness is normal. I admit that ‘real time’ it gets uncomfortable, but Thursdays dip shown here, caused no real damage.
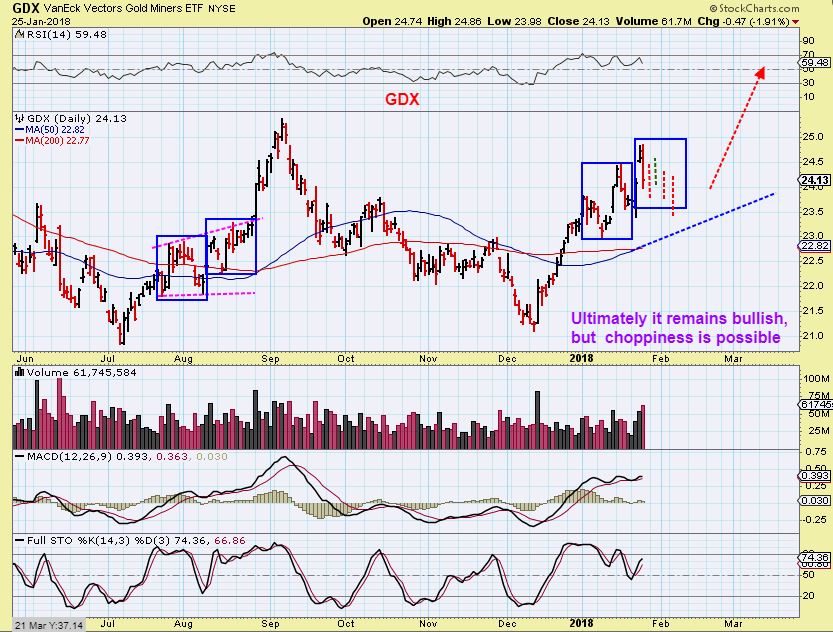
GDX – We rode on some choppy waters Thursday, but this chart doesn’t look like anything damaging, especially since we have been discussing ‘choppiness’ in the short term.
GDX FRIENDLY REMINDER – Please read the chart of the 2016 run higher
So when it gets choppy, we have to look back to the ‘lighthouse’ – the Big Picture Weekend reports, and re-focus on that big Picture.
GDX WEEKLY BIG PICTURE – Please read the chart, and notice that this weeks Thursday choppiness hardly shows up in the big picture.
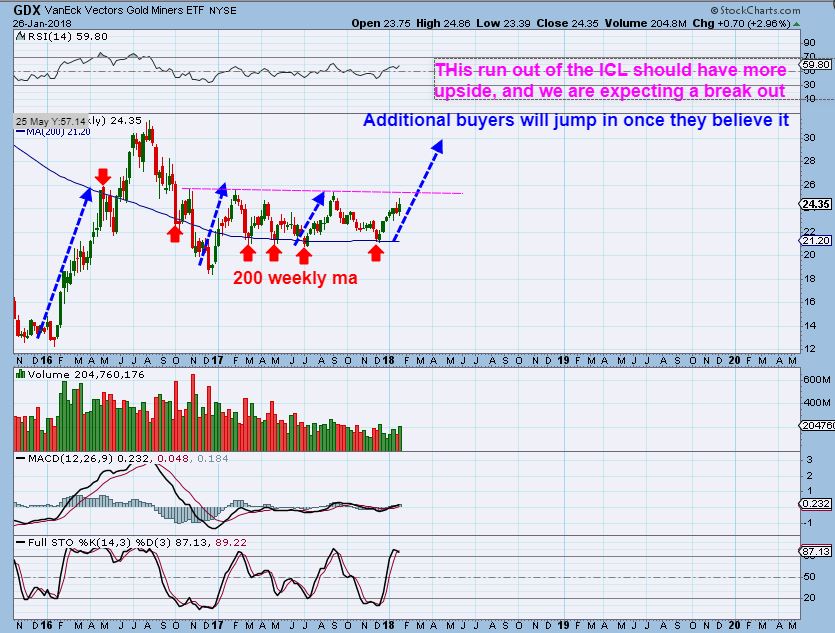
THE GDX WEEKLY ‘EVEN BIGGER PICTURE’ – This could really get crazy if we break out from this base and just start trending higher. ‘Trending higher’ out of a long consolidation is a money maker…
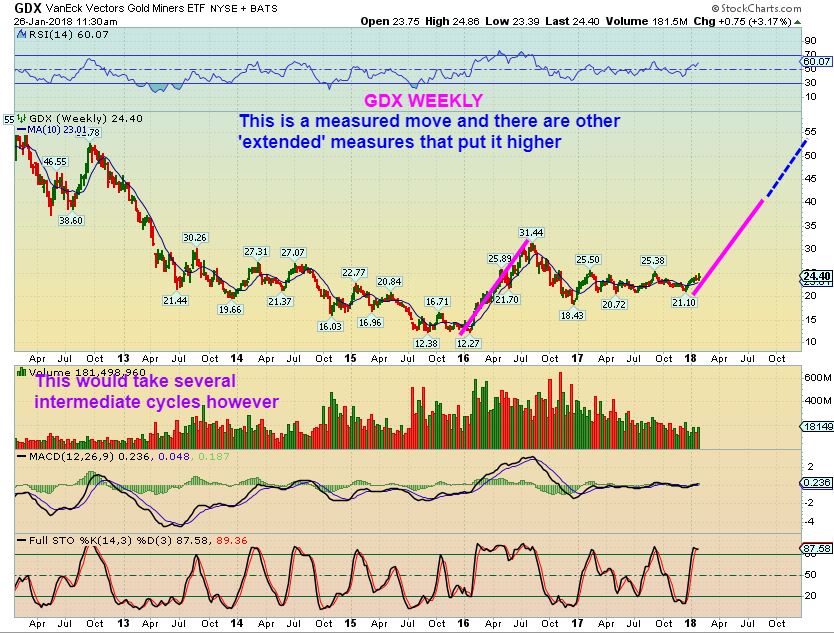
‘Trending higher’ out of a long consolidation is a money maker…
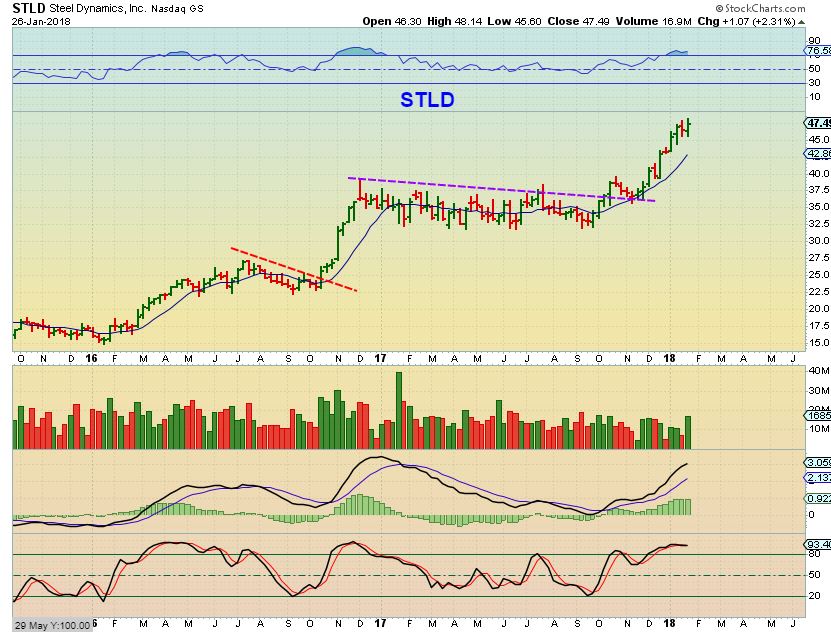
STLD WKLY – I posted this bullish set up in October of a sideways consolidation that STLD looked like it wanted to break out of. I want to point out that these Sideways Moves are bullish set ups, and though they may take time & get choppy, Money is to be made on break outs. I had a target of $50+ from the $32 lows.
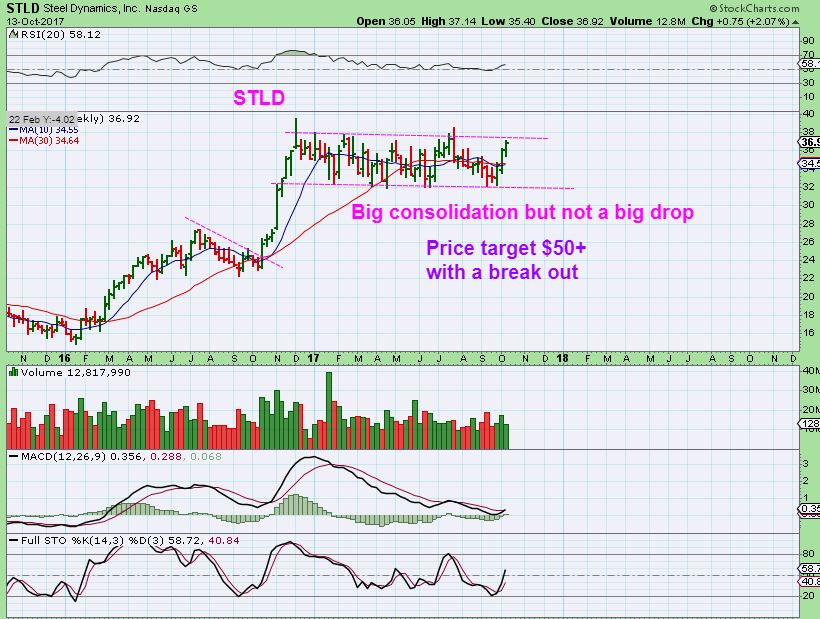
STLD WKLY – STLD hit $48 this week, and it is likely not done. Trending higher out of a long consolidation is a money maker. It was a choppy ride on the daily, and you can see some of the drops on this weekly, but it starts trending higher. Picture GDX doing this in future weeks.
And if I showed you this consolidation, wouldn’t you agree that it looks Excellent, despite daily wiggles? Trending higher from here would be great, and …
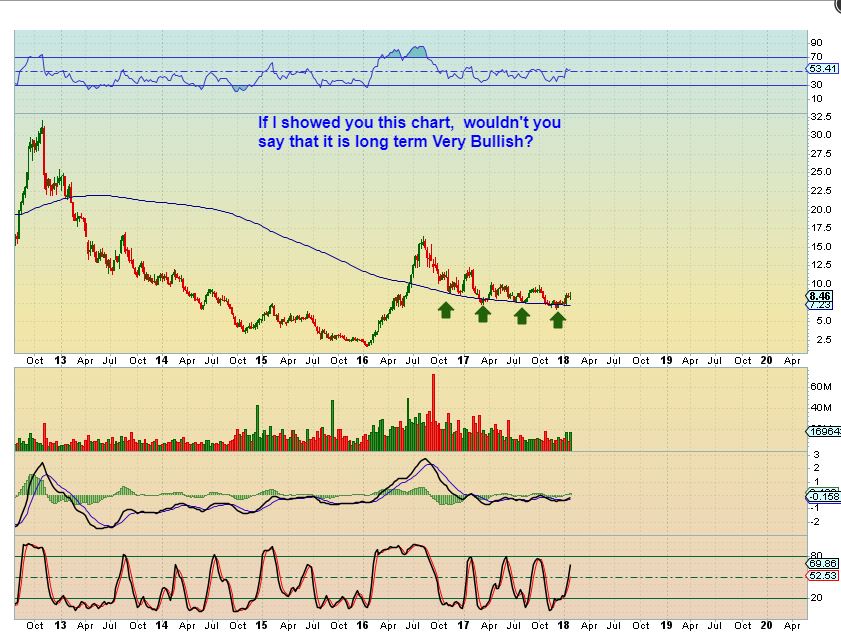
That chart above is CDE WEEKLY now.
That is your BIG PICTURE WEEKEND REPORT. If times get Choppy during the Mid-week, please revisit these weekend reports. If nothing else, they can give you another way to view things, and you can examine for yourself if anything Big really did just happen with recent choppiness.
Enjoy the rest of your weekend, and thank you for being a Chartfreak here with me!
~ALEX
“Sometimes our Big Splashes are just Ripples in the pool” ~ Neil Peart
JAN 26th – Turbulence, Please Fasten Seat Belts 
 Jan 29- WHY?
Scroll to top

Alex,
Nice report as usual. Look at that weekly RSI on SPX, it is in uncharted territory. It’s never been here in the history of stock market. Hmm…
I know, even the NASDAQ blow off top weekly RSI tagged about 90 in the parabolic run. Crazy.
Thank u neil.
FabulousPerspective
….u r the area emotion detector. 😉
#GreatLyrics
Thx Maria – Hope vacation is as great as you hoped for 🙂
Hi Alex – any advise on entering new long positions in general markets? I’ve been on the sidelines most of Jan. considering where we are in the daily and intermediate cycle. Should I wait until after the FOMC meeting or early Feb? Enter now?
Thanks,
Peter
I honestly don’t like to recommend entering positions that are extending, usually it isn’t a style of trading that pays off risk / reward wise most of the time.
Can they go higher? Yes. Can the drop sharply at any time? Yes.
Either you enter and use a tight stop that trails it, or you wait for a pull back , maybe to the 10sma.
I have seen people jump into an extended trade with a fear of missing the run, and get run over on a pretty sharp pull back when it tops, so if you enter a runaway move without a pull back first, you must use a stop.
Thanks, Alex. I appreciate you reaffirming what the angel on my left shoulder is telling me, so I can ignore the devil on my right shoulder 🙂
Or use a stop – that guy on your left doesn’t want you to use a stop either,
Alex, I actually got an email notice about the report being ready and I’ve never gotten them before …..so something must be working! 🙂
Yes, The other system set up is an automatic alert & goes out automatically as soon as I post a report, but it has been broken for 2 days ( Not sure why).
We had to send out a manual email alert, so we just blasted everyone on our email list.
Please keep this quiet until I accumulate more physical silver lol
I know, right 🙂
?testing
Deshy, U passed.
Way too early to comment on pre-market movement, but the USD is climbing and so is GOLD & SILVER a little bit.
That just feels better that the USD rising & Precious Metals selling off 🙂
It is light evening trade, but just thought I would mention it
That’s funny – now all 3 dropped
Thus far, at 7:15 am, miners are hardly down. Perhaps your idea of a muted decline or sideways action in miners, while gold corrects, is going to play out. Ideally, I would like to see a gold pullback today and with follow through weakness at the open tomorrow to buy into, but I don´t always get what I want.
Thanks, CF. I´m wondering if this short term pullback in gold and miners might play out like it did in December, with the low of the dip occurring just ahead of the FOMC decision? I still have some funds to put to work, so will add into a Tuesday dip if it occurs.
Yes that would be great
Bond futures continuing the cliff dive, making new lows this morning. Somebody dosen´t have much faith in a dollar bounce.
Thanks “captain” for helping us stay calm as you chart us through choppy waters.. There’s the Fed Reserve tanker headed straight for us tomorrow and Wednesday. Though this is the last time we will see Yellen at the helm, and don’t expect nothing more than formalities, the markets are still conditioned to react every time they meet.
Yeah, you can always rely on those FOMC meetings to make the water choppy.
I was hoping for a dip into Wednesday and then the start of the 2nd leg higher, but you never really know 🙂
Northern Dynasty Minerals: U.S. EPA maintains restriction on Alaska mine project
6:46 AM ET, 01/29/2018 – Reuters
** Canadian miner’s U.S.-listed shares fall 21.6 pct to $1.20 before the bell
** On Saturday, the U.S. Environmental Protection Agency said it maintained restrictions on the proposed Pebble copper and gold mine project in southwest Alaska’s Bristol Bay region
** Pebble mine is the world’s biggest undeveloped gold and copper project located in the world’s largest sockeye salmon fishery and has drawn opposition from environmentalists, some native groups and sport fishermen
** Northern Dynasty said it filed its first application for a permit for the widely opposed project in salmon-rich southwestern Alaska on Dec. 21
Now NAK’s press release on Friday makes sense where they said everything remains on track. It seemed like a pointless release, but they clearly knew investors wouldn’t like the EPA saying they “maintained restrictions” on the mine.
Glad Alex told me to sell the rest of my shares last week. Thanks Alex!!
I was just thinking that someone asked me about NAKs chart a while ago , and I couldnt quite remember who. I do remember looking at the chart and mentioned
that I didnt like that the 50sma was now curling downward and it looked to be breaking down. I think you said, “Should I sell or hold a bit longer?” And I mentioned
‘Its giving no real reason to hold on with the 50sma curling down … ‘ and maybe mentioned that it is heading for the 200sma.
It’s odd, the chart was starting to show a real lack of strength and it always seems like ‘someone knows something’ before it hits the news.
I’m going to hold for now. Seems like an over-reaction. Alex, have you sold your NAK?
I did, but not for any major reason at that time – I was planning on buying it back later. I only sold it because I had too many positions at one time ( 15) and it was just going sideways after crashing through the 50sma.
I was expecting it to drop to the 200sma and was looking to re-enter if it seemed to stabilize on the 200 ( but it dropped under & rode along the under side of the 200sma for almost a week. I was going to buy it back when it recovered…
This MIGHT be a buy though, if it is an exhaustion gap down, and then they come out with some news that causes buyers to step in. That EPA quote said something like until the safety of the area can be guaranteed, the project would not go forward. As NAK files for permits, they will claim that they can guarantee the protection of the environment and may get some permits. It seems to be news driven in both directions lately.
I need to watch it and be patient.
Thanks. I’m thinking it may be a buy too. Please let me know if you lean towards buying it. I may add.
So far, it is just sitting in the same spot and volume is rising, so it may have accumulators buying while sellers sell out, and that could be an exhaustion.
The most bullish thing would be a gap open tomorrow that doesnt fill. I would buy that
I sold weeks ago, just got tired of it, can always re-enter but it wasn’t doing what I expected it to do anymore…
Yeah, they are getting hammered in premarket,,if they overreact to the downside, might be decent bounce play to be had today.
Glad I dropped NAK sometime ago. Tough one this morning.
Lucky you! Ouch.
I would love to see this slam down just sit there and build up volume without losing anymore price.
it could be an exhaustion gap
Well, they fixed the auto-email alert & it promptly recognized that I published this weekend report , so it sent out an auto email alert .
Sorry about that 🙂
Bought TBPMF @ $1.31 near the open
Out of CNBX for now.
I still like the Canadians , may add to OGRMF, but I really have enough of that one
SGDH? Nice chart. MJ.
Do you think CNBX is headed for the 50-day? What made you sell?
It may or it might not sell off further, it could hold at the 34 sma.
I was just thinking that I want to reduce risk by holding Canadian companies in this sector.
Any surprise announcements by Jeff Sessions seems to hinder the US Companies. Some may do very well, and if they do I will look for a place to enter, but when I bought TBPMF, I needed to let one go, and that US company was the one to let go at this point.
Why does that chart look good to you?
Longer term, starter position, just in case it keeps moving higher / sideways / higher.
It does appear to be extended on the weekly chart.
If you use a 20sma, it could drop there on the daily too.
but longer term the 1 year wkly chart speaks for itself as Bullish.
LODE is impressive
FCX consolidating nicely after big run up. I’m just DT the wiggles for now.
may be of comfort to any NAK-kers.
has bounced off an 8day 65ema chn,, which it did once before, at the back end of 2016.
might be a useful red-line escape point if it drops below that again,…. unless looking for support at that 8day 50sma just below, at around 1.00
https://uploads.disquscdn.com/images/4b21e1dc69e0ac20d8be828272b1e2c645773199e5083d509d9c95ff411d757f.jpg
Thanks SOG…I know you are talking to me.
at least you weren’t invested in this….(I hope?!)
https://twitter.com/thelateempire/status/957527371221028865/photo/1
Alex .. censor the above, if its too risque for daytime hours 🙂
Can’t see it so don’t know…lol…but I feel like I own everything else and all but 3 are red! Yik.
Dang!!! I was just about to say that!! lol!
Just kidding. 🙂
Two stocks. GBTC and CANL? For real?
GBTC did a 91:1 split ( Thats crazy)
It closed at $1645, opened at $18.78 post split.
Looks like GBTC is setting up again….
So far I´m pleasantly surprised how my miners are hanging in there, and MUX is only down a penny. 🙂
NAK dumped today
GLD finally below that 10 day MA as I type, searching for a DCL next.
Alex, do you ever look at safer stocks for recommendations? Non commodity.
Well Hello Bill – kind of a surprising question, I guess. How long have you been here, 3 years?
In the past I’ve recommended any of the following when they were low risk set ups …..FB, MSFT, CMCM, WIFI, TWTR, YELP , YNDX, AMD, JBLU, HA, TOL, KBH, CY, FNSR, CGIX, VSTM, BAC, HBAN, JPM, ETC ( No one cares for the banks, they move too slow) , MYSZ, OGRMF, SPRWF, ( Blockchain RIOT, SSC, MGTI , etc are not commodity) RENN, KNDI, VJET, CSIQ, FSLR, NVDA, XBI, LABU, TQQQ, UPRO, Tons of Biotechs, GRPN, VIPS, DDD, NQ, S, JRJC, HJP, WNDW, JKS, SPWR, XONE, many shippers, but they may be considered commodity since they are related to oil, etc etc etc .
And, You also know that right now we have an ICL in Miners in December that we were focusing on and we have been waiting for this. We are well off of the lows of Mid December, but are currently experiencing a pull back.
If I decided not to cover Miners at the Dec ICL , who would be the first to ask me ” Why aren’t we covering Miners? They’ve been running since December!”
LOL, I shouldnt have said commodities, I don’t know how to say it? More mainstream SP500 stocks. Bitcoin I consider as risky as MJ and GOLD stocks. We all know how risky Pharma can be and forget shippers. I’ve been here a while, I don’t remember too many of the others. B, MSFT, CMCM, WIFI, TWTR, YELP , YNDX, AMD, JBLU, HA, TOL, KBH, CY, FNSR, CGIX, VSTM, BAC, HBAN, JPM, ETC
ok, so sounds like you mean the slow & steady? Many of the tech stocks only look easy to ride, they also get choppy. Take a look at BAC, JPM, HBAN. When I mentioned a break out of a cup – they were buys, but they do tend to be a bit boring.
Usually when I post main stream safer stocks, that tend to go sideways and make slow steady gains, but still have pull backs along the way, no one remembers them ( including you as stated above) , because they are boring and the group often wants the faster gainers.
There have been times when I specifically called out a set up as a long term hold and they do trend higher, but they are rather boring in their gains.
And as I’ve pointed out many times in reports, in hindsight, bullish charts look great & you think you missed an easy ride, but riding them in real time? Not easy.
refresh – Last year I posted this of NFLX . Many were saying it was such a good buy & easy bull run to ride. This showed that price never gained for over a year. It was choppy. It is not always fair to look at a 5 yr chart from $20 to $120 and say, “Why didnt I ride that?” The answer is choppy trading – add a couple of days like today together & it causes people to exit positions.
https://uploads.disquscdn.com/images/f782198ef6c634bdb41b12022df6d0a4aa7daa47c062e4d79564b4645e8cfbe6.jpg
I think its fair to say Timing is everything. If you buy at the wrong spot you get stopped out and hate that stock. I’ve been in several for a while now that seem to do pretty well without the big pullbacks. OLED, PYPL,VLO, and USG. USG was my hurricane play, and its worked out great. OLED has pulled back lately, but was an easy ride so far.VLO I sold when OIL got over $60 a barrel. These are the kind of stocks I’m talking about. Im sure you can apply your excellent chart reading to stocks like there.
This is ugly.
No JNUG or NUGT but still very tough morning. Just ride it out.
Bought more USLV
I still own a good chunk of JNUG – Rougher morning 🙂
I’m pretty much getting throat-punched here. Real rough. Got get better soon!
I bought JNUG this morning. 38.2% FiBo retrace on GDXJ
Might get some more here. My recent JNUG entries have been horrific.
NSRPF no longer really selling off. Could be good when things turn upward
GBTC going to be the favorite crypto with that split check out volume
Blah MJ and Silver…..but corrections happen
Alex, any potential targets for a DCL in gold based on fibs, MAs, etc?
Not really – Usually the safest thing to do is wait for a reversal and a confirmed swing low.
Targets often do not play out as expected
Chart By Request
https://uploads.disquscdn.com/images/ab1d802d7baf6a40179c763591c751563a87bc2effb01b56f400bb4a429d4277.jpg
I forgot to put on this chart that the sell off in red box #1 was a little over 50%
GDXJ starting to get towards near-term oversold, maybe close here. GDX not there yet.
Taking a look at GDX vs GDXJ – The juniors are selling down faster, that is rather normal, they also climb %- wise very quickly.
GG, NEM, ABX – NEM looks excellent ( That would probably be a good buy as a break out and back test soon) . GG seems like lightish volume selling so far. ABX didn’t get very high off of the lows, and looks to be the weaker of the 3.
Picked up a small position in JNUG with the little extra cash on the sides. Now its wait time.
VSTM – We used to trade this and it did very well, looks to be trying to make a move ( Just not sure if the follow through will be there yet) .
I would say ( For traders) it could be bought with a stop belwo the 50sma or 10sma. It did gain the 50sma at the end of 2017, but gave it up, so it is a tad more risky for that reason.
GOLD following the pattern (July-Sept 2017) pretty well. Could get one more slam down. See the overlaid gold bars
https://www.tradingview.com/x/GGw6aiGJ/
A drop tomorrow that reverses would be sweet. Im ready for DCL now!
Hi guys, just wondering, what software do you use to journal your trades? Is there one with reliable importing from Fidelity?
EDXC looks like a bull flag breaking
Buy at 0.061 sell at 0.067 for 12%. It been range bound.
I’ve been holding this forever, trying to be patient and just not watch it (and I own a small boat load), partly because of this chart (attached), and partly because of their profits increasing when they started selling their Phyto-Bites
https://uploads.disquscdn.com/images/373397af373b764b4361fda3c323e604ace24d9338cdeff304a75208d3b1ebf9.jpg
News out today about an expansion. Its products going into Impulse Health…some collaboration with “autospense”
Really popping now, so much for trading range
Finally!
Still own it. Go baby
One of my few green stocks, today. 🙂
I keep forgetting about TECK. 2016 generated a beautiful rally, where I was lucky to take profits. All of 2017 it has been in a meandering trading range. It looks like it’s getting ready for the next year long move. A bit of a pullback would be welcome! https://uploads.disquscdn.com/images/445f2c81a99dd27586dea568155954e809f36f3f7036f526425c727d73afb15e.png https://uploads.disquscdn.com/images/bbce7b05f5621bf6b2677cd0b9be0a5481104579da381195567fefa515b500b3.png See the daily and weekly attached charts.
There are a bunch of the industrial miners consolidating nicely. I think they will lead the way – maybe even before the USD completes the bounce
Copper futures only .08% drop today – Dr Copper might be the man
Pretty low volume in the GLD thus far.
RALPH, I’ll say, U do stay positive. I follow you’ve every buy. What U buy, I buy. We’ll get rich together. OK ??
Emerging Markets (EEM) on top of buying on weakness list, in two different funds.
RMHB on the move
Alex – what do you think about heiken ashi charts? Also do you follow smaller time frames besides weekly and daily charts?
We have a subscriber that pretty much uses them exclusive. I dont use them that often, but they can help identify trends or turning points.
I do follow smaller time frames other than Daily weekly – but I usually do that for shorter timed framed trades .
I find that when someone says ” I have a BUY on a 5 or 15 minute chart” – That is fine for a very short time period.
A 15 minute chart can change in 15 minutes.
When I feel we are approaching a low , I may use them for entry, and I do check all time frames to see if they look like they are aligning. You can get a 15 minute chart “oversold” and bounce, but if the Hourly is still Overbought, that 15 minute chart will get overbought in an hour or so, and all I get is a 1 hr bounce, etc .
I hope that is all understandable. And there may be other uses for short time frames too.
Thanks that makes sense. Find the big moves on the weekly/daily charts, and use the smaller time frames to fine tune the trade. I’m trying to get away from scalping.
Gotcha. I’m trying to scalp less too, and that is when the bigger trend can help.
And using the smaller time frames does help with entry & exit if I’m paying attention to things that way.
Alex,
I am concerned about silver volatility and maybe because I have a good size position. Should I hedge with dslv going in the dcl?
It wouldn’t hurt to hedge, especially if you have a large position.
thanks Alex for your thoughts.
I did not this time but when an obvious decline is coming, I usually do and it’s been successful in the past.
I’ve also used married puts in the past (options) – a little complicated with 3x than with base stocks, though.
Alex or anyone is there a 3x for the industrial base metals miners?
Here ya go Ron
http://www.3xetf.com/ETF_List
Today seems like the first that buy the dip didn’t work in general markets. They actually receded after the intraday rally.
Yeah that was really interesting. Had the normal midday move up and then rolled over into the afternoon. That’s classic on a pullback. Should be a great chance to go long? We haven’t had one in so darn long it’s hard to know when is safe!
I´m probably early but couldn´t help but add a little to my miners, does not feel like we are done correctlng, but how I feel never made me any money.
GLD might not even close below it´s 10 MA at this rate, wonder if that means more downside, or is showing that it is hanging in and the downside will be limited. Dosen´t really matter as I am in this for the long term, I suppose.
I have 24% of my buying power left, and plan to put it all to work over the next several days.
CF, with the general markets , Maybe, going down, what do you thing of our metals? IF, IF, the mkt tanks, do metals tank also?
Hey John
I just need you to know – When you see everyone name in RED, and yours is in Grey- we have found that those with a grey name – their comments dont show up when you first post them. They dont ‘auto-load’ like when you see other people comment and their comment just appears. The comments from those with Grey names only show up after we refresh the page- So I missed all of your comments today.
I didnt want you to think people were ignoring you- they just cant see you.
It happened to other subscribers and they had to go to DISQUS and resign up ? I forget how they fixed it.
So if the marlets drop do metals tank was the question. I find that they can rise together, drop together, do the opposite. They have their own dynamics, and I would have to see what plays off of what as the move unfolds.
I hope that helps & Sorry I missed this earleir
Guys my cycles are showing that US dollar is starting a new intermediate cycle …. gold miners under pressure until at least mid March. If you bought Jnug place a stop under it …. just my two cents. Hope I am wrong…..
The dollar is up but not THAT much , is it ?
David – In the context of the cycle analysis Alex provides it may be more likely this is a few day bounce and then a continuation of the downtrend. That’s how I see it and will be playing it, with stops. Cycle analysis appears to be almost useless when it comes to a strong directional moves. I’m waiting to hear what CF has to say tonight but I’m really close to moving back into the base miners.
CF just commented on US ICL possibility above… does not think it occurred yet.
how do you find silver in that case? is it possible that will be clobbered?
I have 16.33 by March 7 if it fails then 15 by May…… then surge to new highs beyond 2016 into end of year…
CF is better to give advice . Let s hope after dcl in gold here things resume up….. gold wont really take off unti gold silver ratio is in check….. you will have both go up … although silver will explode if this wave 3 of an intermediate cycle….again please ask CF…for his thoughts….
I appreciate your thoughts David, it will make me dig deeper 🙂
Along those lines and taking my gold bull hat off and thinking objectively, IF the dollar is in a new IC, that would add credence to a double top at ~1365 and more downside to come.
I have sent everything to CF on possible alternative sceanrios. I am sure he will look at them andd include them in his report for everybody to consider for trading miners /metals.
Hi David thank you for your thoughts, something to respect if $ has put in ICL last week. I will probably hedge my silver position, as 80 cents to march 7 will hurt. Strange though as this seems to be just a 1st DCL for the precious metals, I am afraid that if it fails we would have a problem until may like you say.
Just so you all wont wonder too much and lose sleep 🙂
I have mentioned that we have been ‘within the timing for an ICL in the USD’ ( I have been saying that in my reports).
All that means is that we have seen ICL to ICL at 4 months in the USD before.
Nothing has changed my view from all my past reports. And I have discussed this in the USD big picture etc. Scroll up & read this report USD & GOLD again. Nothing changed today from what this report pointed out. Look at the Charts again, Did Gold do anything unexpected from the charts in this report? Did the US? No- they did what this report pointed out,
So really – yes, we are ‘in the timing range’ that the USD COULD put in an ICL , but we have seen USD ICls come 6 months apart, 8 months , etc. Again, Look at this weekend report.
We do NOT have confirmation of an ICL in the USD. It COULD happen, but nothing shows an ICL yet.
And I will cover it again in the next report, but it is basically as I have been saying, even in this report.
I’m not doubting what you say you see, just curious…
How does your cycle work identify the difference between ICL or DCL on day 2 after a low?
Just that 4 months from Sept means one is due- or is there more? Thanks
I will email directlyt thanks.
Sure, Thx
The advice to use stops on JNUG is a good idea, nothing in the markets is a guarantee and a 3x etf does drop rapidly
In GDX and GDXJ… all the volume seems to happen at the start and end of the day.
Only saving grace at this point is the VWAP, pointing to a probable morning recovery. After that, who knows.
They always load a bunch of volume in at the end at the close. I’ve seen GDX volume jump over 3-5 million at the close, sometimes a lot more
Judging by sentiment today in the comments, it seems like we’re close to a DCL. Every DCL I’ve seen in gold has you questioning whether it’s in a bull, and usually reverses once enough capitulation is complete. RSI getting close to oversold too on GDXJ.
Peter, I think that U R absoutly right. I do.
Been away all day, got back last 15 min – any news anywhere? SOXL (and most semis) went bananas end of day
I was lookng at CY, MU, and – (can you believe it) AMD. 🙂
Crazy that AMD $9 to $15
Yea I was bugging out. Trying to place a limit order on CY and MU and then Boom outta nowhere..
Anyone lol? Cf?
No news, BT, just marker volitity. Best that I can see.
Man did they tack on some volume at the end of the day to GDX ( Crazy)
I see 16 million in the last 3 minutes on a 3 minute daily chart
CF, what’s your take on that, the volume? Thanks
They just add extra volume in at the end of the day. Rumor is dark pools or trades taking place during the day and they add the volume at the end, etc I just use the daily volume by itself.
by the way- I wrote to one of your comments below too- please check it out 🙂
They also have to re-balance the ETF to line up with the investment goals. The larger the move of the underlying and higher regular day volume, the more rebalancing comes in at the close.
KEM looks great – still
Tuesdays report has been released
Got a stink bid ready for JNUG.