I’m starting off the weekly report with 2 charts that I used in the comments section of a recent report. Then we will cover the markets and especially Oil & Precious metals.
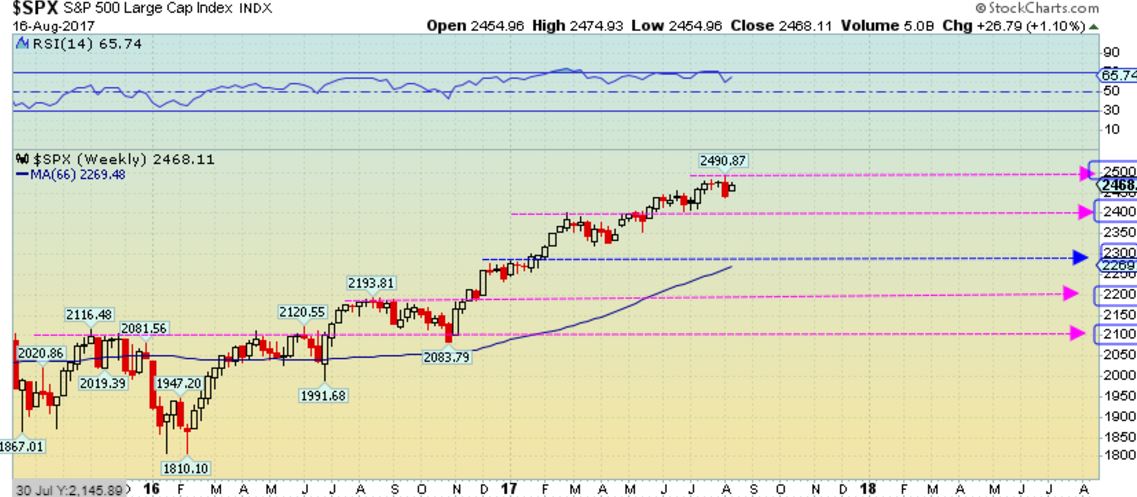
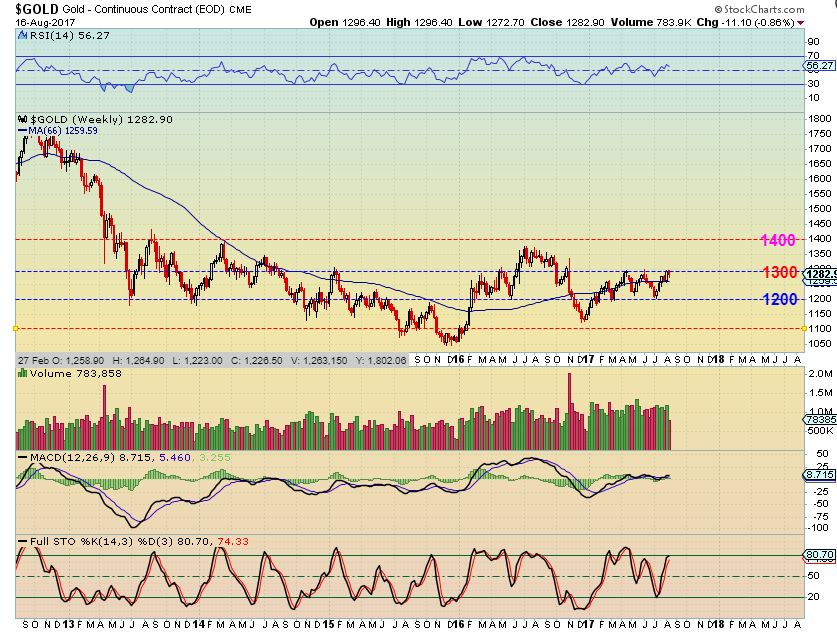
These 2 charts were used last week simply to point out the phenomenon that often happens in the markets. It is the round number phenomenon, where markets tend to find support & resistance at round numbers.
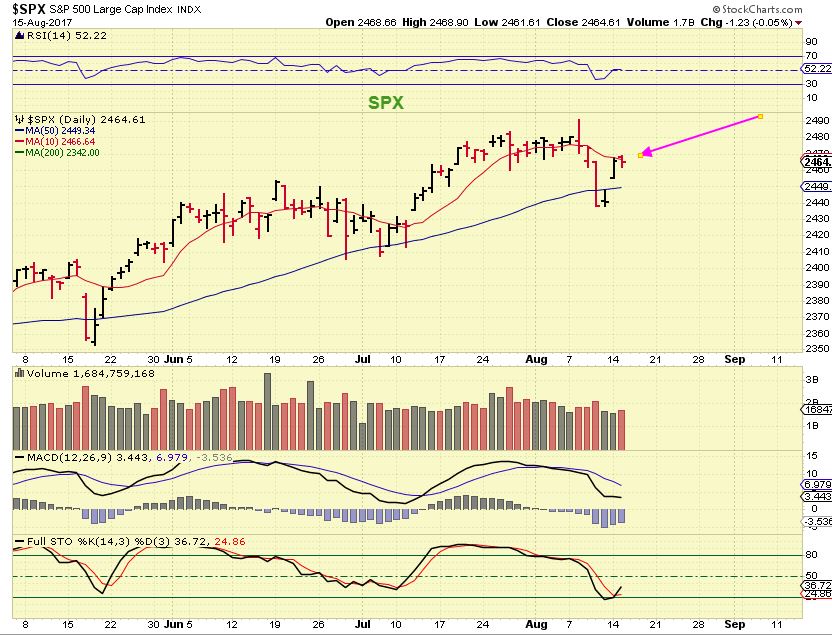
SPX – Here you can see how traders temporarily sell at round number resistance or buy at round number support and this affects price action.
GOLD – And my point is that this can just be a temporary pause. A sideways move may begin and build energy for the next break of resistance. Gold was near 1300.
Read more
Let’s talk about 3 things here today…
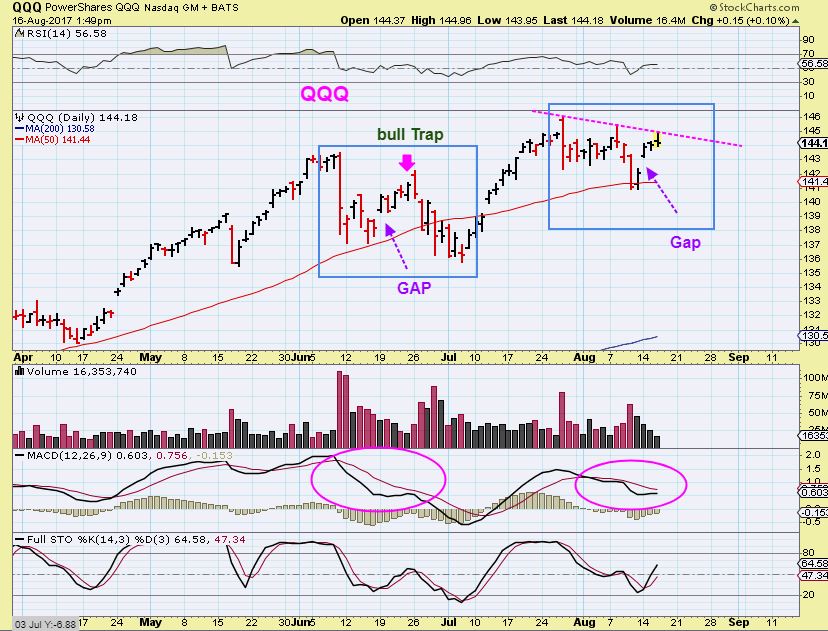
1. QQQ – I thought that QQQ was a bull trap for several reasons, like Cycle timing, The MACD, the Open Gap was pretty obvious, and other internal factors were keeping me cautious, but the Bulls were still buying each reversal.Was this just another Bull Trap?
QQQ – The NASDAQ dropped as expected, actually losing 123 points. The QQQ slammed into the 50sma and it could bounce from here, but …
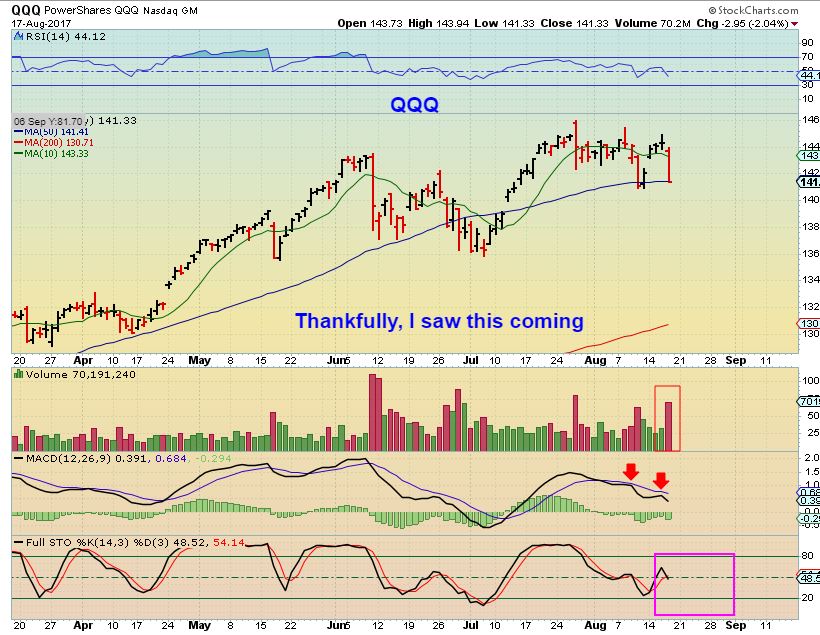
Patience in this area is important. I doubt that we will get a swing low on Friday, with a candle as big as yesterdays in place.
Read more
I sure hope that it is break time! Let’s take a look at our markets after the Fed minutes were released…
QQQ – I captured this chart at 1:49 p.m.- right before the Fed Minutes were released. Do you see similarities in the blue boxes that I have been pointing out? I don’t like that gap.
Read more
As time moves forward, we are seeing progress in various areas of the market. Today at 2 p.m. Eastern Time, the Fed Minutes are released and that often can affect the markets too, so let’s take a look at where things stand…
SPX – No change from yesterdays report & expectation at this point.
Read more
If you need to know how I feel about Miners, check the reports from the last several weeks, but I will add one more thing to that discussion at the end of this report. 🙂 First let’s do a market review…
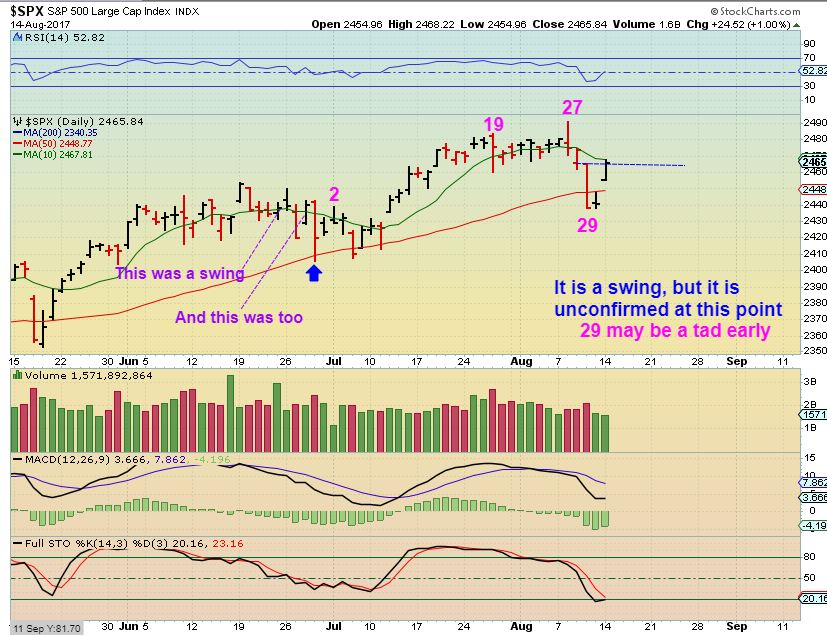
SPX – After breaking below the 50sma as expected, A gap open Monday has put a swing in place, but it is unconfirmed at this point. Another day of follow through may help to clarify this picture. Day 29 is on the early side in the daily cycle count, so let’s see what Tuesday brings. See the chart and we’ll look at the NASDAQ.
Read more
I wanted to put out an extra report this morning to discuss Miners a bit more…
Read more
This week was a week of solid activity, and I have quite a few charts concerning the Gold & Silver race, so let’s take a look at the action…
Read more
IT’S FRIDAY, THE LAST TRADING DAY OF THE WEEK. LETS DISCUSS WHAT IS HAPPENING IN OUR MARKETS CURRENTLY, ESPECIALLY WITH THE PRECIOUS METALS, AND THEN I WILL DISCUSS THEM IN DEPTH IN THE WEEKEND REPORT …
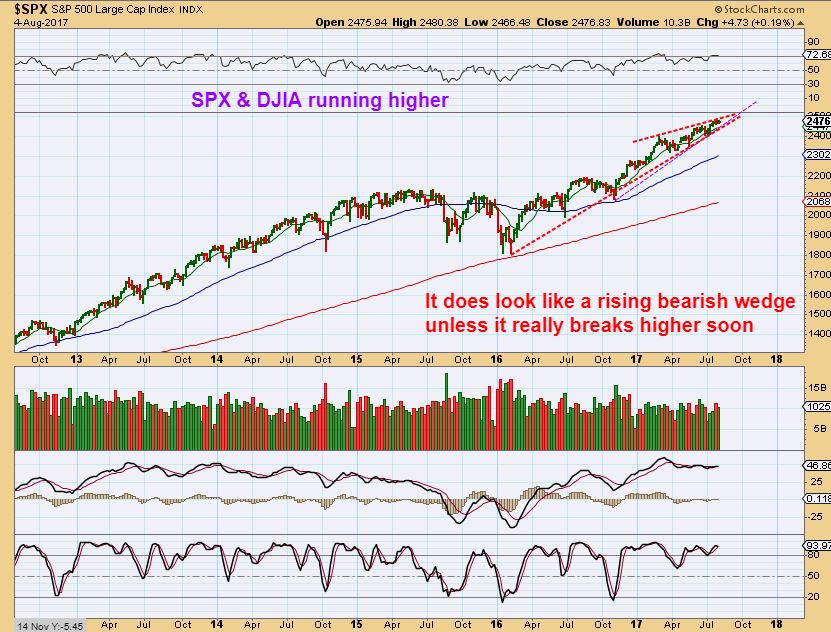
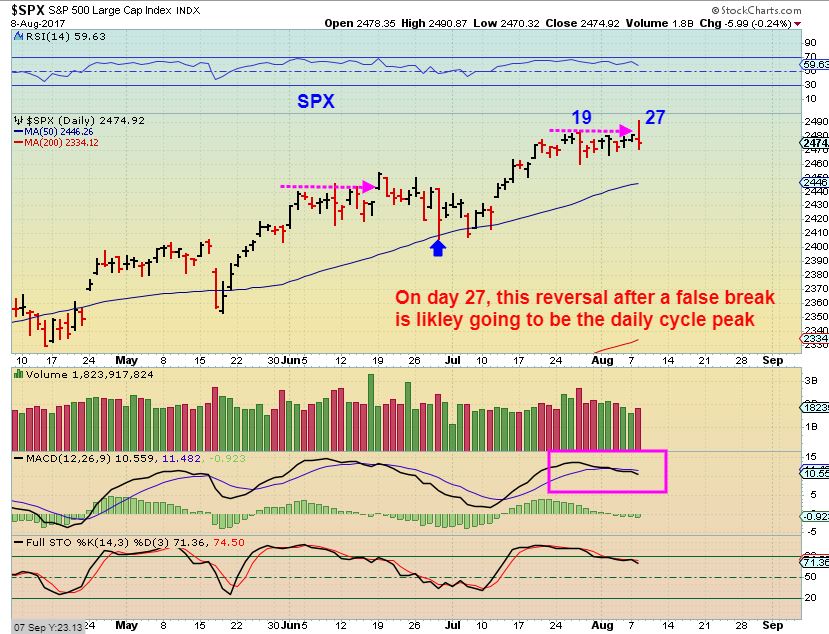
SPX– I pointed out this Bearish Rising Wedge a few times recently. We were overdue for a drop ‘timing’ wise ( DCL / ICL), but I mentioned that the markets could go a bit higher first. Be cautious.
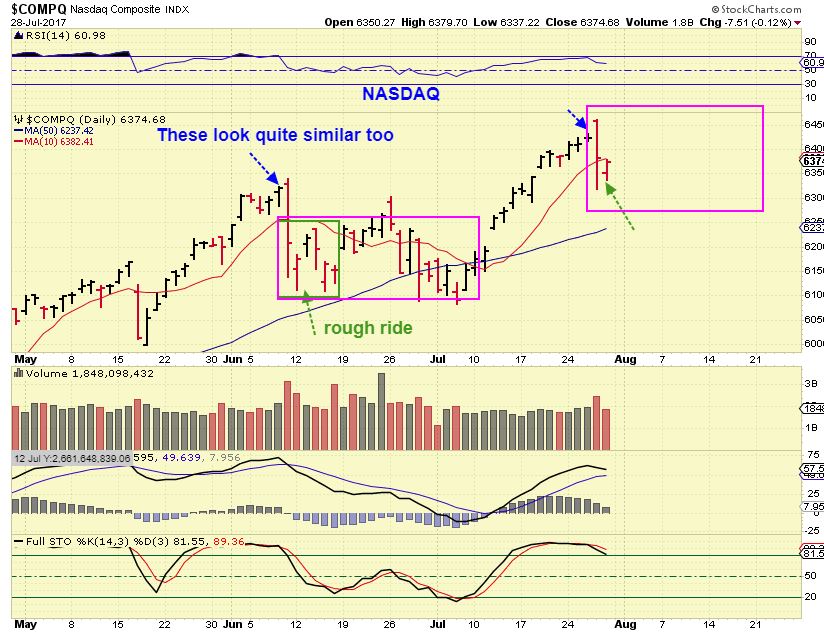
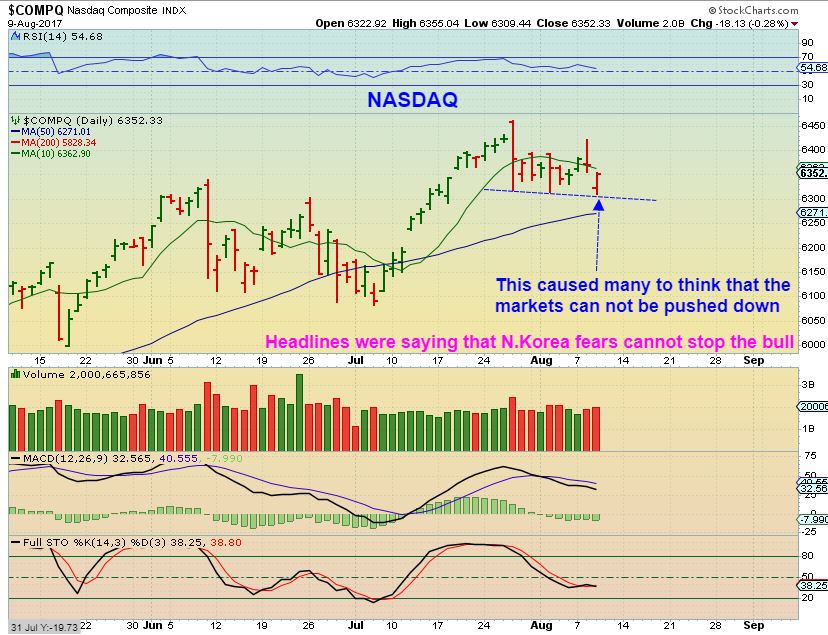
NASDAQ Weakness was evident on JULY 27th in that NASDAQ slam down.
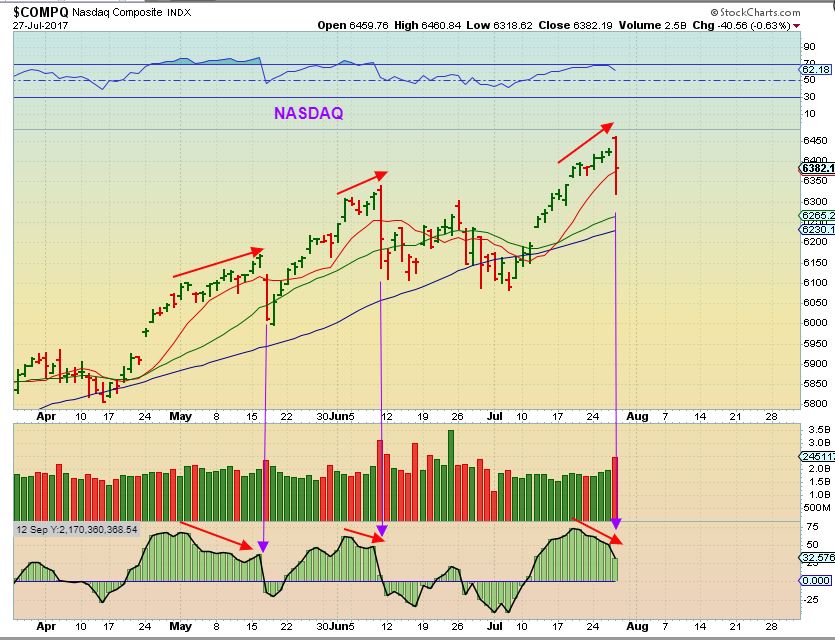
JULY 28 – I saw people BUYING THE DIP ( this reversal) in the comments section, so I pointed out that this reversal is possibly just like prior reversals after a slam down, due to the cycle ‘timing’. It could be a fake reversal.. See the Magenta box – I mentioned that the NASDAQ may just trade weakly in there, choppy and unprofitable.
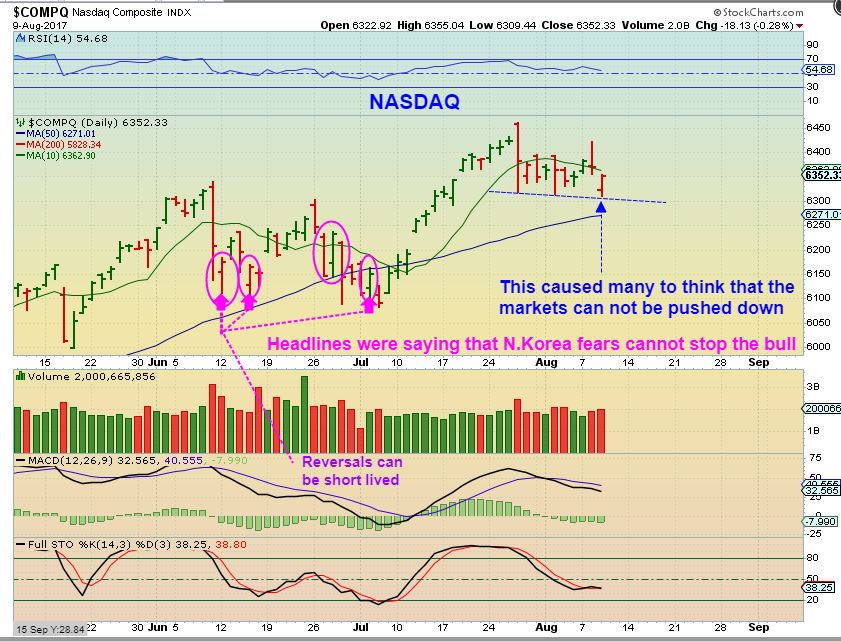
NASDAQ WEDNESDAY- We have gone sideways, yet some were buying this reversal too, so here I was trying to point out that prior sell offs and reversals constantly failed. The ‘Timing” was not right, and the timing for the NASDAQ & SPX was due to drop into a DCL.
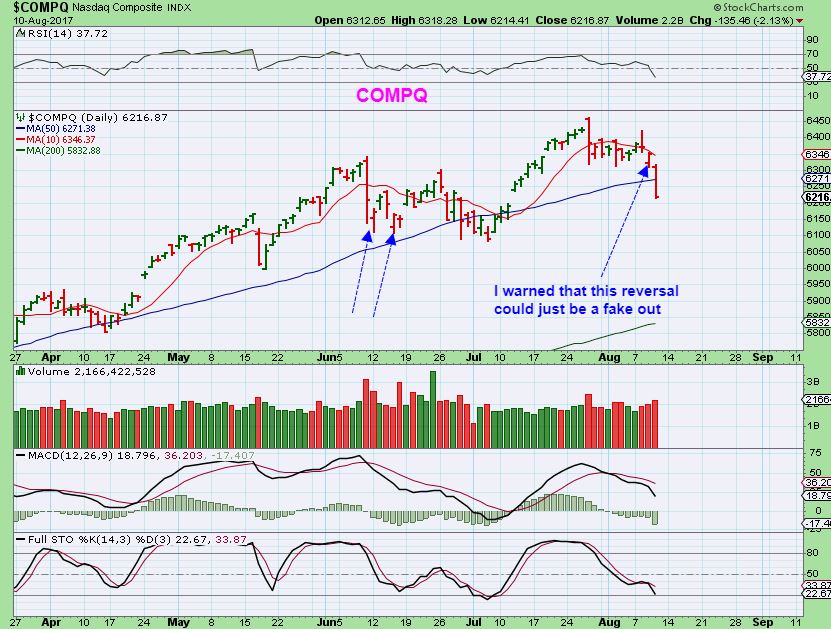
NASDAQ – And so we have our continuation drop, and we sliced through the 50sma. Searching for a dcl ( and possibly an ICL) , let this play out. Look at charts of GOOG, AMZN, NVDA. These were the leaders and they are breaking down too.
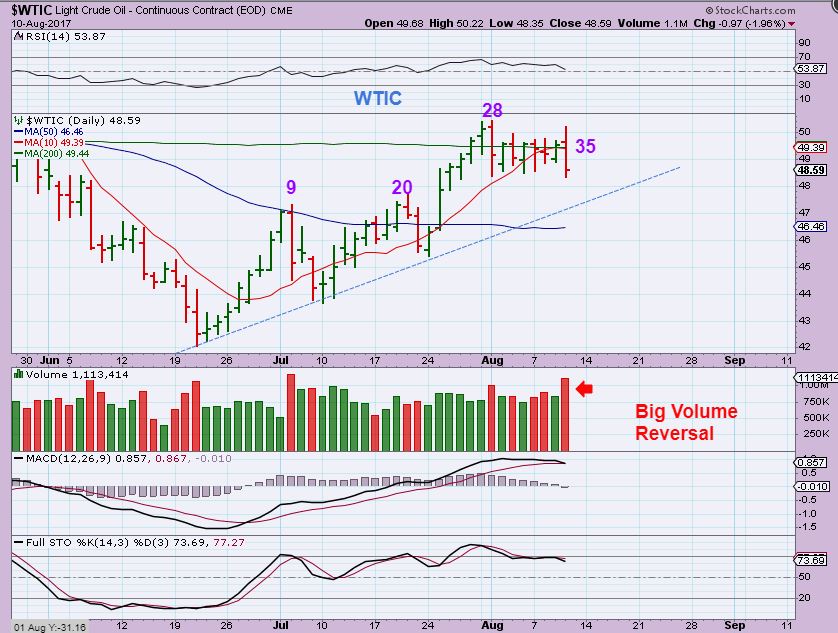
WTIC – DAY 35 , so Oil is within the timing for a dcl to be sought out. Thursdays reversal had some big volume too. We did see something similar on day 9 & day 28, but this time we are within the timing for a continuation drop into a dcl, so this may keep going. I’ll start by watching the 50sma and trend line area for support ( I am not short or long).
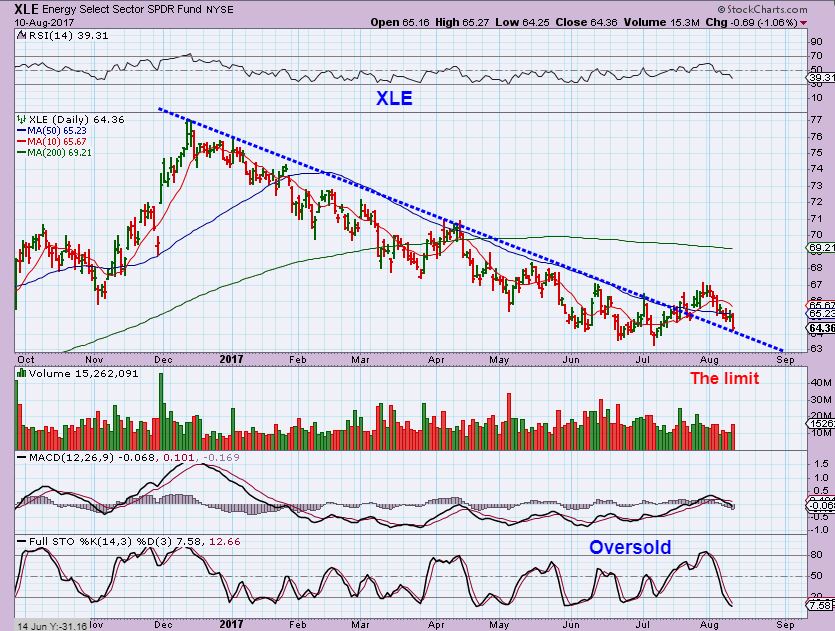
XLE – Well, The XLE finally broke out & now we have a back test, but many Energy stocks are still a mix of good and bad after earnings. The sector as a whole just does not look great yet, so I would be cautious since this might break down 🙁 IT also may just slowly climb down this trend line and form a ‘double bottom’.
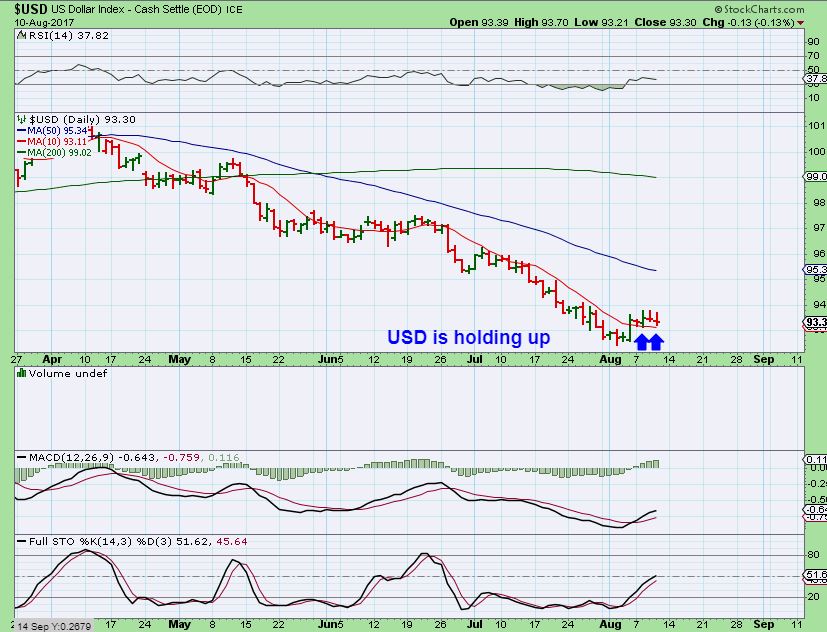
USD– As GOLD moves higher, the USD is holding up. I will discuss this more in the weekend report.
THE FOLLOWING 3 CHARTS AND COMMENTARY WERE IN YESTERDAYS REPORT. LET’S START THERE, THEY REMAIN VALID.
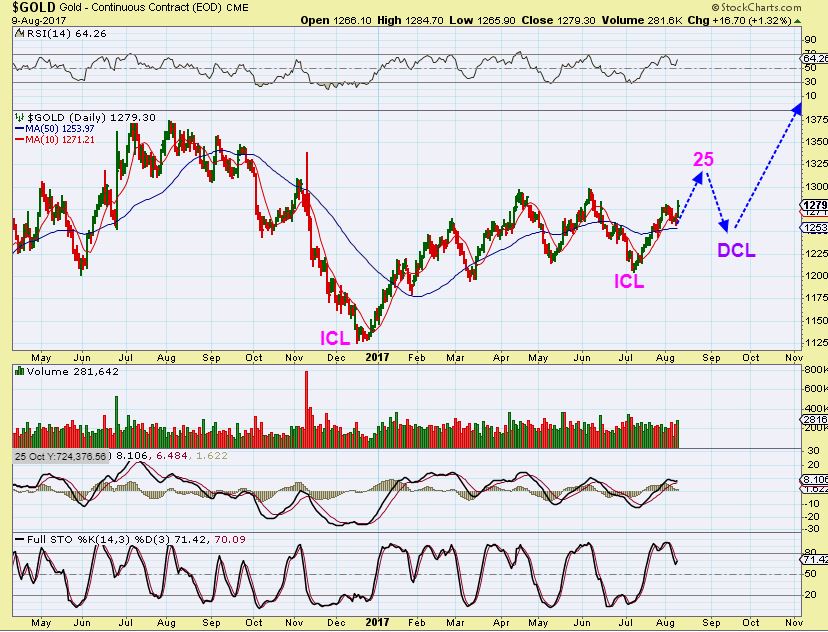
GOLD – This was my original thought. I did say that we could get a possible day 25 peak out of the ICL, then a drop to the dcl, back testing the 50sma. This still could be happening, and prior daily cycles have had 2 legs higher, but…
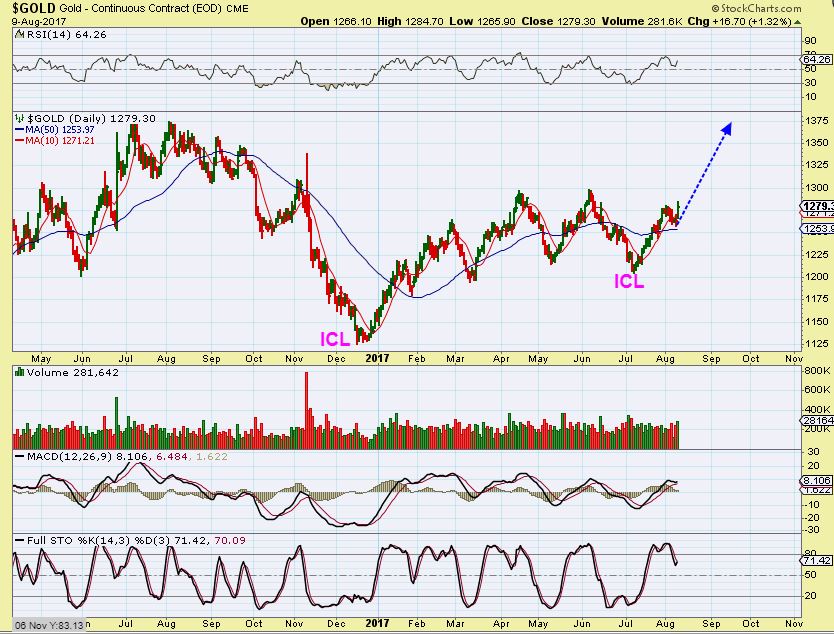
GOLD – If that was a mild day 21 dcl at the 50sma and Gold is moving strongly out of an ICL, it could just take off and pull miners out of that triangle into a Wave 3 move higher 🙂. Thursday would only be day 2, so it is hard to call it a dcl with conviction yet, we need further confirmation.
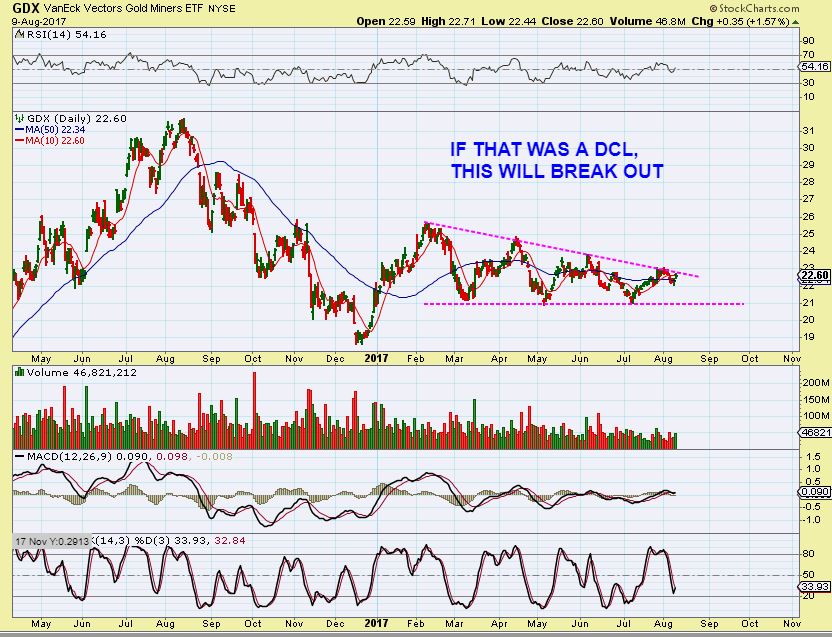
GDX – I wanted to point out that “IF THAT WAS A DCL, you have NOT missed the coming strong move, since this has not broken out yet, but it should sooner or later”.
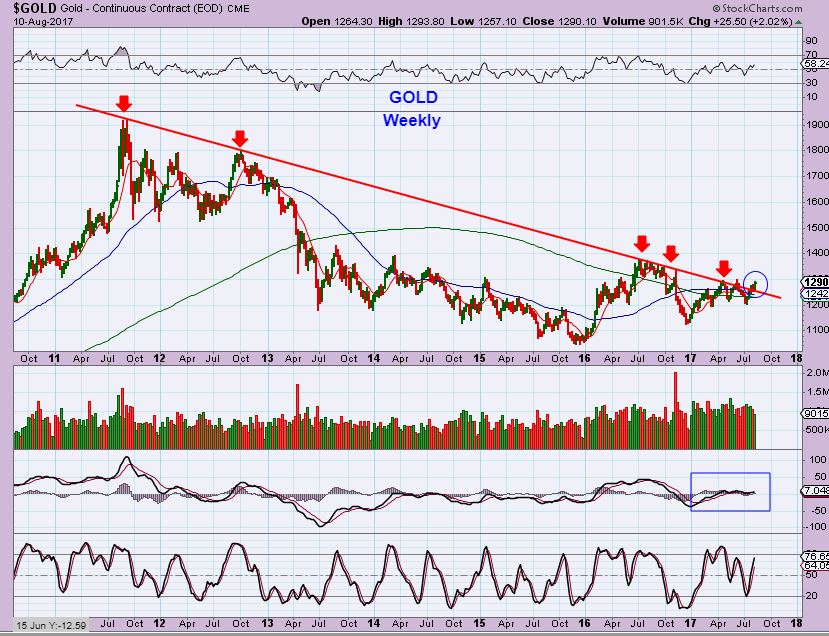
GOLD WEEKLY AUGUST 10th – Gold continued higher yesterday, and this is the weekly view. It looks like a very bullish chart, 4 of 5 weeks higher out of the ICL.
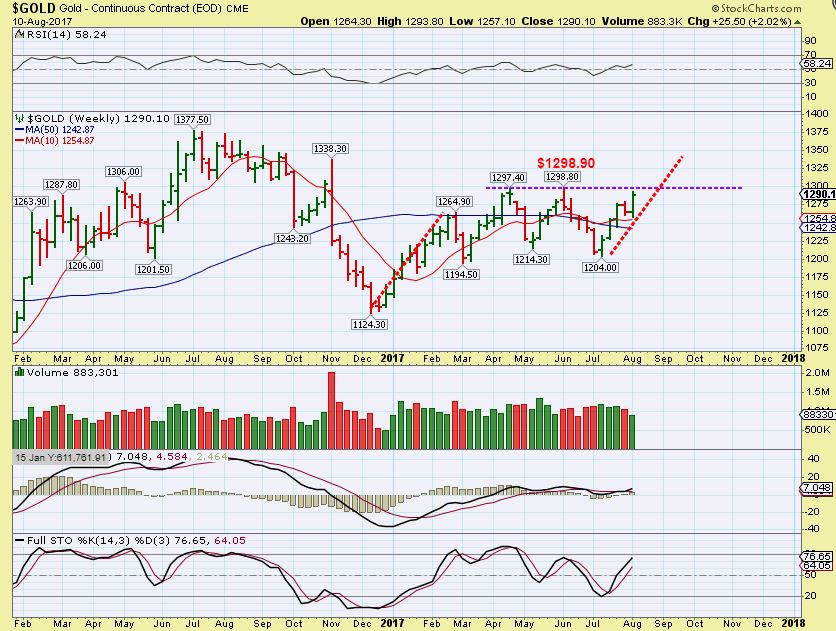
GOLD WEEKLY AUG 10 – We have 1 more trading day to the week and Gold has started to peak out from this downtrend. If Gold Moves higher or is green at the end of the day Friday, this weekly chart becomes more encouraging. IF Gold drops today and closes lower? This break out could be invalidated or weak and next week will reveal a lot. Step – by – Step.
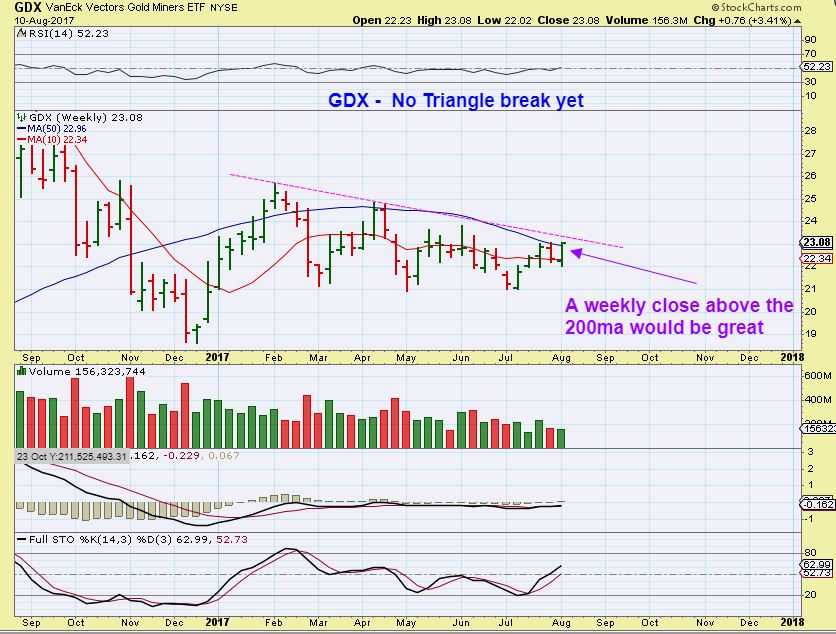
GDX broke above the 200 MA on a weekly basis Thursday. If GDX closes green on Friday, this looks to be breaking out ( The trend line should be next). If GDX drops on Friday, we could have what we had on the first week of April.
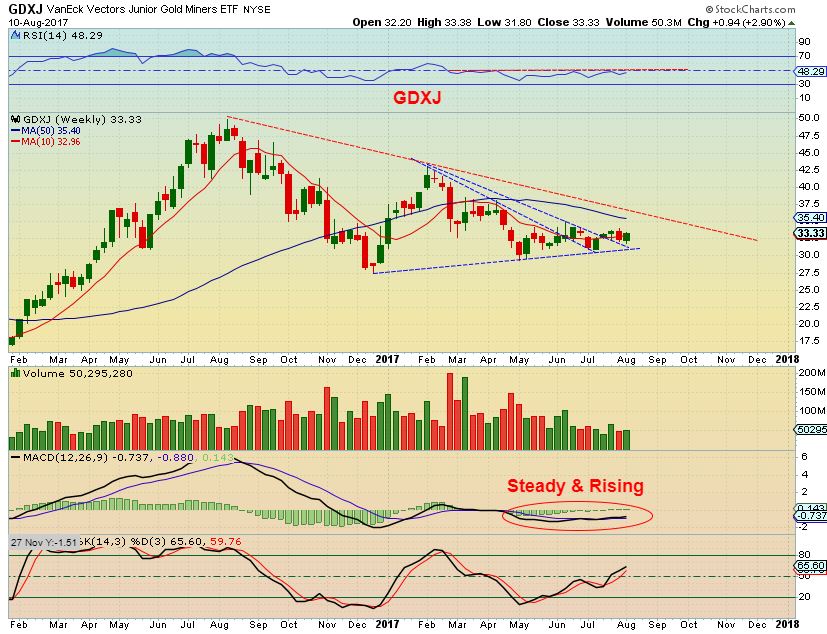
GDXJ WEEKLY – GDXJ has actually broken through a few downtrend lines, but it was not ‘time’ for it to run higher yet. Sideways consolidations can build up a lot of energy.
So some Miners during this earning season are looking very bullish ( see NEM, PAAS and SSRM) , but take a look at others and they are looking horrible ( see PPP & NSU yesterday). I have seen this in the past, and they may be capitulating into final lows, similar to the lows in 2016 when almost everyone gave up on Miners and said that they could NOT be profitable with high Oil prices, low Gold prices, etc etc . They then ran up 100s of %. I love the way things are shaping up, and in future reports, I am going to discuss the set ups further and give my expectations. For now, it is Friday and today will tell us quite a bit too. Enjoy your last day of trading and your weekend! Thanks for being here at Chartfreak, I believe that we are going to make some exceptional money in the 2nd half of 2017 🙂
~ALEX
EXAMPLES:
I want readers here to see what we have in front of us in the bigger picture. I have some readers that just cannot pull the trigger on a trade unless they are absolutely convinced that things are lining up bullishly. THAT IS NOT A BAD THING, PATIENCE IS REWARDING IN THE LONG RUN. When the precious metals sector begins moving upward with conviction, I will be convincing everybody here that they need to be in, and I will be pointing out set up after set up with lower risk entries. Right now it is bottoming and we are inside of a choppy triangle, so some Miners are good , some are bad, and we have a mixed signal. Let me quickly show you something encouraging here…
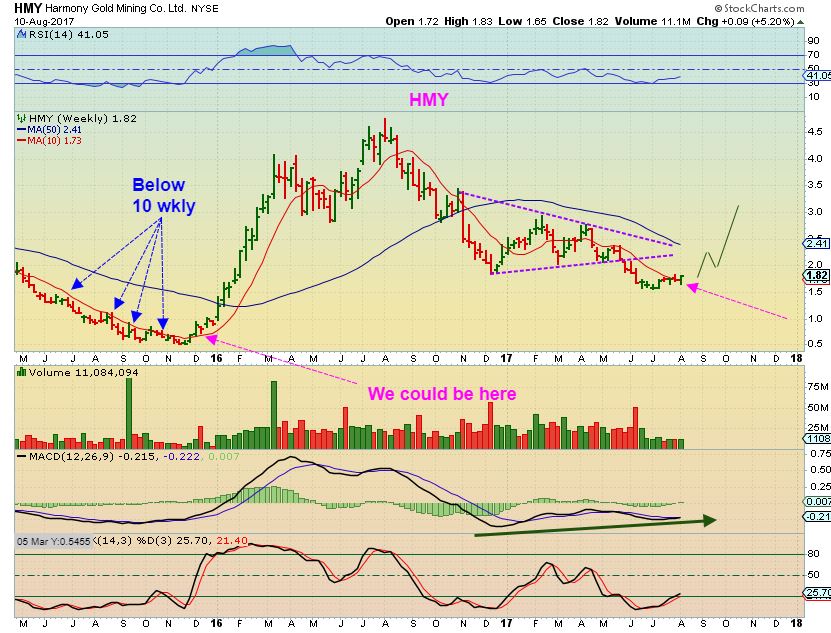
HMY – HMY sold off relentlessly in 2015, but once it broke above the 10 weekly MA, look at what it was able to do. That is 800% gains in 6 months. By the way, DRD is trying to break above the 10ma. My point is to the ones patiently waiting to pull the trigger. HMY Bottomed in November 2015, but even if you waited for a month or 2 before buying, you doubled and tripled your money.
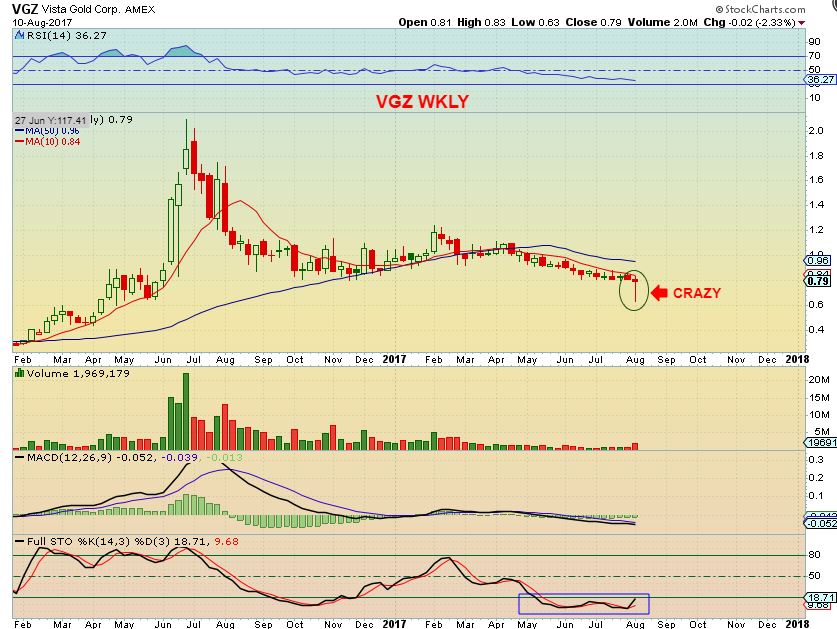
VGZ – VGZ sold off Sharply this week, from 83 cents to 63 cents! Did you notice what it did on Tuesday, Wednesday, and Thursday? If this runs to former highs and forms a cup, the gains are going to be excellent. My Point? Even ugly crashing Miners can recovery rapidly when the time is right .
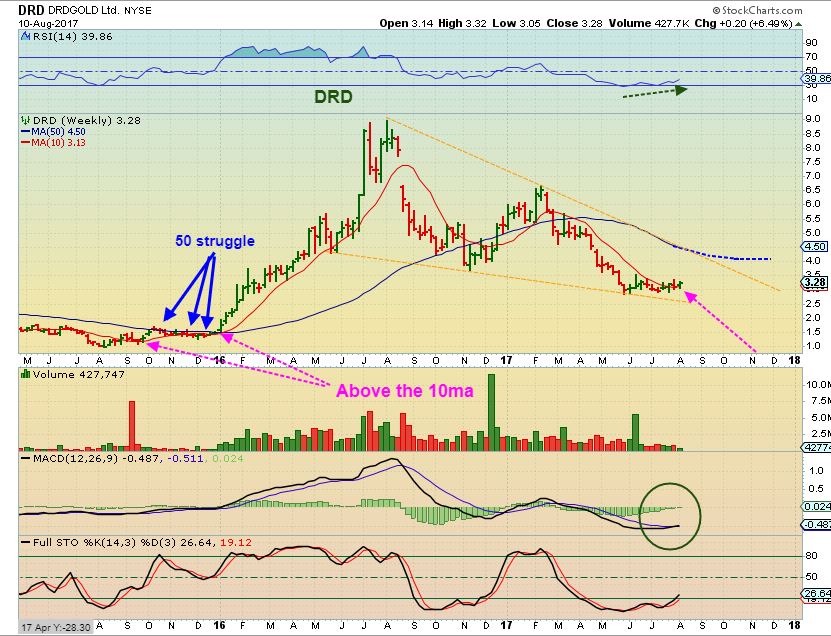
DRD- I have been pointing out this pattern for a while. This time I want to focus on 2015 too. It bottomed and went sideways in a frustrating manner for 6 months! Once it broke key resistance, it also ran up 800% from the lows. You are not missing all of the action if you are not buying right at the lows. True, 800% was from buying at THE LOWS, and buying after it broke the 50ma comfortably ( let’s say $1.50 – $2.00) only gave you 400+% – but I would gladly take 400% in a strong bull move higher right now.
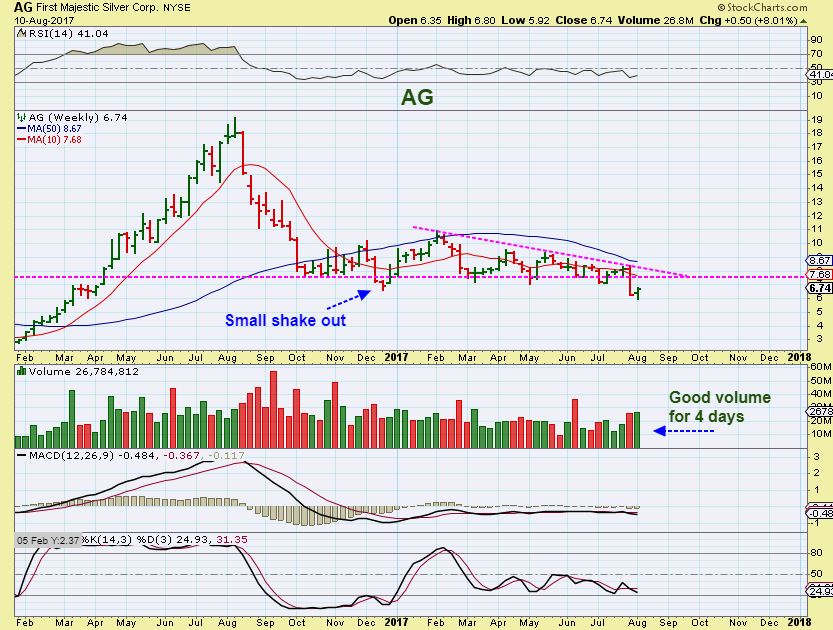
AG – Ag looks like it may be trying to recover now too. AG was a fan favorite in 2016. Many loved this Silver Miner, but with that sharp drop from the top, and then a recent break, people are saying, “Miners are too risky and even some of the good ones are being thrown out.” Well for the patient ones, a recovery of this break down would be a possible ‘shake out’. IF you wait and buy this at $8, will you be sad when it trades at $24? Sure, $6 to $24 is over 300%, but $8 – $24 and 200% plus in your account is a great feeling too, right?
Bottoming processes are frustrating , tricky, yet they can be rewarding if they lead you into a bull market. Not all Miners run at the same time, and we are seeing NEM, RGLD, and a few others leading, SSRM and PAAS broke out sharply yesterday, and going forward I will be pointing out trade after trade that can lead to great profits.
SSRM broke out with earnings Thursday, and this is now a safer Miner in my opinion.
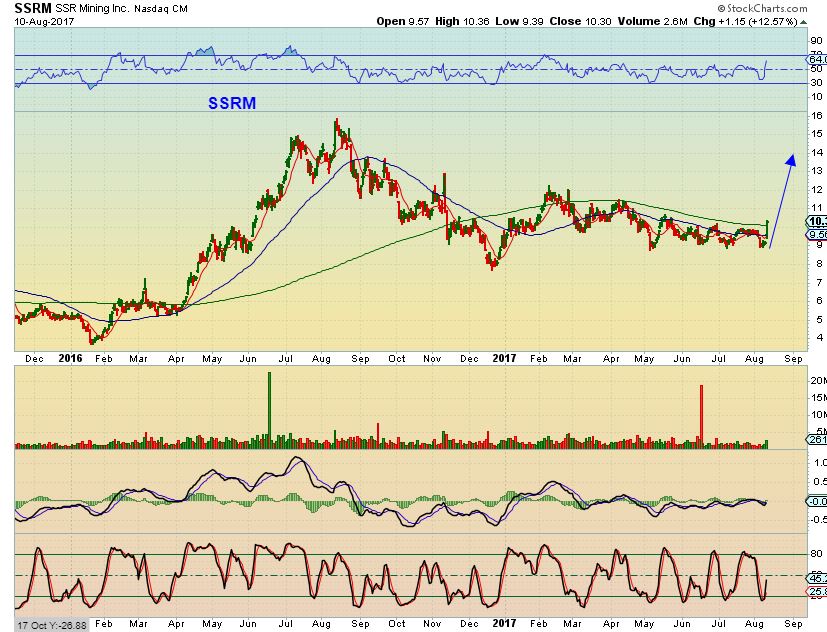
For now, I have been trying to avoid entering during the earnings season, so I have not been showing a whole host of ‘set ups’, but if things continue the way that I am seeing things line up in this sector, the 2nd half of 2017 will be excellent for our accounts.
We saw some interesting moves in the markets on Wednesday, so let’s take a look…
SPX – We see a reversal, but I do not expect a major run higher.

NASDAQ #1– I read head;lines saying ” Even the threats of North Korea cannot hold down this bull market”.
However…
Read more
There was not a lot of change to report today, but there were some ‘significant’ changes that took place, so let’s take a look at what has changed…
SPX – This weekend I mentioned that the SPX could go a little higher, but unless it breaks out strongly and runs, it looks to be at the top of a rising wedge.
SPX – Timing wise we are near the timing that we can expect a drop into a dcl, and Tuesday we saw a false or weak break out that turned into a reversal. In June, this happened and we slowly rolled over and dropped to the 50sma area.
What about the NASDAQ? …
Read more
Scroll to top