I would say that we were seeing a normal correction in Oil on Tuesday, and we are heading into the Oil Inventory reports Wednesday, so nothing really changed there. So why did the Theme become “Winds Of Change?” It is because OIL stocks started to pick up in their selling, The Euro situation changed, Biotech broke down further, and a couple of other minor changes also became evident. I wanted to discuss these areas a bit more and the changes that I noticed…
SPX – Each sell off lately is still being scooped back up, but I’m still seeing the divergence that I pointed out a week or so ago as Price went higher. The RSI & MACD are still drifting lower. There is still room to drop on the stochastics, so this time price may want to also drop to the 50sma, or even continue sideways to that 50sma. Why? …
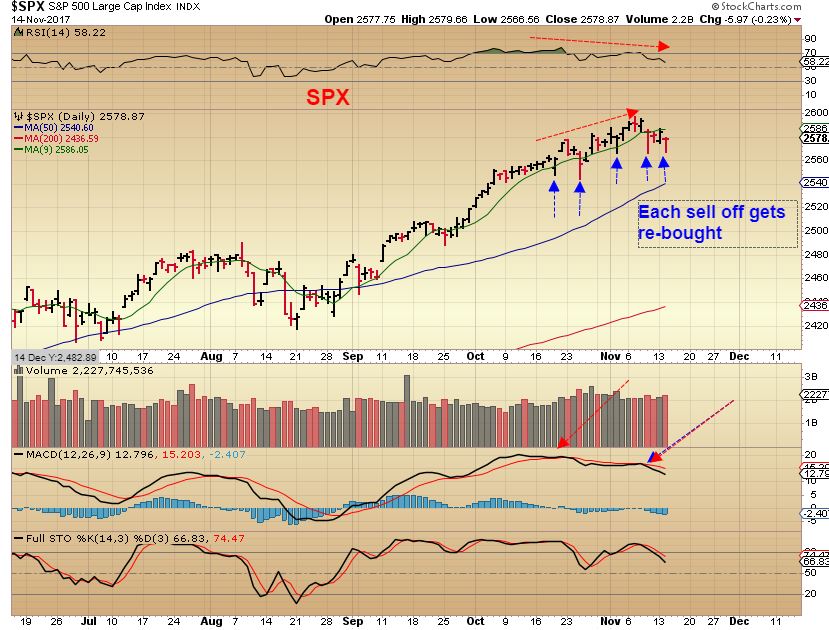
The TRAN, RUT, BKX, etc., broke below their 50sma. Let’s take a look.
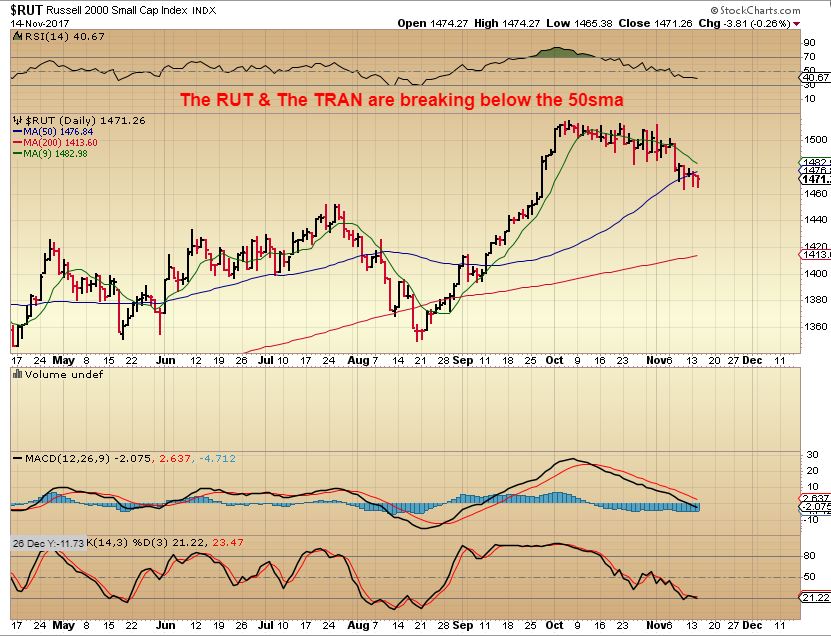
RUT – The RUT, TRANSPORTS, and Bank stocks are struggling a bit more. These have even dropped below the 50sma. BKX dropped below the 50sma and recovered Tuesday, so far.
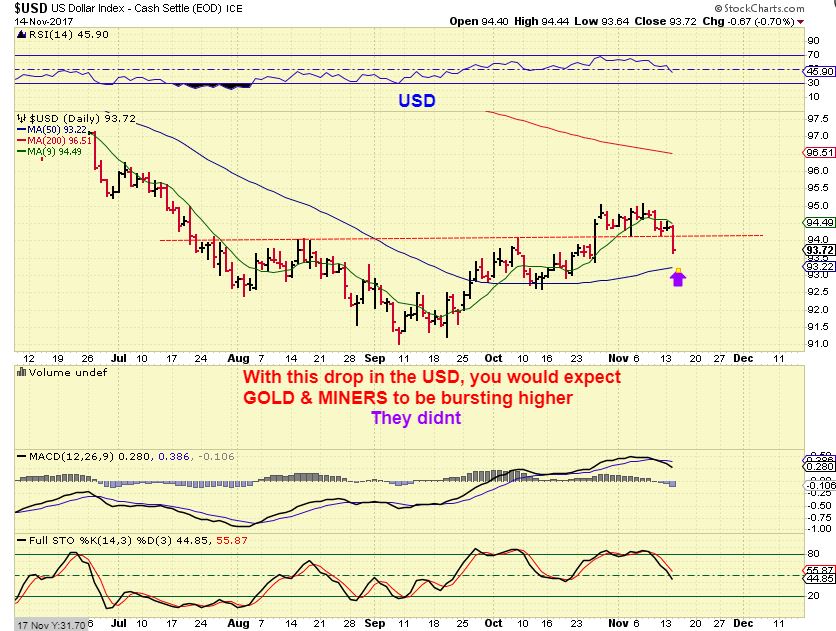
USD – This is a trend line break and the 10sma is following price, this is a decline into a DCL. Normally a drop like that would Push Gold & Miners higher, it didn’t. Remember this drop as we discuss Miners later. This move actually negates the inverse H&S break out for now. That is a change too.
There was a change in Biotech
XBI Nov 7 – Here I was pointing out that the XBI in this bull run would dance around the 50sma and then it recovered. It started to recover, so that looked bullish.
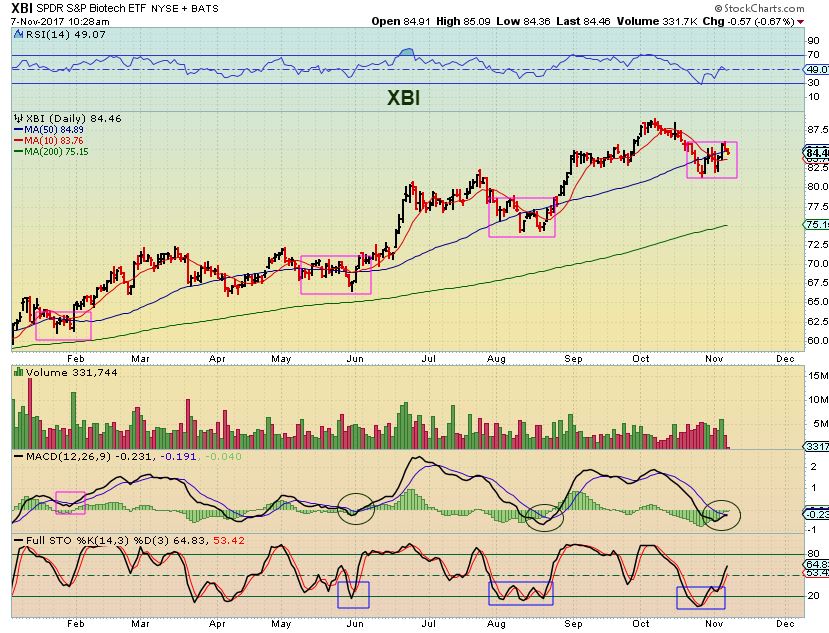
XBI NOV 8 – It then dropped back below that 50sma. I had warned that if this breaks down below the blue line, it did not look healthy to me, since the MACD was curling down. So if it didn’t recover, that would become a break down with follow through.
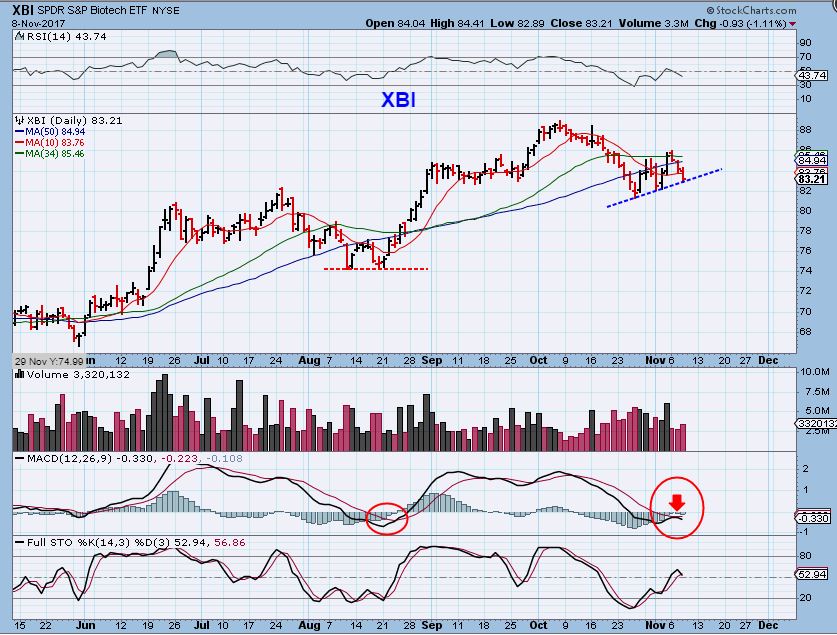
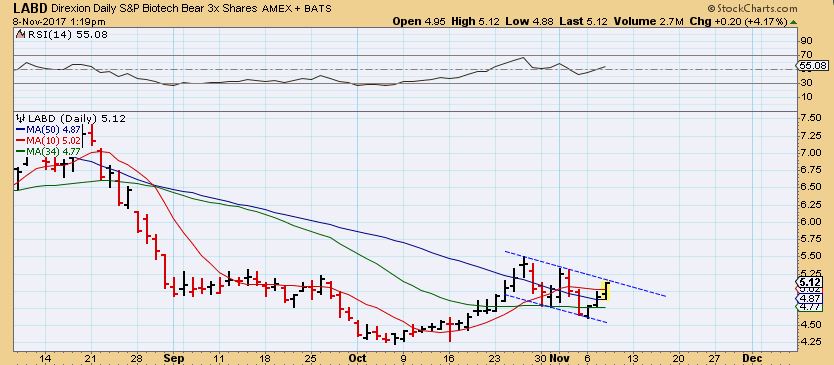
I also discussed buying LABD if this breaks higher, when I was asked if someone should buy LABU.
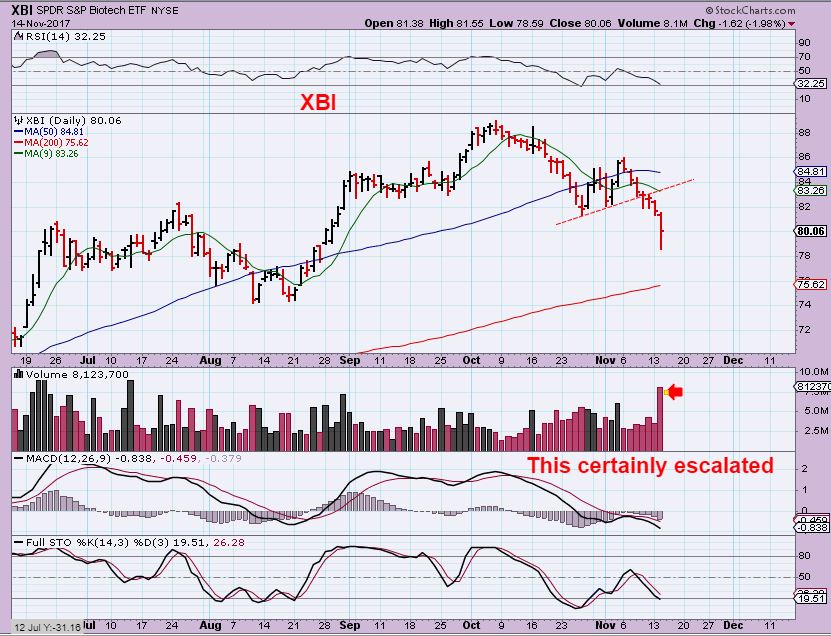
XBI – Continued to break down 3 days ago and Tuesday pushed strongly lower. Again, we see the winds of change. It no longer resembles the prior sell offs that ‘danced around the 50sma’. I would avoid this until it recovers. That was a reversal candle yesterday, but it may mean nothing. This could dip to the 200sma if it seeks out an ICL.
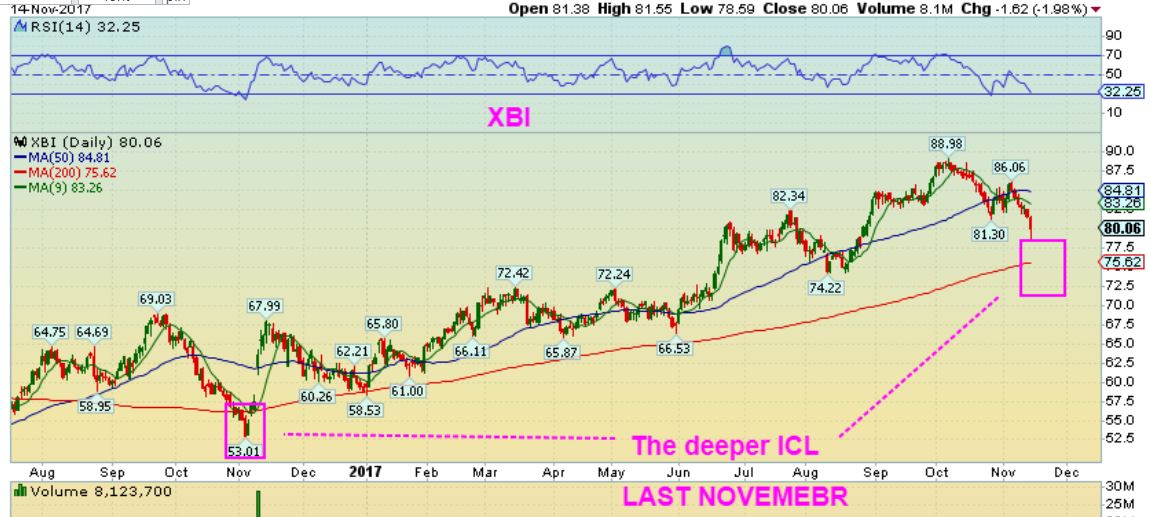
XBI – Notice the deeper sell off into an ICL Last November
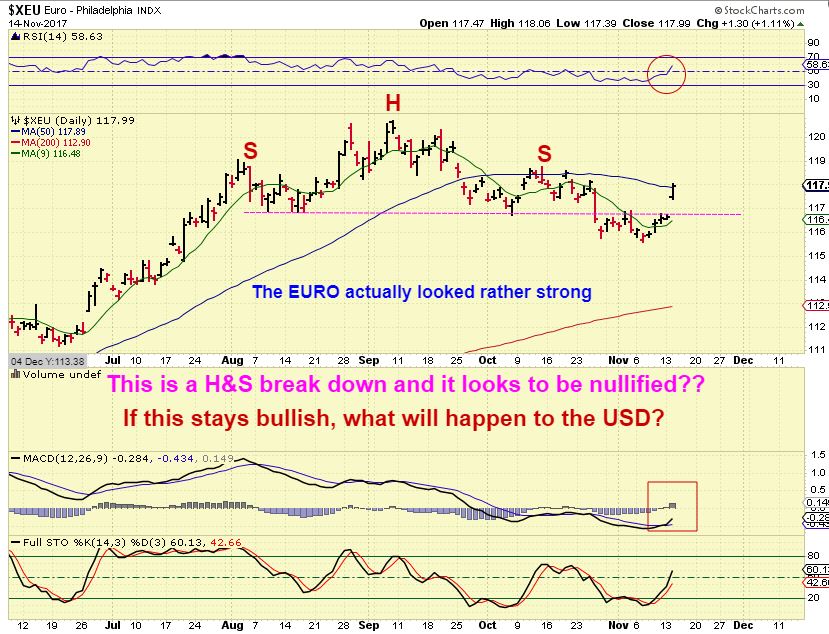
XEU or EURO – This change surprised me. The EURO Popped higher and actually started to close above the 50sma. It negated the H&S break down. The RSI broke above the 50% line. This actually looks bullish and I’m not sure how this fits into the big picture, because this would usually sink the USD even further. Winds of change here, and I’ll be watching as this plays out. I thought that this could drop the USD and raise Gold, but that doesn’t fit Golds expectations – so I am watching all of this closely.
Let’s discuss the possible winds of change in this sector
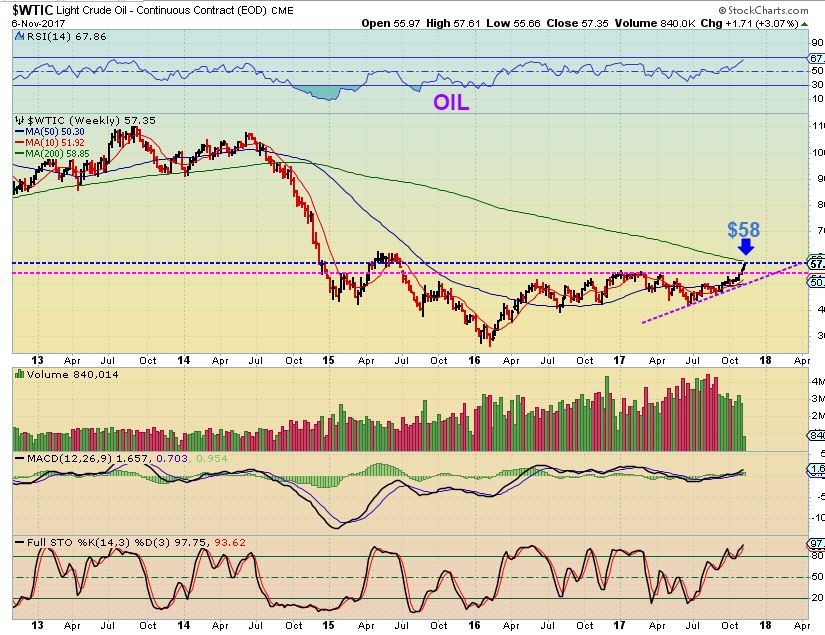
WTIC NOV 6 – This was OIL, breaking out and it could do a normal back test to the Magenta line. I would expect that would be the $54 area. Even a drop to the Purple line was possible, but as this happened, I would have imagined that Oil stocks would hold up a bit , or just continue to go sideways, etc.
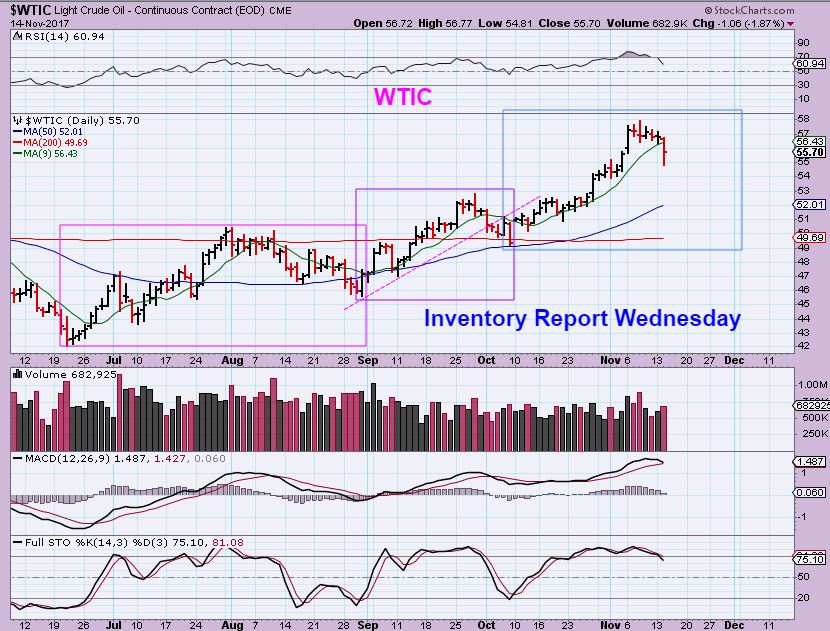
WTIC – Oil did hit $54.81 & reversed into the close. Take a look at the Dip into July 10 and July 24 and you’ll see that dips are common on the way higher. So this shows that Oil can sell off and recover, but with this selling on Tuesday, Oil stocks did join in a bit more than expected. That needs to be looked at…
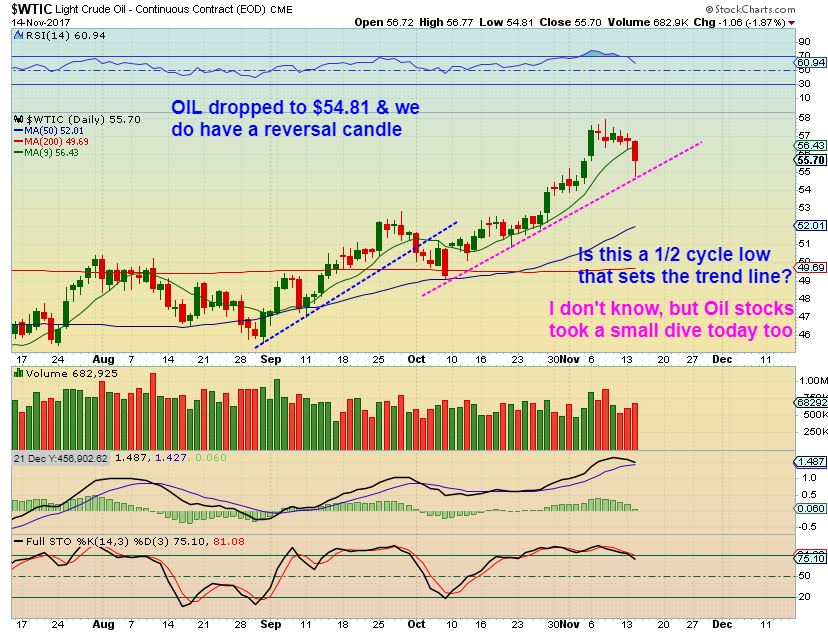
WTIC – Is this setting up a 1/2 cycle low or is this dipping down? Watch this Magenta line or yesterdays lows. The reversal is promising, and we’ll see what the Wed inventory report does to Oil, but let’s also look at Oil stocks.
REVIEW XLE
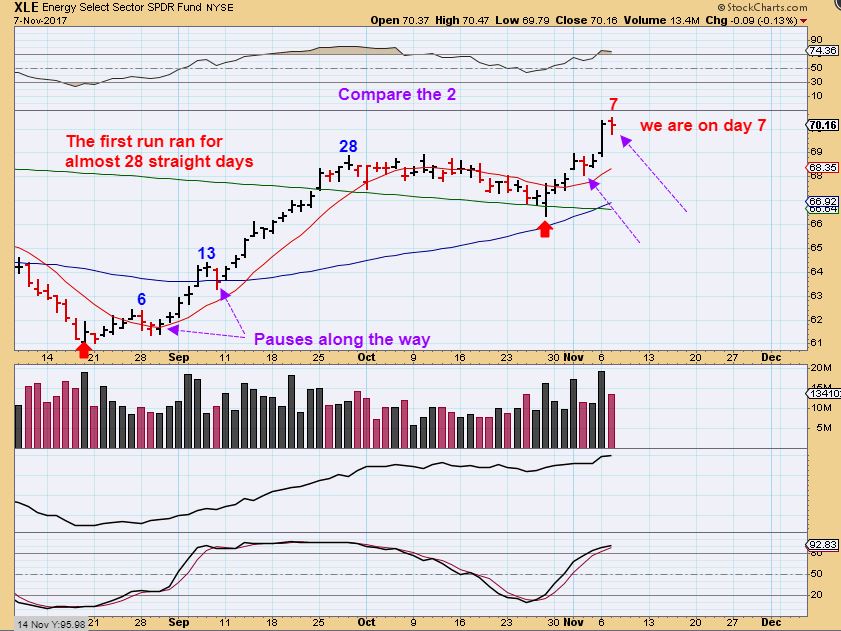
XLE NOV 7 – This looked very good coming out of the recent consolidation.
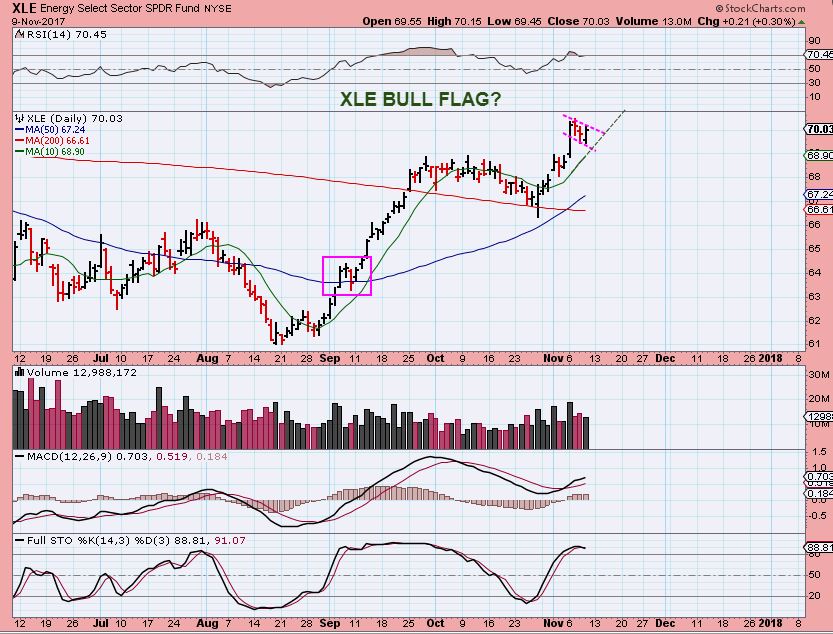
XLE NOV 9 – It went sideways for a couple of days, and that is also normal – it looked to be forming a Bull Flag to the 10sma.
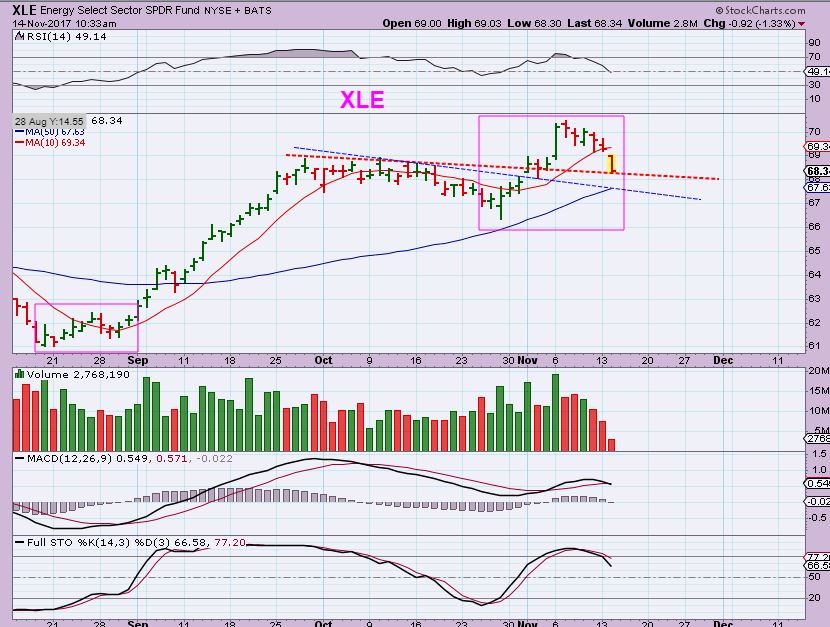
XLE – Suddenly after reaching the 10sma, XLE just dropped quickly yesterday. At 10:30 a.m. I posted this in the comments as a possible back test of the recent break out or even a tag of the 50sma? Is that all it is? …
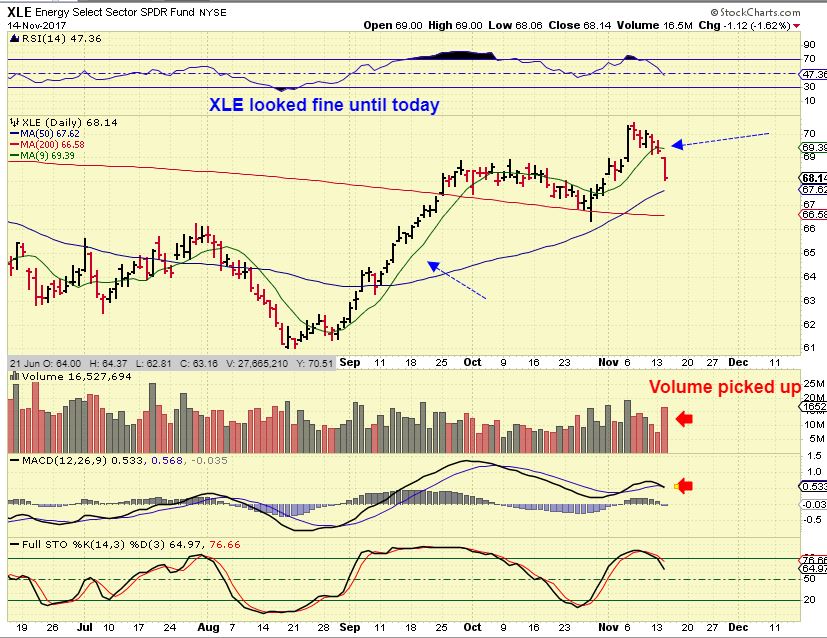
XLE– BY the end of the day the Volume really picked up and selling looked to be increasing, closing near the lows. Now we have the oil Inventory report to contend with Wednesday and some Oil stocks changed from bullish looking to ugly. I will continue this discussion of possible winds of change in Oil stocks by discussing some Oil stocks at the end of this report. We need to see the 50 & 200 hold as support.
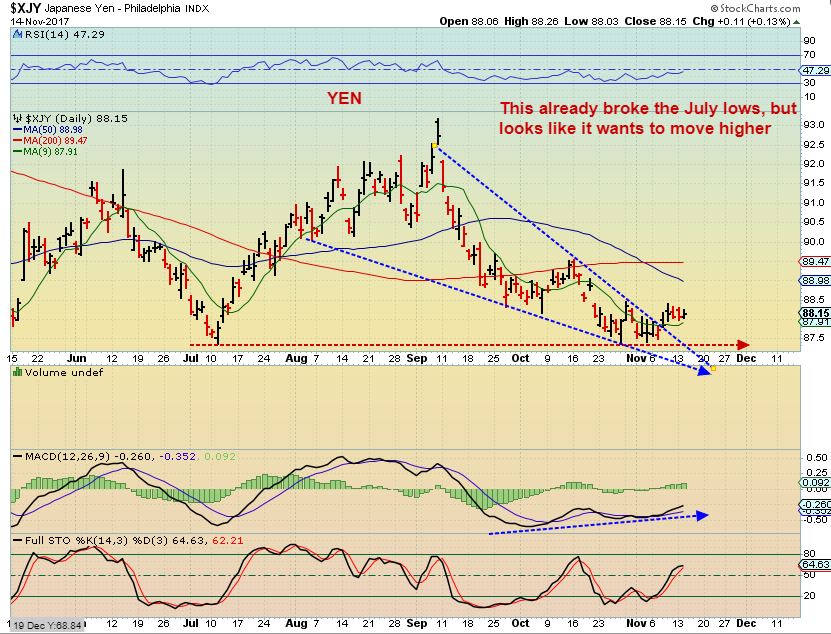
YEN – I just wanted to point out that the YEN seems to be a bit ahead of Gold. It broke the July lows already. Interestingly, this looks like a bullish set up. THAT is an interesting change. Let’s look at Gold.
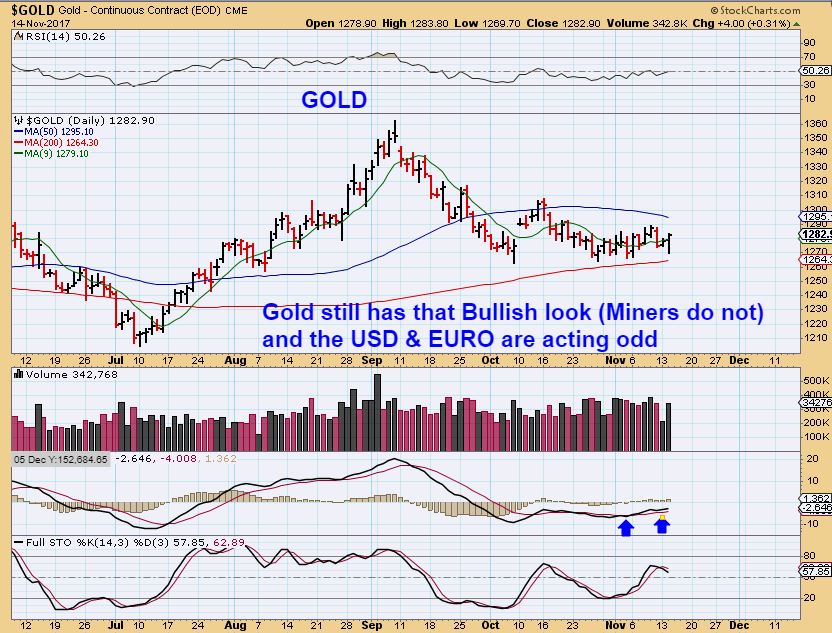
GOLD #1 – Interestingly, Gold looks a bit bullish too, but Miners do not , as you will see. Gold is not breaking recent lows and it’s indicators are rising.
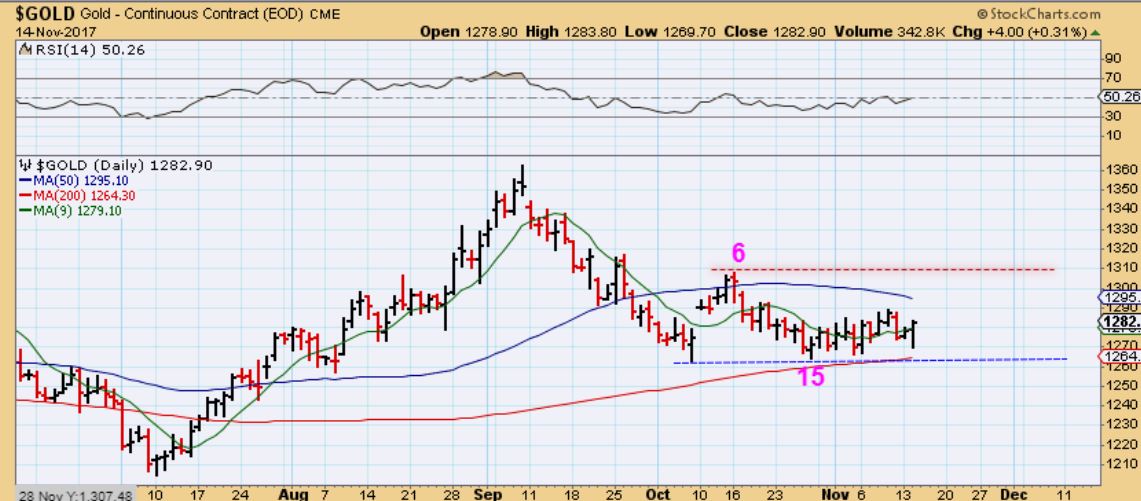
GOLD #2 – The parameters to watch if gold moves higher. A break above day 6 1308.40 is NOT expected and if we see that- we will have to accept a more bullish idea, but I do NOT expect that. Miners are still weak.
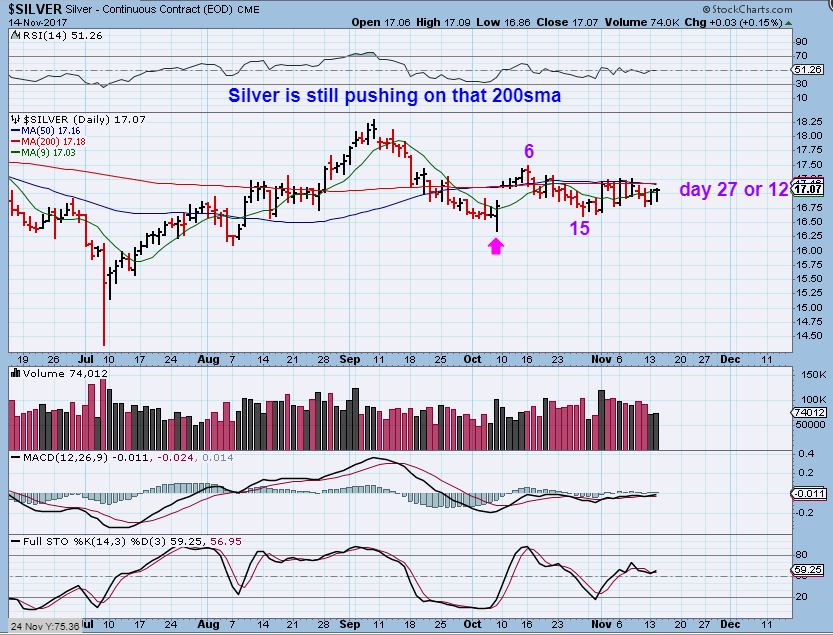
SILVER – Silver also will not give up the Bullish appearance, but if & when Silver drops, it drops FAST.
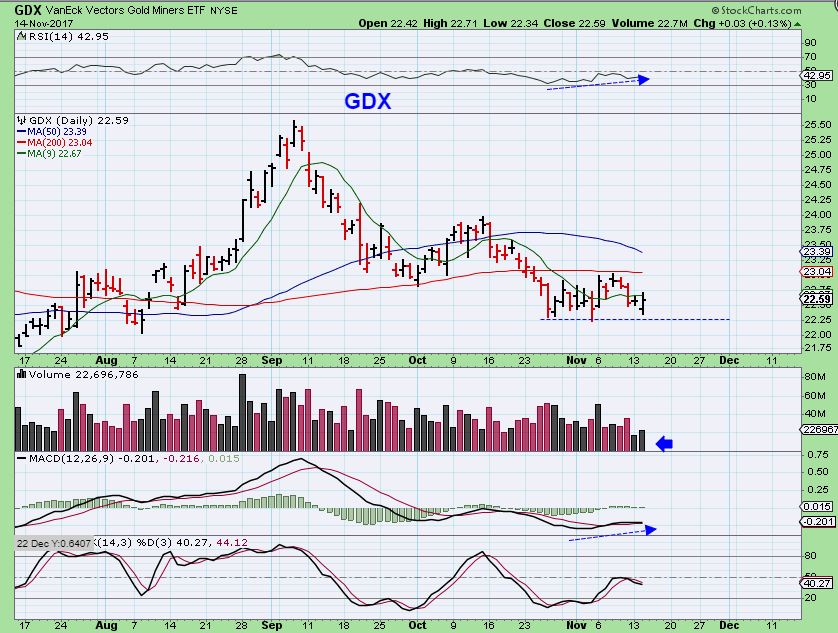
GDX – GDX broke the late Oct lows 8 days ago and recovered. It was only up 3 cents Tuesday, with the USD dropping dramatically & Gold higher. It means that miners are weak at this point.
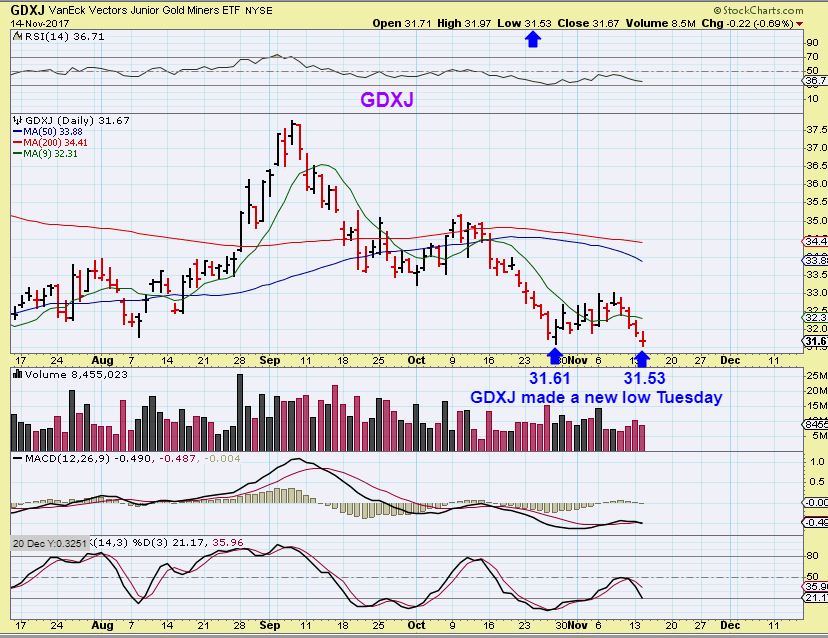
GDXJ – GDXJ actually broke to new lows on Tuesday and closed red, and that was with the USD dropping quickly. This usually indicates that when the USD puts in a dcl and moves higher, this sector will drop quickly. So that is New Lows for GDXJ.
SO we definitely have seen some rapid change, pretty much just since Yesterday. Today will be a day to see whether or not any of this has lasting affects, will it have follow through? I don’t want to ‘panic out of my positions’ early and just sell Oil stocks before the Oil inventory, but that selling did pick up in many Oils stocks ( I’ll point that out below). I may just sell to lighten up. WTI still acts correctly, so a stop under recent lows may be fine. LGCY above the 50sma seems ok, etc. Others may not look good and you may want to lighten up too? I have mentioned in past reports that I DO NOT like to hold more than 8-10 stocks at one time, it is like trying to babysit 10 kittens. They go in all different directions and becomes hard to manage properly. Also, I am an active trader for a living, so this is what I often do. I sold off a couple of my Oil stocks ( I got in early and simply took profit) to buy OGRMF, APHQF, SPRWF, and MYMMF- and I thought that after those FAST TRADES played out in Medical Marijuana, I could just re-enter Oil stocks again or be ready to enter Miners. At this point, Oil stocks have changed a bit and I need to watch how that plays out. I did sell all of my MYMMF near $2 yesterday and still own the others.
Today is a day to watch how things are playing out, I am especially interested in watching the Oil inventory report and Gold vs Miners / Euro vs $USD. Let’s discuss Oil stocks a bit more below.
~ALEX
So some things seemed to have suddenly changed, Let’s take a closer look.
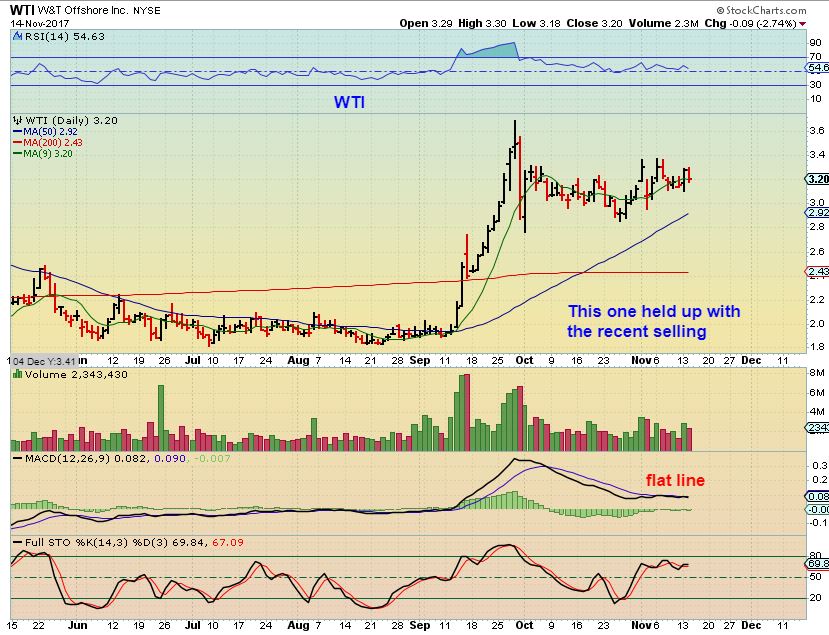
WTI – W&T Offshore was not really affected by the recent selling in Oil or the XLE, but as you will see, others were. I would expect that this will get pulled down too, if the selling continues.
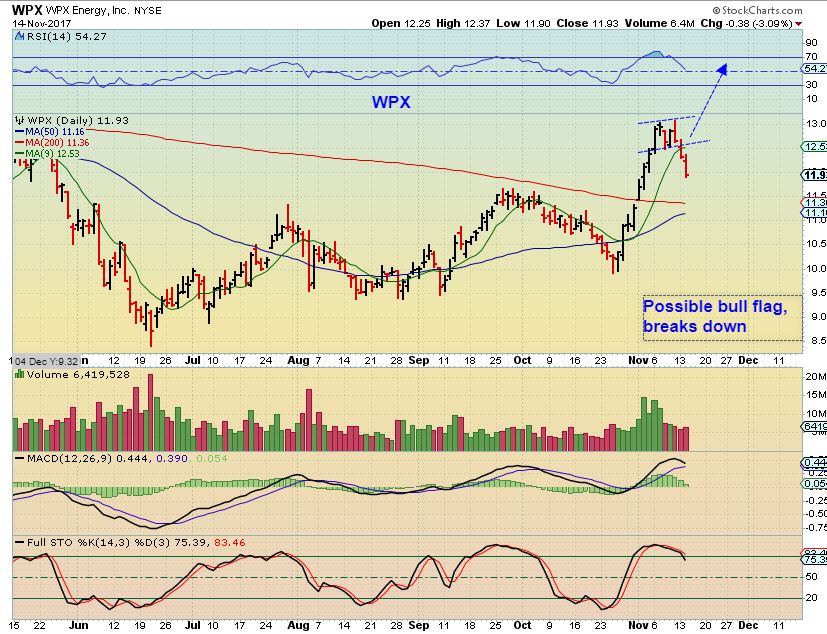
WPX – WPX was fine right up until Monday when it broke the 10sma. This was a bull flag to the 10sma after a nice strong run higher. You can see that the winds of change are here. It should find support at the 50 & 200 area, but if the selling in Oil continued, it could get caught up in that sell off. Just so you know – If I owned this, and saw this along with the XLE & OIL, it would have made me think of selling the break below the 10sma & re-entering when support proves itself. It would depend on where I entered the trade.
LGCY -LGCY put in a strong reversal after earnings, so I bought it and added again. This looked ready to break out above the 200sma.
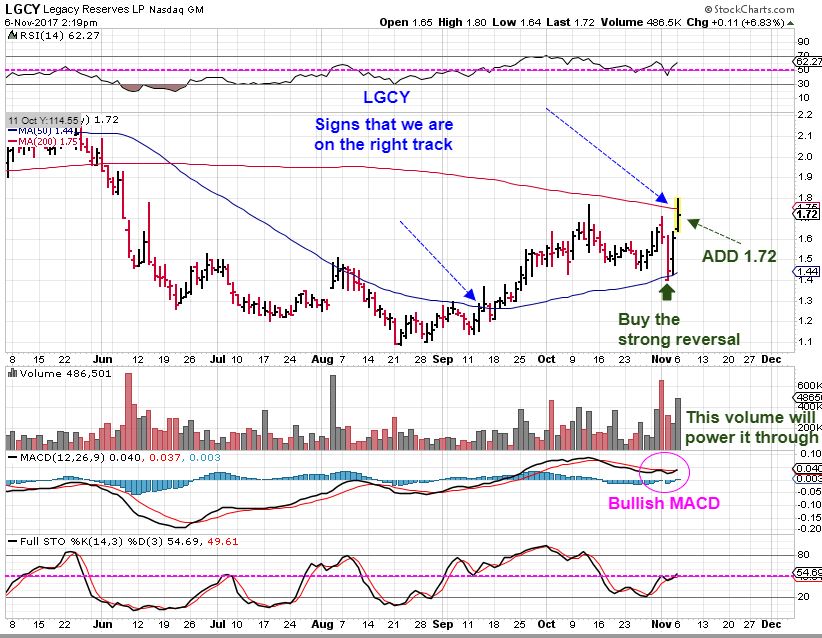
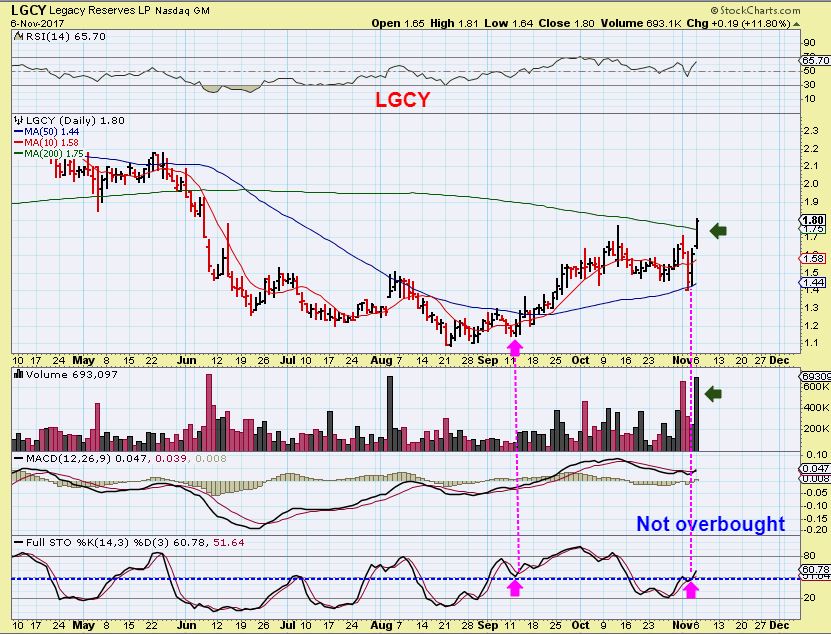
LGCY – And it closed above the 200sma and looked ready to go for sure. This is a bullish set up, this is why I bought & added.
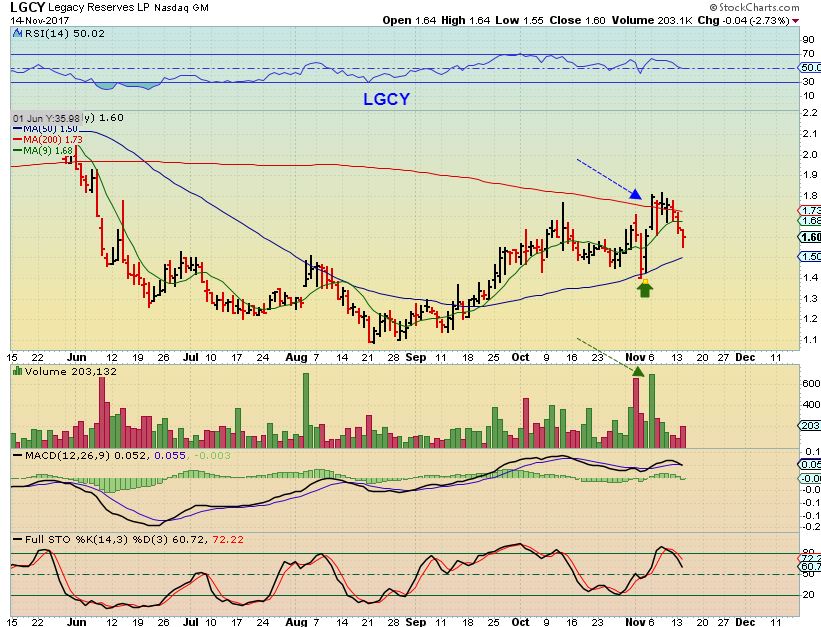
LGCY – For the next week, it too went sideways and stalled here as what looked like a flag consolidation. Now it also dropped Tuesday toward the 50sma. I still own it near break even, and will have to see how it acts after the oil inventory. I will NOT ride this below that double candle reversal under the 50sma. You may want to sell it even before that. It is not bearish, but it has ‘changed’.
PDS OCT 27 – This was a BUY on the weekly reversal candle as earnings were released.

PDS OCT 27 – A strong reversal buy when earnings were released.

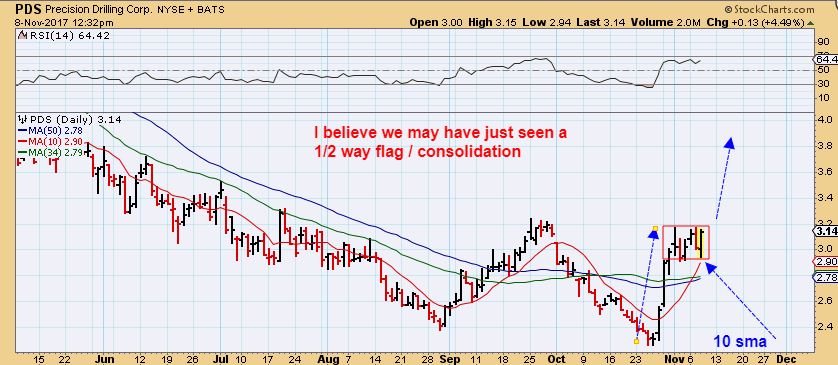
PDS – I posted this chart as we got follow through above the 50sma.
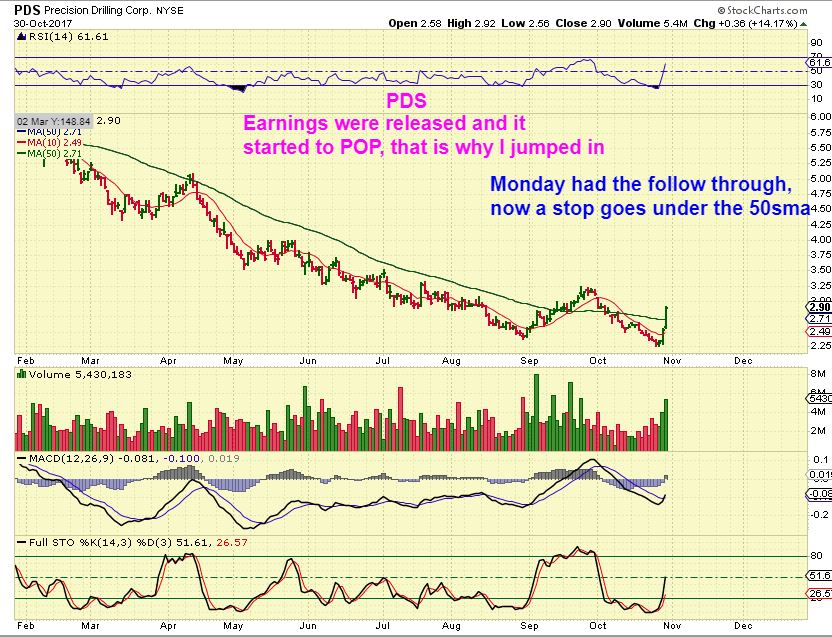
PDS -This also started to go sideways, but that is normal, and I thought that this was a 1/2 way pause. I still owned it.
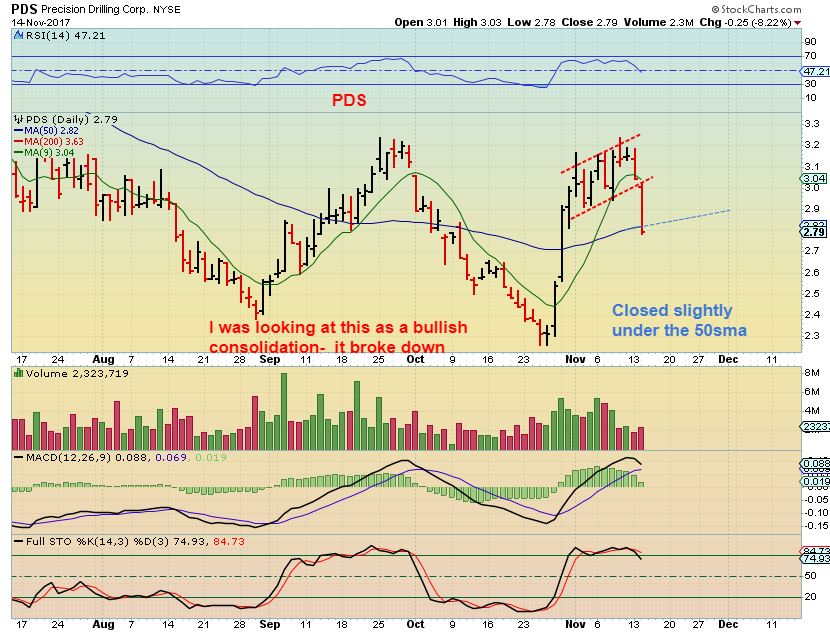
PDS – Tuesday, and I still owned it until the close. It dipped to the 50sma, and closed under it. Why a sudden 8+% sell off after a strong run higher and flag pattern? I dont know, but something seems to have changed. I just want to watch this from the sidelines now, and if the Bull run continues, I will find another entrance, for now I locked in much less gains than I had at $3.20, that’s for sure.
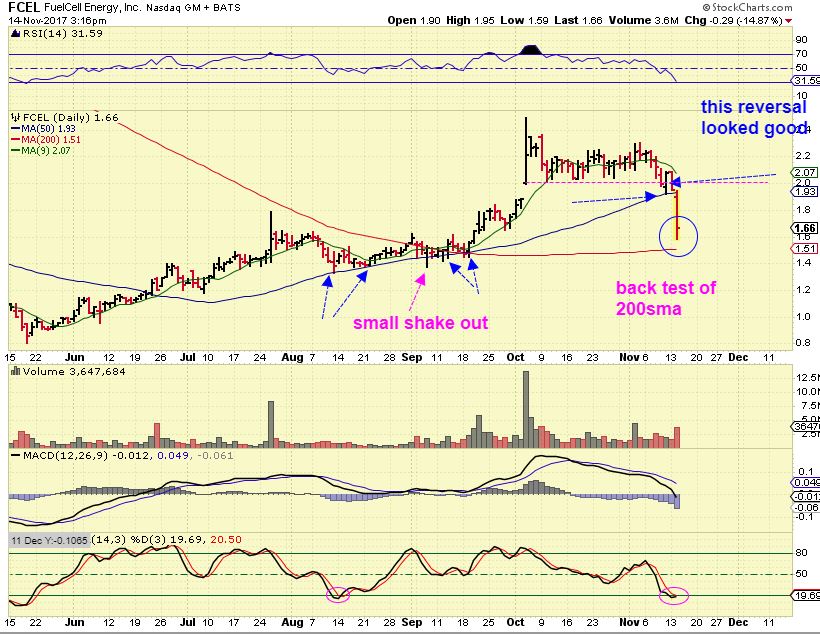
FCEL – Fcel was fine on Monday too. It tagged the 50sma and reversed higher Friday, and that looked good. Monday it drooped down a bit, but Tuesday it dropped 14%. It may slow up at the 50sma, but this is a sharp sell off after a strong candle higher in early October. What changed? I found NO NEWS on it.
If you own something that looks suddenly weak or like it has changed from a bullish set up to a weak one ( below the 50sma or major support), don’t hesitate to cut it loose and re-enter later if it acts properly. Missing a little gain is a pain, but missing a bigger loss is the goal. Look at the chart of PDS gain.
Honestly, PDS looked GREAT to me on Monday. It looked like garbage all of a sudden by the close yesterday. It may recover, but I just didn’t see the same set up that I did on Monday. My gains were evaporating. I can get back in if it regains its bullish look.
I was asked what I was currently holding. Please know that this could change at any time, because I am a very active trader, I don’t like to hold too many positions at one time, and I may even sell one stock simply to buy another and avoid holding too many at one time. I know that I can always get back in later. I doubt that I will be selling the Medical Marijuana stocks unless they really sell off. They seem to have great upside potential even as they pull back a bit. I have been asked by 1 reader to try to mention if I see a reason to sell these the Medical Marijuana Stocks, because they do move fast. I will announce in the comments if I sell any of these, and I will also mention in my following report when I do sell OGRMF, APHQF, SPRWF. I sold all of my MYMMF yesterday. Also, I bought NAK at the $1.20 area, so I do not plan on selling NAK as long as it trades above the 50sma .
I am still holding NAK, OGRMF, APHQF, SPRWF, LGCY, WTI, MBOT, and sold PDS into the close as mentioned above. When I sold my FCEL, it looked perfectly fine above the 50sma, I simply sold it because I was buying MJ stocks. I also hold a couple of positions that some readers may remember me buying, in a separate account and held for over a year.
Nov 14 – Something Precious On The Horizon 
 Thursday November 16th
Scroll to top

Just in case you missed it, I forgot this chart and I added it into to the report minutes after releasing it. It shows how Biotech did a shake out below the 200sma last November. ICL
https://uploads.disquscdn.com/images/97917f2d3402351be45a4b2c992f40ee0d7c13ade406e148d4d63a6de5eb56f7.jpg
Thanks Alex, great report as usual.
As you have mentioned many times when you have these big triangles it really makes it challenging (cycle counts etc.) Also by definition the triangles usually break out strongly in either direction. I appreciate that you try to keep an open mind and also even if you lean towards a downward move you also mention that if it breaks above this level that would be very bullish.
From time to time I get promotional emails and also based on editorial posts seems like a lot are negative on the PM’s. Lots of surprises recently like the USD etc.(as you mention). The one thing I do know is that you react quickly to changes for now your defensive moves in some of the sectors is a perfect example. As you mention often sometimes you just have to let the market provide a few more clues.
Thanks Ziggy
When I wrote the recent report about running the stops and breaking prior lows, it is because i have definitely seen that happen, and I understand it to be how the Big Money does push things around to get positioned for a rally- so I think it is important to prepare for that.
I also have a chart that shows the opposite, and I was going to put it in a report last night, but there was so much change in many areas, that it needed to be addressed first – especially with Oil Inventory today. I will put that in the next report- and then we have both sides of the story to prepare us for ‘anything’. One thing that I will say is that I RARELY EVER believe a move in Gold without the miners becoming bullish too, and usually – almost always- Miners actually lead the way. Right now they look to be leading the way lower.
yes, I need the market to give me more clues, that Euro move was a bit stronger than I thought at this point too. 🙂
I have been noticing the same thing, seems there are hardly any bulls, even in the ¨perma-bull¨ camp.
I got an email asking about URANIUM STOCKS. This was how I answered that email & a chart is attached. They do look quite interesting as they burst higher & are drifting back now. I replied…
I did see uraniums breaking upward and I will add a chart of DNN. UUUU
pretty much is doing the same thing, falling back to a support zone.
THEY COULD BE BOUGHT if you see a reversal near the support – but I am
not sure that they will continue higher right away or stumble around a
bit under current market conditions. URG, UEC, etc – they all seemed to run through the 50 &
200sma, and then dropped back under the 200sma- maybe to land on 50sma .
I would still wait for a reversal or see if support holds, see the DNN chart
https://uploads.disquscdn.com/images/1d15abea717efb8a024426c71f7527b38eb20fae3b80932564b113c6391e0549.jpg
Great report Alex! Do you know what time the oil inventory report comes out?
I believe it is 10, but it may be 10:30?
Interesting pennant forming on EDXC. Everytime it touches the bottom trend line it bounces. Now getting very tight.
https://www.tradingview.com/x/OjVLmH0c/
Thanks Bill!
Yes, and another view that I have been noticing too.
https://uploads.disquscdn.com/images/c39c11bae763032e3f9554e30040e41d0d8c00d4f38fce7856cfae725a2518ce.jpg
Alex , APHB had cc yesterday things are positive . It was up after hours and premarket for anybody still holding it .
What is cc?
Conference Call
Thanks
Hey, I missed this – yes, APHB is up 12 % at this time
noticed the loony aDhD changed its name to aRcT
Great report as usual Alex, and thanks for always reminding us of the bigger picture,
Thx Miller
FNV new all time high today.
Back in September IAG & SA were up there too, but they sold off. FNV is a winner for sure
Alex, did you sell the balance of your WLL? It is still hanging on above 50MA. Thank you
WLL looks like it may have found support at the 50sma, and seems to be reversing- Like I wrote in the report today – It is not one that I won currently
Dear Alex,
Earlier i missed the opportunity in IPI & TGB. Now they are pulling back. What are looking for an entry?
Thanks
Hi Siva
They are breaking down below the 50sma, I would wait
Aaaaaand it’s gone. XLE loses the 50 and 200sma. May find support at 66 (October low) or at 65 (descending trendline).
hi Omibibulous- I do not see that?
http://tos.mx/tosmx/item?id=FAdFSs&image
If I’ve made an error in my chart, please let me know. Still learning…
Edit: Hmmm. My lower indicators are MIA. Give me a minute…
Edit: Maybe this? http://tos.mx/tosmx/item?id=YBXKCr&image
The chart is correct, I think that you read it wrong.
Price did go below the 50 sma and you are showing the 10sma- but it didnt drop below the 200sma on your chart either. It is below both the 10 & 50sma
That is what I had too.
200SMA (yellow line) = $67.52
Current price = $67.2x
Am I missing something?
Here is what I am seeing
https://uploads.disquscdn.com/images/779e9ac068d79c020346a87947397a6da5201be4e116c78e7ad15208a14d1adb.jpg
Alex, my Worden chart agrees with Omb’s.. the stockchart’s 200 seems low down
Yep – I tried another charting service & got the 200sma higher too.
I’m beginning to lack trust in Stockcharts- their charts of NATGAS are wrong & Gold is still missing a day
BBG short locked in half at 50 cents a share. stop at 6.25 entry, either way im going home green on this one.
I am visiting with my parents right now, but will be online off & on. I believe that the Oil inventory report is released at 10:30 am
GLD popped to the 50sma and turned down. GDX GDXJ turning down- so it certainly does look as though the cycle counts are working & it is too late for a rally.
UUP turning up above the 50sma
This really agitates my inner engineer. Seems to me the 200sma
calculated on the close should be the same no matter who’s doing the
chart, yet I’m getting three different values from three different
sources for XLE:
Yahoo = $67.97
Think or Swim (mine, at least) = $67.52 (Trading View has this also.)
Stockcharts = $66.56
Alex, are you using Stockcharts? Is it possible their data is wrong, or am I trapped within a bubble of the time/space continuum?
I used a different charting service and got a different number too ( About 67.50 also). I believe stockcharts data is wrong
That would seem right. I’d expect more of a flush if it dropped below the 200. It’s acting like it’s trapped between that and the 50. Sucks because it’s like having two watches – you’re never sure exactly what time it is.
Unless it is a shake out of the 200 and recovers
I’m itching to short it, but I’m gonna wait for some confirmation one way or the other.
I’m seeing reversals in many individual energy stocks- could just be a midday bounce, but it may be a shake out & recovery too…. so I am just watching it for now.
I sold PDS when it closed below the 50 sma. It dropped this morning & is recovering….I am thinking that we may ( MAYBE) get shake outs here in Energy- many are reversing now
inventory came in low, under consensus, at 1.85 vs. 2.2 suggesting strong demand…
It seems like that is happening so far. I held out a little below my mental stops and glad I did so far.
CRK is acting correctly if you look at it , and a few others are following that same path
refresh
https://uploads.disquscdn.com/images/e090dc30ee030d253331d22f51e7edb0260b9c7b6386fb79bc9cba647e21ec2c.jpg
Alex, when you have some time, can you comment which of the blockchain/bitcoin stocks you think have nice setups? They seem to be rebounding. Listing some below, thanks!
PRELF
BTSC
RIOT
GLNNF
BTLLF
MGTI
GAHC
I was just looking at them, and they do look good, but because of the way they move, it is hard to know if lows are in.
I was looking at PRELF, RIOT, & GLNNF
I jumped back into GLNNF this morning…I’ve had and sold it once before….
Big volume on PRELF
Yeah…..I’m taking a look at that one….:)
Do I dare say natgas looks interesting?
It has looked good – there, I said it for you 🙂
BBG just reversed, popped to green and is looking rather good.
I shorted from 6.25 down to 5.75 sold half just covered the rest at 6.10 ill take it
I saw that, nice trade. I saw where you posted this a.m. that you took 1/2 – I actually thought that it could drop further to the 200sma, but reversals are starting to pop up
goManGo …. thx! 🙂
Bios rallying…this may be the time to hop on the rocket.
We do have some reversals in XBI & IBB that look pretty real.
IBB shake out below the 200sma and recovery?
taking another – for the 5th time, stab at LABU
Jump in with me so i have someone to hold on this ride LMFAO
Bought my first 2 1/4 positions.
Im in as well!
only 200 shares
CRYSTAL – Th other day I mentioned that Canadian MJ stocks were acting strongly, but the others were not all showing strength, possibly due to Sessions in the US. Well, I am seeing some nice bases forming and decent looking set ups in some of the others too.
I am nt recommending these, but take a look at CBDS on a 3 month chart – I like that base.
PURA Looks good.
CNBX is interesting as a base
OWCP is really interesting
and there are a few others. Maybe they’ll have their day too
CCJ a buy?
lmfao thats U Mrs Bigbux.. Im just your annoying twice removed nephew trying to grow his vacation fund as well
giggle… well.. i was waiting for 1.54 DNR… may 1.58 was it?
im on a small tablet & cant chart
A small tablet called Valium
#SoICantChart
that was funny
dont encourage him…
Sometimes I hold back, sometimes I just have to share what goes on in my twisted mind. It was the first thing that popped into my mind 1 second after reading her post 🙂
“I’m on a small tablet..”
dont u have Wood to chop… or sumthin….. 🙂
I’m at my parents house.
Wood stove, Banana Bread &Coffee, Internet…. no wood chopping today 🙂
. https://uploads.disquscdn.com/images/229effa6d8c2bc98338c99028516baf6429ef5d261081e951d1b7a6b4e76daef.png
hahahaha!
1.54 i think, but that was before it climbed up to 2.00
I’d very much like 1.54 now
NKE looks like it wants higher here
Yes it does.
Here is a slightly different version of Steve’s 15 min chart and the 9 and 10 moving average using Renko
http://schrts.co/cSRudZ
Nice!
Square is evidently testing it’s app for use on bitcoin…..
I still recall the one you mentioned SING.
Have you seen the 3 month chart of that? That is a nice set up, I just cant tell if it is ready to go yet.
Ya, I used to have it long ago when it was like….2 cents…didn’t hold it, got impatient….looked at the 3 month chart you mentioned….does look good, but like you said…who knows when it might be ready? It takes its time that’s for sure…but…..at that price, I might get a few shares and just try and forget about them this time…instead of wanting instant return…and see what happens…on 5 and 10 day chart it looks like a little flag for today…..but perhaps it also looked like a little flag on Nov. 6th……:P
I remember looking at this recently and now can’t remember if I bought it recently and sold it or what…? I’ve been doing way too much in and out of things….sheesh. I’ll have to go check my trading history…
It has little pops every so often, and looks like one of those ’rounding bases’ forming after that bigger run.
The 4 month charts changes the whole shape of things. I do like it though.
Back when I first read about SING here months ago, I put a small amount in it for the long haul, just in case it does well. I got tired of looking at in my main account, so transferred it over to a seldom used account.
Thanks for bringing it up, I haven’t heard about SING in a long time – just look & it’s about 75% of original value. I suppose I should consider a target for selling if it does well…
OWCP … meeoww …tx ChotFreakyDeak
I know- now some of the US ones are running, and I did mention it down below in a comment to Crustal – and I bought CNBX 🙂
PURA, OWCP, CNBX, AMMJ popping today – others look to be possibly setting up.
This sector MIGHT be ready to move higher in the US too. Is Sessions going bye bye?
Who is she? …. Someone new?
*snicker
JRJC – Quite the rejection at the 200day
MBOT announced earning yesterday, so that’s over
Hi Alex, so far XLE has broken it’s intermediate trend line (gapped down at open and hasn’t recovered it). Do you think it’s worth hanging on to ERX or is this a strong signal for an intermediate decline?
Sorry, but I really cant know with just todays trading and the day hasnt closed yet.
It could recover, it could sell off in the final hour. Oil didn’t cascade down wit the inventory report, and neither OIL nor XLE is at the lows of the day, so they do look like possible reversal candles, but the day is not over and all of the above can change. ERX is a 3x etf and I am always cautious with that, so you will have to decide. I dont know where you bought it .
Closed below 200 and IC trend line.
As per Peter below.. got some bios in my list started poppin
MDGS too low vol, and my bid/ask spread is 6%.. so not buyin.. but maybee a canary in the coalmine for other bios?
Again, the MJ sector, this time in the US- seems to be coming alive.
I bought CNBX earlier today and just noticed that it really popped. When I bought , it was under the 50sma, but I was hoping ( 3 month chart) for the base to pop & close it above the 50sma. So far – so good.
Good small bases in CNAB (Almost bought this one too), CBDS, CANN, REFG, AMMJ, OWCP etc too, but now a few are a bot extended and need to pull back for a better entry.
By the way- HUGE SWINGS on CNBX lately. Though it looks good as it rises out of the base, it is up 20%, down 15% , etc
I released th Thursday report