
Friday November 17- A Lot Going On
Today is Friday and it is the last trading day of the week, so let’s take a look at the markets and then discuss a couple more trade set up ideas.
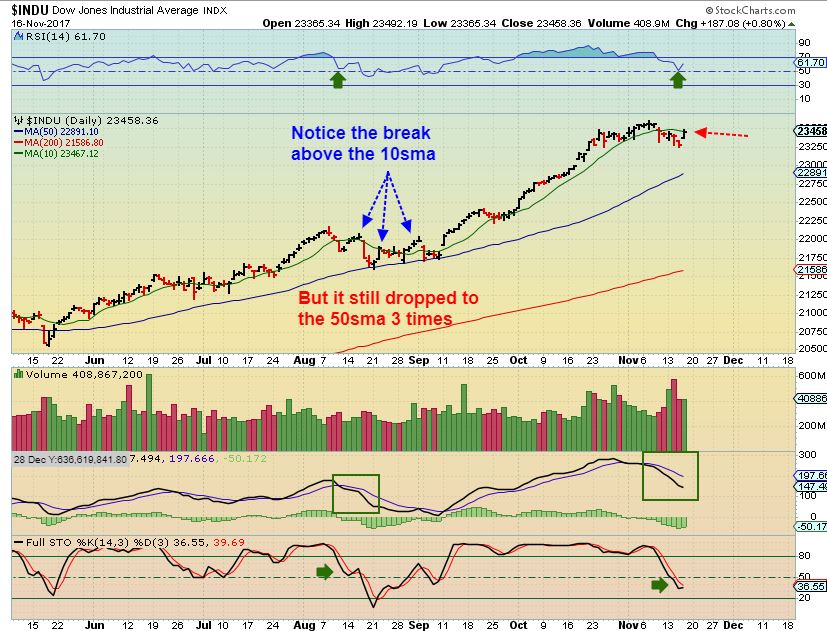
DJIA – We do see a break above the 10sma in the very bullish run of the Dow & SPX. The Dow closed slightly below the 10sma. The reason I wanted to point out the lack of follow through in August on this chart is because of 1. The divergence that was popping up recently, and 2. I got several Emails telling me that the ‘Sell On Strength’ numbers in the WSJ showed up as very high. That doesn’t usually happen one day out of a daily cycle low, so let me just say this… that warrants a little caution at the very least
1.This is a break higher and could be bought as a day 1, but there is a chance that you could be stopped out, so maybe start small?
2. The stochastics is not completely oversold
3. Divergence has not only happened in internal indicators, but the RUT & TRANNIES are very out of sync with SPX , DJIA, NASDAQ. Just remain alert ( Stay Frosty) until we get more follow through. A drop to the 50sma without a stop would hurt you 3x ETF traders.
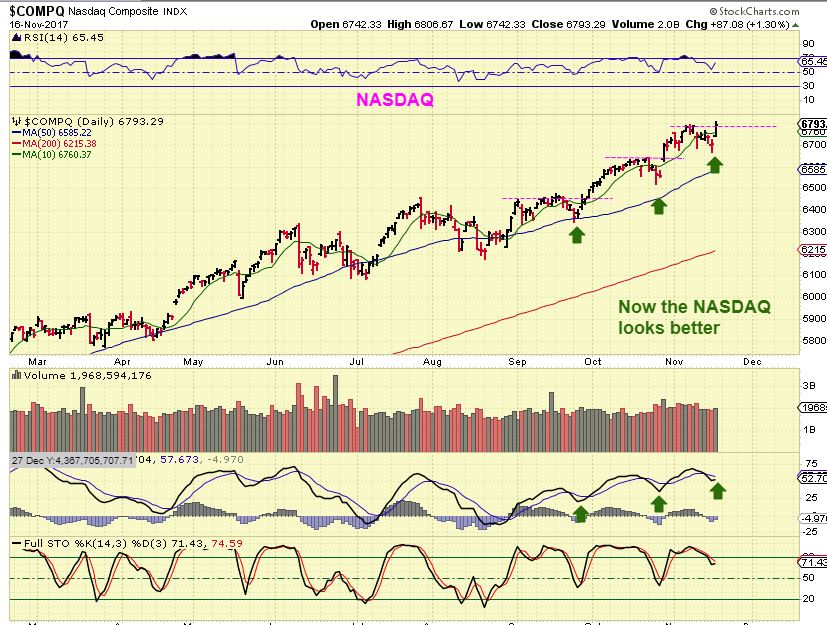
NASDAQ – The NASDAQ actually broke to a new high, up about 100 points at one point. This looks quite bullish, really, and we do see a series of higher lows and higher highs, so some may never even have been stopped out of their trailing stops.
XBI – Long Term, Biotech has been in a bull run higher, and is at a support area. This is a buyable area, according to this chart, correct?? Looking at it this way, you could just Buy the lows, sell at the highs, HOWEVER- So many traders here only want to buy THE LOW WITH 3X ETFs. Another strategy has to be used when trading 3x etfs, if you keep tight stops. The idea is that We look for swing lows, probabilities of support, a reversal, and so on, and if someone is only using 3x etfs- START SMALL and add when confidence builds. Look at this chart. Can this dropped to the 200sma below the blue channel in your mind? Yes, it has in the past a few times, so it could do that again, but this is an uptrend and remains bullish at this point. Read the chart and continue..
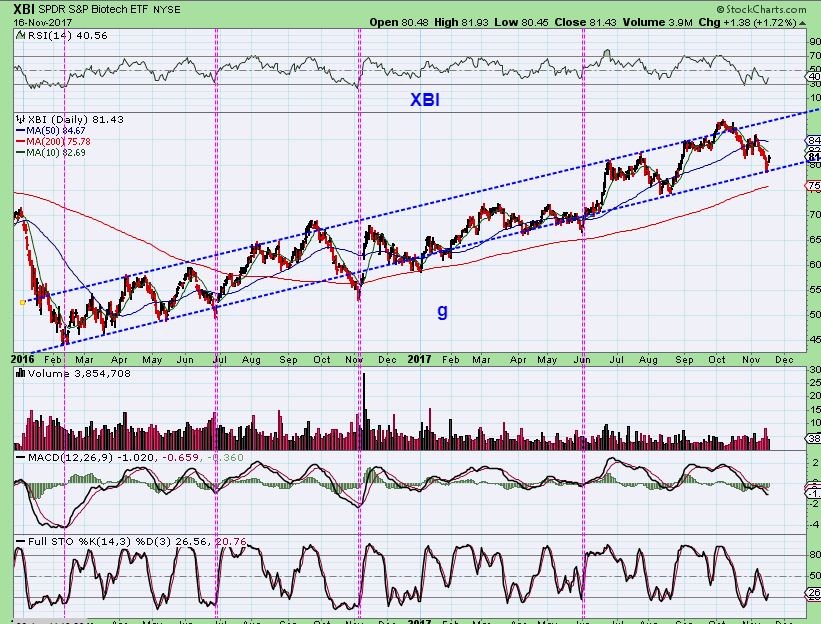
The above chart looks like the last 3 ICLs (Magenta lines) dropped to the 200sma or overshot the lower blue line. If we are headed for an ICL, we may do the same here. This current reversal could be bought, but this may or may not be THE lows. It is a very bullish 2 yr chart though.
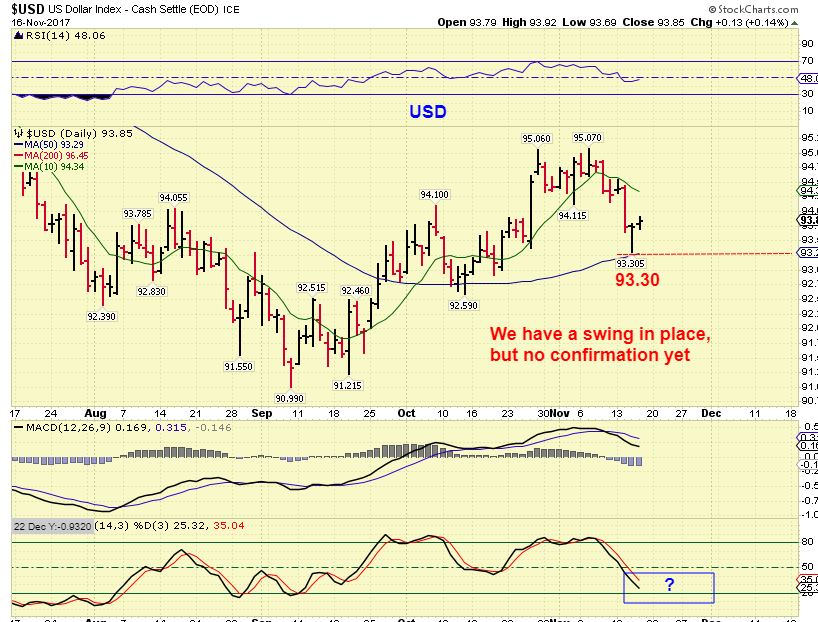
USD– The USD reversed on the 50sma at 93.30 – this is a new level to watch if you see the USD selling down. If that low isn’t broken, it means nothing.
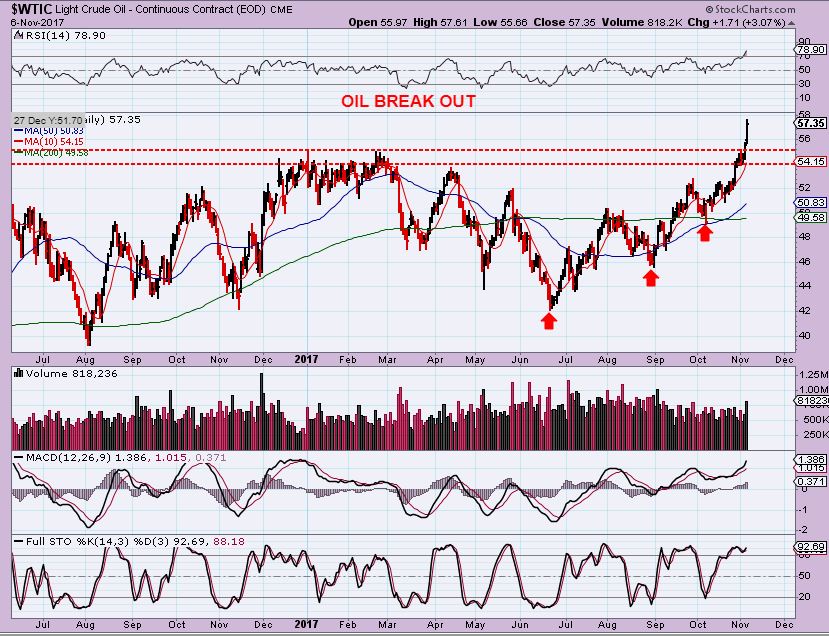
WTIC #1 – Let’s look at OIL again. THIS WAS MY NOV 7 CHART after a solid Break out, and a back test COULD come to $55 or $54. There is a small break out at $52 also ( not drawn in), and the 50sma was rising up toward that area.
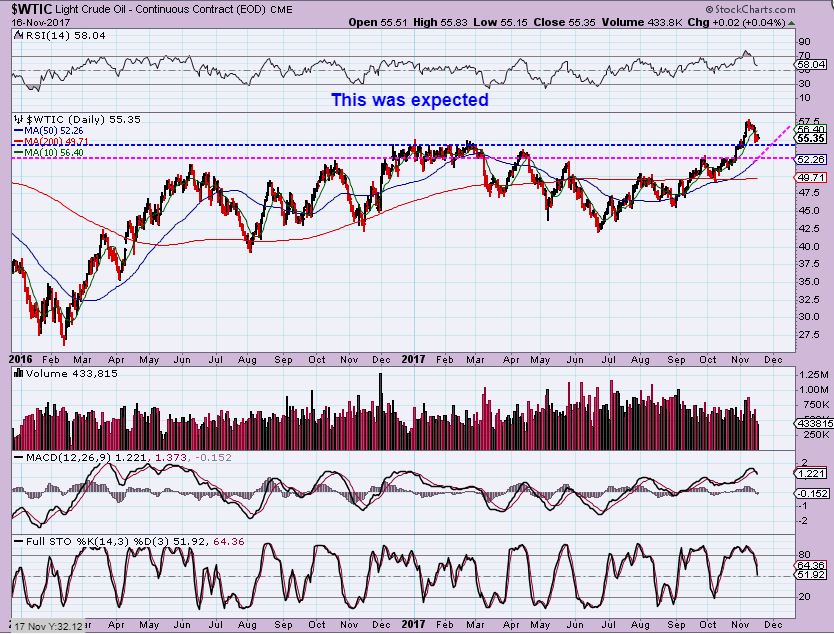
WTIC #2 – We are experiencing the back test, I think. We are at the $55 area. The 50sma has now reached the $52 area, so I drew that smaller break out level in with a Magenta line.
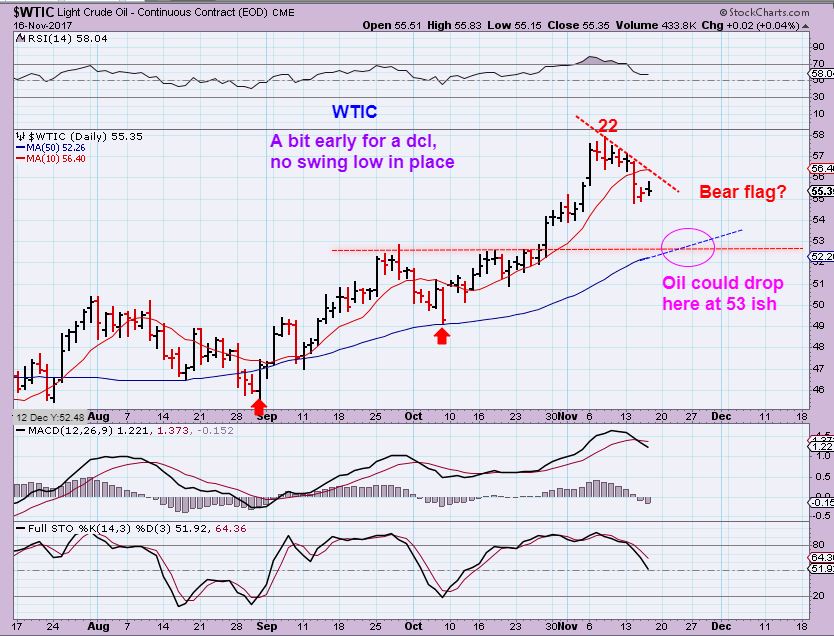
WTIC #3 – We are a bit early for a dcl too, so I think that Oil could drop further, even though we saw a reversal after the inventory report. That could be a bull flag bounce. Here I am high lighting that $52 shelf more clearly and this is where the 50sma is. We could be seeing an A-B-C down to $52. Time will tell.
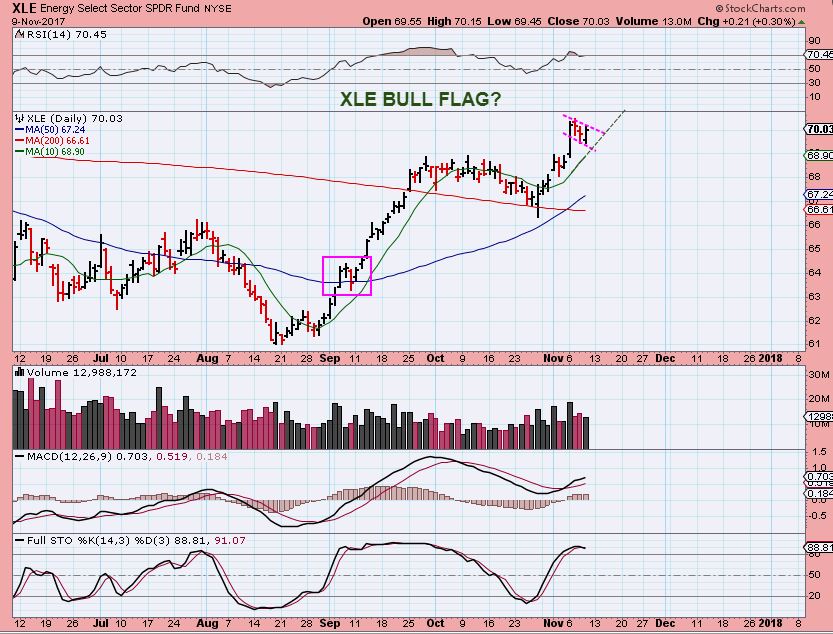
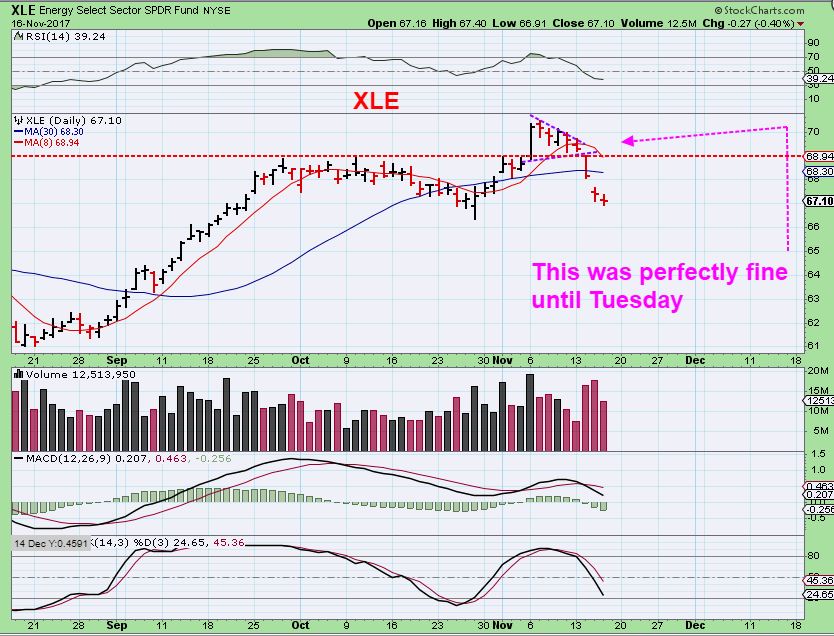
XLE – I thought that when Oil did a back test, Oil / Energy stocks would go sideways or hold up well. I saw a bull flag forming & Expected another strong leg higher sooner than later. The XLE looked good here just last week.
XLE – I was flat out wrong, this sold off sharply Tuesday as Oil pulled back. Please read the chart, as I point out a possible bearish rising wedge.
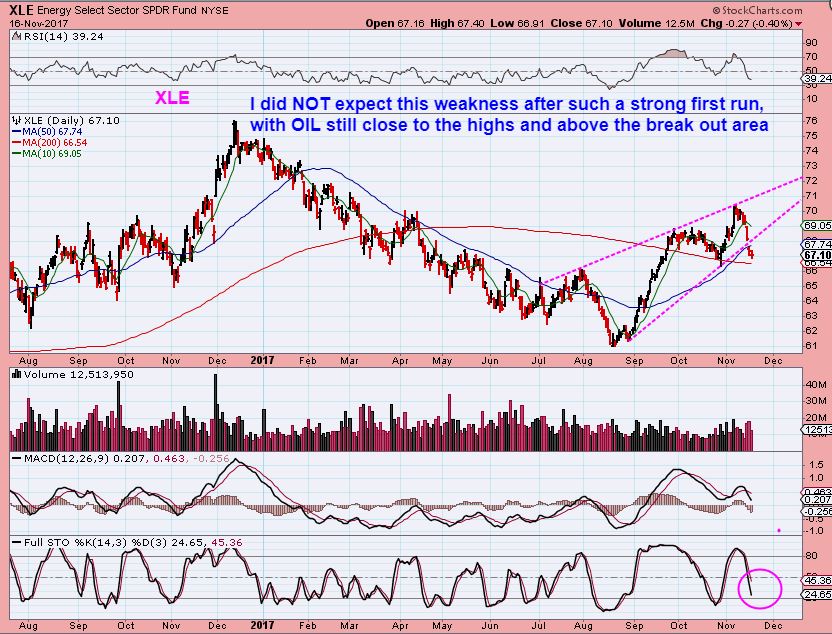
XLE- Here I have added a lower parallel line. This can go sideways to the line, or this can drop further to that line. With that in mind, I have been cutting my positions in this sector until I get either better clarity or Bullish reversals and recovery for another run higher.

Yesterday I showed how WTI, CRK, LGCY, and a few others are still looking ok, holding up well. They still are, but if that is a bear flag in OIL and Oil could drop to $52? I want to step aside or use TIGHTER Stops to avoid more draw down. I was buying this sector over 3 weeks ago, and even though I locked in some gains, I have given a lot of the gains back in this sector, especially with Tuesdays surprise drop.
.
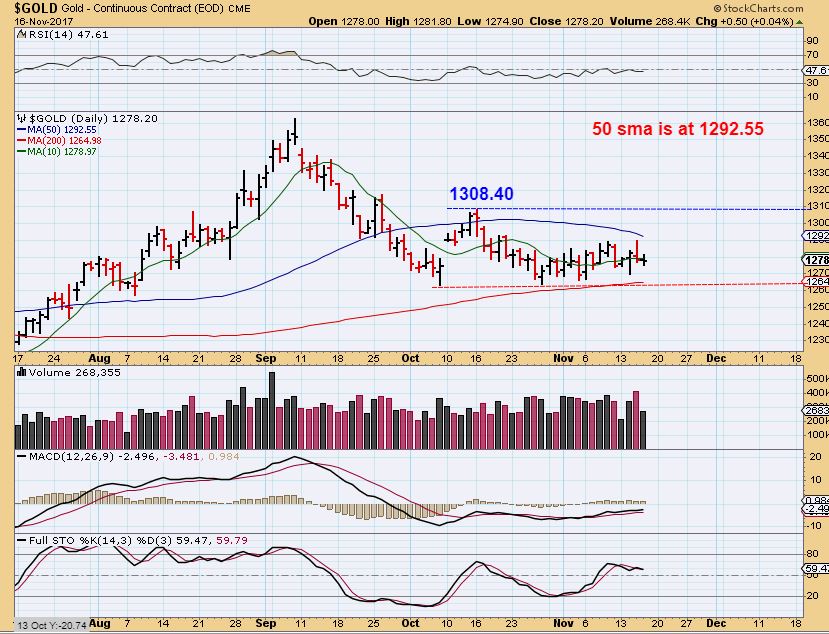
GOLD – Our parameters are in tact, watch these numbers. A break higher above the 50sma is unexpected.
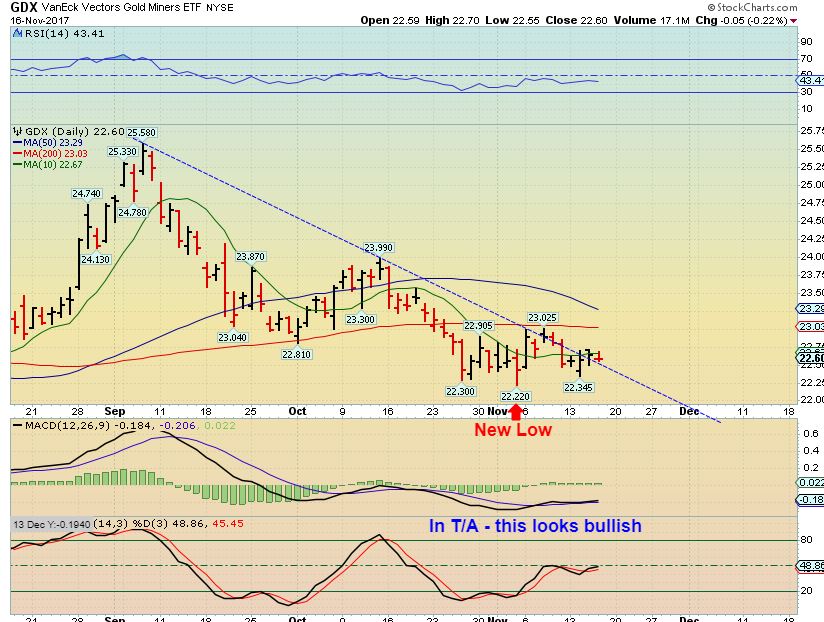
GDX – Miners have been weak, and remain under the 10sma on a closing basis.
Enjoy your Friday trading and we’ll see you in the weekend report!
.
~ALEX
.
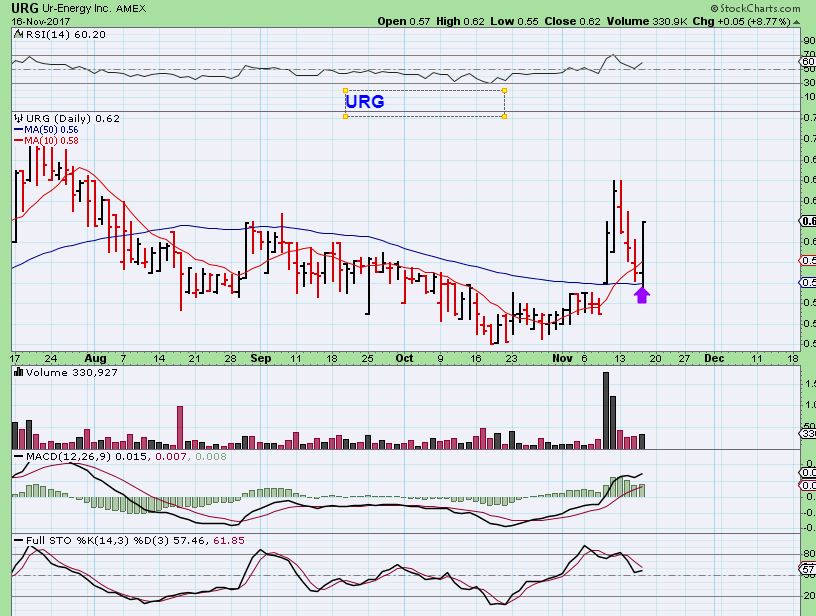
URG- From yesterday, I mentioned that you might want to look for reversals at support on Uranium stocks, since the move higher was explosive volume and the pull back was very light volume. Positions could be taken there as a lower risk, much netter than chasing & jumping in last Friday.
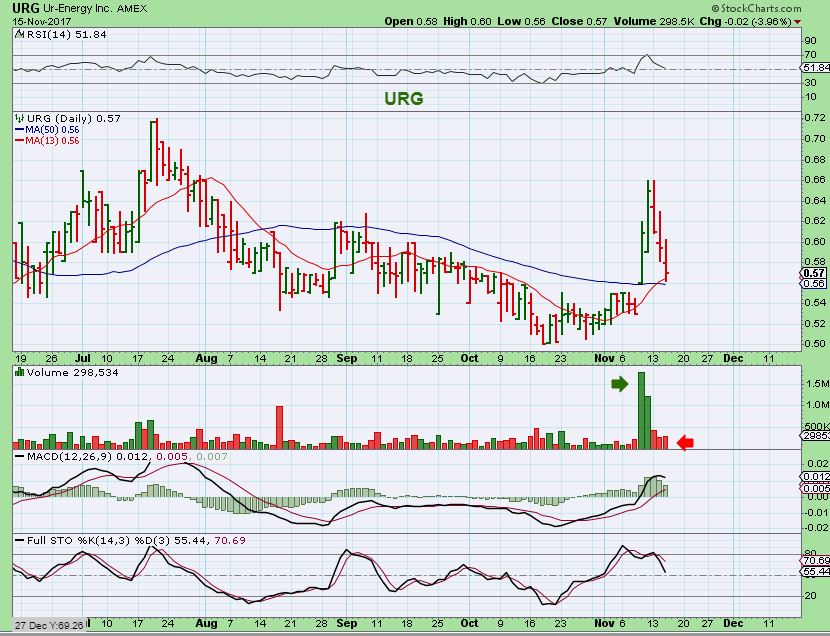
URG– BIG reversal here.
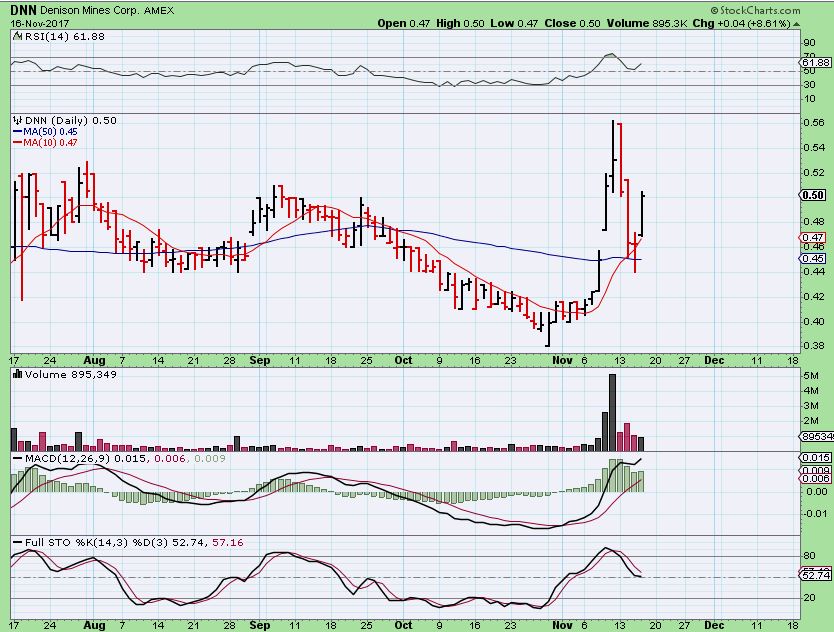
DNN – Dropped to the 50sma ( Possible dip to the Magenta line near 44 cents). Reversal would be an entry.
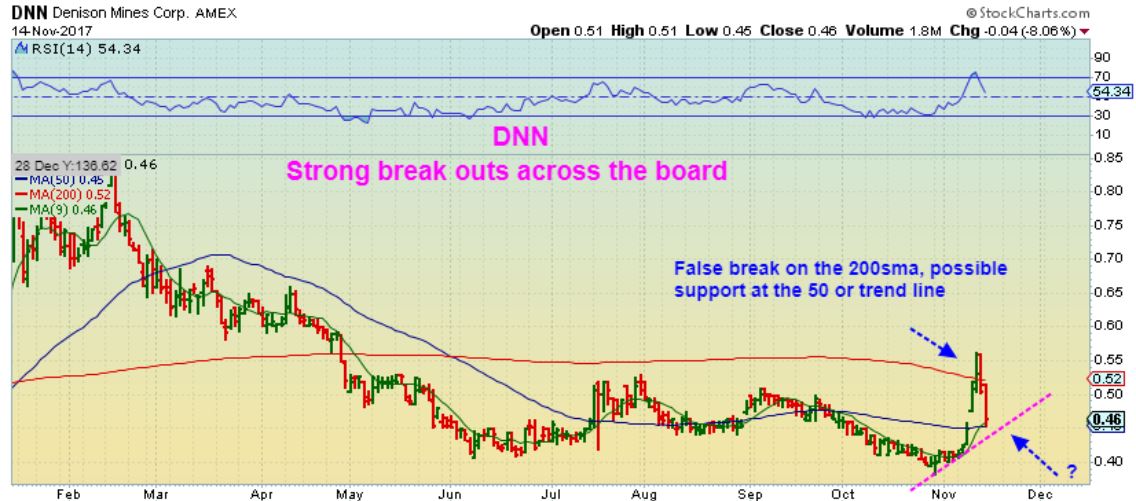
DNN – Dropped to 44 cents at the Magenta line & reversed back above the 50sma. That was a low risk buy and follow through Thursday.
UEC – UEC had a reversal on the 50sma ( I didn’t love this set up due to the gap, but it was a possible buy with follow through so I posted it).
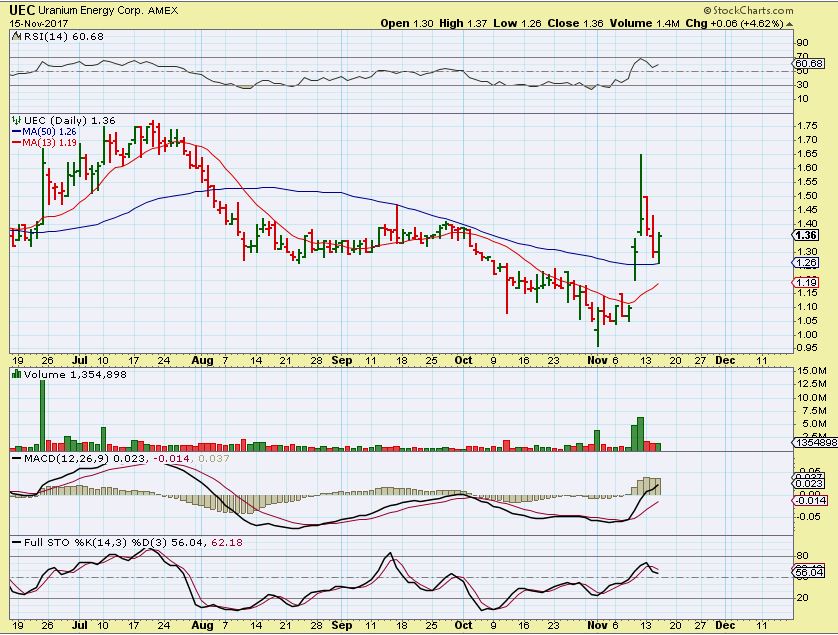
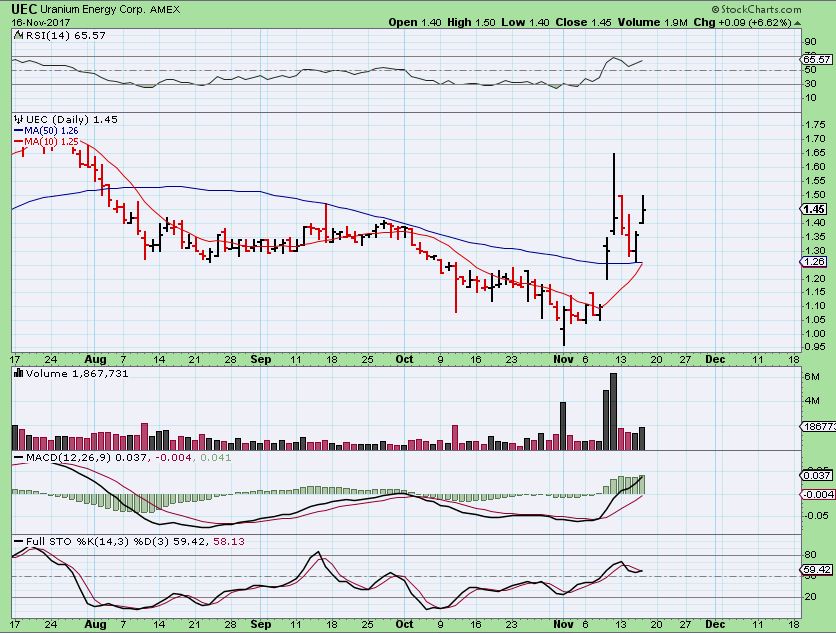
UEC – It gapped again. This makes me wonder if these ( or this one) will consolidate a bit and drop back down?
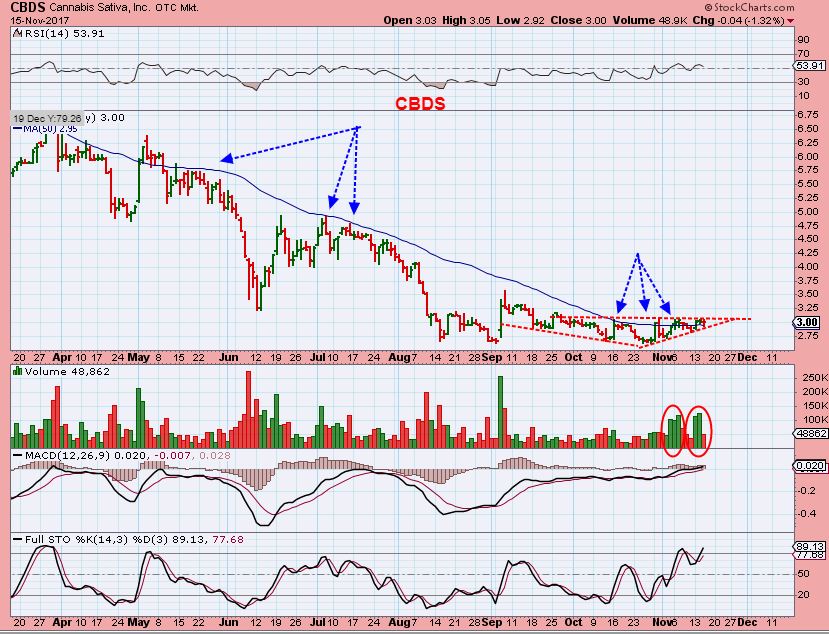
CBDS – I also posted this MJ stock that I like the consolidation base. I said that I will buy this if it breaks above the upper red line.
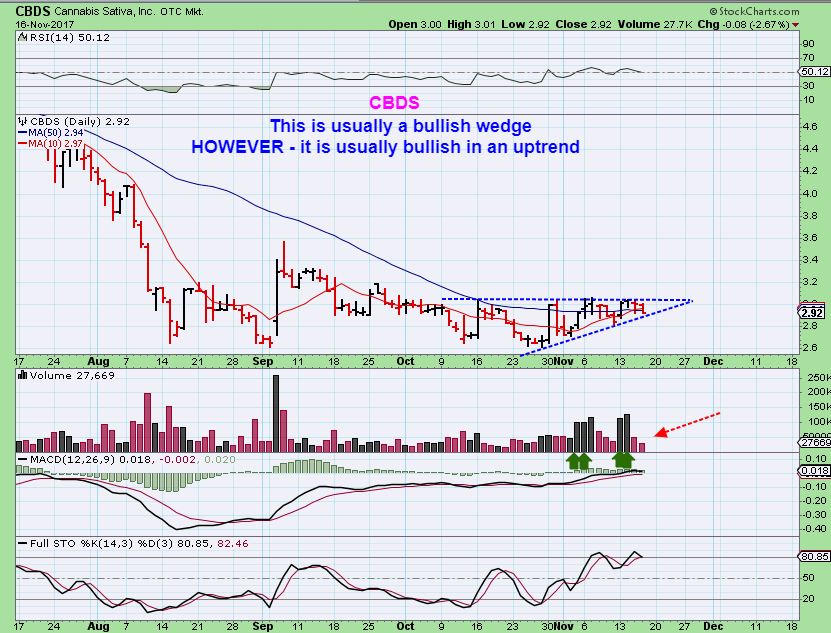
CBDS – It didnt 🙂 but I still love this set up. I am watching this daily now. I almost bought this right here at lunch time when I checked it on my phone, thinking that it must be the low, but I own a few others and that held me back. Please read the chart.
DANGER DANGER – BLOCK CHAIN!
NOTE: I have mentioned that the set ups in my BIOTECH BASE PICKS , some of the MEDICAL MARIJUANA TRADES, and these BLOCKCHAIN TRADES ARE HIGH RISK, AND MAY NOT BE FOR EVERY TRADER OUT THERE. I HAVE REPEATEDLY WARNED TO MAKE IT CLEAR THAT…
1.THEY ARE NOT FOR EVERYONE.
2. SOME SHOULD PASS AND JUST WAIT FOR A GOOD SET UP IN MINERS LATER.
3. IF YOU TAKE A POSITION, MAYBE START VERY SMALL AND SEE WHAT HAPPENS.
4. DO NOT TRADE THESE IF YOU ARE NOT EXPERIENCED ENOUGH TO KNOW WHEN TO SELL OR CAN TRADE THESE WITHOUT MY ASSISTANCE.
5. DO NOT TRADE THESE UNLESS YOU CAN KEEP AN EYE ON THEM. I MAY NOT ALWAYS BE THERE TO GUIDE YOU- KNOW WHEN YOU ENTER WHAT YOU EXPECT AND WHEN YOU WILL EXIT ( HIGHER OR LOWER).
AND NOW I WANT TO ADD ANOTHER WARNING…
6. THEY ARE LIKE DEAD FISH IN YOUR HANDS, THE LONGER YOU HOLD THEM WHEN THEY ARE NOT ALIVE & SWIMMING HIGHER -THE MORE THEY WILL BEGIN TO STINK.
BLOCKCHAIN
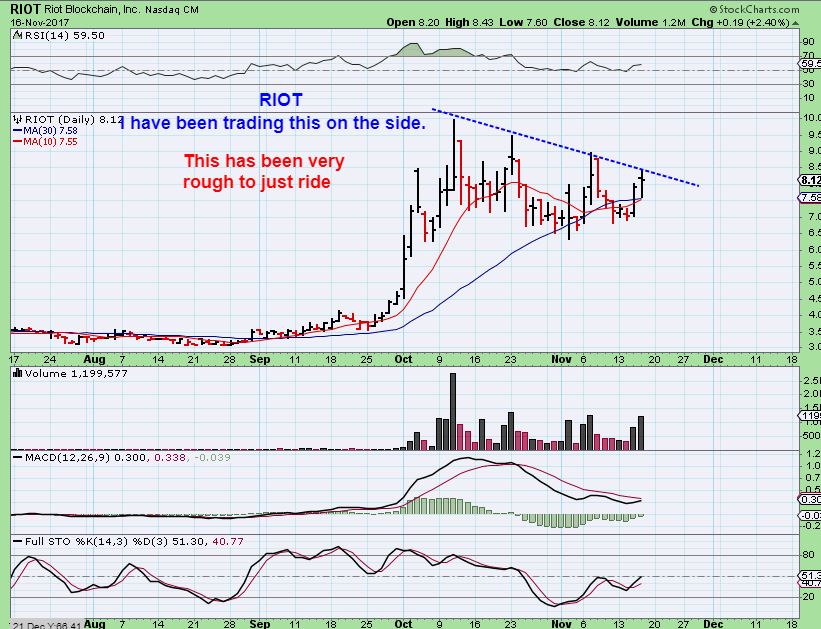
I HAVE BEEN TRADING THIS SECTOR ON THE SIDE , trying to figure it out, experiment with entries, exits, etc. Some of my favorites are RIOT ( It was ticker BIOP when I first traded it), GLNNF, and PRELF. We also have GBTC, BITCF, BTSC, GAHC, SING, and a few more that are struggling and I wont mention them yet. I want to point out RIOT here, if it breaks out it could really run nicely. I have traded this one a lot, it swings like Tarzan through the jungle, so be careful and do not trade this if you are inexperienced. See my guidelines 1-5 above.
.
RIOT – This actually looks like it may be ready to break out higher. If it does, it could run well. I have traded this a few times. Made big money, lost good money. This is a MUCH Tougher ride than it looks, let me explain…
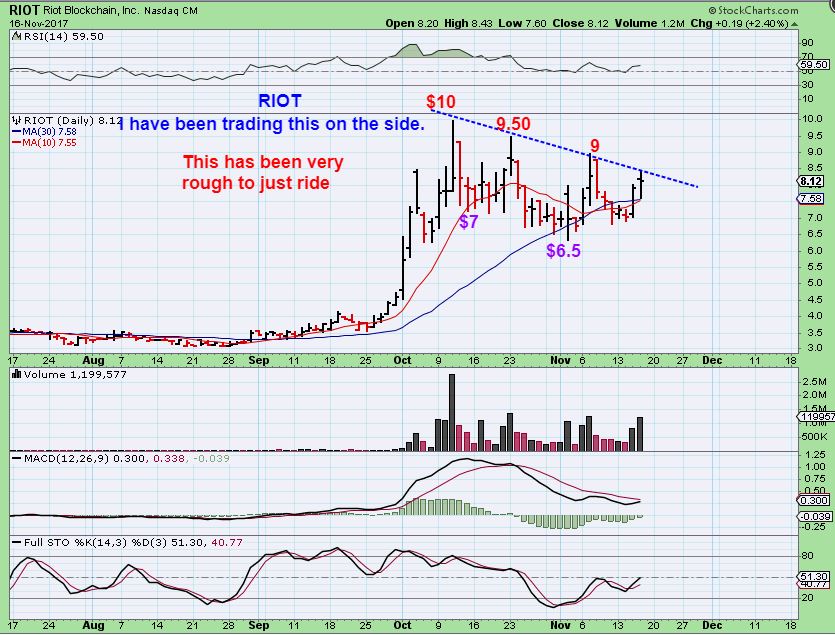
RIOT – This was SO difficult to ride, the swings were brutal on a day to day basis at times. Please understand that if you simply bought 1000 shares in early October, your account gained and lost $2000- $3000 in just 2-3 days at times . If you bought 2000 shares, your account jumped up & down by $4000-$6000 in days. It went from $10 to $7 / $7 to $9.50 / $9.50 to $$6.5. However…
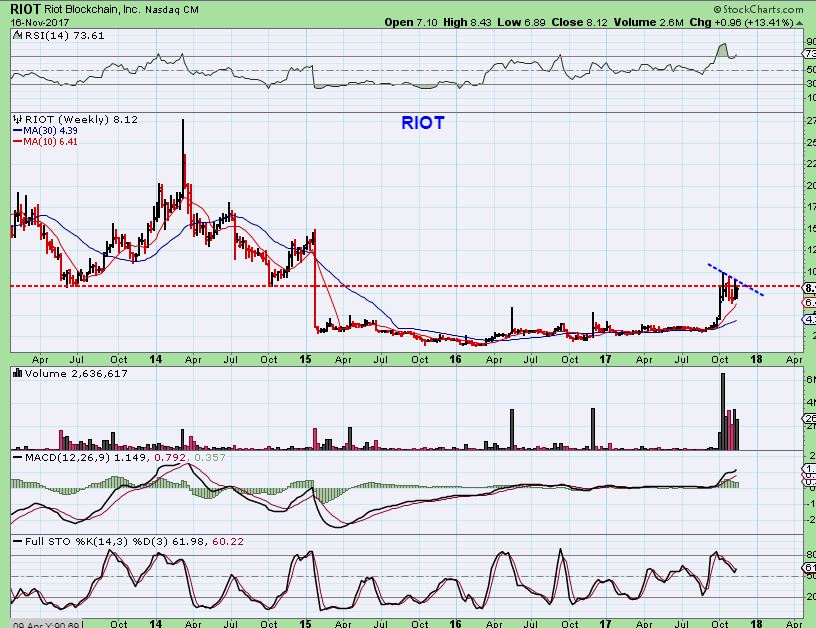
RIOT – The long term chart points out the recent resistance, and RIOT seems to be preparing to break out. This week? Next week? I can’t say, but again, a break out could really run quickly higher…


CF, big jump in $WTIC. Ru thinking a 10ma back test? Sold all oil stocks and now I feel it may have been too early 🙁 Thx!
I’m thinking it could be range bound for a long time. But that’s just me.
Ho Deshy
Since I pointed out what I expect in Oil above in the report ( A back test of a break out), seems more like you would want to watch what the XLE is doing when Oil moves up or down- and right now, XLE is not dong very much. Bear flag?
I understand that when you wrote the question, markets weren’t open, so sometimes it just takes time to allow the market to tell us what is going on.
Alex. Re Natgaz. Is the chart still healthy or are we heading back down
Hi Eifion
Back below the 50sma is cautionary, it make one wonder if the move out of lows was more or less short covering, but it doesnt look BAD right now. I’m having a hard time tracking NATGAS well, because the Stockcharts chart is messed up & inaccurate, I’ve been using UNG – but I dont know if that is a fair comparison.
#6 above must have been added for me! I have way too many dead fish.
Ditto! Hence the expression, “Cut Bait.”
No – Over 20 yrs ago, someone that was teaching me the good & the bad about the markets used to say that about Options.
He traded them , but DID NOT recommend them for everyone, and when asked why, he said,
“Some traders have a hard time emotionally with selling. They wont let go of a good or bad trade, they try to collect them all. WIth Options, it becomes more like holding a dead fish…the longer you hold it, the more it starts to stink”
So I feel that could be true with some of the Faster Trades ( Biotech for example) that we have been using. It has been best to “Sell The Pops” after 1 -3 days and I have done that on many like MTBC, IINFI, etc etc , but I held on to MBOT and it stinks so far 🙂 The set up hasn’t changed however, it just becomes dead money for a while.
Yes…I took a beating trading options. MANY dead fish there for me! And I STILL have letting trades go as my downfall. I am trying to learn to take small losses. [but I HATE it! LOL]. Also, sometimes I like the story too much…but I also lose patience when they don’t move as fast as I want. ps…I am still in MBOT, FCEL, SPRWF, and many others. Every time I open my account, my computer room starts to smell of dead fish!
I still own OGRMF, APHQF, SPRWF too
SPRWF – looks like a back test of the 50sma, and now a reversal to move higher? The chart seems fine.
Just got back from lunch…SPRWF heading in the right direction.
Alex ugaz recently had an island reversal, and has now come back down to the top of the gap, if it holds it should be bullish
It did look like it finally put the lows in place, so maybe we are seeing ‘2’ of a 1-2-3-4-5 move
https://uploads.disquscdn.com/images/01f37fb88850cd6a8b181c17437c0595e3b75c6fa3fc00e918053e34e0a1e5c7.png Taking 50% profit on ENPH. Nice trade but a bit overdone this last week. Thanks CF!
Nice trade Mark! I sold a bit ago and made most of my gains on the first leg higher. I Should have stuck with it longer, it had . I think my initial targets were $2.30’s and then $2.60’s? So it has been an out performer.
I now predict that it will hit $3.08 and crash 🙂
It has been a really nice trade, it is getting over extended, and I still love that longer term chart that I was showing.
It may make a nice buy if & when it drops down again.
Hey, look who’s up early! 😛
G-Morning Cason – If you are in Hawaii – it IS early 🙂
Maybe I should try this more often. My account is actually green this morning.
BTW, same thoughts on oil/energy. Actually added a little bit more this morning to average down, but I’ll sell a backtest of the breakdown/horizontal support line you had in Thurs report.
mornin Casio.. whatchudoin up so early?
Trading!!
No, couldn’t sleep. Then went for 5 mile run around Diamond Head. Now, gotta go to work.
ANATOMY OF A TRADE:
I said in the report that I have been trading & trying to see if I can figure out the Blockchain trades move. They move like Cheetahs or 3x etfs – they dont always look it on a chart, but you can get 12% up or down in a day easily.
So I also mentioned that I have been trading PRELF (Made good gains), and I did buy the gap fill on RIOT this a.m. . I said about PRELF that I was currently in it, but not recommending it. This is the reason…
Refresh for a chart pf PRELF – SO FAR it is not acting correctly at the 10sma. I am still holding to see what happens, I’m thinking that it could drop to the 50sma, but I was hoping that it would regain the uptrend line & move higher. A CLOSE above that $3.00 mark is pretty much needed for that trend line to hold, and it just dropped to $2.80 ( These move fast) .
https://uploads.disquscdn.com/images/46e0326e0c4328b26dcbdd356cea3a44a43f6cf0ed46fa948967f86bc6e46b65.jpg
OGRMF – Refresh for 2 charts – Hopeful & on a 1 yr chart this was a support area / back test – but it is not oversold yet, so it might just go sideways and build a ‘handle’ as I have mentioned before
.
https://uploads.disquscdn.com/images/a6e83ae7e19ecf261aa9241320756e795a1130eafb6894db03b2683d6362f807.jpg
https://uploads.disquscdn.com/images/1c9d53580423f9debd6ef5bd27b719098ca87d679006b8febc6d7ff5b79536dc.jpg
Everybody took Friday off 🙂 Maybe I’ll take an early lunch.
I didnt even notice that GOLD was up almost $10 right now, but GDX is only up 10cents, so that doesnt feel like any big change is taking place- it doesnt FEEL like a normal sell off though either .
CF, can u see post above lol
Sorry – I’m not sure what this means
man .. is that all u do is eat? https://uploads.disquscdn.com/images/0d3a9f18f89437b3d932fc0e6dad1a3225bf59032701c147bd10b45cbe886826.png
3 times a day if possible 🙂
#Rusty
When I first started drumming again, I took the pseudo name “Rusty Stix”
😀
So…UVXY usually goes UP when the market is down…..market is down, UVXY is also down….what does that mean?
I don’t have UVXY…..
UVXY and the VIX are generally fear plays… Not sure that the market being down by this amount is cause for fear.. Maybe a few spikes here and there
Took TNA at the open as a starter. REALLY wishing I went heavier. IRA play not trading a acct. CF, hows this look now? Im thinking of adding heavy for the IRA
Looks good so far, stop below recent lows
entered 62.40 stop 59.50
Above the 10sma is good , and follow through seems encouraging too
Entered UA target 13 range
This was one of my absolute favorite stocks a couple years ago, It ran to $100, split , ran to $100 again – it was a beast.
I cannot believe the price that it fell to
Thus they say – Dont Marry A Stock
yea I like it… And I take back what I said last week to u and maria… Maybe retail isnt dead either. Looking at DKS…
GLD working on getting over that 50 MA.
And volume today already equals yesterdays complete selling amt of volume. Very strange
Watching Miners to see how they react
ADDED at $8.60 too, even though it is not the close yet.
DANGEROUS TRADE- MUST STAY FROSTY. It went down to $8.17 this a.m., then took off higher.
In the time it took me to buy this $8.60 & grab this chart , it ran to $8.75 in seconds. I have traded this in the past, it moves like greased lightning !
https://uploads.disquscdn.com/images/94019d5064efd17310372f0565e68c57eee19ab0585bb305bdaf5b1ed1e776a1.jpg
beautiful…
been sitting in quietRiot (4) of “3” for a while… target 14.70 orrrr poss 19.5 … for a 5th wave?
#dreamer
I have the same initial target of $14 ish
I love / hate this stock 🙂
orrrr hey now… if 5th = 1st …
https://www.tradingview.com/x/H7ewmoFd/
and .. I dont even see a 5ht of “3” really in that one… hmmm
Took tiny TNA this morning. Just added now. Fingers crossed.
APHQF just took off higher too …
Dropped to $6.35 and is now $7? Big swings in this one too.
EDC is flirting with breaking a double top dating back to mid-October.
Isn’t this usually when SOG comes on and says “m8oT” is doing a little summthin’ sumthing
lol.. i would if it was 🙂
until it breaks channel at 1.11.. its doin sweet f.a. (aka.. a li’l nuthin nuthin)
EAT moving up… Wish i held it lol
CF, SWN OAS, etc…. all up nicely.. Bounce or maybe somthing to it?
Yes- either 🙂
guess i shoulda asked… Is it a good time to add?
My answer ‘ Either’ meant that…..”yes, it could be a bounce – it could be something more.”
It is 50 / 50 at this point. If you want to add you can, but we cant tell if this is a bounce or something more, so stay alert & use a stop if you do. I’m not adding energy personally.
In the report I mentioned a possible a-b-c correction in OIL as a possibility, and this would be ‘b’ if that is the case.
Thanks as always. Added GM to the IRA as well
I SHOULDA HELD EAT.. man… lol its pulling a HOS right now
Yeah, or ENPH out of the consolidation, up higher daily
So JNUG time?
lmfao, Im glad youre here Peter. I was literally looking at JDST and JNUG on both screens right now
I took a beating on JDST, but got out and switched right over to JNUG. I’m ready to get whip sawed, but hopefully not. Alex, at what point does it confirm something to us? I see the dollar isn’t moving lower that much, stocks aren’t retreating, but we are above the 50 sma.
Well, the Gold parameter has been in the reports.
GDX & GDXJ are starting to move higher , so I wonder…did we start a new daily cycle & will move over the 10sma and then fail in a week? Or could a stealth ICL be in place ( Much less likely, but I dont count anything out under current world conditions, etc).
I look for a move over the 10sma as an important start, and I am seeing many miners start to move higher by 3% or more. In a false move, they often only bounce 1-2 , maybe 3 %.
GDX & GDXJ are over the 10sma, it kind of looks like a new daily cycle
It’s looking like they do want to go higher. I would say that one could “Take a stab’ at it just in case, but it hasnt confirmed anything at this point.
Of course, USE A STOP and be careful
It sure is unusual to seem such movement on option expiration day. Can’t wait to do weekend summary of all the indicators
What sort of geopolitical event is setting up this weekend, with oil and gold flying?
GDX & GDXJ moved above their 10sma, and volume is higher than the selling has been. It looks like we started a new daily cycle. Is is a 5th daily cycle down to an ICL… or some stealth ICL?
I am watching Gold at the $1308.40 area for clues.
fwiw, HUI is above it’s 10sma
the 10sma is resisting XAU
Maybe the close will tell the tale
GDXJ made a new low about 3 days ago, late in its daily cycle. I am wondering if that was a dcl, and we have a 5 daily cycle intermediate cycle into the ICL
BUT
GOLD or GLD has NOT broken the early October lows yet. Gold has been a lot more Bullish than Miners.
It is tricky this way.
Let us know when you figure it out! 🙂 If prices hold, I will do some light adding to my positions, including silver futures, FFMGF, MUX, SILJ and SVBL. Not sure about GSV as it´s lagging today.
still following that same pattern from 10-2-06 (weekly)
https://www.tradingview.com/x/Xk9NW2Mu/
Interesting, also silver is about to flip bullish on my monthly charts using a 2 and 5 month MA cross. Gold not too far behind, either.
This makes me think bull trap. https://uploads.disquscdn.com/images/1163ca382d88a7abbe212caf90a1481d2d6200373d39f72fdfd639cdaf8d113c.jpg
Unless it breaks, but thats a good chart for balance 🙂
Novo acts well under all conditions, although I thought it would POP when Gold did today. Does look good tho
This burst higher in Gold & Silver finally pushes SILVER through the 50 & 200sma resistance area.
It did do that in October too, and then rolled over, but it does seem like a little sign of strength this late in the game.
SLV slicing through it´s 50 and 200 day MA´s to the upside.
TWTR Finally! Making a move
One of our readers (Thx Chuck ) emailed me that NVAX has over 40,000 shorts, and is breaking out.
The chart does look good. ( check out a 6 month chart)
I take it CF wouldn´t be get too excited even if this turned out to be a 5th daily cycle, being they later a daily cycle occurs in an intermediate cycle, the weaker it should be?
That would be true Ralph, in the same way that a 4th daily cycle should be L.T. and ‘peak’ early, a 5th would too.
HOWEVER, I must say that there are also other bullish things that are happening here too, that continues to just muddy the water.
Gold never broke the early Oct lows , for example. GDX &GDJ broke down & made much lower lows, Gold & SIlver are holding up just fine. A few other things are keeping GOLD & SILVER looking more bullish, and Miners as the ones that lead the way lower.
Even in todays report, I noted on that GDX chart that using T/A ( technical analysis) GDX actually has a short term bullish look to it. It is not a clear easy read, but using cycles- we would not expect Gold to break above 1308.40, and Miners day 6 highs should also not be taken out without an ICL in place first.
What about a quick trade, like a 5 day trade? It would be risky if this was a 5th daily cycle in Miners, but some ‘traders’ may view risk as not a big deal.
Alex,
don’t you think that this one it is still a 4th DC and maybe there is about a week of rising prices maybe challenging the 1308 and then collapsing down into the ICL, just about the FOMC meeting?
Only for Gold, that is what I have been saying – Gold is holding up better, did not take out early Oct lows, etc etc etc , but I would not say the same for Miners-
GDX broke lows of early Oct, and broke the lows again, then broke back above the 10sma, closed back above it again.
MBOT does look a tad bullish short term to me 🙂
It may want to run to the 50sma
its moving
dammit.. you stole my thunder.
Maybe when you bring it up, you jinx it, when I do- it follows through? : – )
I gave you the opportunity below to give it a shout out when it was only up 2 cents, but crossing the 10sma, but you poo poohed it
ok ,, you take over the m80t cheerleading 🙂
so long as it goes in the right direction, all is well
Man, I was just looking at a 6 month weekly, and this looks perfectly fine. I think its all about timing, but when it goes it really should go – I hope 😉
did u say cheerleader?
*smirk
you disappoint me… was expecting a Mama cheerleader emoji at the bottom of that post
;O) well .. ive posted it enuf so i just *figured ud get the imageMemoryFlash 😉
i did,.. but i’m just a purist, and always appreciate the genuine article 🙂
ha! well.. since u made such an excellent case….
https://uploads.disquscdn.com/images/6a131c86305ac336ad06122622416dc584b161119021f8ef2fc3fa042e593339.jpg
*that was before the madness ensued ….
https://uploads.disquscdn.com/images/6f0e2e41a6ae89018b8153623520984862507c3806ac3712d19cdf6acd868d6d.jpg
https://uploads.disquscdn.com/images/5e759abaeea0d6f15c98c7fb86f73168c4b6379ecc57381cdecf7f4d1f0a7e76.jpg
LoL.. such a privilege to see the *real deal*..
buttttttttttt …. where are the pom poms?
u r a dirty old man
*use ur imagination
i’ll make do with these
https://uploads.disquscdn.com/images/855f3a78b06db32600877594512a17445dc9fe7b8a5baadb7c60a6b2ee828f7b.jpg
EKSO also been very nice and OWCP .. pop pop pop ….
Mama, I know its friday so get back to me when u can… but wth is ESKO? things a mover
https://uploads.disquscdn.com/images/1ca43f4557a0bdd153f6503ac36e28f2c202df85f5810aa9841a1eee7b88b419.png
NGVC …
if this can slip the leash.. got an initial target of around 2.20, then the 200sma (near 3.00)
just do it!
CF, what u think about SNAP here… I know I said i wouldnt touch it again after my earnings hit but…
I’m not impressed
And check out RIOT 🙂
Exactly what I mean- what did that do today? $8.11 lows, up to $9.20 highs, now back to $8.32 – Yeah, its a fun ride – lol
weeeeeeeeee
SRRA broke oit again too, I am seeing some action on the smaller Bios again.
TGT intra day chart, missed this move. ALmost too easy too… oh well, next one
You’re hunting retail now, that’ll make Maria proud 🙂
She got me looking into it alot more… I stared watching the XRT retail ETF
she’s a crazy one…. jus sayn;.. 😉
GPS ( Is that the GAP store?).
KSS actually looks like a good set up too ( Kohls)
lol Yes.. i saw that this morning… on the % gainers list this am… too funny
xmas?
it looks good .. right? lol
Brought myself up to 33% invested in miners, hope we get that December pullback to load up, but like that we probably only have 15% to 20% downside compared to 100%+ upside. I can ride what I have down to a Dec low, should it occur.
And I’m hoping that some of these Miners have more than 100% 🙂
Have a good weekend
me too!
I’m not buying yet, but am starting to plan for the ICL and get excited.
have a good weekend all :o)
headin out to blow up some targets b4 it gets dark ……………..
Have a good one, Annie Oakley
Have a good weekend everyone.
U2 Nancy!
OUR WEEKEND REPORT HAS BEEN RELEASED. GRAB A COFFEE OR TEA AND READ IT TWICE 🙂