11-11-17 WEEKEND WRAP UP
This weekend we’ll discuss how the markets behaved last week, and at the end of the report, I want to also touch on daily cycle strength. Visuals may help things to stick in our minds 
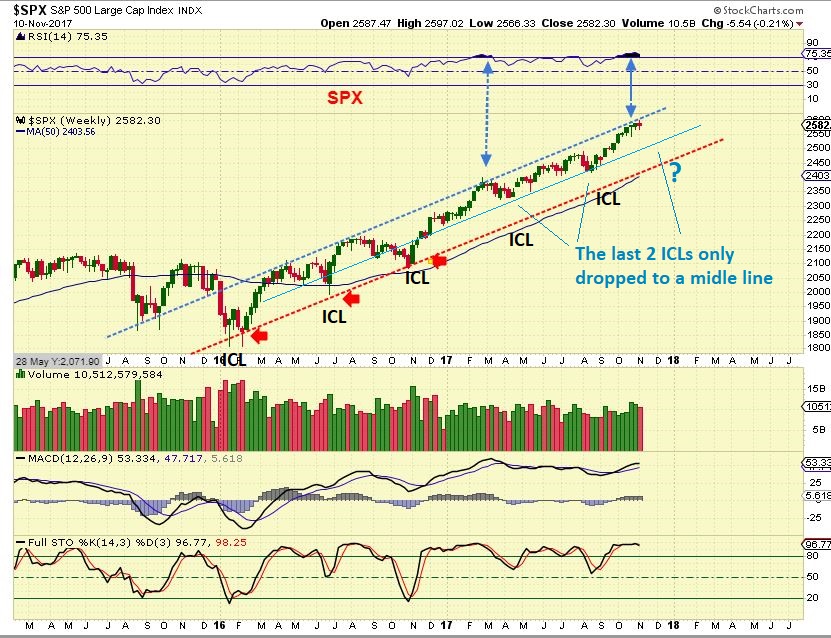
SPX – When looking at past ICLs ( deeper meaningful lows), we can see that the dips have not been as deep as they used to be. This is showing the markets strength over the past year. I now can draw a middle line as recent support. Please excuse the type on the chart 🙂 We do look due for a dip down sooner than later though, don’t we?
NOTE: I have covered the big picture and what I see happening with the markets in detail quite often. At this point, I just want to be a bit more brief in the weekend reports as a review, and continue to allow my daily reports to constantly update and cover things as they play out day to day.
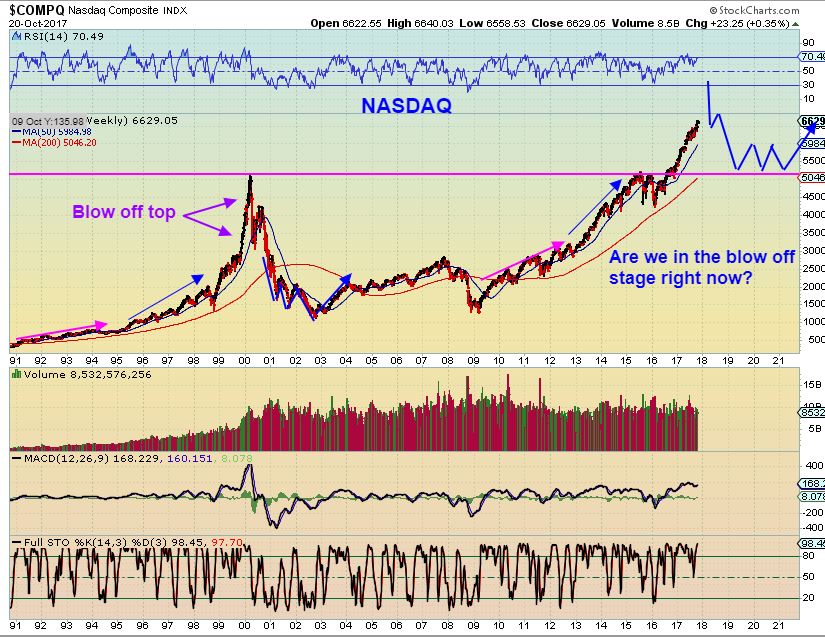
NASDAQ – I’ve discussed the seemingly parabolic move in the general markets because those dips have been more and more shallow. Using a longer time frame we can see that the NASDAQ has been running in a steep manner, but this gave me a different perspective. The strong run in 2013-2015 almost looks steeper than the recent one, doesn’t it? We saw a solid 2+ year run and then a long difficult correction came about in 2015. This recent run has been 2 years from the lower channel too.
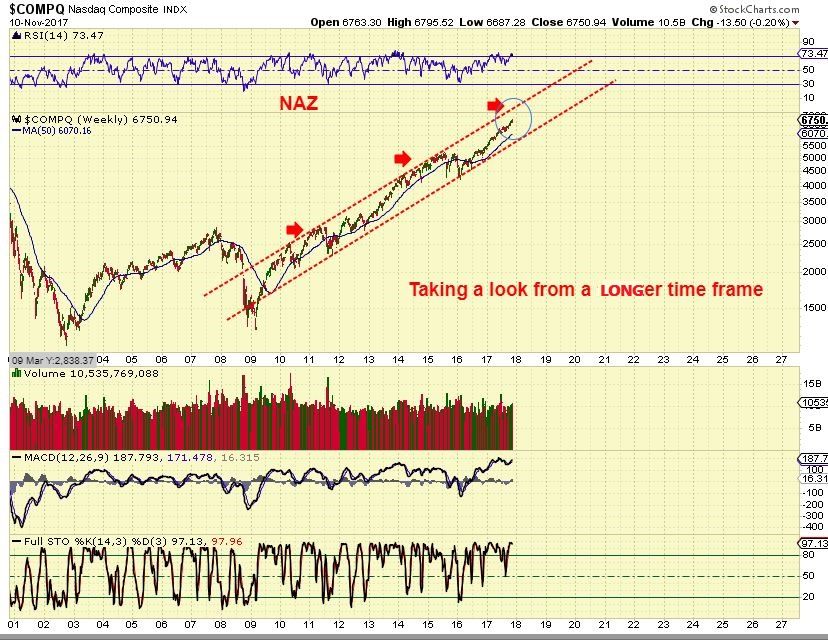
A giant NASDAQ wedge from THE LOWS of 2002 looks to have broken upside and that just seems very bullish- breaking that 14 year overhead trend line.

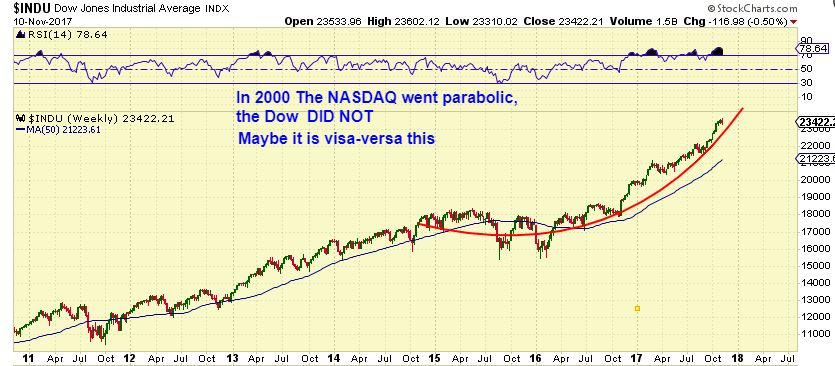
DJIA – The slope of the Dow recently has been getting steeper. This does look like it wanted to run in a parablic manner. Please see the chart.
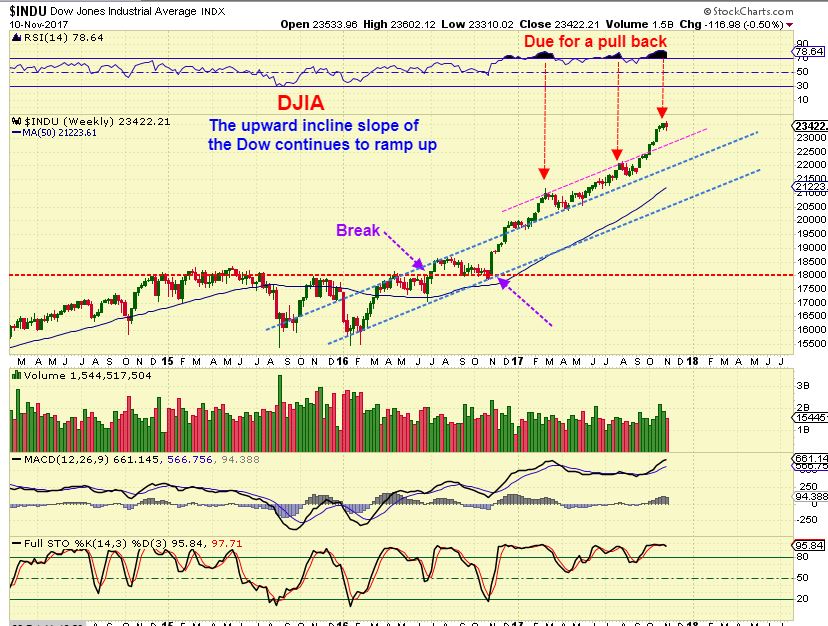
DJIA – Just a thought, please read the chart. The NASDAQ is inside of that long running channel, but the Dow does seem to be curling higher recently. Whatever the Big Picture case turns out to be, these are very bullish markets and the buy the dip – trailing stops crowd has been active.
DJIA – So I wanted to point out that a couple of years ago, I kept pointing out the rising wedge and calling for a big dip or correction. We did get a big enough dip to reset sentiment and turn the run into a wider channel. I will show that next, please read this chart first…
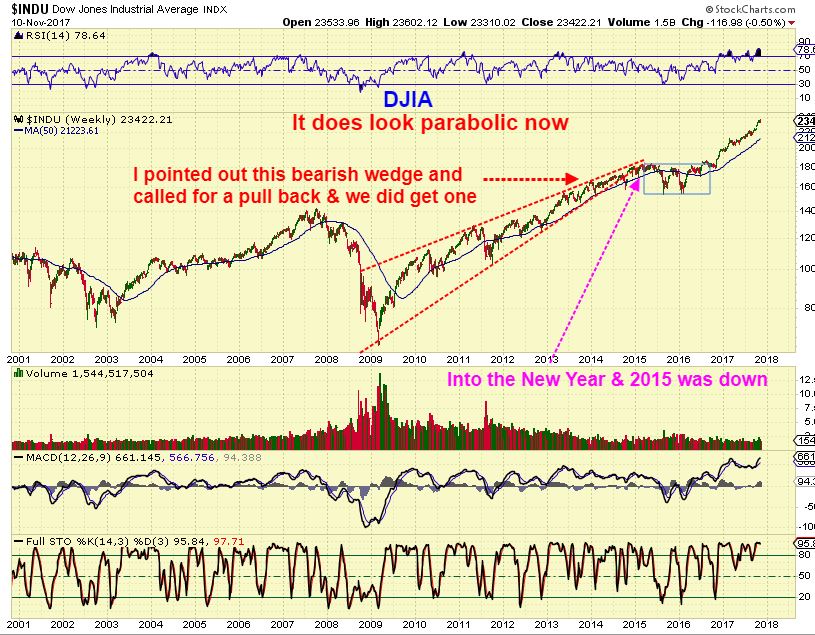
DJIA – With that dip, sentiment turned bearish, and off the markets went again, higher. I am now seeing an even bigger wedge, but it has plenty of room to the apex longer term. NOW the DOW ramp up doesn’t look as parabolic either, just extremely bullish and it has reached a topping area. See the RSI too.
On the ABOVE chart, a push through the upper trend line & Ramp up would probably be a parabolic run. For now, we just keep stepping back and looking at the Big Picture each week and see what the markets are telling us. Like I said, parabolic or just a strong steep run, it is a very bullish run.
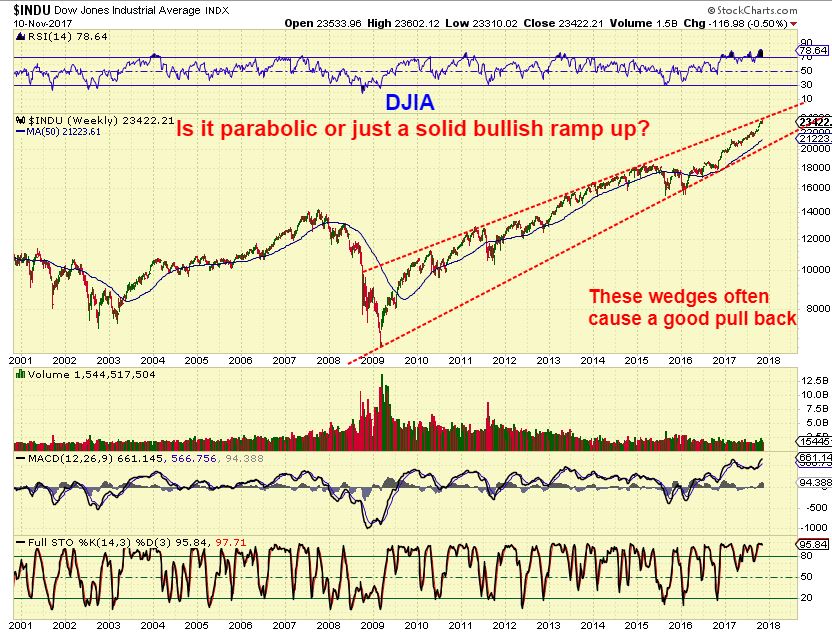
DJIA – A pull back at the upper line could just continue to readjust sentiment and keep the bull alive. We are 9 years into the bull run out of the 2009 lows.
OCT 20 – This was my chart showing that this ramp up could end in a normal back test too, and continue higher. Does it have to happen? No, but it is normal market action, so I’d keep it in mind. That would involve a large sell off and consolidation period though.
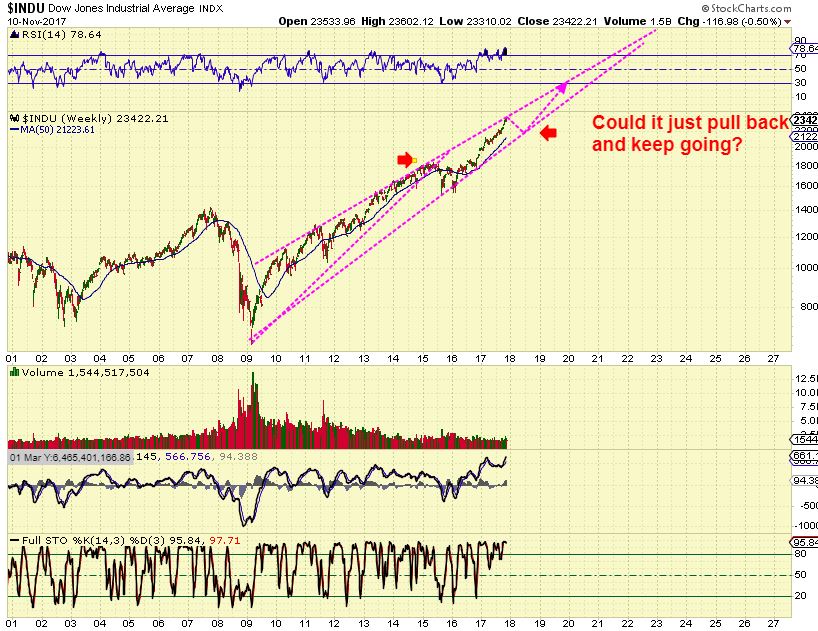
AGAIN, The general markets are bullish until they aren’t and it may be best to just continue to monitor them mostly in the short and medium term, and avoid any longer term bias. Buy the dips and use a trailing stop, use cycles to try to time the bigger dips ( which do not seem to be happening as much these days). 🙂
.
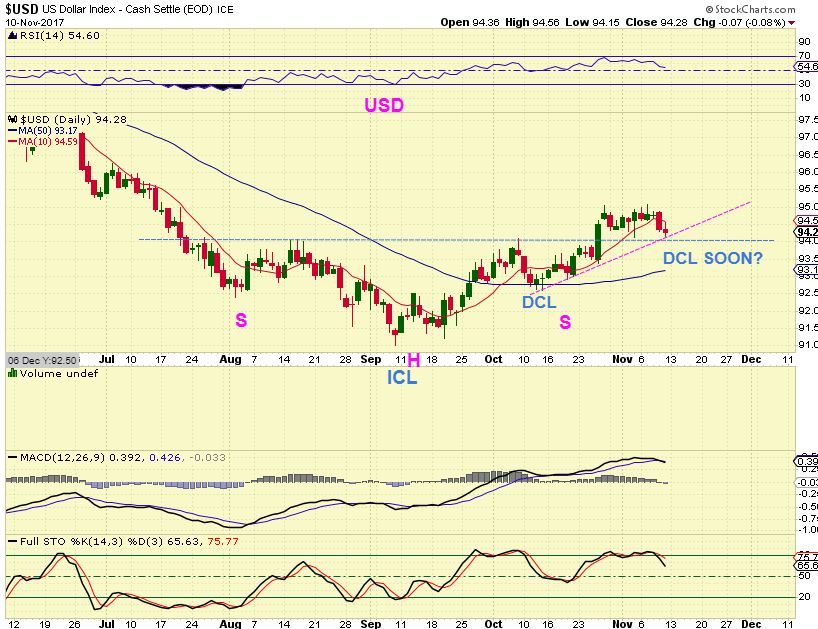
USD – Out of the ICL, the USD put in a R.Translated 1st daily cycle, as expected. The 2nd daily cycle peaked recently, likely another R.T. daily cycle. I have still expected at least a run to the 97 area in the 3rd daily cycle.
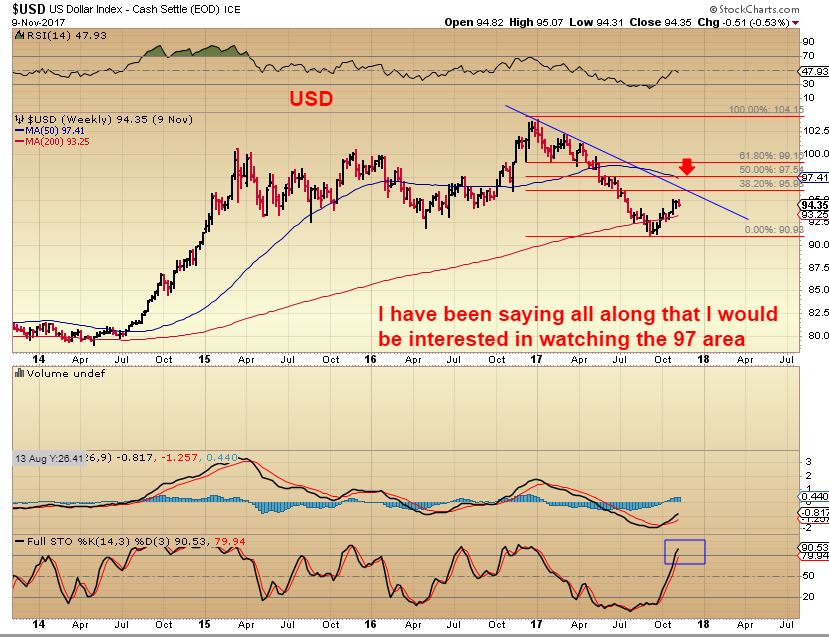
USD WEEKLY – 97.50 is the 50% off of the lows, but the trend line is at 38.2% around 96, so if we do not get to the 97 area, it may be that time ran out. I would like to see a final run higher and gold drop into a final run lower. THEN an ICL for Gold, and an intermediate Cycle peak for the dollar. If the USD doesn’t hit 97, I will not cry about it, I will rejoice for the rally that should come out of the miners. 🙂 The Weekly USD is getting into the overbought area.
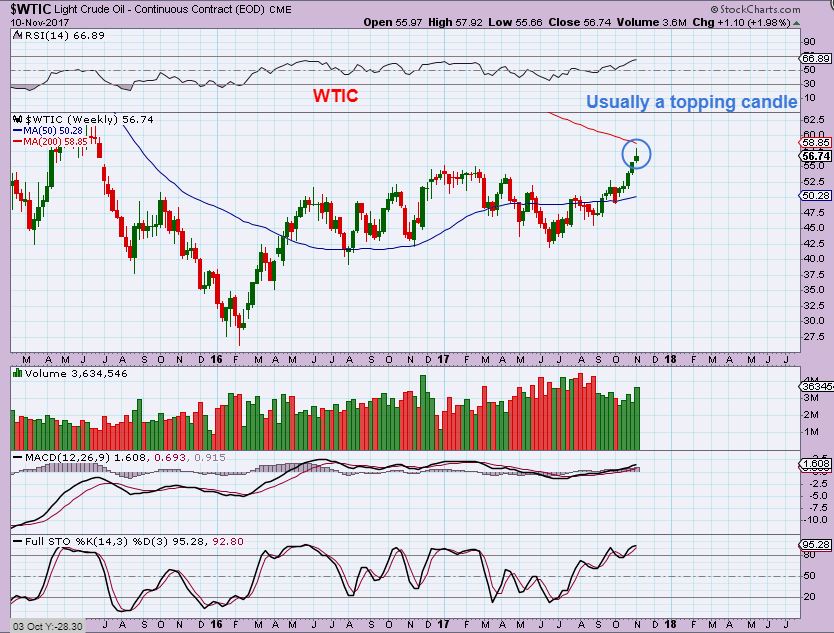
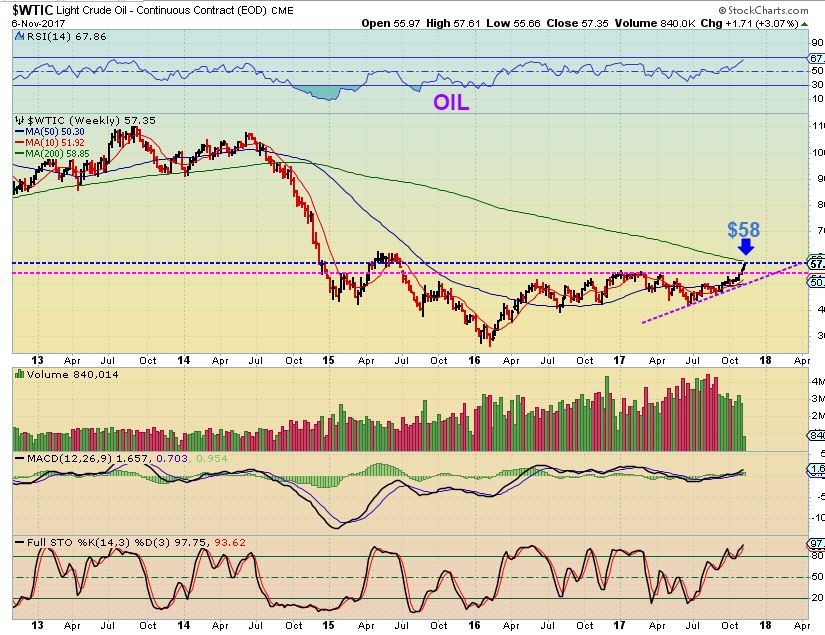
WTIC WEEKLY – Oil is at resistance and this is often a topping type of candle, however we have also seen sideways consolidations and ‘crawling’ along resistance in bullish conditions. Oil & Energy stocks have been bullish.
WTIC – This was chart from last week showing my thoughts on Oil. Maybe a drop to the Magenta line or Purple line for a back test?
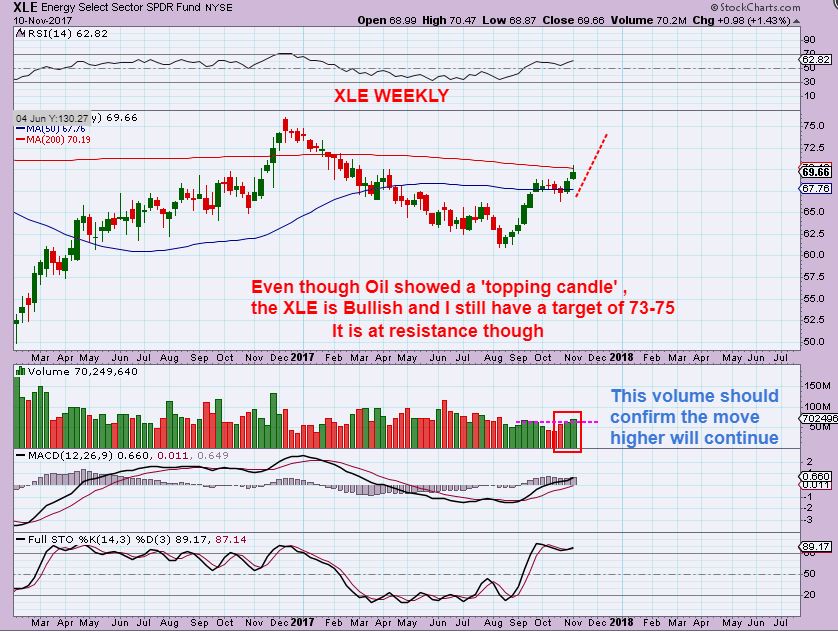
XLE – This could consolidate, but I have a target of 73-75 and I seriously doubt that it will not get filled. I still own my energy stocks that I bought a couple of weeks ago.
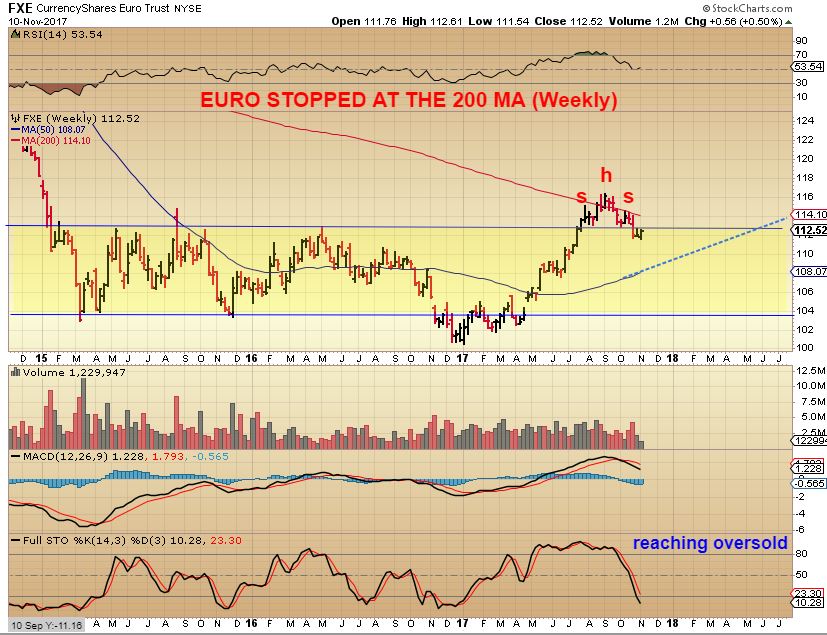
FXE – Using the ‘USD moving higher idea’ and assuming that the EURO & GOLD would be moving lower, this FXE chart representing the Euro would have me thinking that it could drop to the 50sma.
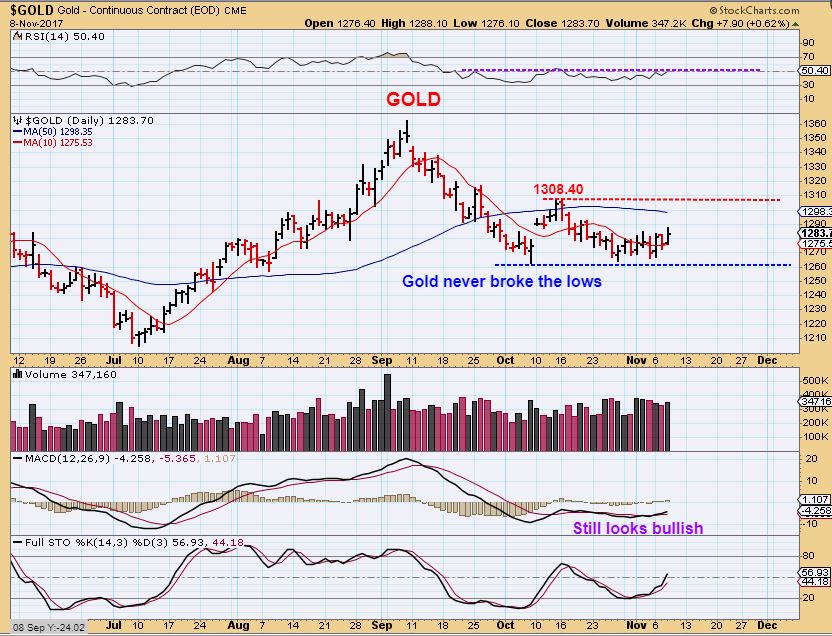
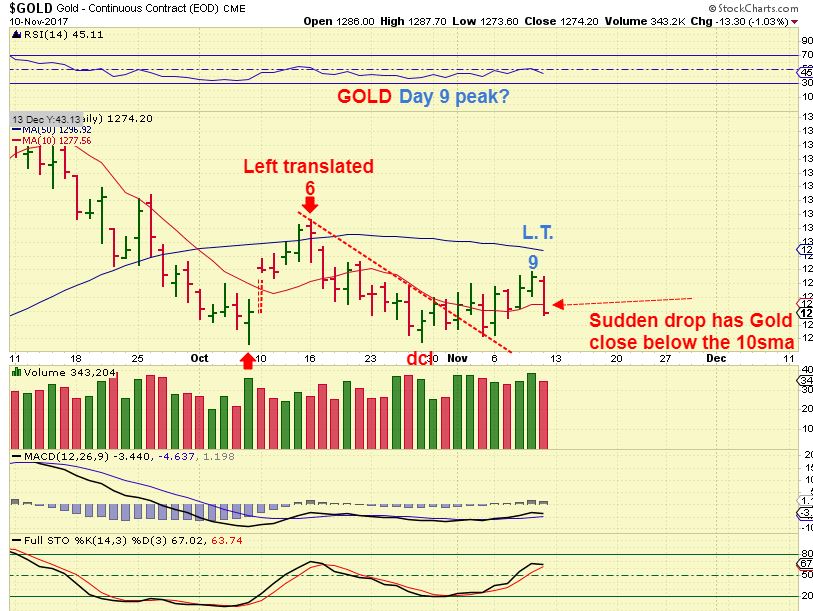
GOLD – Gold had been perplexing, because I have repeatedly mentioned in my reports that GOLD is Bullish looking, has not broken below Oct lows, and just keeps holding up. Each morning, it seemed to be up $8, but Miners did not rally. This was my Nov 8 chart , and I said that as bullish as Gold looked, it should NOT get above 1308.40. I expect a drop into an ICL soon, maybe the 50sma would hold Gold back.
GOLD – Out of nowhere and with no news, Gold just slammed down $10 midday Friday.
GOLD – NOW with that sharp sudden drop to 1274, things look to be lining up exactly as we expected. Gold closed below the 10sma, and the selling could pick up soon.
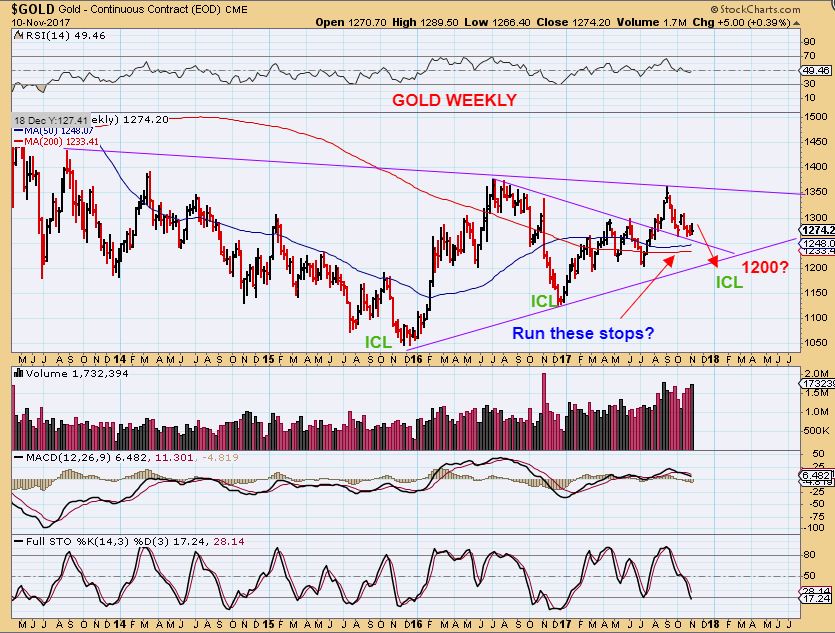
GOLD WEEKLY expectations (Roughly) with another ICL ahead-
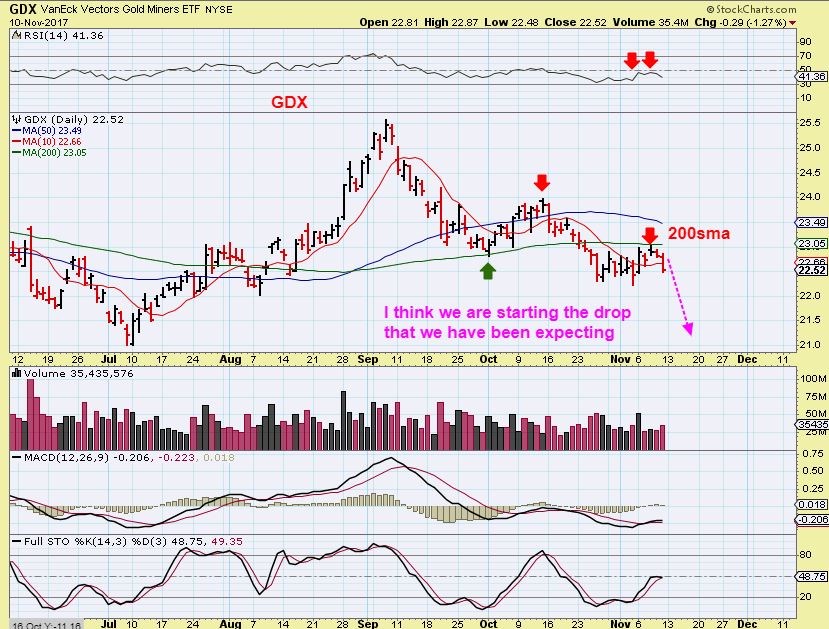
GDX – The 200sma rejected GDX again and it also closed below the 10sma. You will be glad that we were not buying miners yet, because they should go on sale very shortly 
GDXJ – GDXJ closed below the 10sma and has a day 8 peak (weak). THIS is why we did not buy miners, this looks ready to sell off. I almost bought JDST OR DUST just for a quick trade, but I own a few other stocks in ENergy and Med Marijuana that are enough for me right now.
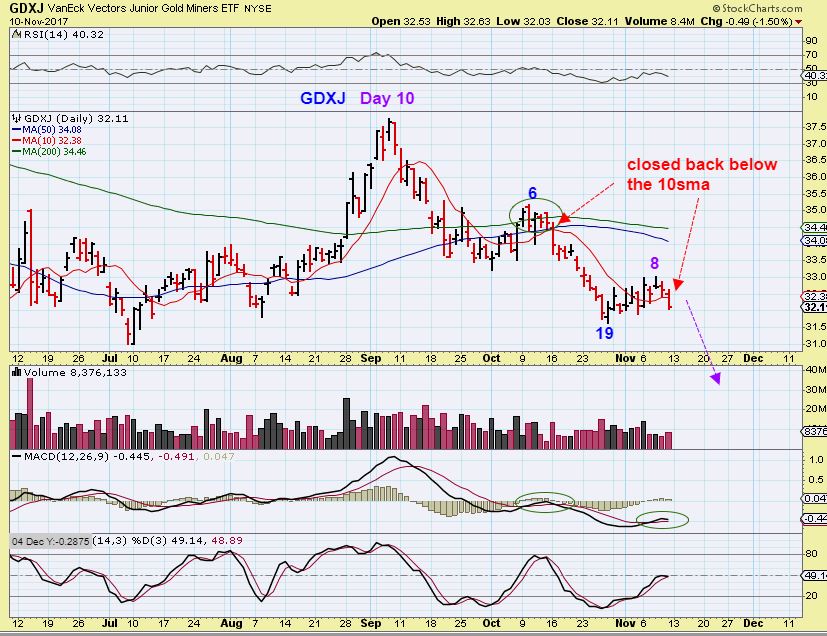
GDXJ WEEKLY #1 – Held down
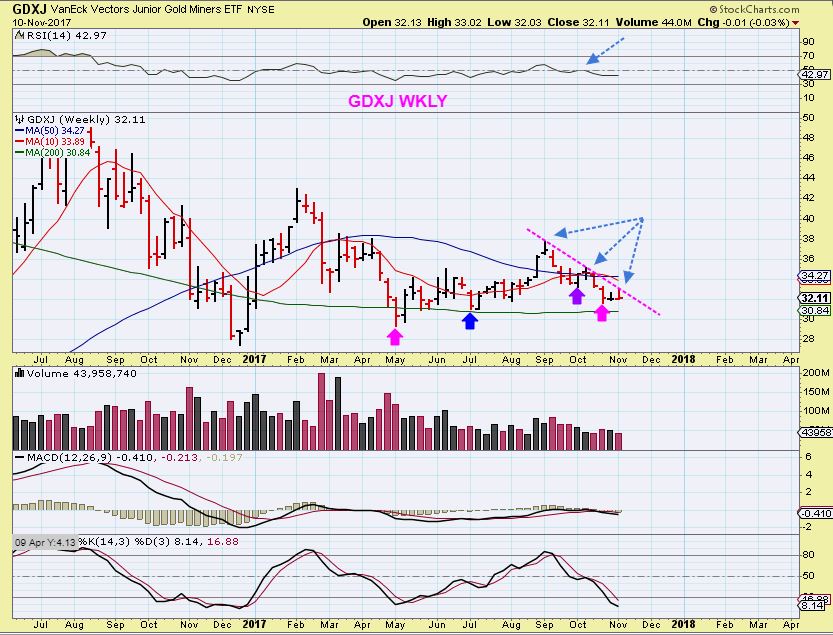
GDXJ WEEKLY EXPECTATION (Roughly) – Please read the chart.
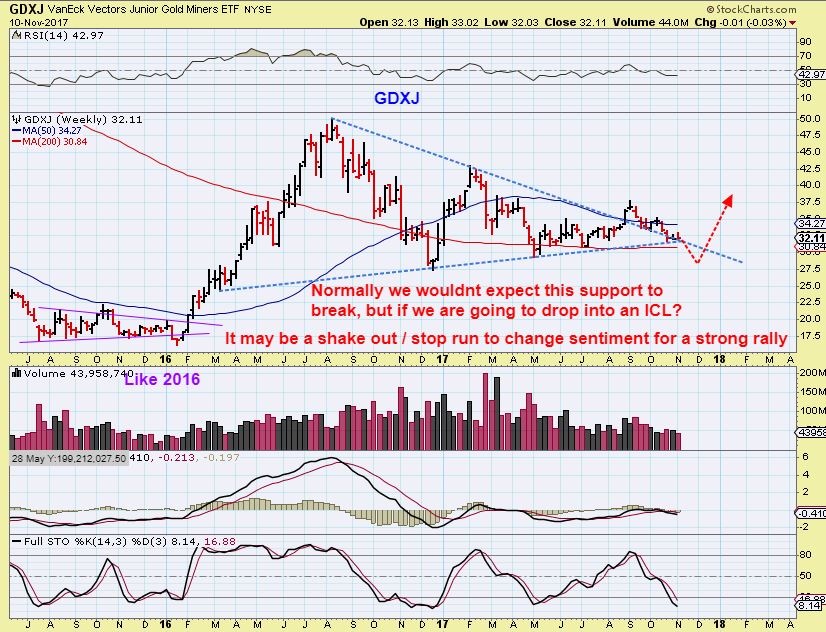
I AM GOING TO DISCUSS IN A FUTURE REPORT WHAT COULD HAPPEN IN AN ICL SELL OFF AND IT WILL INCLUDE A FEW CHARTS LIKE THIS ONE. THE DIE HARD GOLD BULLS MIGHT GET HURT IN THIS ONE IF THE BIG BOYS RUN THE STOPS, AND I THINK THAT THEY JUST MIGHT DO THAT – Stay unbiased.
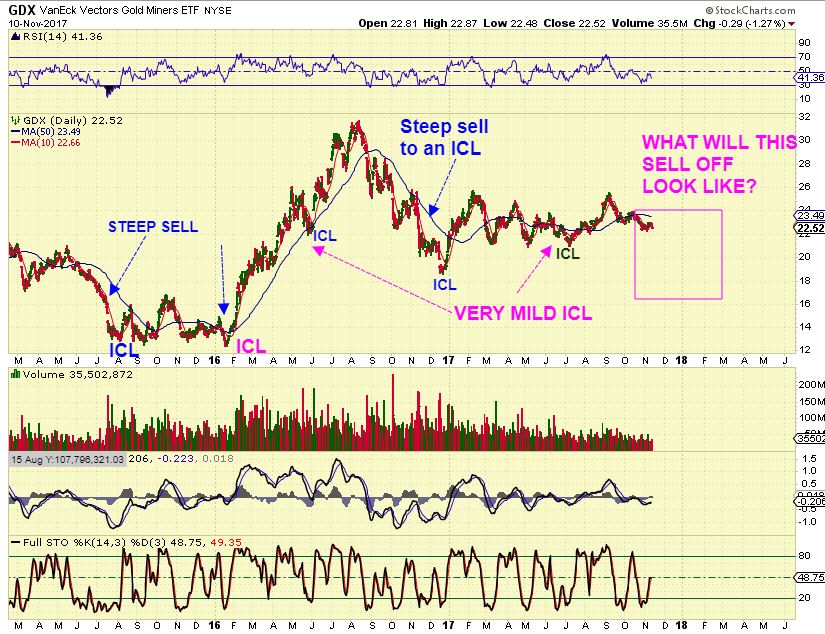
So for the precious metals sector, I expect selling. I am not discussing ‘targets’ because there are various factors that could affect the type of selling that we get. Going into an ICL, it should be pretty good sell off, but I will say this: It looks due to bottom around the Dec FED meeting, but it might even bottom a tad early this time. I am keeping an eye on it day to day, and my daily reports will keep us adjusted along the way. It will be interesting to see how the recent stronger Miners hold up ( NSRPF, FNV, EGI, etc). IAG popped on earnings Wednesday, but has already sold back down Thursday & Friday for an attempted gap fill. Let’s see how these hold up, and see what happens to the ones that I pointed out as getting crushed lately like HL & EGO. How low will they go, or will they bottom first? SO much to look for and look forward to.
Precious Metals ICLs are my favorite time of year, the profits and gains are usually exceptional. Especially when various charts can be identified as being set up for really quick gains, the trading ‘day to day’ can be exceptional too! Have a great weekend and Thanks for being here at Chartfreak!
~ALEX
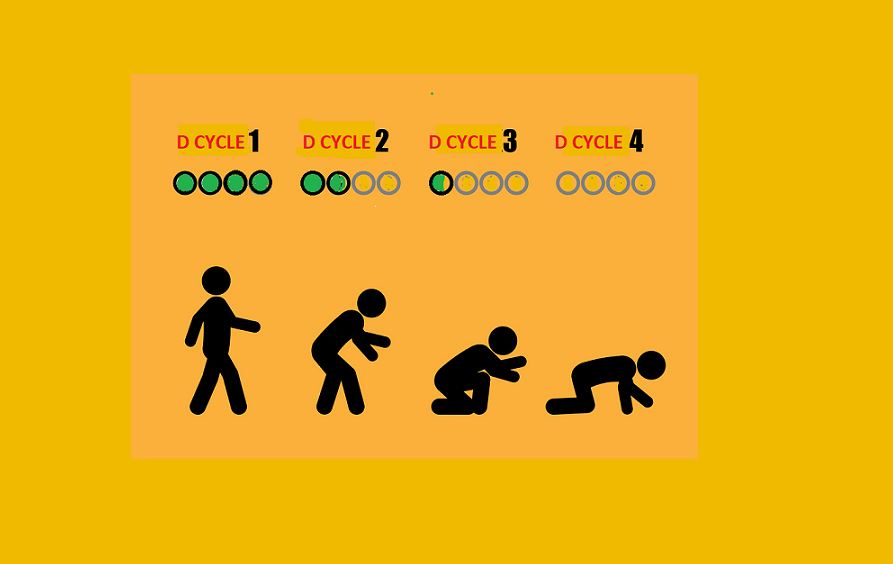
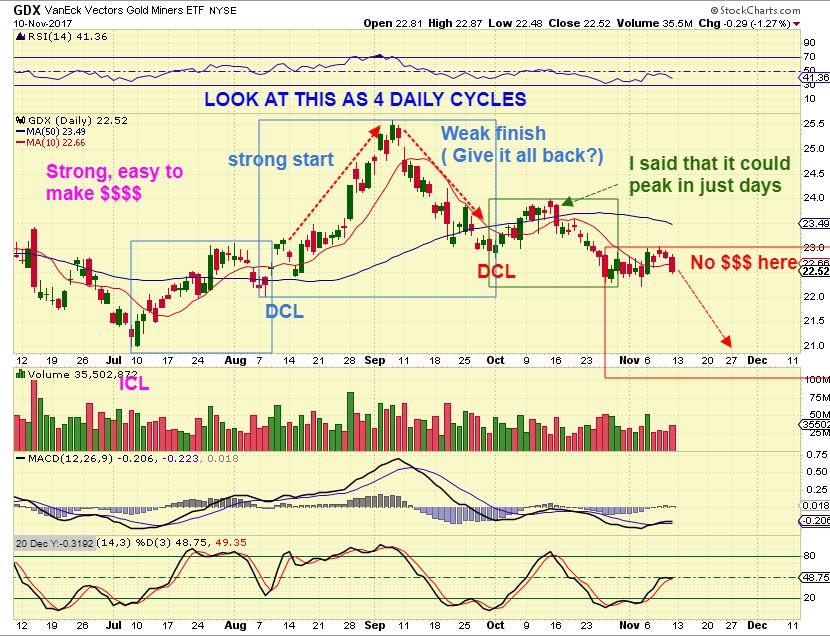
How I view Gold or Miners during daily cycles
DAILY CYCLES are often strong out of the gate (ICL) and then they become more and more difficult to make money at. I view it this way with 4 daily cycles, and I will show you it on a chart too. Green circles are the easy money, empty circles are when the trades look good at first, but they are weak and some end up giving back a lot of the gains as the cycles roll over. …
Here it is on an actual chart. The first 2 daily cycles I use leverage and this is the easy money, because they often just want to go higher. They are strong, and buyers keep stepping in. The last 2 daily cycles, 3&4, often ‘peak ‘ within 10 days, and many traders that stick around still trying to keep making good trades in miners, will give some of their recent gains back. Sadly, many will keep buying JNUG or NUGT late in the daily cycle, because they did SO GOOD last month with it, and they give all their gains back.  You can see why buying jnug after day 10 hurts those traders in the 3rd or 4th daily cycle on this chart as a visual. THIS is why I DID NOT recommend Miners during the apparent recent strength in Gold, especially in a leveraged etf.


Terrific Alex especially that chart showing the box where GDX potential low may lie. Hoping for a big move down to take out that December low. Thanks again.
Yes, before we were thinking $21 might be the low, now it could be $16 on GDX, and soon!
Ralph / Alex
I don’t understand the expectation for GDX to drop to $16. And what would be the implications of dropping below Dec 16 lows – would that mean we are still in a bear market?
I don’t believe that I ever said those numbers in any reports, $21 or $16
On the other part- If the Dec lows were broken, it could still be a Bull Market. Market makers always seem to need to break important lows to be able to buy ( Load up) in bulk. The lows of Dec would be a double bottom type set up with a slight undercut ( I have pointed that out in the reports as having happened in the past bull markets too). & shakes all the emotional gold bulls out
I appreciate the reply Alex. 21 and 16 were mentioned in Ralph’s email with an up-tick from you. I was confused … thank you for the clarification.
I thought it was a ‘like’ button, 🙂 and I do not disagree completely – it is possible. So We could take those lows out and I do plan on covering it in a future report with charts to back the ‘stop run idea’ up.
Thanks Mark, and yes – I believe that the big boys can easily try to run all the stops and collect all that they can at the lows, and running the July & Dec lows could be a common way to do that. If they want to buy big, they have to do i when people are unloading big.
Thank you, Alex! Very insightful and nice look at the markets with different lenses.
For us amateurs, please let me know if you have a recommendation for a trailing stop % (SOXL, TQQQ, UDOW, TECL) that prevents a draw down but doesn’t have us potentially selling at a low.
I’m using 1.5% right now, which is roughly the low from last week.
Thanks,
Peter
Well, you are talking about a 3x etf in SOXL that just went up 1.9% Friday, so I would imagine that it could drop as much?
I cant look at the charts right now, I’m on my way out, but the recent sell off low may be good. I know that it’s tough because the normal selling isnt the problem, it is the big 1 or 2 day sell offs that often take people ou of triple leveraged etfs- because they move very sharply. I use mental stops on my triple leverage, and the timing is important. Like I wrote on the Precious Metals section, I dont use leverage late in a daily cycle for that reason, especially a 4th daily cycle – but this Bull in General markets is so strong that they are very right translated and it has been where the money is made too.
Okay, thanks. I wasn’t sure if there was a moving average, cycle count, sentiment indicator, etc. that would avoid me having to stop out that low.
I usually use the moving averages in the underlying trade ( like SPX instead of UPRO, QQQ instead of TQQQ) but lately they have been running those stops too. Even the loose stops are getting snapped up, so it is tricky.
They never seem to make riding a bull as easy as it used to be 🙁 The saying “Get back on the horse’ seems to apply more now, as long as it is not late in the cycle count and dude for continued drift lower into a dcl or ICL.).
Okay, I’m glad it is in fact tricky, and my confusion is somewhat justified. The cycle count is really what has me on edge at the moment. Was the low at the end of October an HCL, in which case we are way due for a DCL. Or, was the end of October a DCL, in which case we’re fine.
Timing wise it seemed like a shallow dcl ( there have been some shallow pull backs lately), but if the lows were broken and it dropped to the 50sma, THAT would look like the double dip lows in August. Thtat is what makes it tricky too.
I am talking about the SPX chart, the SOX chart has been really strong & isn’t really making pronounced dips. That is how Semis are on the way higher.
Great report Alex – and good visual with those guys crawling on their faces in the 3rd and 4th cycle.
I know we talked about Biotechs possibly going into an ICL last week, but is it possible that they have now bottomed with that doji on Thursday and weak action on Friday?
Also Metals and Minerals seem to have a lot of indecision and bottoming on Thur / Fri. The Worden group which is ix1110 has 51 stocks in it and only 2 of them were down more than .4% on Friday. Is it likely this group will move lower with the PM’s, or can they move on their own?
The other area that caught my eye was the Russell crawling along on the 50.
Hey Ron, I should have included that in my weekend report really, especially since we talked about it. Yes, it is possible that buyers may step in, I lost track of cycle count & would need to go back, but XBI back above the 10sma would be a start, and back above the 50sma is also a good sign of confirmation.
One could try an entry with a tighter stop below recent lows, and if it progresses higher, that would be catching a recent low.
My problem with the chart was that the MACD is not crossing back up and the stochastichs ( Full Sto) is not oversold and could drop further, so I was questioning it . That trend line that I had drawn did break too- so another day or two will likely reveal the biotech direction.
Hope that helps a bit, but it is still a tad uncertain. Yes, the doji COULD become a reversal area or this could still be a bear flag pause.
Copper looks OK so far at the 50sma, Steel itself looks ‘iffy’
Wow…I learned quite a bit from this report, Alex…The graphics are very helpful. Now hopefully I can implement what I just learned. That is a key to being successful.
Hey Kenny
A visual is always in my own mind, I just wanted to help the readers see ‘WHY” I trade the way I do. I will see people looking at a Miner set up in the 4th daily cycle on day 5 , and they’ll say, ” I Bought JNUG today, XXX looks good” – And I feel like I already know how that will end, but I don’t want to post publicly against it- I put it in a report that night and I just hope there is a stop in place.
People ask me often, “Do you use leverage when trading the Miners?”, and the answer is that it does have its time & Place, I use it in the first 2 daily cycles a lot , but it is far more dangerous ( or at least likely to lose) in the later daily cycles.
SOME INTERMEDIATE CYCLES DO HAVE 5 DAILY CYCLES, and the 3rd may do fine, but then the 5th is a killer.
I should have added a 5th 🙂
EKSO…broke out Friday….up another 40% in Monday’s pre market…just sayin 🙂
Thanks Alex! Another great report!!
Thx H50
UUUU merging with Excalibur Industries. Will cost them 3.5 million.
USUALLY the company that is buying takes an initial hit & the one being bought goes higher, but it depends on the merger & I didnt see any activity pre market
Volume is usually pretty pathetic so there rarely is activity…LOL… I was just hoping.
Alex, what’s your target on ORGMF?
I don’t have “a target’ for AGRMF- but couldnt it run to $4 or $5 in a heart beat?
Look at MYMMF – Look at TWMJF, Look at MEDFF – look at those charts. Crazy.
My target for MYMMF was 60 cents, then 72 cents, but I didnt sell because the move became really strong & the entire sector has too ( Canadian ones)
When they break out, buyers pile in and they usually just take off. Targets become guess work, I just sold 1/2 of my MYMMF at $1.oo because it cant go higher forever, but I’m holding the other 1/2 in case it just keeps running for now.
Good morning to all. I´m just biding my time, waiting for the usual end of year miner smashing so I can do some buying.
MYMMF – It was VERY hard to sell part of my MYMMF. When price gets this crazy, you have to set a limit price near the bid and hope it triggers. This can keep running higher, but it just ran from 40 cents to $1.00+ – so I wanted to lock in some gains finally.
I still own APHQF & OGRMF
Hi Alex – are either of those in good shape to add or should we hold and wait for a better opp?
They are about to break out now or are in the process of breaking out. I added to OGRMF last Week. ( MYMMF just hot $1.25! Up 60% for the day alone). When these break out, they do run strongly
I was going to buy ACBFF last week but didn’t…..sheesh, now look at it….
New report TAMMY – I like SPRWF – Buy the less extended ones.
I still like OGRMF too
Ya, thanks…I had just bought SPRWF before you mentioned it, so glad you reinforced that thought! I was looking at it also last week and didn’t get in, so decided I better jump now….:)
Playing it safe and sold my recent AG, MUX, and BTG buys at about break even. Great report Alex!
not in it this time round, but NAKky looks good
NAKis doing its thing once again
THIS IS A BREAK OUT JUST SRARTING IN MY OPINION – NOW LOOK UP MYMMF and see what that break out did.
I ADDED TO MYMMF last week, and posted that here- I like the set up , at least for a quick trade
https://uploads.disquscdn.com/images/bb69cb6046c4ec2857b39560f8359ee0fba2ff0e0dde224d890b712940ccba22.jpg
Hi Alex, bought CHK a couple days ago. I’m up a little bit but maybe oil is at resistance? Do you typically get out of energy stocks like CHK when oil seems to be rolling over? I know Friday (I think) you said could buy CHK on back test of trendline. Any updates based on how it’s moving today? Thanks! *bort*
I tend to view CHK as NATGAS.
I may lighten up if I think OIL is at resistance. At this point, I am thinking that OIL MIGHT BE Doing a bull flag too, so I am still holding most of my energy trades too.
Hoep that helps
Yes. Thanks!
NFLX up 3.50 from swing entry.
5.00+ now
HL coming down to kiss it´s 200 week MA, silver stocks weak with silver higher!
http://stockcharts.com/h-sc/ui?s=HL&p=W&yr=5&mn=0&dy=0&id=p42766772320
A NEW REPORT FOR ‘TRADERS’ REPORT HAS BEEN POSTED
A NEW REPORT FOR TRADERS WAS POSTED 🙂
Alex, have you still got ToMuchNak? What`ch think`en ? Do you have a price target in mind to lighten up/get out at. It crashed the BB`s again and last I looked was@$2:28 Columbus took a chance and I’m with him. Although I’m knee deep in the stock, I think I’ll contiue to hold untill news breaks( greed) . You?
Footnote; Columbus started with 4 ships arrived with only 3.
LABU is either an amazing buy right now (near the double bottom) or LABD is about to breakout..
Potentially climbing out of the double bottom now?
I got stopped out today so I’ll be staying away from LABU for a bit until I see a clear uptrend emerge again.
LABU is my best friend and worst enemy.
Hi Alex – reading you weekend report had me thinking it’s a great time to enter a gold short trade. Is there a good target to wait for to enter? Or does now seem good enough?
If it bounced that would be better, but I expect that this daily cycle would top by now, and the 10sma may be holding it down now- so if that is true – the top would be in place already & it should be a good place to try a short. It should just be a mater of waiting for the drop to play out.
Awesome, thanks.
I grabbed a starter JDST on Friday’s breakdown, looking to add on any bounce.
HK looks ready to break out
good stuff.. almost sold this one last friday
KLDX getting pounded, again.