
October 25 – Are We Rolling Over?
Are the markets starting to roll over? If so, will it be a deep dip, a ‘Buy the dip”, or is this just another ‘one day sell off and recovery’? Let’s take a look at the charts and see what we can take note of…
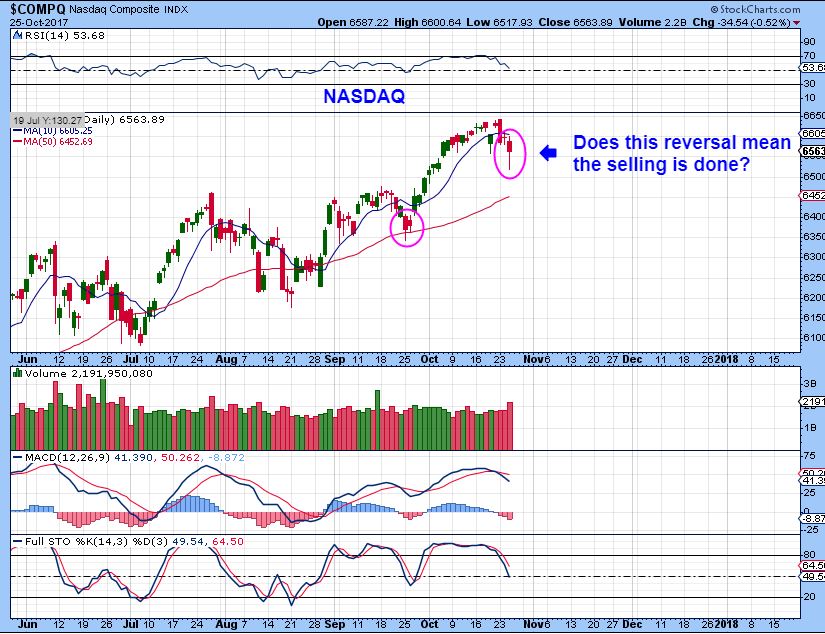
NASDAQ – So here we see that the NASDAQ sold off yesterday, but by the end of the day, some buying came in and gave us a reversal candle. Does this mean that onward and upward we go?
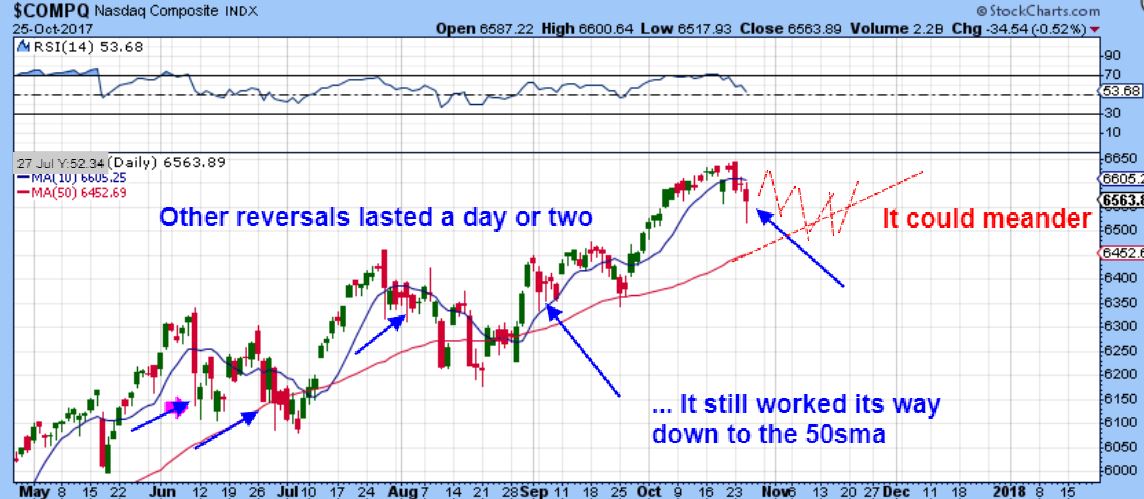
NASDAQ – Here we see other reversal candles that came in (blue arrows), but the selling actually persisted a little while longer, or at least it went sideways and got a little choppy until it worked over to the 50sma area, so I do not think that yesterdays reversal automatically means that the selling is done.
Things could get CHOPPY, but we are also LATE in the daily cycle count and already due for a Daily Cycle Low, so a close above the 10sma may be the next signal to go long again.
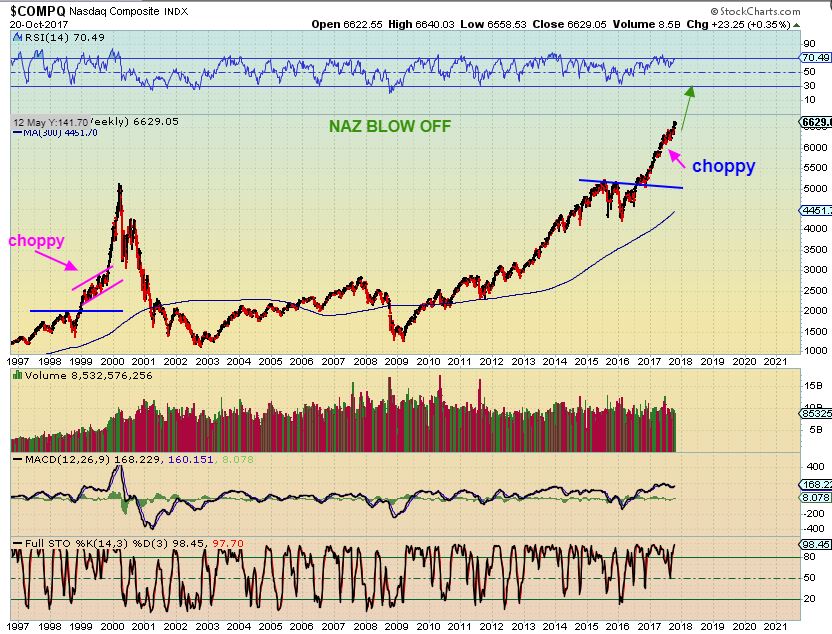
REMINDER #1: In my weekend report about the possibility of a blow off top, I pointed out that the trading looks straight up, but was actually a bit choppy in the 2000 ramp up, as it ascended to the blow off top too.
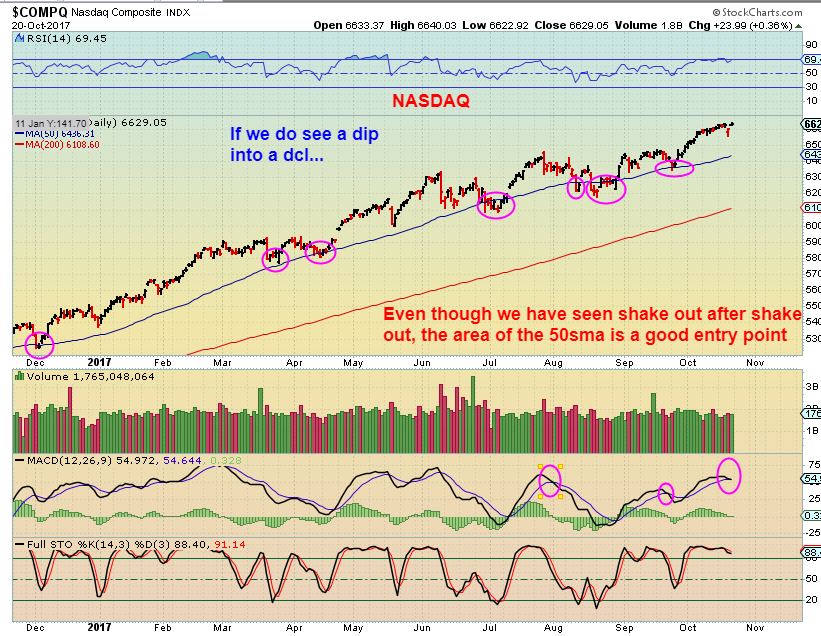
REMINDER #2: It could be a BUY THE DIP opportunity at the 50sma area, but if we start that steeper climb into a parabolic top, the dip may be shallow.
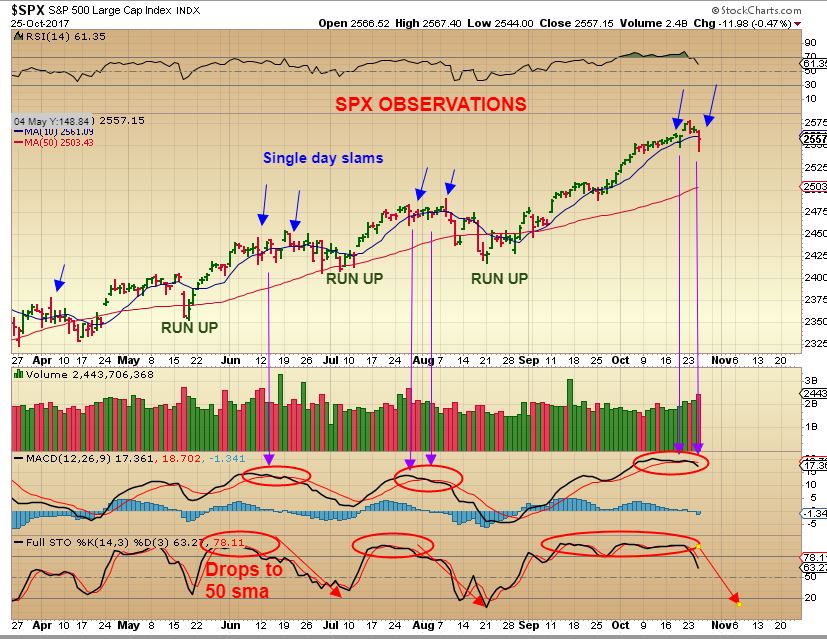
SPX – I wanted to point out these 1 day drops in the past too. Notice how often we saw a drop, recovery, drop, recovery, etc In other words, it got choppy and a bit sideways and eventually tagged the 50sma. We can’t help but notice that the last ramp up is steeper than the others, so are we in a stronger parabolic phase? Time will tell, but for now we are extended and I do expect a bit more of a pull back.
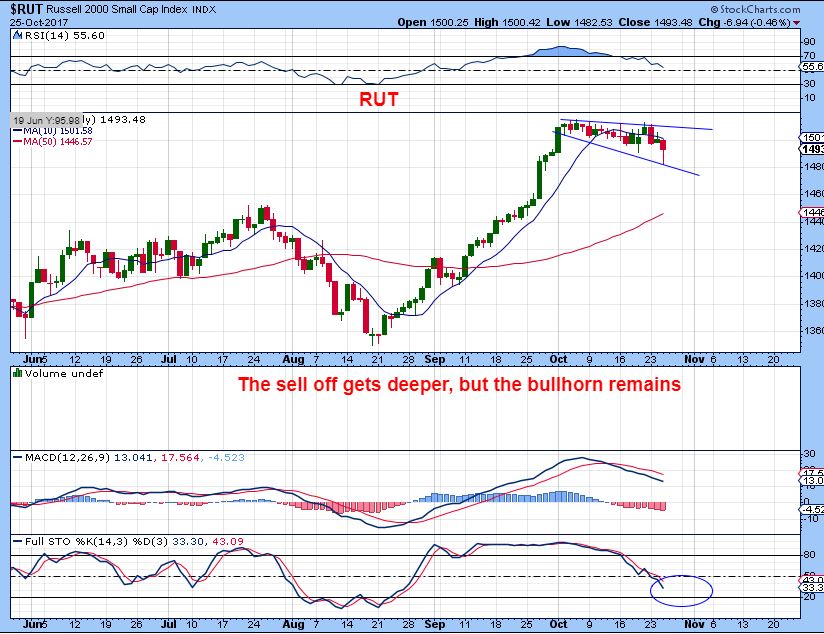
RUT – The Russell 2000 started the decline almost 1 month ago. This is the sideways chop that can slowly bring it from overbought back to oversold. A break above the megaphone pattern is a buy.
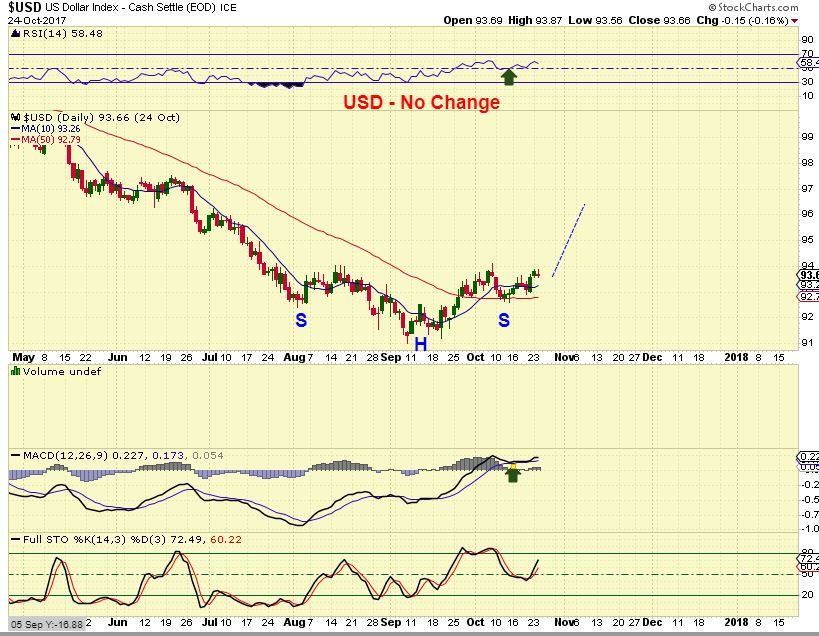
USD – Inverse H&S, expect higher prices.
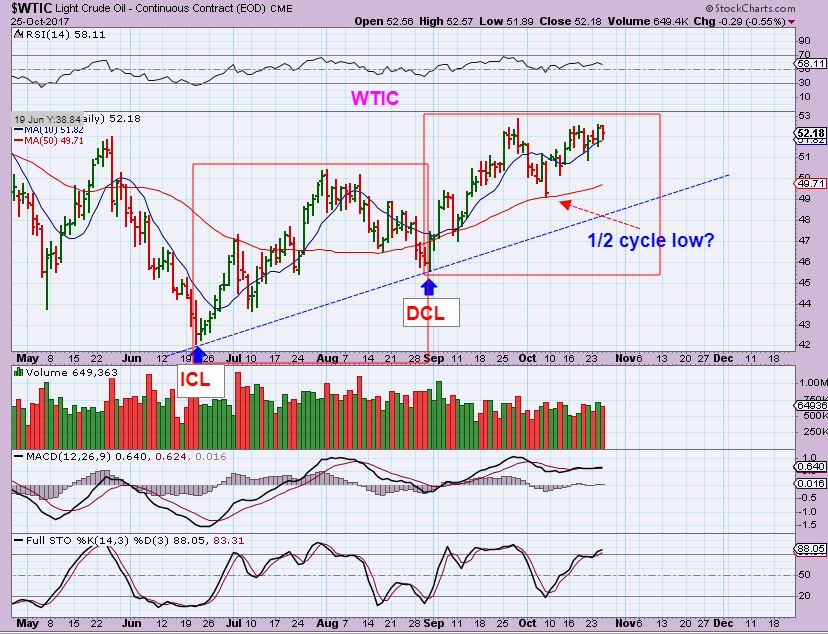
WTIC – I was pointing to the drop at the 50sma as an early dcl, and I’ve said that it bothers me a little that it came about before day 30, but price still climbed higher. If that was a daily cycle low, we would be on day 12 expecting higher price. I am seeing somethings now that hints at weakness, so I wanted to zoom out.
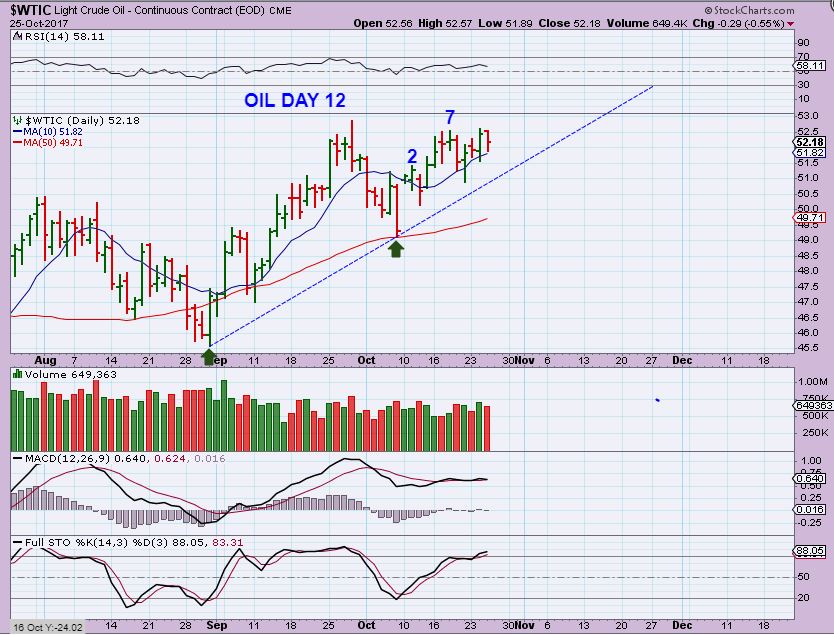
WTIC – When I look at this bigger shot, it looks like that may have been more of a 1/2 cycle low. What I see in this chart that bothers me slightly a hint of weakness, so it is possible that this 2nd square is one big daily cycle and it could dip down into another higher dcl sooner than later. Honestly, these last 2 peaks looks like a double top now. I’m not long or short Oil at this point though.
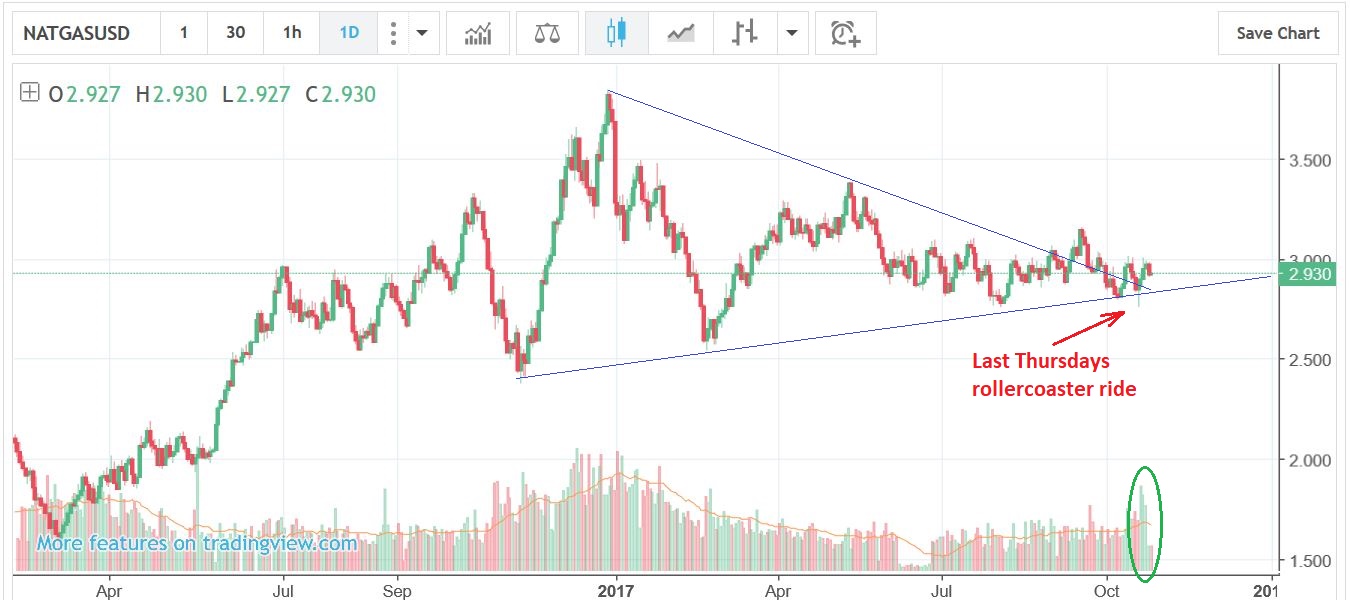
***The STOCKCHARTS NATGAS chart gave another bad print. They have really had a difficult time getting these correct, with GOLD & NATGAS being incorrect lately, so I will move to another chart of NATGAS
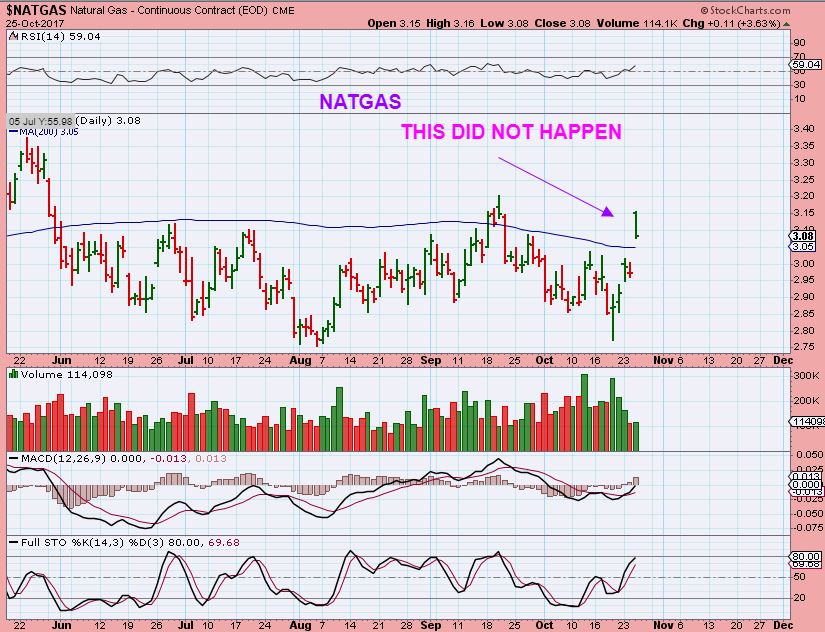
NATGAS STILL UNDER $3.00 – I have been long Natgas for about 2 weeks, but I closed my UGAZ position today to lock in small gains. I am NOT bearish, I just remember last Thursdays ride at 10:30 a.m., and decided to hit the sidelines, until the Inventory report is released at 10:30 a.m. Eastern time. I can always get back in. It is a bullish set up at this point, and as pointed out in past reports, SMART MONEY is LONG, Short positions for Dumb money are at record highs. That is often a very Bullish situation.
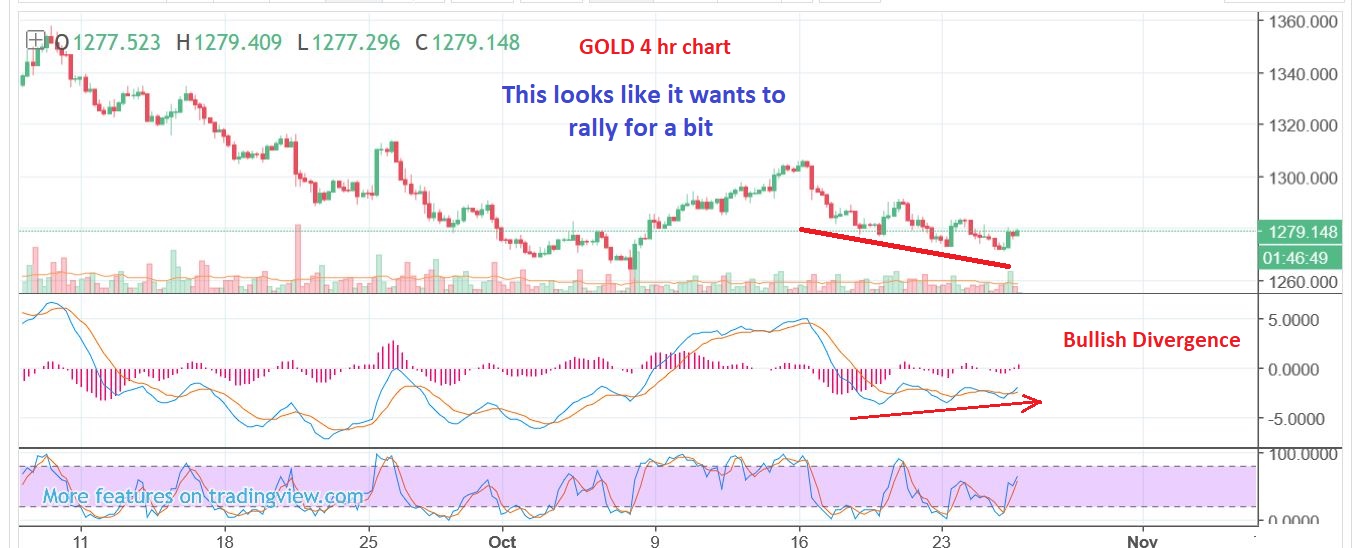
GOLD – We are on day 13 of this daily cycle. I do not think that day 6 as a peak can be broken at this point, but Gold does look like it wants to bounce. How about a back test of the 50sma 😉
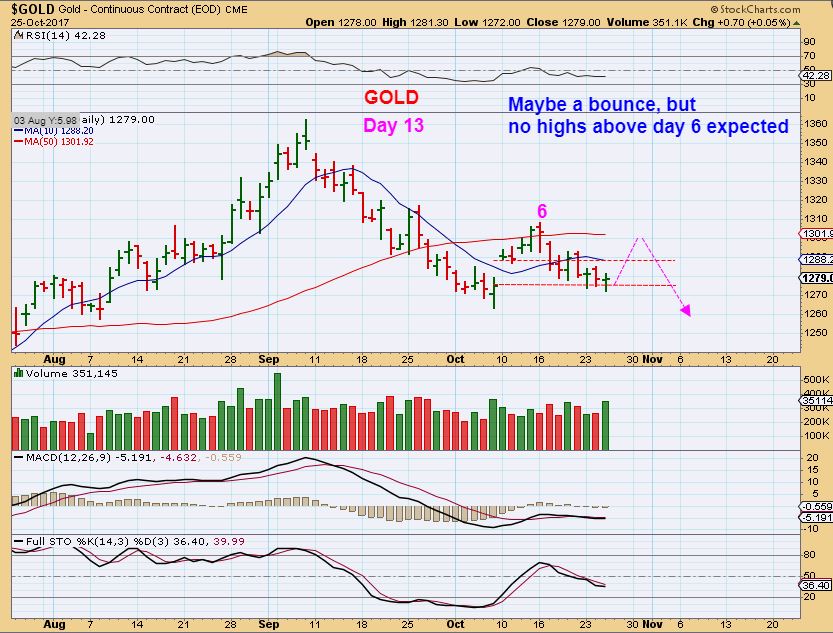
GOLD – I captured this at 9 P.M. to point out the divergence with this drop and the MACD. This really looks ready to move higher ( and the markets could start selling down into a dcl. That makes sense).
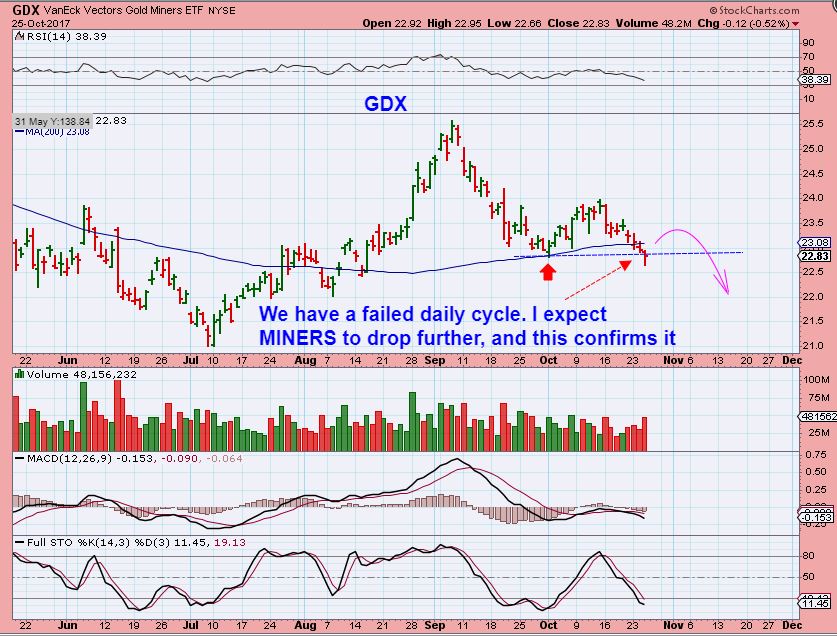
GDX CYCLES – I have been saying that this is not the time to buy miners longer term. We now have a failed daily cycle using cycles. Even if we get a bounce, do not be fooled, it should NOT break above the Oct highs.
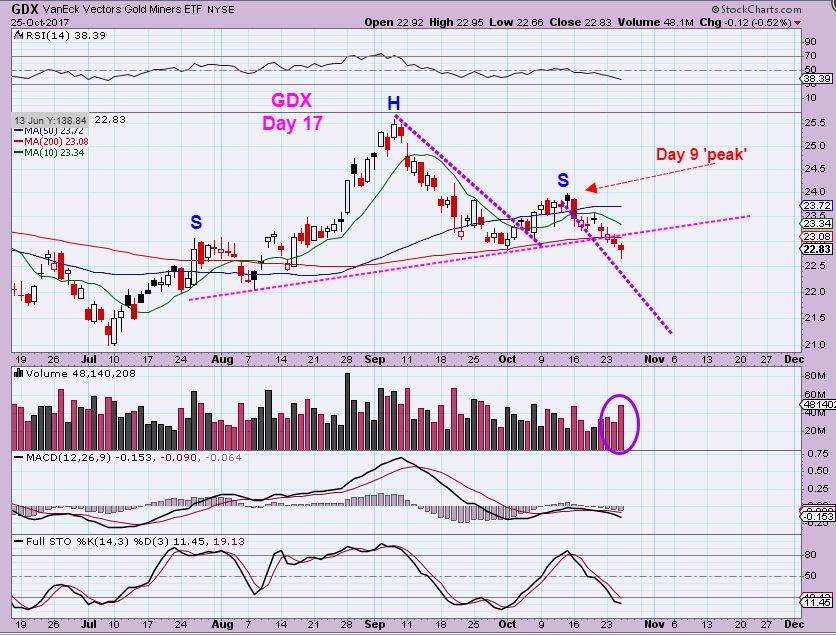
GDX TECHNICAL ANALYSIS – If this is a H&S, the neckline broke and the downside is still ahead. It doesn’t have to be straight down, it can bounce too. Wednesday had heavy volume on the drop. We could see a back test of the 50sma here, but I still expect more of a drop.
Well, even when we can get an idea where certain sectors of the markets should be heading to, it’s easy to see that the point from ‘A’ to ‘B’ can still be a bit choppy. Let’s see what Thursday has to bring our way. I will discuss a couple of the trade ideas recently, to see how they weathered Wednesdays volatility and a few other nice looking charts. It may be wise to keep positions small or manageable just in case that choppiness does continue, but if things simply continue to rocket higher, that could be part of the parabolic run to the top.
.
Enjoy your Thursday trading and watch for that NATGAS report at 10:30 a.m. eastern time.
.
~ALEX
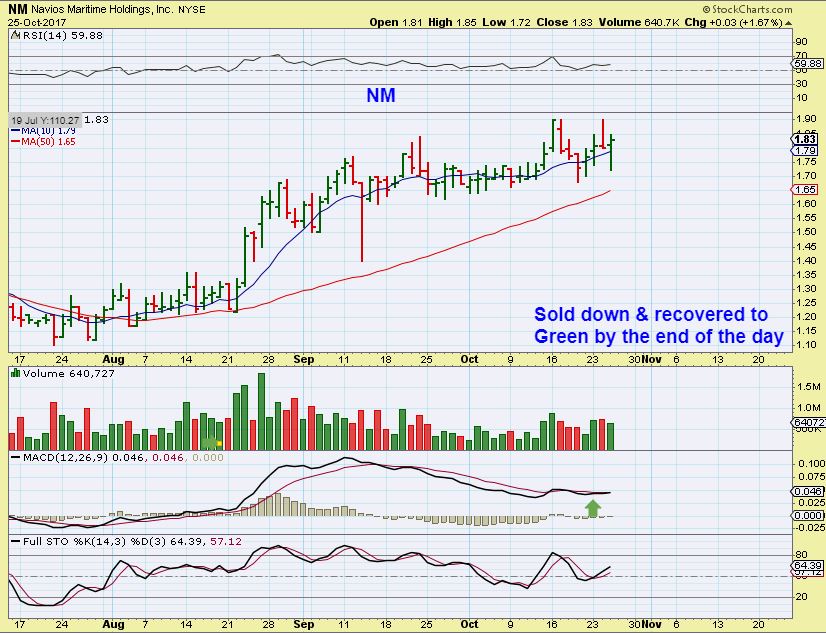
NM – This was the bullish chart set up that I posted when I mentioned shippers and I took my position in NM, ( SB, TNK, SBLK, and SALT were mentioned too).
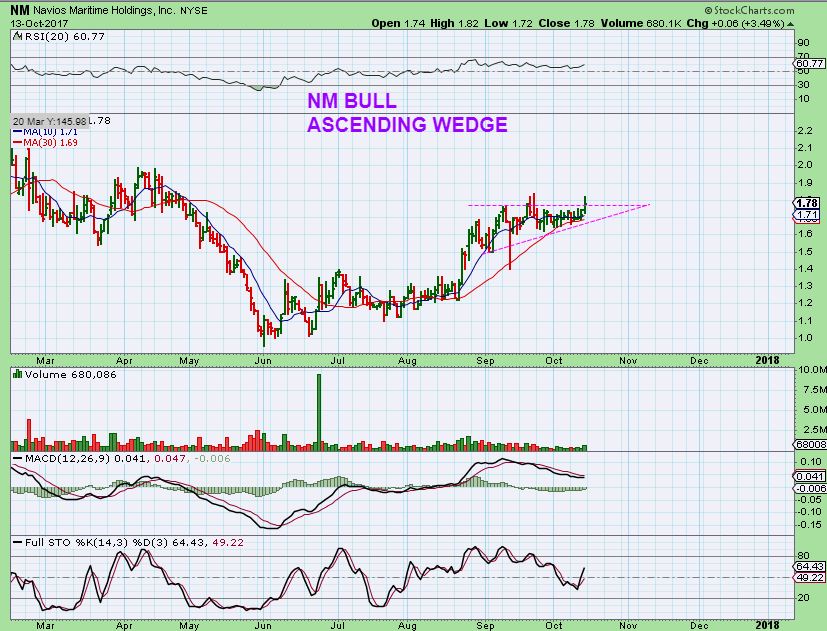
NM – You can see that it Popped, and then dropped again, and now it is basically still trying to go higher. After selling off yesterday, it actually crawled back to green. That seems bullish with that market sell down.
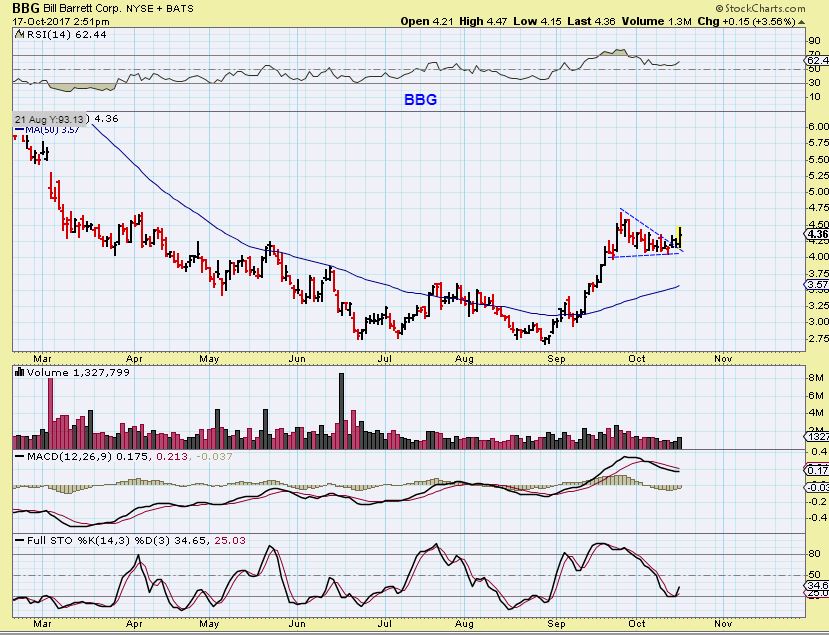
BBG OCT 17th – This was a bullish set up at $4.36 last week. Did it survive the selling yesterday?
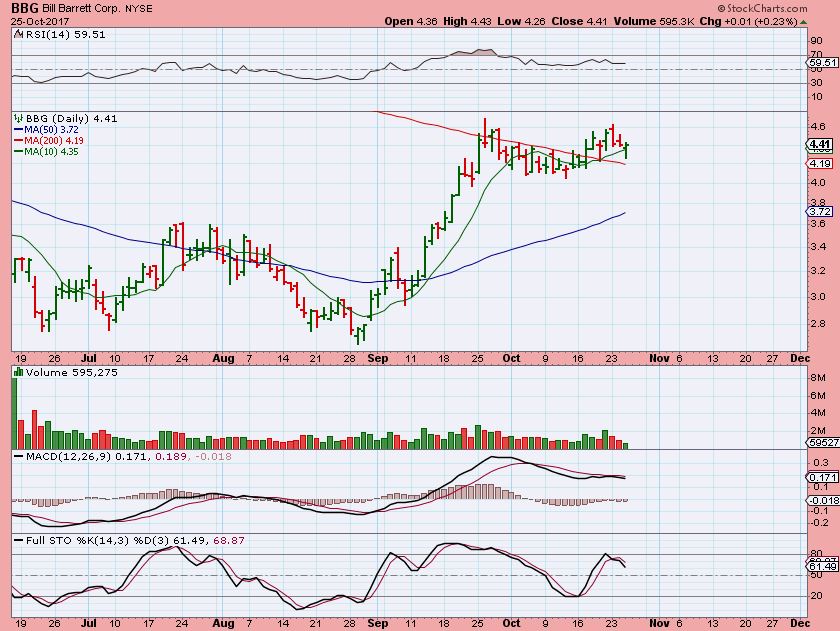
BBG – You can see that it made it to $4.52 and then drifted for a bit. Wednesdays market sell off saw it drop back toward the 200sma, but buyers scooped it back up for another reversal. I still like this set up above the 200sma.
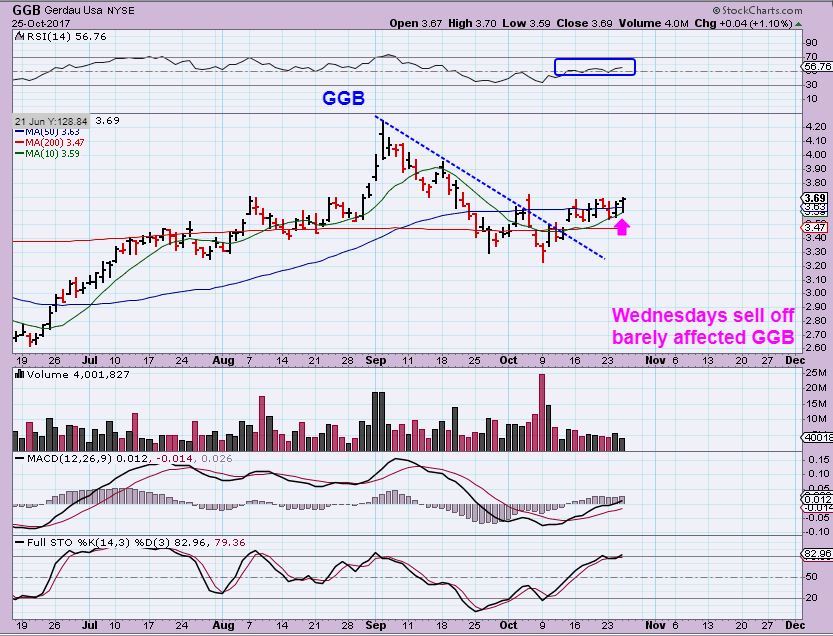
GGB – I like the set up on GGB and it was not really affected by Wednesdays selling. It could be bought here above the 50sma, but I would put my stop under the 200sma, because even if it falls to the 200sma, it is fine. It might work best to start a smaller position here, and add at the 200sma if it dropped there.
When I mentioned Shippers as being bullish a week ago, this was on my list, but the base didn’t quite look ready yet. Now it might be…
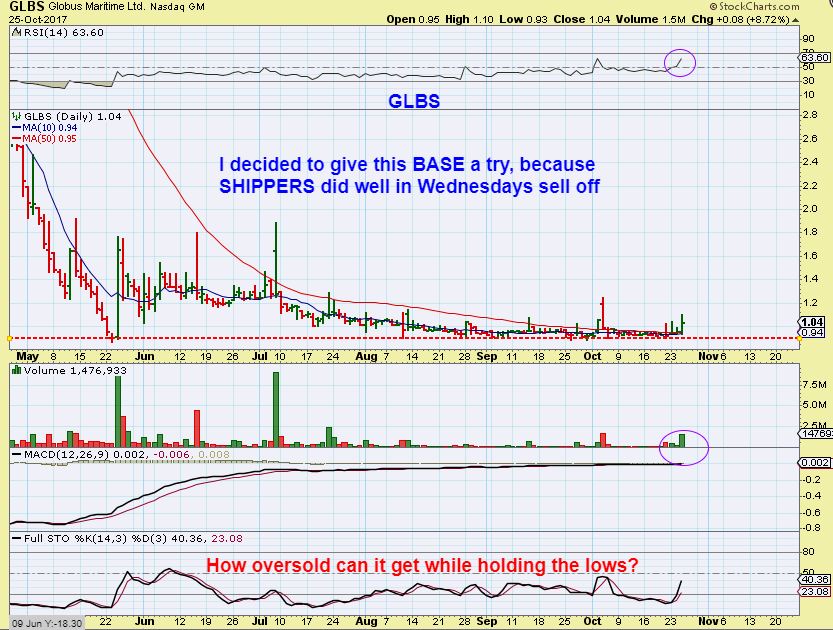
GLBS – Due to the fact that the Shippers have been doing well, I actually took a position in GLBS near the close on Wednesday. I noticed it because it was on my watch list and I noticed a large POP that took place in the last hour. It may be just another POP, but I’ll take my chances. It popped to $1.10 and then dropped back down, so I entered near $1.00.
1. They already released earnings in early October, and
2. GLBS closed a private placement this month, so what bad news could come out now, right? 🙂 Famous last words, but the BASE is good and the lows of the base are at 90 cents for months- I do not think that the lows will be broken.
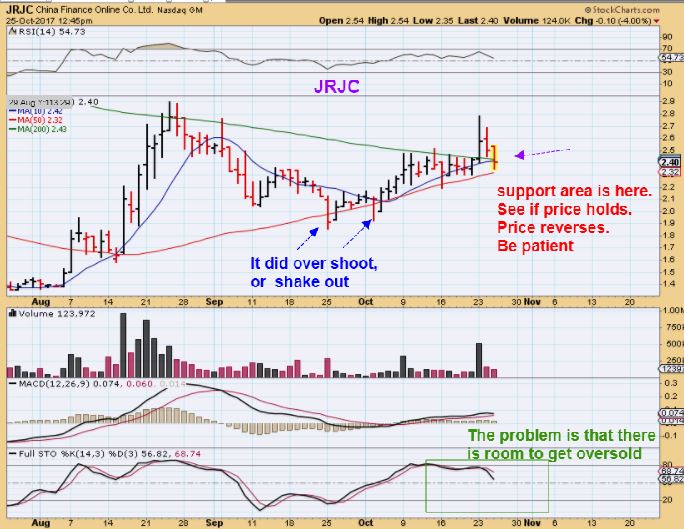
Back to the JRJC trade that I have been following.
JRJC – At 12:45 p.m. Eastern this was JRJC as the markets sold off. It actually closed in this area , so the 50 sma support seems to be holding SO FAR. Volume remained light.
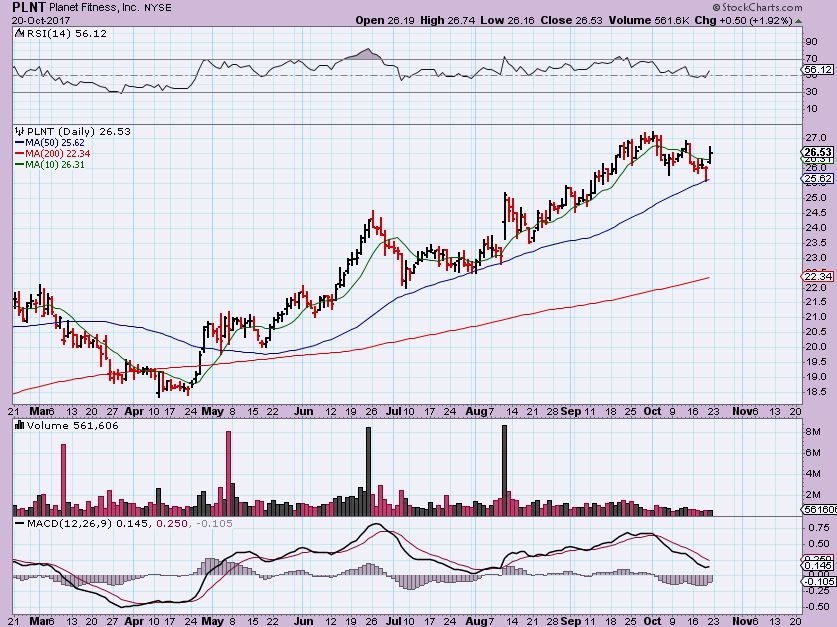
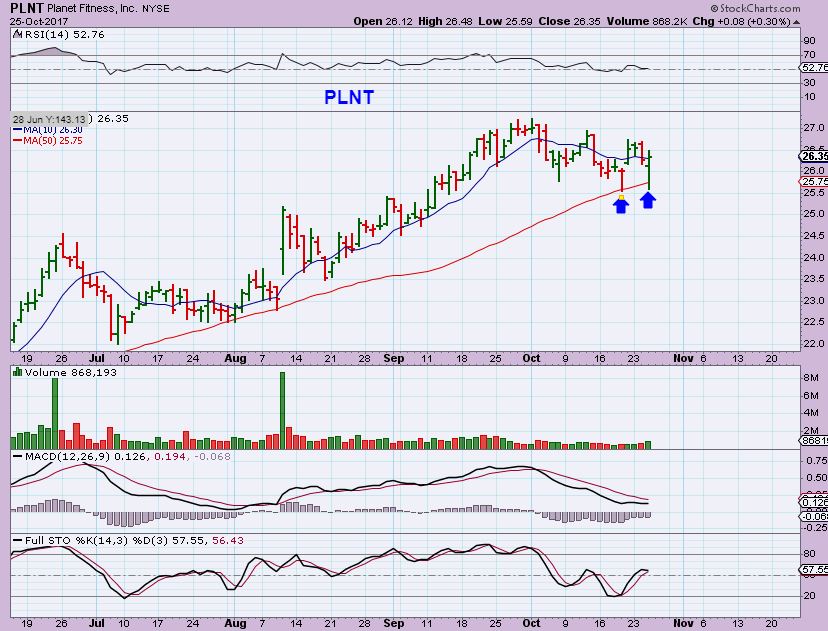
PLNT – This was the PLANET FITNESS trade on Oct 20. Did it survive the Wednesday drop without technical damage to the chart?
PLNT – Wow, it dropped to the 50sma (slightly below actually) , and then it was bought right back up. That low was $25.59 and it ran back up to close at $26.35. The set up is technically in tact.
“WHAT IS GOING ON WITH MBOT?”, I am asked. THIS IS THE LONG BEAUTIFUL BASE that I pointed out in September. I pretty much did a ‘BUY & HOLD’ on this one with the disclaimer that THIS MIGHT NOT BE FOR EVERYONE. It swings like a monkey in a tree! So far the POPS have been great, but it does give it all back again. Lets go to the daily chart…
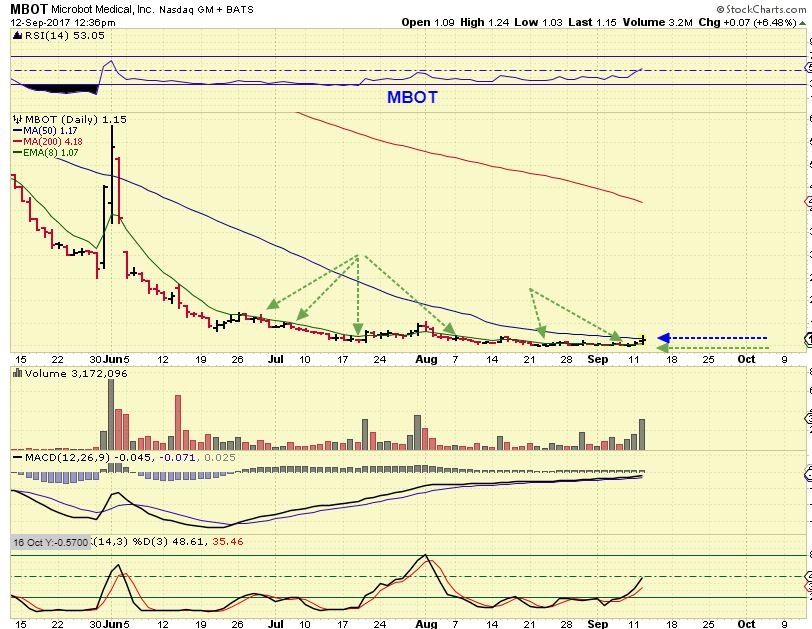
MBOT – “Swings like a Monkey” = POPPED to $1.40 , dropped, POPPED to $1.50, dropped. Thiose swings are 40 & 50%!! It is ‘percolating’ and so far THE LOWS of that base are $1.00. $1.00 to $1.50 is a 50% gain, but like I said, I bought this as a BUY & HOLD, hoping to see this recover a bit more long term out of that long base. Below you’ll see the YELLOW lows of the base, and the BLUE support area too. MBOT finally reached the oversold area, maybe we will get a break out again soon.

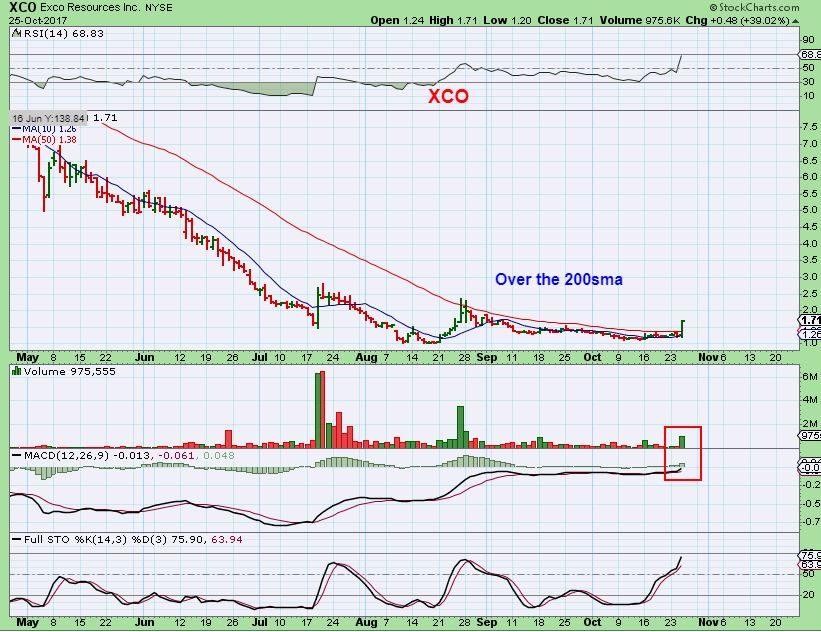
XCO – XCO POPPED in August and since then has formed a base. It was up about 8% when I saw it near the close, and I mentioned it in the comments section, and suddenly it took off to up 40%. I missed it , but will be watching it going forward. Down the road, a back test of the 200sma may be a good buy opportunity. This is NATGAS.
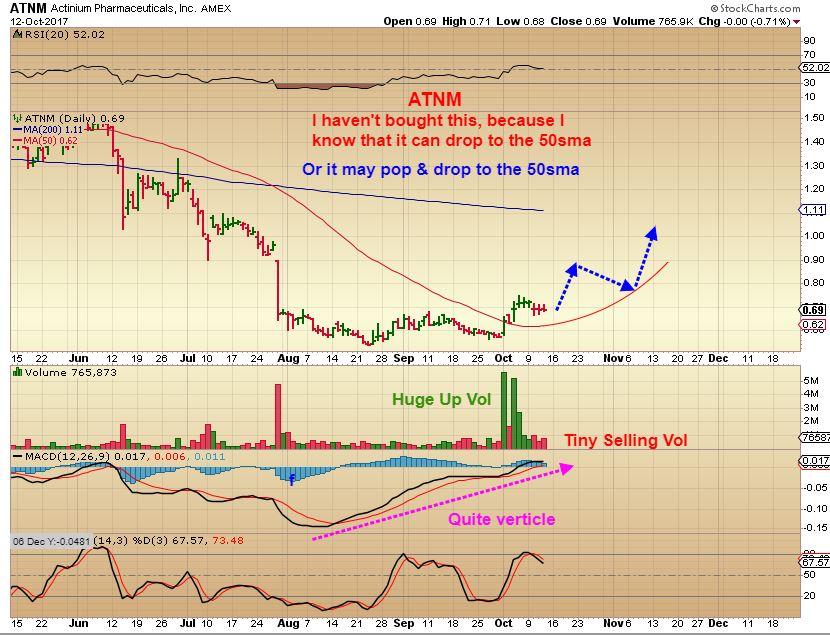
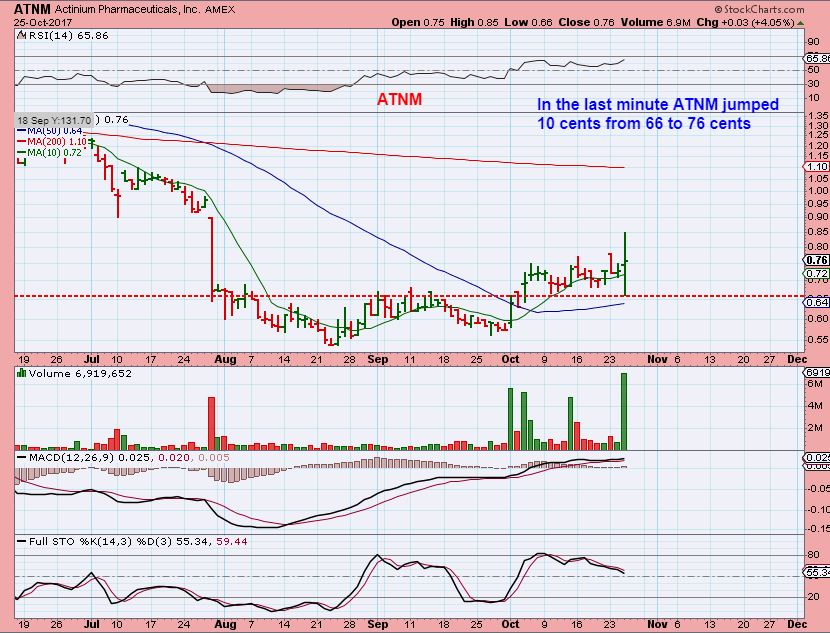
ATNM – On Oct 12th, I didn’t buy this thinking it could drop to the 50sma ( see chart), but I wanted to track & buy at the 50sma if it did. Well, I ended up buying it last week anyway and…
ATNM– This morning volume was 1 million in the first 15 minutes, and it started ripping higher. I was thinking this was going to just rocket higher, BUT…. It then sold off & IT ALMOST TAGGED THAT 50SMA – lol. I captured this image at 3 P.M. and posted it in the comments as a BOOM to BUST, but maybe it would just back test the 50sma area. I said in the comments that I did NOT sell my position…
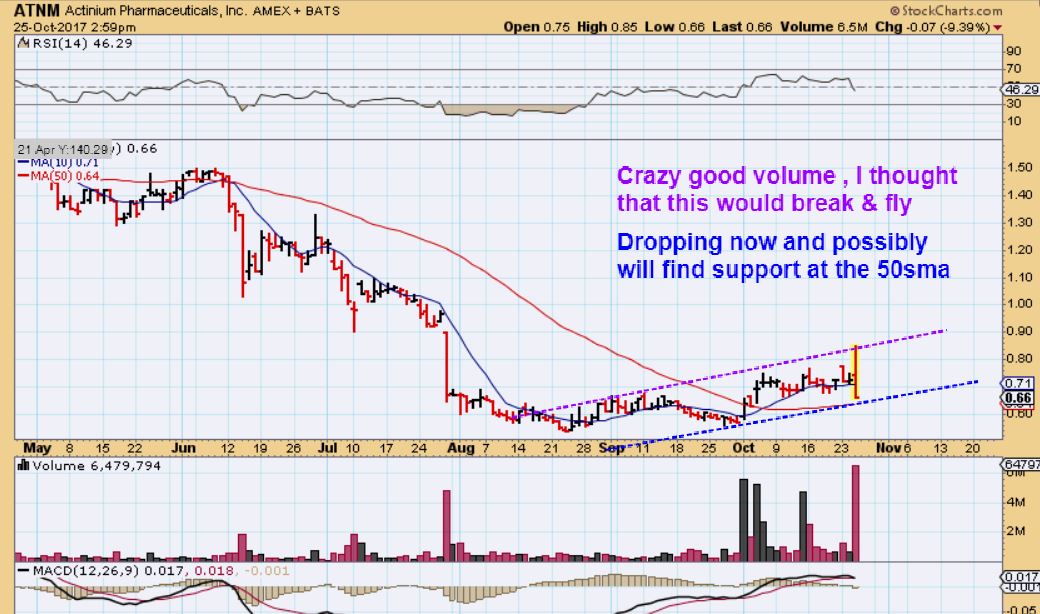
ATNM– And then it closed green, back above the 10sma? Wow. It jumped back higher from 66 cents to 76 cents. SO now this may take off & run, it may just continue to consolidate, I don’t really know, I haven’t seen THIS pattern too often (if ever). It is a giant doji. The RSI is still rising.


Rolling over? Looks more like a dead cat bounce.
LOL – You DO have a twisted sense of humor 🙂
is HOS on the up, a massive increase yesterday?
Yes, I mentioned that one in the comments and almost re-entered, but I didn’t
It is an odd pattern, but it looks Bullish.
Good report!. I think on XCO, you may mean a back test of the 50 day, not the 200 day.
Peter and I were discussing it. Funny how price drops right back to support and then they beat earnings lol
You guys nailed it. Wish I had bought some.
Peter I think actually mentioned it again yesterday as being a ballsy crazy move to make.. not sure if he bot it or not
I mentioned it in the comments when it was only up a little ( 8 % or so) toward the end of the day, and then it just took off big time into the close.
TWTR?
No, XCO-
refresh & You’ll see how this thread shows up on my page. H50 mentined XCO in a new comment, and you posted under him . Sometimes a thread gets mixed up like that, when posts are inserted under a comment, so I was talking about XCO
https://uploads.disquscdn.com/images/bc6441fbd61bccd056468313731afd340d7fcb56aa239cd41f1752dcf489fedf.jpg
TWTR I mentioned in the report as having earnings ahead and the last 2 earnings had a different reaction.
I also told you to buy & HOLD TWTR for yrs and you’d get your double that you have been looking for. I said FB went through the same bull kicking , but ended up in the 100’s. NOT AN EASY RIDE , like any Bull 🙂
I shoulda went heavier. I only nibbled a few days ago. And to be completely honest, I shoulda held my 17s from last month lol
Oh, I didnt know you bought pre-earnings. Congrats! Thats a great POP today and look at TWTR on a 3 or even 5 year weekly. That is a huge base ( Looks smoother on a 5 year weekly, huh?)
200 shares starter.. Nice little lunch money gain.. Just wishing I went in with size.. I never seem to go with size when I get lucky lol…
It was risky with earnings, they had that huge gap down on one of their releases. It would have been tough unless you bought a lot lower & just decided to hold though.
Hah, I didn’t buy. Alex’s cautionary guidance swayed me. It’s okay. It was a gamble.
I didnt buy it either for the same reason- I scared myself -lol That earnings release last summer killed the stock . IT closed at $20 and the next day was $16. Seemed like a bit of a risk 🙂
Yes, Thanks for clearing that up for other readers.
And here it comes now – dropping down to tag the 50sma 🙂
Whoever mentioned TWTR as a buy yesterday was spot on!
It was in the report with a warning that they announce earnings this morning, so when you look back at their last 2 earnings, one gapped up big, one gapped down big. It was a risk, today is the reward
CDE getting hit in the pre-market.
under expectations Q3 report, the conf,. call at 11am
Should be a good buy again in a month 🙂
Alex…do you think IPI will hold around that 50 day? I don’t have it…have been wanting to get in and wondering if this looks like a good spot….
It looks good, but they release earnings on Monday, so no guarantees, right?
Alex, what’s a reasonable target for JRJC.
If it could get going, and strong buying comes in, it could run to $3.20
I just can’t tell yet if the markets will correct here or not. I dont think that it will fight a market correction without some spectacular news or earnings though
Thanks!
Bought some SILJ, MUX, and have order out bidding for FFMGF this morning, but no fill on the FFMGF yet. Like MUX below $2, figure that is an easy $6 stock next time miners have a sustained run.
CSTM released earnings, nice bullish reaction there ( One of our steel stocks)
I AM NOT buying the back test of XCO, I was kind of watching to see if it would slowly drift back to the 50sma over time
It is just dropping there 1 day later, and that usually isnt the movement that I like to see
GLBS is doing the exact same thing. I dont like when something that bursts higher turns around the next day and drops back to the lows. It is best to have a gradual sell down. I’m still holding GLBS, because THE LOWS have been about around 87 cents 90 cents, and I bought most at $1.00 and $1.01.
Thanks for mentioning these, especially XCO as I was wondering if it´s a steal on the pullback, or better left alone.
I would want to see it start to settle down and act a bit more steadily, and it may do that in the future ( Or Maybe it is waiting for the NATGAS report 🙂
The Markets, though they opened green, do look a bit heavy in the short term. They look like they need to sell a bit or go sideways, and remove some of that bullish sentiment.
20 mins to nat gas report . last week showed inventory and it traded down for an hour before it took off
Last week it went crazy
Odd to see GDXJ down only half as much as GDX
Both the OIH oil drillers and the XBI seem to be getting oversold on the daily charts. Would like to start buying some energy names, and maybe we should be looking at these basing biotechs again?
SWN… Woulda been a nice Short …
PM earning releases today are a mixed bag:
GG up 5%, AEM up 7%
NEM down 2.5%, ABX down 6%
And in the silver space (as mentioned earlier) CDE down 11%
UGAZ all over the place again, but looks like it wants to eventually move higher (SO FAR)
there is inventory … wait a bit because last week it held a bit before it dropped…. watching it
ALEX…. Just one minute before I bought some.
Thanks for letting us know about NG !! (UGAZ)
Personally – I dont like the choppiness, so I am just going to look elsewhere for now.
It could stabilize and move higher later today, but I think I just want to look in another area. I held it for 2 weeks and made very small gains riding lots of turbulence.
Agree
Yeah, and now it’ll FLY over $10 🙂
premarket low was 9.77 if it breaks that last support is 9.54 ..which it bounced off last week
Stopped out of ATNM yesterday. Looking like a good move base on today…so far.
NAK dropped right to the 50sma and looks like it is reversing.
I’m not buying, but I do own it, so it would be good to see it hold that 50sma area.
NKE … damn u!
Alex are you still in GNMX? CTRV at the 50 ma, watching, EDXC? thoughts?
Hi John,
I mentioned a few days ago that I sold my GNMX in the $1.70’s – Kind of looks like a bull flag forming here
CTRV – I do own that, probably should have sold on that POP, but it looked like it wanted to continue higher. Right now I see it like this ( refresh for a chart )
EDXC – MJ STOCK, I have owned this for a year now and just a BUY & HOLD for me due to their product for animal pain, etc . Very hard to read short term, but over the 50sm and 200sma is acting as resistance. It lacks buyers like it got last year, but that could pick up if they continue to do well.
https://uploads.disquscdn.com/images/5def07bd3750675d1003a74649ac049ca888165e787d9aaf4011ff878fabc446.jpg
Thank you for your thoughtful response Alex. I am still in both. GNMX seems to heading in the right direction 🙂 Also, I keep hearing from NAKers about MMs manipulation, holding it down, taking out stops, 34m short, etc and an epic squeeze coming? Thoughts on that? Thanks again
Looks like ADHD filled the gap from 10/19 and may be building energy for another pop.
lots of small biotech are showing same signs
I bought UGAZ and already have a stop in place. My gamble is that lows are in (look at accum/dist line on weekly chart), and that this drop represents a decent entry.
UGAZ didnt break the lows from last Thursday & put in a reversal, , so it should be fine
It ‘Feels” like GOLD is starting to ignore the USD , because I am seeing the USD breaking out now ( UUP breaking higher), but Gold & GLD are not down as much as one would expect under that move.
GDX is dropping fairly well, GDXJ is not
Some of these miners are now testing their 200 WEEK moving averages, like ABX and CDE.
XCO did drop down to the 50sma, tag it, and bounced . Interesting
Kind of a boring trading day here, most of my larger holdings are slightly red for the day ( TGB, IPI, NM, NAK)
I bought it this morning…..just before I read that you DID NOT. LOL.
Good for you, you are in the green 🙂
For once! Did not do well in the biotech game.
VJET looking good, HPJ trying to break out?
Yes, HPJ trying to break free (Again)- does look good ( Again ) . Nice volume.
Did you see it on a 1 yr weekly? HUGE inverse H&S
REFRESH – My Oct 5th chart. Very nice set up really. Maybe this time it will break & Run. November earnings I think
https://uploads.disquscdn.com/images/86aec4382252f5da8cbbefa29ad5e448032b9420b204f78f5f989c6ac7c91271.jpg
Some of the ENERGY plays that we have played are actually setting up. OAS looks similar to WLL and WLL is moving up with nice volume
CRK is moving off of the lows with decent volume.
See also MDR, QEP, SXE, ( maybe LGCY)
and HOS back above it´s 200 ma
Ha – if you look at the 50sma and the 200sma…it looks like a double shake out, right?
I sold above $4.23 area and wanted to get back in ( I did once for a trade), if I wait any longer I may be buying back at $4.23 🙂
nice….
lookn at SXE too …. think it’s got this repeat move in it…..? ;O)
https://www.tradingview.com/x/NNrtn6mN/
Was it BAYTRADER that used to mention MYOS? Pretty big pop there today
Alex… on GLUU….does that back test of the 200 there look like a good place to get in….I mean, does the chart look good other than that pull back?
It is not a bad looking chart, and there is support in the area. It also fills a gap.
I would wait for some kind of a reversal, since it isnt oversold and the volume on the selling is a bit heavy.
CF´s $22 level GDX (general area on the chart) is dead ahead. I am doing some buying today, will bring total holdings up to 33% invested.
That is not a final target for an ICL , I’m pretty sure that I mentioned that before.
It is not a price projection, it is usually me drawing up an idea showing downside is still coming, maybe a tag of the triangle that we hasd been watching, etc …so people wont start buying on day 9 or 11 or so- thinking that all is clear.
Infi looks good for swing trade at 2.15. 3-5 day hold. Cover should take it to 3.00-3.25
I’ve been watching that……haven’t jumped in yet in case it wants to close that gap…3 year chart looks good
CF, SWN? Double bottom on the daily… Bigtime.. What cha think here?
Not just a double bottom, but it looks like a shake out too.
Very oversold too – it does look like at least a good scalp trade.
Some of the energy stocks are perking up here
Nobody else starting to get excited about buying miners in here? I have to admit the charts look like crap, but I also love buying things cheap so that´s what I´m doing. Trying to contain my position sizes bc they do look like could go lower. That´s when we buy, right?
Just so you know – I am not buying –
Charts often seem to look good before a drop into a dcl, but they often break down & fall apart. (See CDE)
I’m not saying that we cant get a bounce, but I dont think the lows are here for a dcl yet.
Look at GDX & GDXJ today as the USD starts to rally as I have been saying it should. H&S on both, with plenty of downside.
And – Have you ever read this comments section live on a drop into a dcl? : ) Oh goodness….
Its like a funeral, and a drop into an ICL is that much worse.
I know you are longer term, small starter positions are fine for some, but others should avoid the draw down.
Thanks, and CDE is just one of them, take a peek at AXU and EXLLF, charts look like they are going out of business next month!
Finally KTOV…..
such a waiting game.. then dont blink or you’ll miss it ……….. 😉
I blinked, I missed it : )
waitn on QTNT next… and then ADHD … and then…. lol
I resisted selling these little ones.. so easy to ‘overtrade’ when popcorns goin off around u ;o)
KTOV? Is that the vodka you drink?
yeah.. and then there’s that …. 😉
XLE sat right on the 200sma and is trying to reverse
hpj and wll leading,,,,,,? hmmm
Alex, what do you think of the INAP chart? Been holding some….but….trying to decide if might be good to get more to average down…looks like maybe now would have been best time to get in…back traced now to the 50 day……?
Stopped out of CLF. Big losses. Ugh.
Bummer – no news on that drop either.
I see AKS, X, SCHN, holding up
But I liked SID on the 50sma , and it is dropping too. GGB selling down no news either. CLF selling, no news….it seems like choppiness might start ripping things up a bit.
Energy starting to look better after selling off, but I’m starting to feel a bit more cautious. Markets look a bit toppy, and the USD starting that next leg higher….
Light volume though..
Sorry bro.. We cant win them all… This last qtr hasnt been my best lol
Do you still hold CLF, Alex? It’s below recent lows, which is my stop-loss, but I may give it one more day to see if it’s a shake-out. But I’m up for any helpful thoughts on that!
Also, I see AMD dropped to 12 today – which reminds me of your 12-ish comment
Would you use a stop-loss of closing below 12?
AMZN awarded Pharma Lic. WBA, CVS, CAH etc… feeling the Amazon effect..
Wow, those 3 are taking a dump
I just heard that Trump gave a speech on fighting OPIOD epidemic and other addictive meds, and pharmacy stocks took the hit
Anyone else buy TWTR yesterday besides Peter? Trying to decide if this is a trade or to hold for a bit? Advice?
Alex scared me away from the trade 🙂 Hopefully that pays off next time.
Hey, I just said that they had earnings…you are responsible for pulling the trigger or not.- LOL
It didnt scare Crystal
I did. Two days ago. Tiny spec position. And now wishing My entire acct was in it.. I barley felt the gain my position was so small
Still cool, glad someone caught it! I won’t be chasing here, of course.
Do you still hold CLF, Alex? It’s below recent lows, which is my stop-loss, but I may give it one more day to see if it’s a shake-out. But I’m up for any helpful thoughts on that!
Also, I see AMD dropped to 12 today – which reminds me of your “12-ish” comment
Would you use a stop-loss of closing below 12?
I bought back into a CLF a bit lower after getting stopped out. Rolling the dice I suppose.
Brutal day.
That was a buy set up a while ago, but with a stop….and now That is a break down ( H&S on a 6 month chart) Downside target could get to $5.50
Okay, thanks. I didn’t see the H&S breakdown. Back out again.
? I haven’t owned CLF in a long time, Cal. I would have been stopped out today though. H&S break down.
I had a long list of steel stock set ups in a report a week or two back, but I dont ( Actually cant) buy every set up.
I was favoring AKS, X and STLD , because they were above that 50sma, , but I never entered any, I held too many positions already. CLF looked ok, but has not been able to get back above that 50sma.
AMD is NOT a buy here. It needs to stop selling & reverse.
Thanks, I’m trying to keep better notes of what you mention owning – I wasn’t sure of CLF or AMD
The other six I’m still holding you do own (from your recent comments)
Gotcha. I owned CLF this summer, I believe
TTNP… I just nabbed a giraffe!
Sweet
WOOO! Nice Crystal!
So is there hope for MBOT? I’d love to see a break out over this down trend & 50sma- And it is finally oversold.
https://uploads.disquscdn.com/images/d9c453ef487b5142ec767975caf112e2d96036cf2aecdc7a123004f3b4916d4d.jpg
SHHHH- But MBOT just popped 5 cents, sitting right under the 50sma.
#Small miracles
Are we back to not talking about M**T yet? 🙂
Taking a look at AG – I loved this stock in the past. Is this a flush? I don’t see any news behind this drop… tempted to take a starter with a tight stop
Take a look at GDXJ ( and GDX), we are possibly dropping into the next DCL. Then a bounce.
Tight stop on JDST as we have a 3-day lower B.B. crash at this point. My only regret is that I took a tiny position, should have added on that gold pop last week and would have double the profit – enough to make back most of my losses from that horrific crap 3rd daily cycle bounce. #RevengeTrade!
SO CLF STRUGGLED AND WAS NOT SUCCESSFUL AT THE MOVING AVERAGES. IT SHOULD BE VIEWED LIKE THIS NOW
REFRESH
https://uploads.disquscdn.com/images/266f8f004c968892faca8d2045e999139d592ce191932019a8ba0764ceb10fd8.jpg
so what youre saying is… Short this pig to the ground… lol jk
HAHAHAHAAA
I’m not good at shorting, it would probably do a shake out if I did
(But check out MBOT chart below )
very nice
is it doin what it did …. last time?
https://www.tradingview.com/x/kSySWWZ9/
Let us Pray, I’m still a tad heavy in this one, and a bit seasick
I like that AMZN released earnings, and it is up 8% ( So far)
But 6% for AMZN is $80/ share 🙂
GOOGLE also positive reaction to earnings, so maybe the dip is complete tomorrow 🙂
I am surprised gold was not down a lot more considering how much the USD index rallied today.
Hey guys!
Long time no see. Hope you all are doing fine.
https://uploads.disquscdn.com/images/7b5379a327496b510a568809e2c168f472a8c8c096731f06947bfa3106bba665.png https://uploads.disquscdn.com/images/6fd59b43cca85a0021f89969e8a5f721a1ca87e0c92e4feed9b896c9c2d4aa1b.png
Many are trading UJ long on the seemingly breakout of the yellow trendline. Structure tells me that we should be heading lower soon and its likely a bulltrap.
https://uploads.disquscdn.com/images/2860648d2b1ef3b3edc7e12eb298bebcb81744ab4c34e954c6c61b62fcf3b73f.png
oh my Natty… is it really up 5+% ? 😉
Natty is short for Neverending consolidation! Viking still waits for his rewards. But what a waiting game…!
Fridays report has been posted
i thought you didnt do Friday reports? 😉