Let’s take a look and see where the last week of trading took the markets…
SPX – The Big Picture for the General Markets remains the same. The ICLs ( deep meaningful dips in the market) are becoming less visible as the bull run picks up speed. Daily cycle wise? We are entering the time for a dip into a dcl.

The NASDAQ was more of a sideways move lately, as the RUT, DJIA, SPX and SOX moved higher, but…
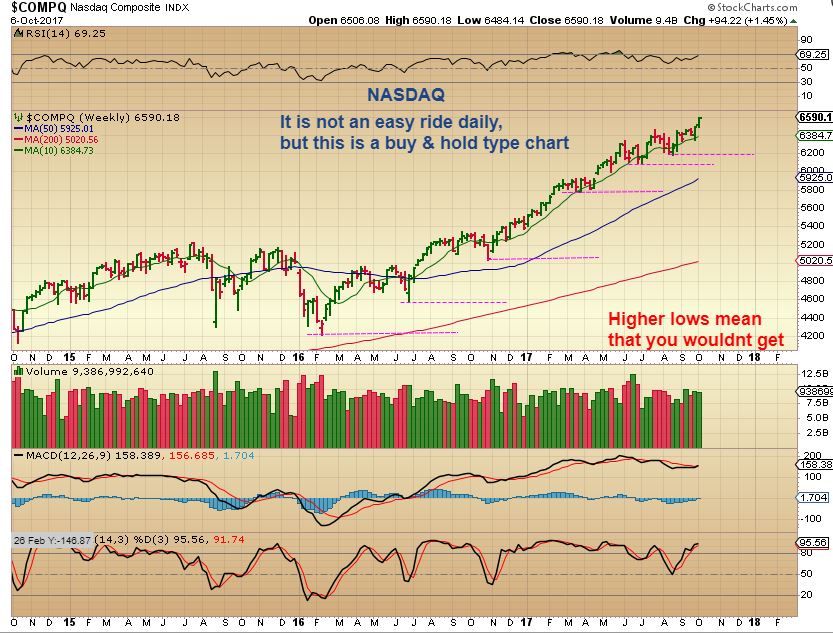
NASDAQ – The NASDAQ broke out Thursday and Friday causing a weekly break out. We still have a bull run in tact, with higher lows and higher highs and a consolidation here an there that keeps sentiment from becoming too frothy so far. I have recommended a trailing stop for ‘longs’.
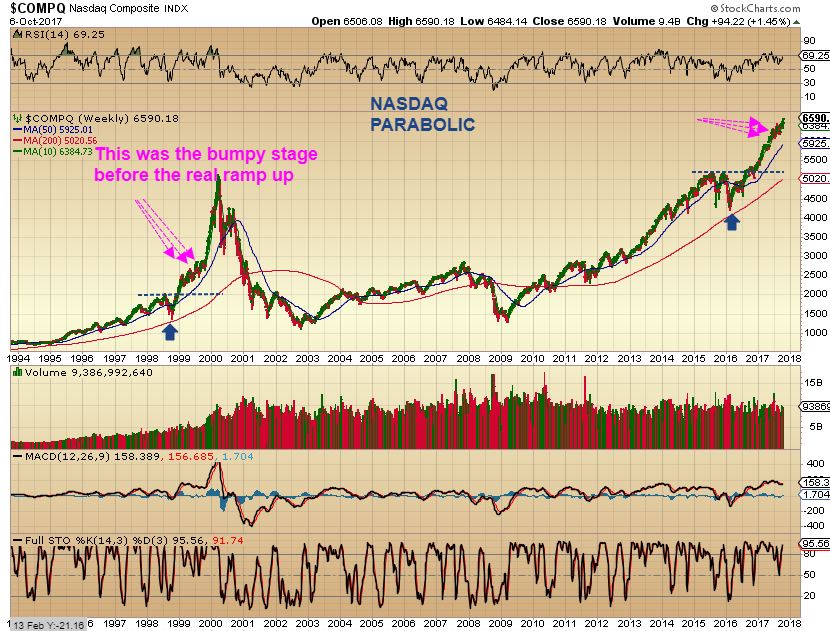
NASDAQ PARABOLA COMING?
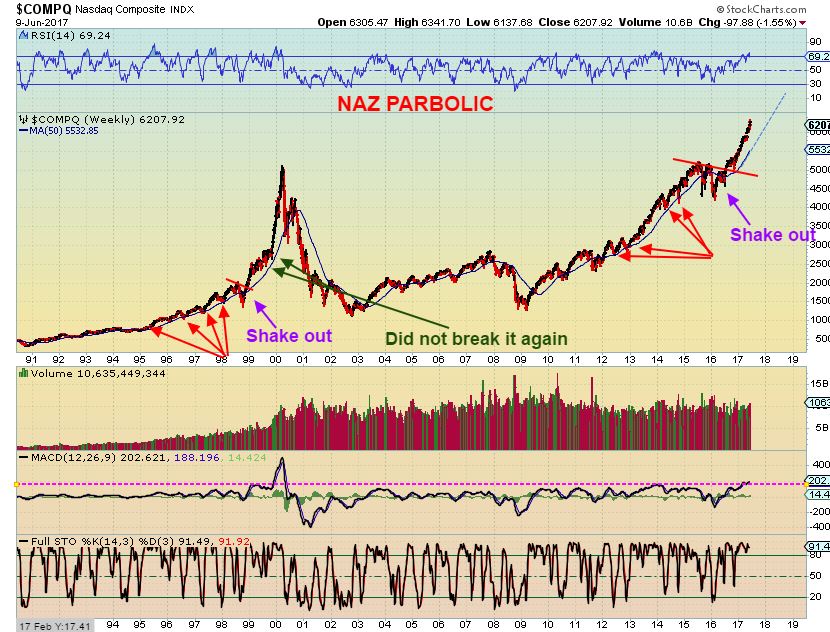
NASDAQ– All throughout 2017 we have been taking a look back at the NASDAQ Parabolic run and noticing similarities to the current run in the NASDAQ.
1. In June on this chart, I pointed out the run along the 50 week MA ( RED ARROWS) and after a shake out, it never dropped below it again.
2. A surge higher after the shake out is what we were experiencing, and then
3. It consolidated and got a bit bumpy before really taking off ( See the green arrows pointing out the bumpy ride). Did we ever get that bumpy consolidation?
NASDAQ – The recent consolidation was a bit bumpy and does show up in similar fashion as the one in 1999 now on this chart. This is still lining up as a strong possibility.
NASDAQ CLOSE UP 1999 – That 1999 consolidation looked like this close up, and yes, it was choppy and difficult to trade, but when it broke out? This is a weekly chart and it took off straight up week after week for 6 months. Are we there yet with the recent break out? …
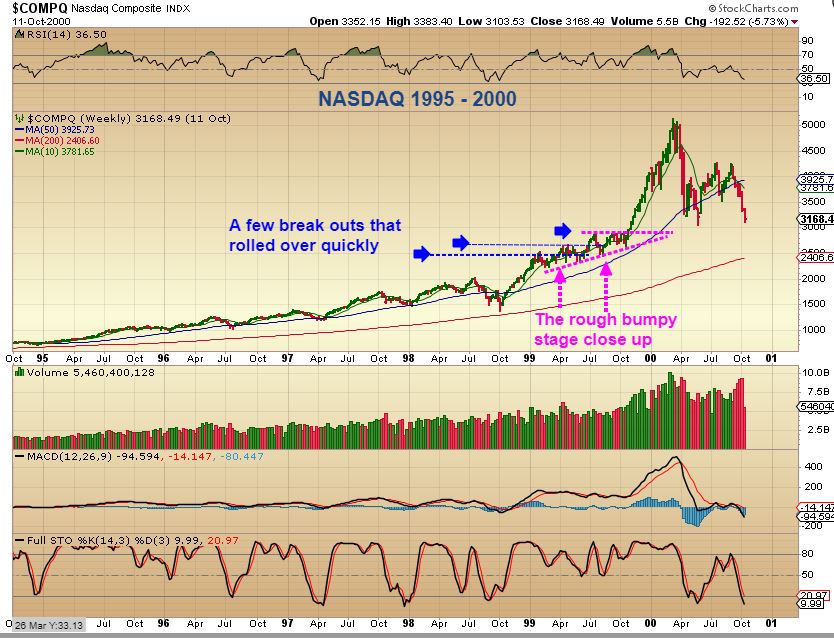
NASDAQ WKLY – It is too early to tell, but we do have a weekly break out. Again, it ran for 6 months practically straight up, so a trailing stop still works perfectly. Agaon, we are due for a dcl, so I am watching this next dip for more clues. If we still cannot get a deeper ICL, buy the dip may be the best way to go. Buying this break out may not be the best thing to do, since we are getting late in the daily cycle.
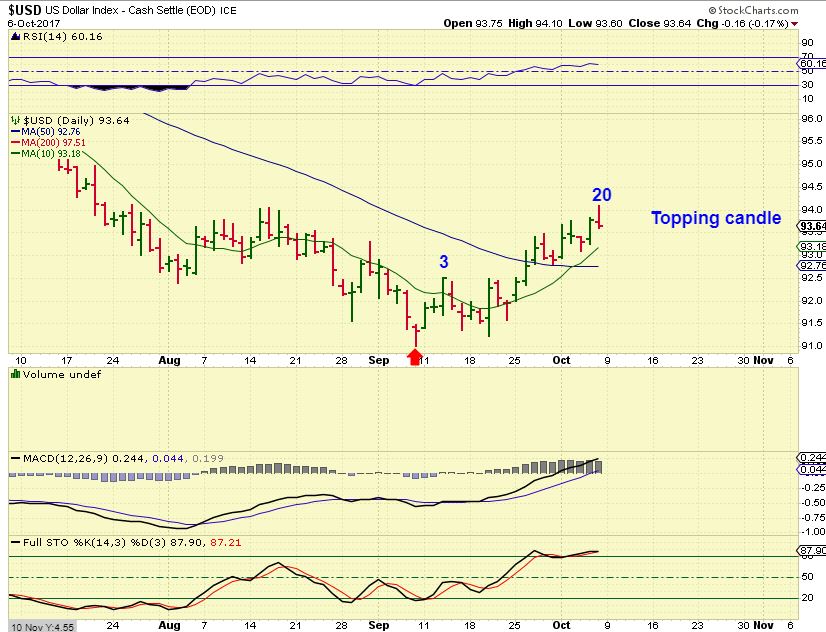
USD – A day 20 peak out of an ICL, but that seems to finally be a topping candle and we are due for a USD dip. A dip here can give Gold a push higher.
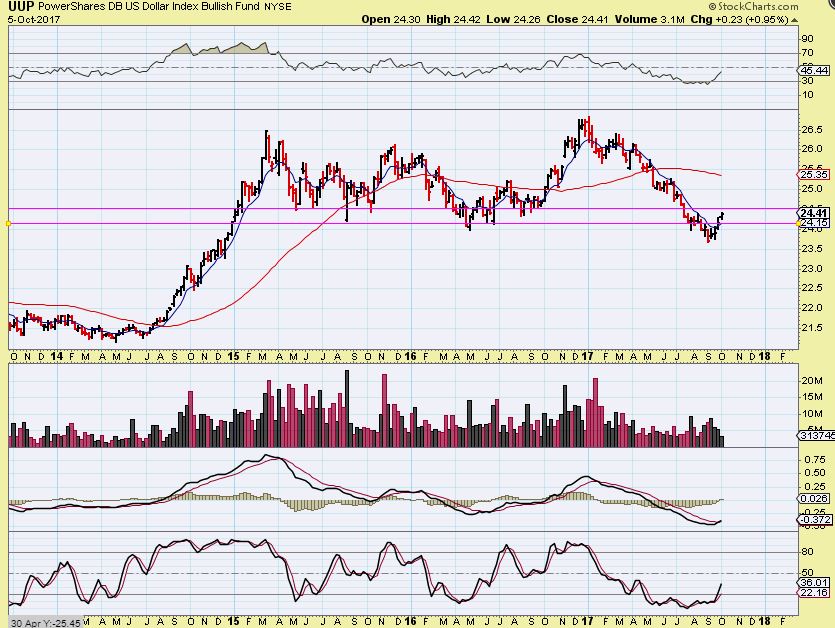
UUP – I used the UUP for volume analysis.
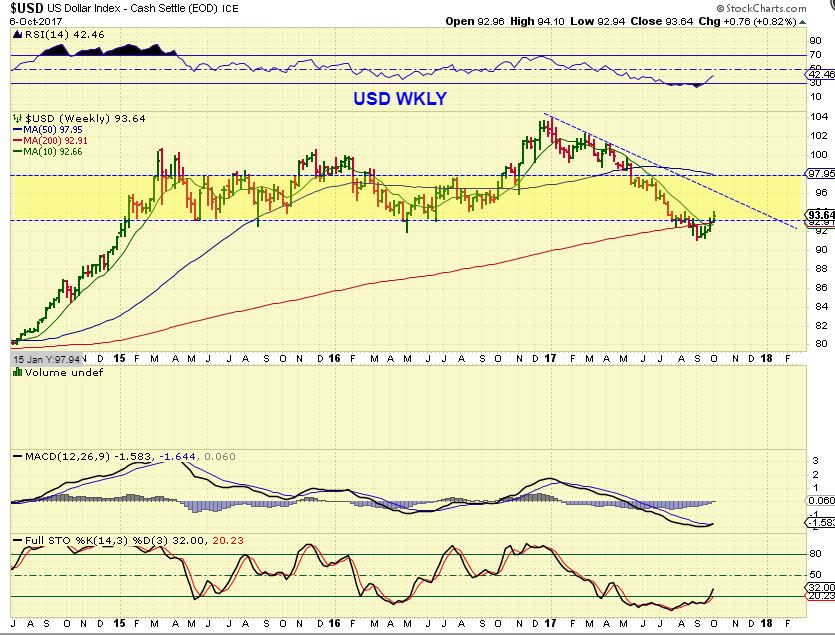
USD – We should expect a dcl and then a higher high on the next USD daily cycle. That is likely when GOLD will drop into it’s next dcl (ICL?).
OIL GOT A BIT WEIRD LAST WEEK.
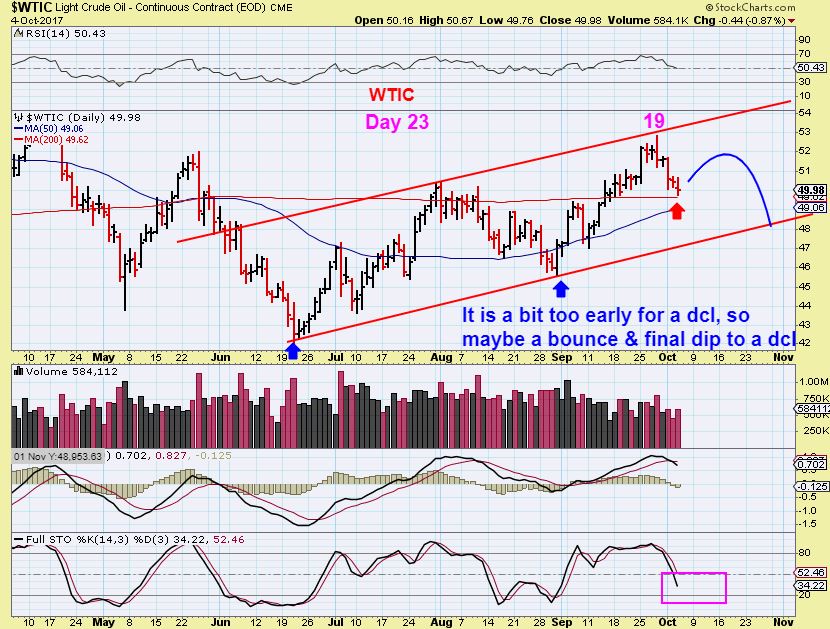
Reminder using the next 3 charts: I expected a dip and a bounce and drew it this way, hoping for a 1/2 cycle low bounce at the 200 or 50sma…
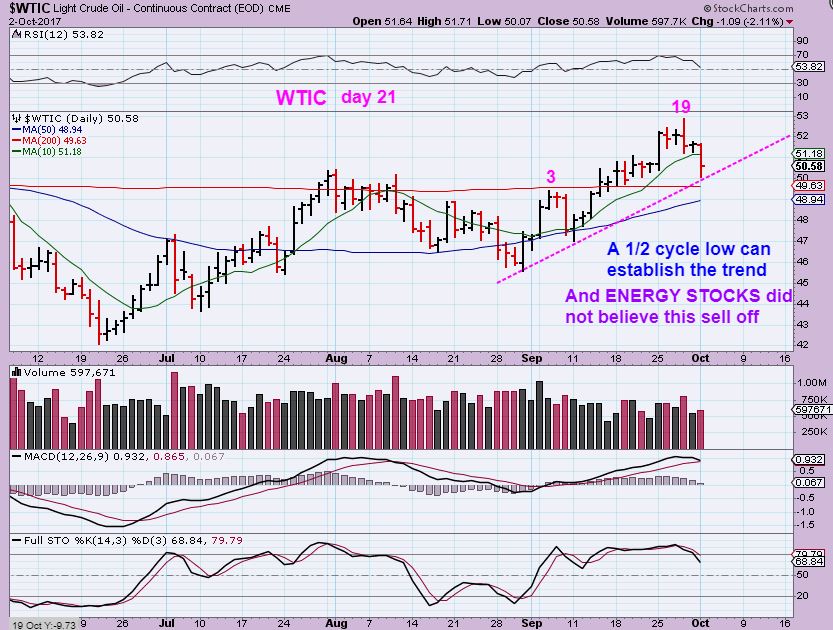
Looking for the bounce possibly like this, Energy stocks were holding up on this dip.
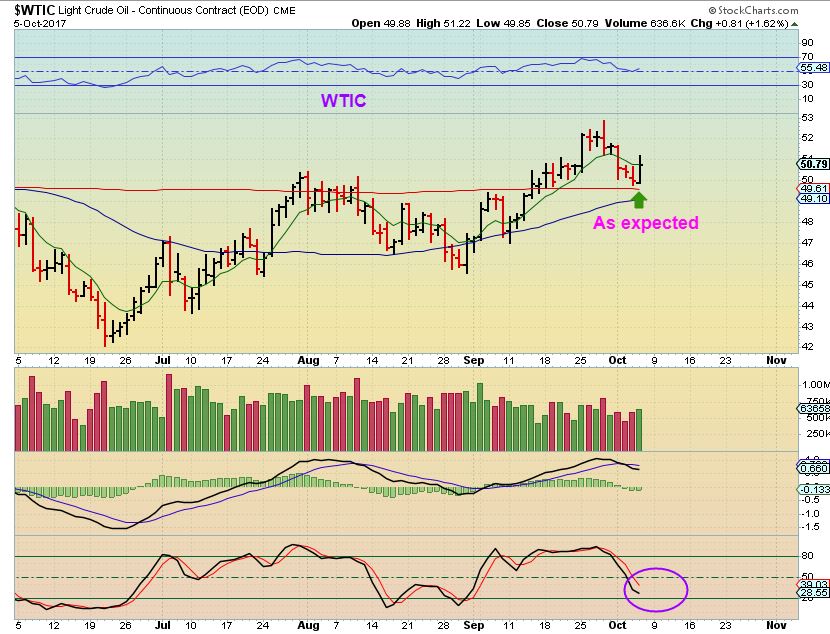
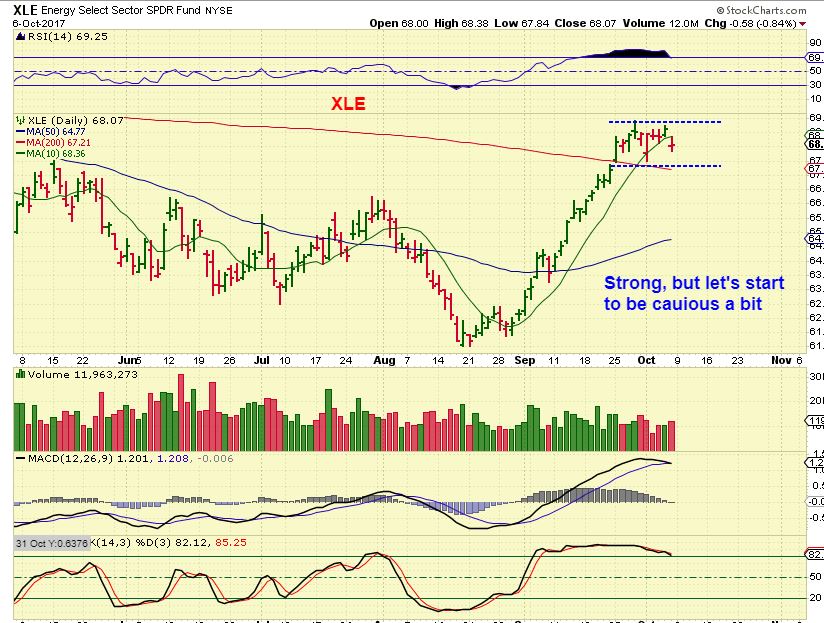
YAY- We got our bounce started here Thursday, but… it crashed Friday down to the 50sma. A time to be cautious in Energy may be here…
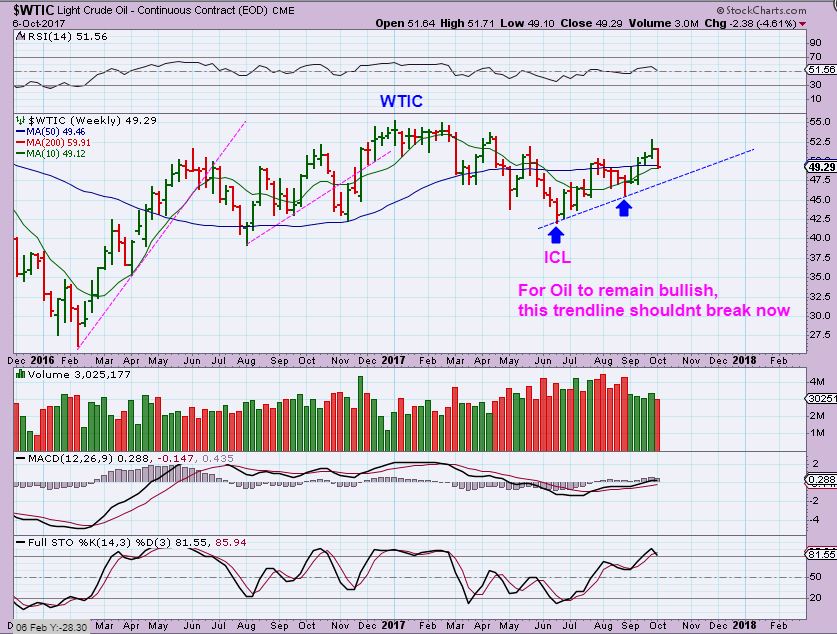
WTIC WEEKLY – Leaving us with this weekly chart at $49.29, on possible support, but closing at the lows. If we break this blue trend line, the entire Intermediate Cycle will be broken and a drop into an ICL could begin.
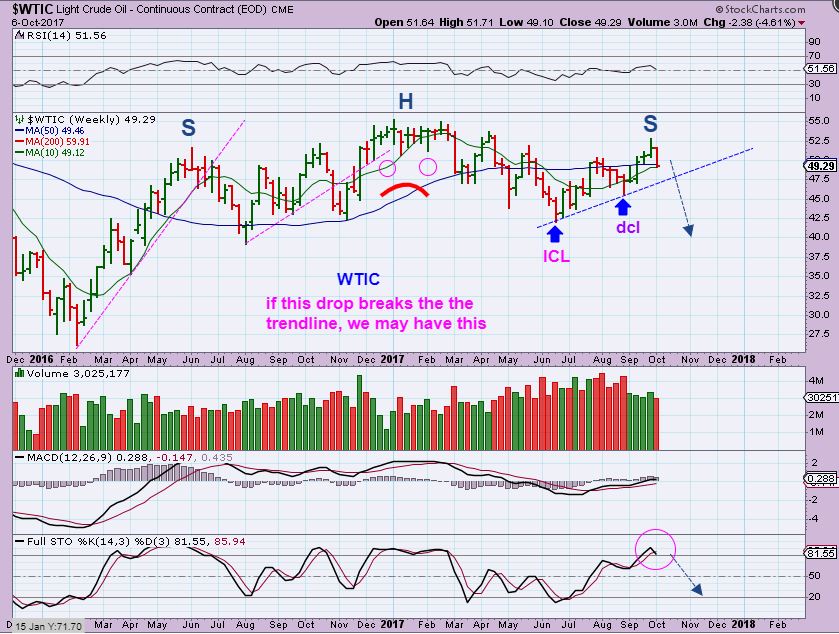
WTIC– And that big picture would look like this to my eyes. A giant H&S.
THE XLE does not look bad, but I just want caution in the back of my mind. Some Oil stocks look good, others may be weakening. Look at OAS and WPX with a 50sma and see what you think. They may be heading for a back test. A buy opportunity or not, we will know when we get there. HOS actually looks good, and I still own that one.
Sidenote: ERY actually looks like a BUY right now
NATGAS – The daily chart for NATGAS failed and broke below the prior daily cycle. It has basically been bouncing around sideways for weeks and weeks. I have not recommended long or short here for that reason.
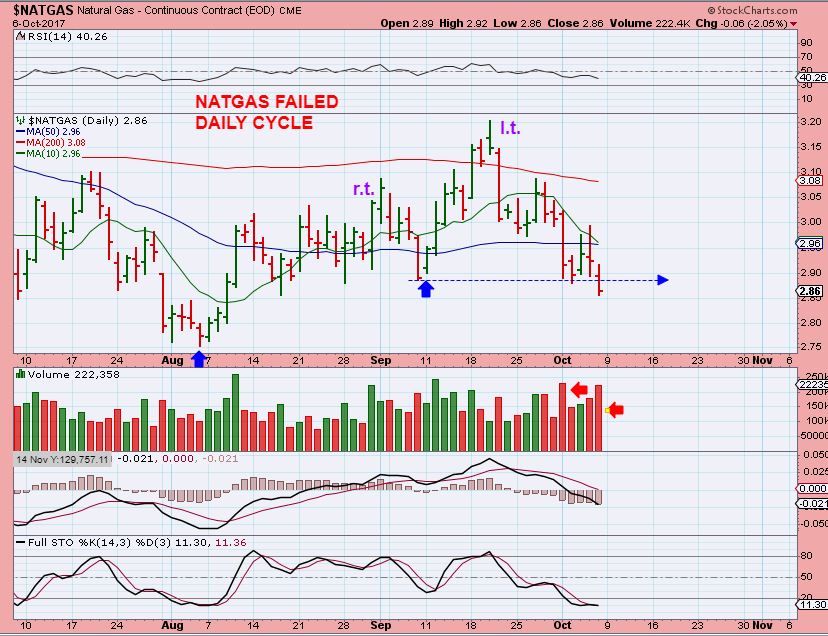
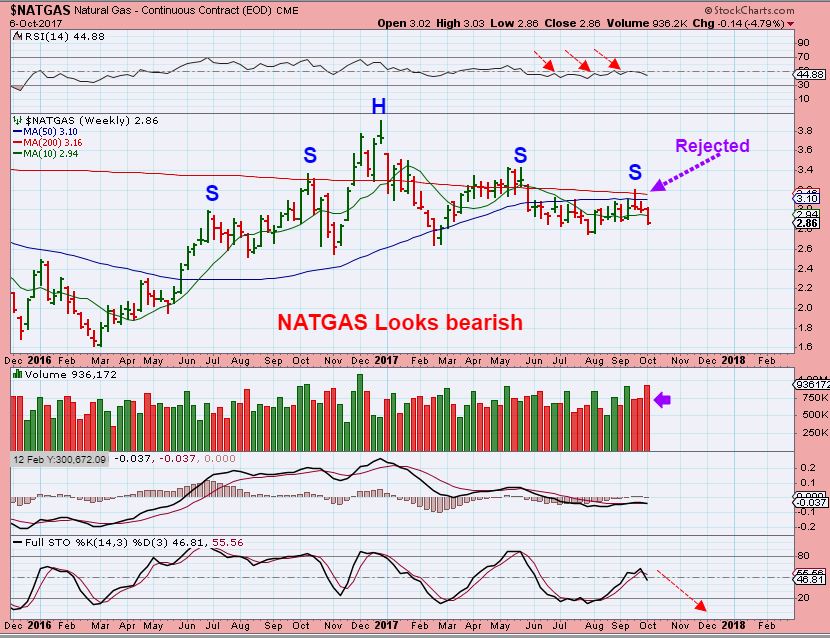
NATGAS – It is starting to look like NATGAS could drop though. Do not be fooled into think that with winter coming, NATGAS will automatically rise. I hear that every year, and I ignore it, it can be proven wrong. Check the charts in 2014 & 2015 Oct to Dec.
GOLD & MINERS – ARE WE THERE YET? I do think so…
I felt like I had to write an emergency Friday Gold & Miners update, because there were some getting frustrated and upset with this sector. People were becoming convinced that going short would be good. I wanted to point out that things were acting quite normal, some of my possible expectations were definitely happening. Fridays Gold section is worth re-reading. Lets see what happened leading up to Friday.
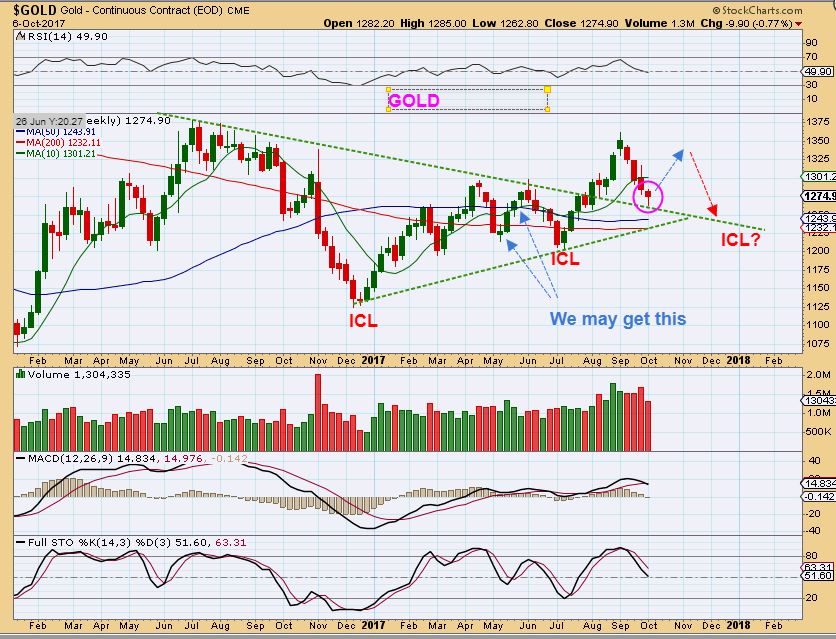
GOLD WEEKLY Sept 27, I thought that we could do a back test. It would drop below $1275 as shown if it back tests the break out of the trend line. Normal.

GOLD – We back tested that trend line last week, hit 1262, and we now have a reversal candle. This was NOT a horrible sell off, NOT completely unexpected, it is normal and was a possibility all along.
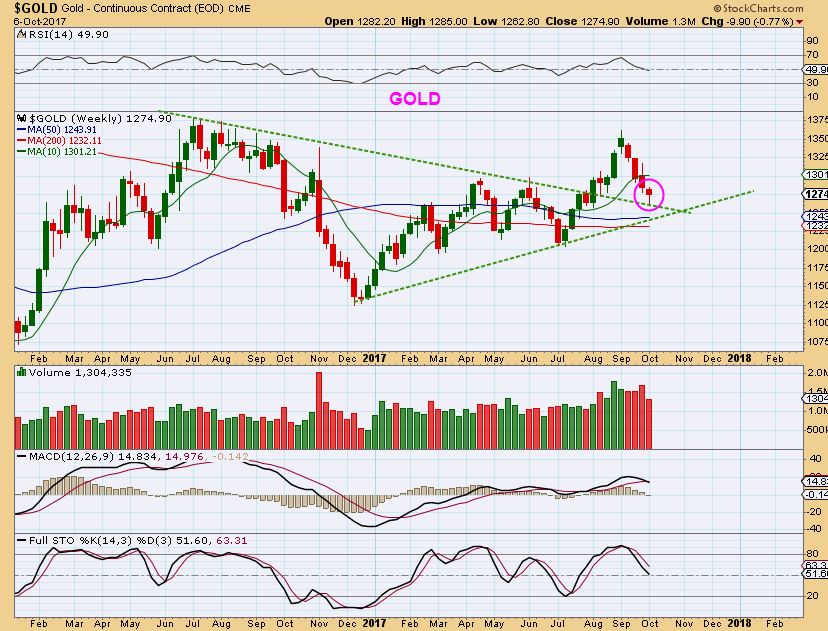
GOLD – I drew this last week and this is the updated version using Fridays close. So if we get a DCL and a bounce, we may only get this with the USD set up the way that it is. Then the USD could roll over and fail and Gold can put in an ICL and move out of a double back test.
MINERS
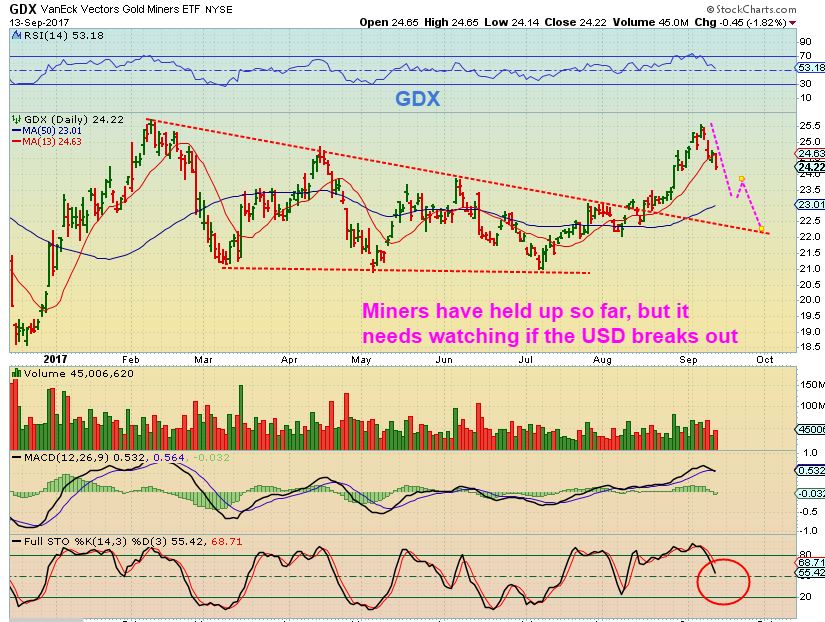
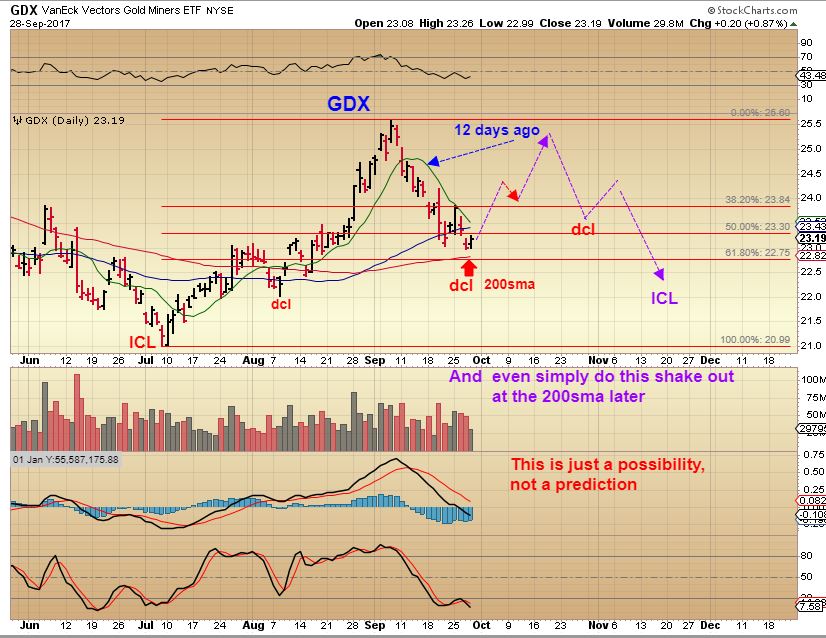
GDX – So WAY back in early September ( And here SEPT 13) I started pointing out this GDX back test too. It would lead to 22ish. Read this chart please.
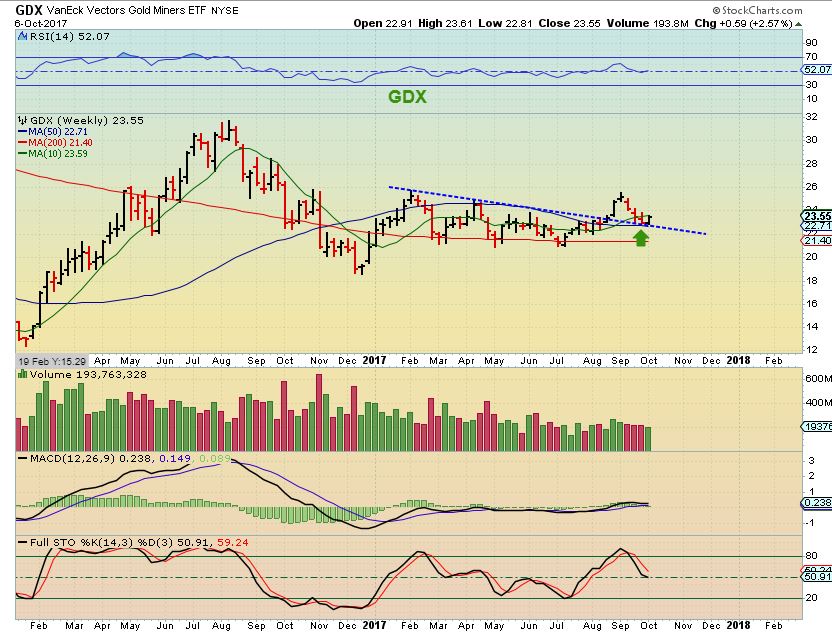
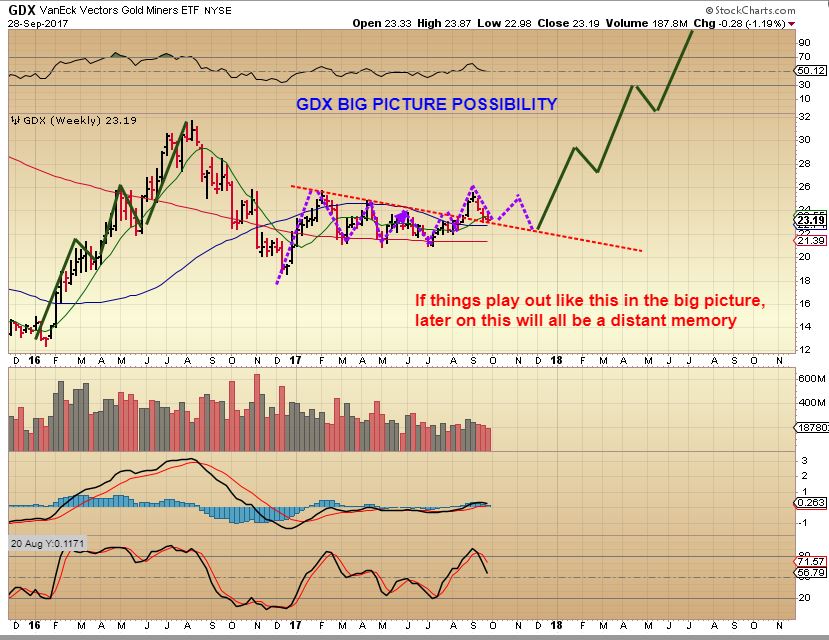
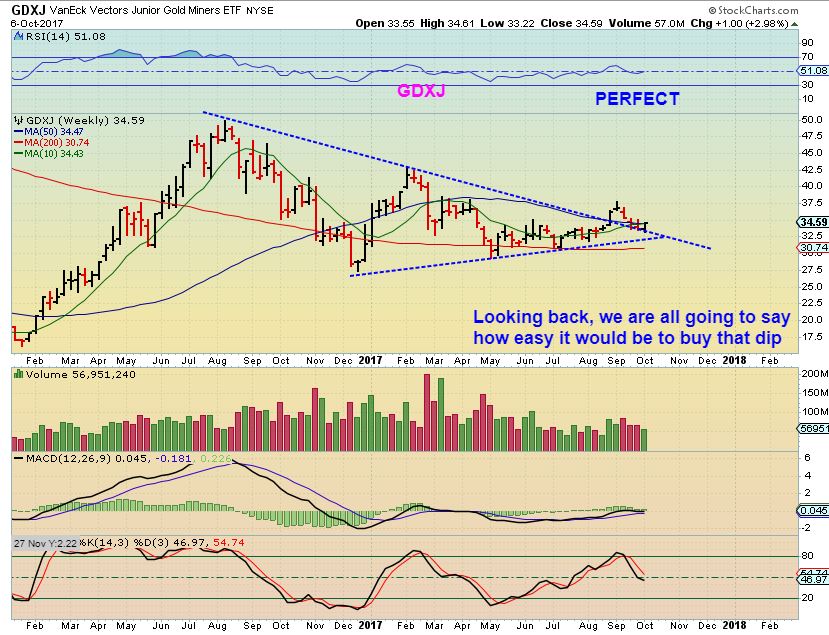
GDX WEEKLY – GDX reversed at the 22 area last Tuesday. We got a confirmed DCL in Miners and it looks pretty much perfect. Does this look bullish and easy to ride? Yes it does, it always does in hindsight, but emotions & frustration started to grip some. IF I Show this chart a year from now and GDX is at $60 then, will people say, “I would have backed up the truck and loaded up on Miners during that tiny drop!”
GDX- I felt the need to put this in Fridays report, because some were thinking that this small selling candle was horrible & ugly on Thursday, and wanted to go short. I wanted people to realize that the prior lows all bottom / bounce / and drop before taking off. This was normal, I was not concerned. See RED, Blue, And Green arrows. Again, this was NOT acting horribly, it was normal.
Gold dropped $10 and Miners hardly budged, down 20cents.
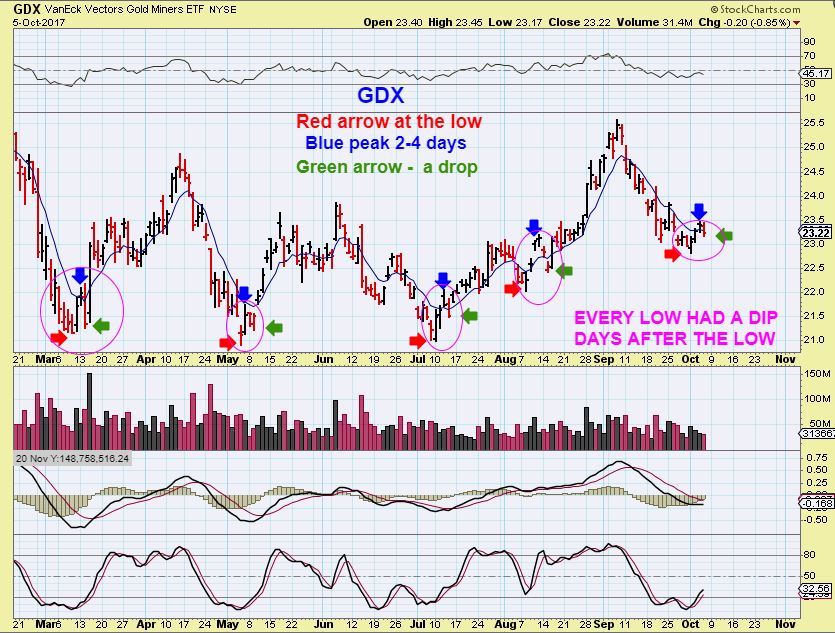
GDX DAILY – And there you go. I am so glad that I wrote that report Friday, hopefully people that were thinking of giving up or going short were influenced to wait and see. The DCL was confirmed in Miners, it was a BUY until lows were broken, and they were not broken. GDX acted correctly the whole time, IGNORING GOLD selling off $10 Wed & $10 Thursday.

GDX – At the end of September I wanted to show an expectation (and it is still valid, so let me review it again). This would be a move out of a DCL, it could last 8-12 days on average , before peaking. I WILL TAKE IT STEP BY STEP, IN DAILY REPORTS.
GDX WEEKLY – It would look like this, with the next ICL possibly back testing this trend line 1 more time. I just want to say that using technical analysis, this could just run higher. It is a break out, back test , and go… but we are cautioned using cycles and The USD ICL.
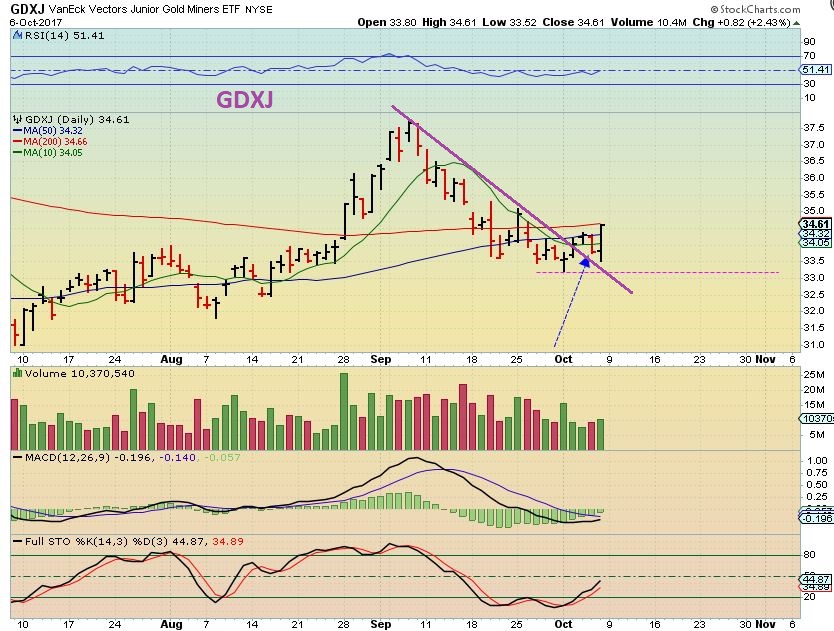
GDXJ – Look at Fridays candle. We see a beautiful reversal and the DCL was not violated. Yes this was day 4, I will take this step by step in the daily reports.
GDXJ WEEKLY- We see another Perfect back test.
Several Miners have been bullishly set up, and I have been pointing this out during Golds drop to build confidence. Along with the many others that I have had in past recent reports, lets look at…
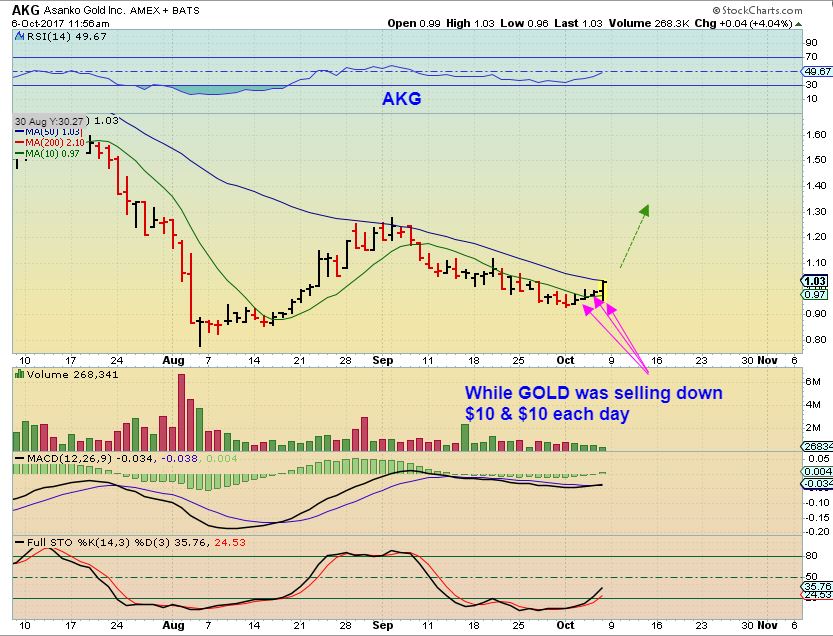
AKG – Did this sell off with Gold Wednesday and Thursday? No, it is up 4 days in a row lafter bottoming on Monday and now should try to break the 50sma. It may run and only back test this 50sma on the next DCL.
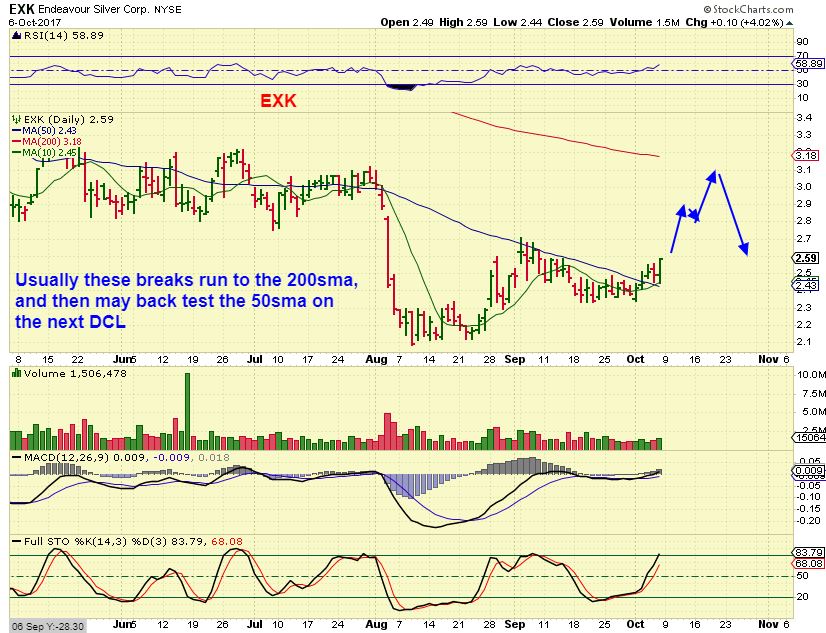
EXK – I bought this because it bottomed weeks ago and did NOT sell off with Silver. It broke the 50sma and crawled along it (above it) last week with Silver selling off. This is still a buy in my opinion. Imagine a quick run to the 200sma, and a drop to the 50 on the next dcl. That would be a 22% gain from $2.60 to $3.18. No guarantees, but I’m going to try it. 🙂
I believe that Gold will now put in a confirmed swing low, since the Miners have their low in place 4 days ago. Some of the set ups on Miners look Bullish and ready to move higher, even if you are just looking for a few quick trades and possible gain of 10%, 20% or more. The set up is low risk ( easy stop) and nice reward, this seems like a good time to buy these set ups.
~ALEX
EXTRA
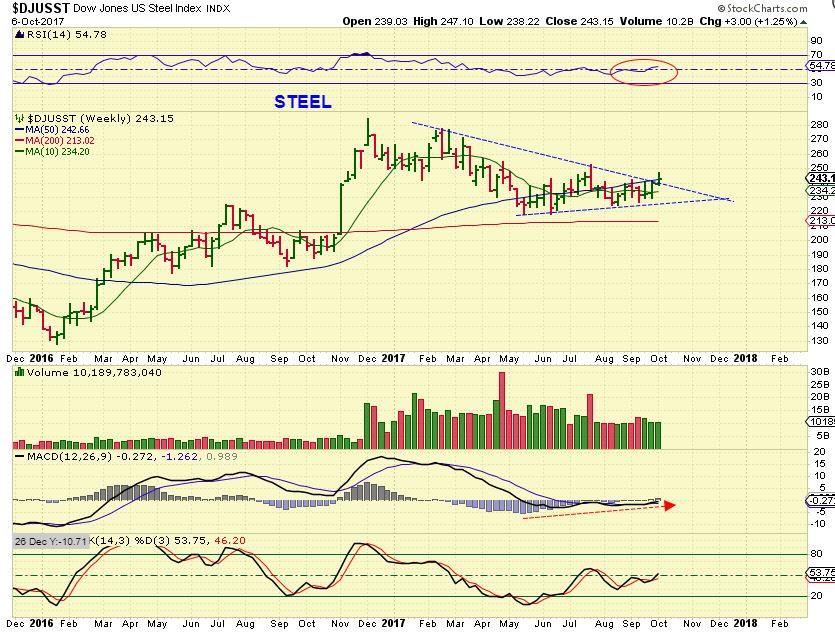
STEEL – Steel still seems to be acting bullishly, but the steel stocks started pulling back Friday after moving higher ( see SID for example). Most stocks still look ok, but use stops if you are in them, because…
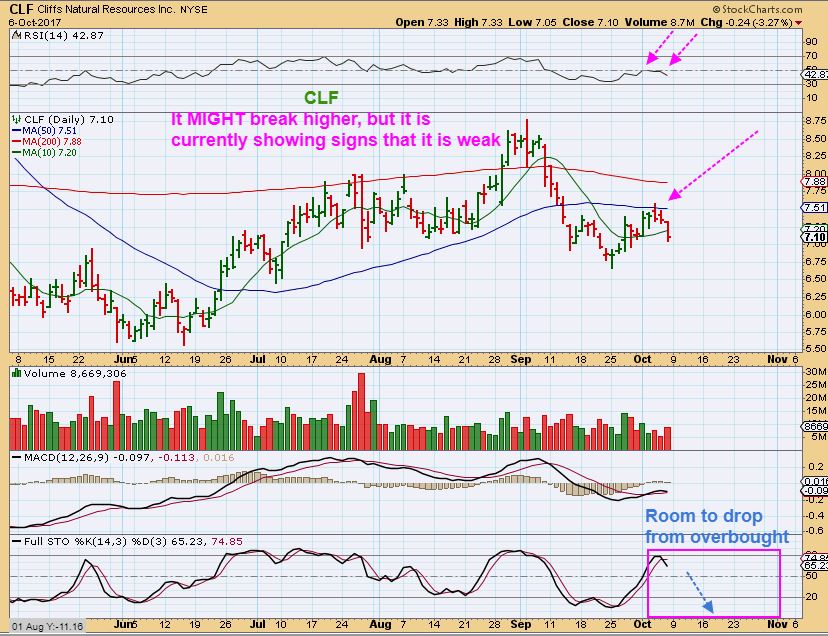
CLF – CLF is starting to look weak again. It ran higher, but was rejected at the 50sma. AKS remained above the 50sma, SO FAR, but I would keep an eye on these stocks. CLF has signs of weakness, see the chart.
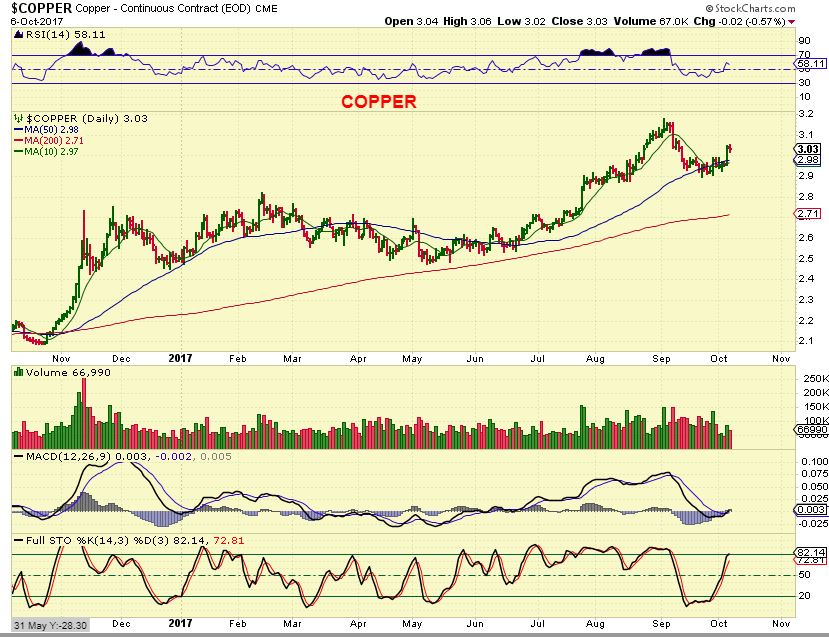
COPPER – The chart of Copper looks fine…
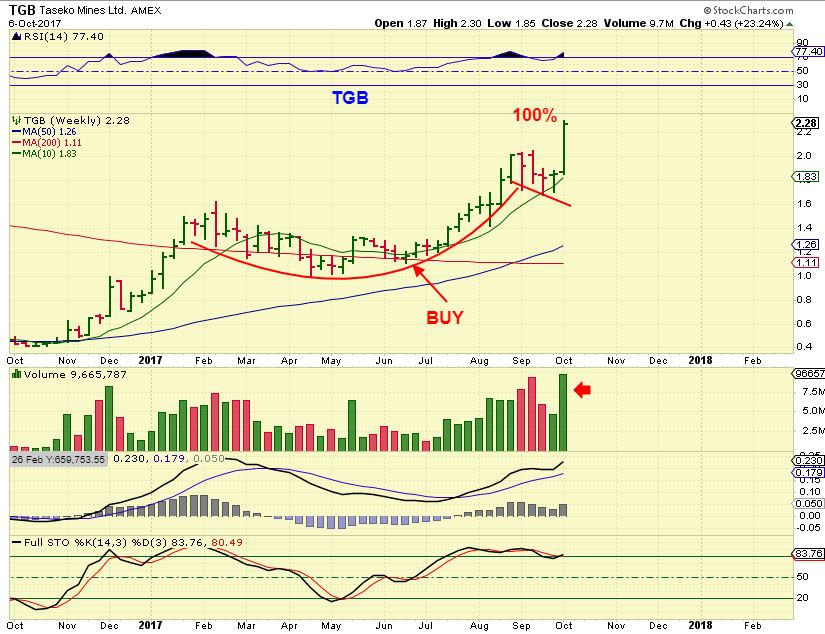
TGB – TGB really broke higher on Friday, up 23% for the week! This stock has been a real winner for 2017.
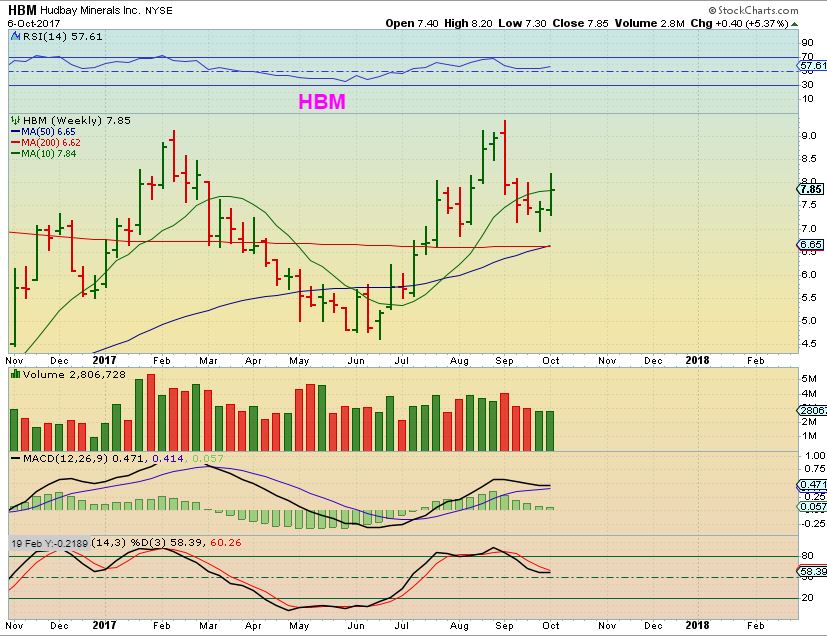
HBM WKLY – The weekly chart of HBM (copper) also looks set up to move higher. Compare it to the TGB chart above and they look very similar.
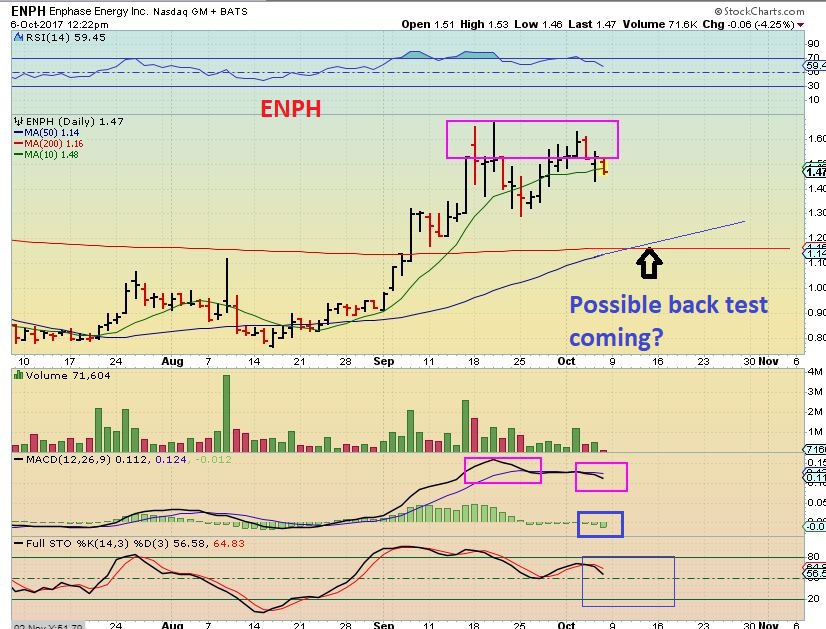
ENPH – I posted in the comments section Friday that I sold my ENPH, simply due to this double top. I like it long term and will look to re-enter later. It could just consolidate sideways, but I wanted to lock in very good gains with the MACD weakness and stochastics set up for possible selling. This stock doubled since August, so I will be looking to re-enter.
Friday October 6th 
 October 10th – Falls Into Place
Scroll to top

Awesome CF. TGB this second go round has me up 40 cents from entry. Can’t be mad at that at all.
Grabbed IAG as well, again…let’s hope we get some good follow thru… totally missed JNUG with the rest of you guys… I’ll catch it one of these days.
Thanks for the updates…
Still looking for the next set up. Have a great weekend and happy hunting all
TGB has been awesome.
article about AKG on seekingalpha:
https://seekingalpha.com/article/4078604-asanko-gold-crashing
That article is dated from June during the sell off into the July ICL.
Here is something a little more current –
http://www.marketwatch.com/story/asanko-gold-acquires-large-highly-prospective-miradani-gold-project-adjacent-to-asanko-gold-mine-2017-09-22?siteid=bigcharts&dist=bigcharts
like I said in the report – Gold was down all last week , AKG was up when Gold was selling off $10 / day. I remember when articles on Seekingalpha were all bearish for NAK when I bought it at 40cents up to $1.00 too 🙂
Alex.. check out GEVO (once again)..
what you think?
pulling back aftermarket Friday, but looks just about ready to rock
Hey SOG
Yes, GEVO looks rather good. It seems to be a ‘pop & drop’ base so far, but this will probably just pop & break out & run at some point, and it could be at anytime. The set up does look good
damn it.. s’on a runaway premarket..
was 0.67 when i posted… now +25%, at 0.84
Wow, back up near Sept highs. Big swings in many of these stocks bases
pop & drop strikes again!
Like NAK today too, but it may just be a pop & gap fill, and then higher later today or tomorrow.
I tend to like it when the gap fills if I own it, so we dont have to come back here next week or something.
set a limit buy at 0.67.. just got filled.
now plz get the hell outta there!
Thanks, Alex. Really helpful analysis. General question…when you recommend trailing stops, is there a good technique I can use to determine a fund’s volatility and the set my trailing stop as to not get shook out too soon?
I’m running into this dilemma with JNUG, TQQQ, SOXL, LABU, and UDOW.
Use the ATR, or average true range going back several periods. Many systems are set at (20), seems to work.
Thanks, Ralph!
I may have to google this, but can u give me a “ATR for dummies”
Hi Peter,
Those are all leveraged vehicles, mostly 3x etfs, so they move 3x as much as the underlying trade. Stops on these must allow room for the wiggles, but loosses can really add up if you are not in the right ‘timing’ for a low, and if you didnt enter near the lows.
I do not have a formula for that other then not buying 3xetfs very much above the lows- the swings are going to be big & very tough to ride, unless you get in near lows and allow bigger losses ( Allowing Bigger losses are not very easy to do).
I just went through a little of that with JNUG, but I was OK with it, because I felt that we were at the lows. I started a position a tad early near $19 – it popped to $20 and then dropped $18. Since it was a 3x etf, I had to allow over 10% loss to avoid being stopped out, but that is not easy for many to do. ( And I added too – due to my conviction that the lows were close, and this would lower my dollar cost avg).
So I do not have a formula for it, other than to know where we are timing wise, and know in advance how much it can move, and decided whether it is worth the risk. Hope that helps a little.
Thanks, Alex. I appreciate the response.
Tomorrow is Thanksgiving in Canada. Happy thanksgiving, everyone!…And to my 1/2 Canadian brother Bob..wherever he is.
How are the Miners going to move higher without you personally pushing your money ‘all in’ on Monday?
Oh well, enjoy your time off : )
Thanks Alex. Great report as always. I may dd to HBM today and consider taking a position in AKG. If we’re holding JNUG, I think we should count today as day 5 out of a possible 8 to be safe, instead of using gold for the count. Is that right?
Hi H50
You could to be safe, but
Personally, I am just taking the miners as individual trades, and that could also affect GDX / GDXJ – thus affecting JNUG & NUGT . So I am not using cycle day 8 this week to sell, when Gold will only be on day 3 by then. I take thungs day by day and use the cycle counts as a guide, and not a rule
MBOT 100k shares traded already
The big question….up or down 🙂
I just looked, I see up 10 cents on 136,000. I like that, that’s almost 8% 🙂
It was up over 14% when I got up, looks like a good day for the MBOT!
CF, just to be c lear, your small cap biotech plays like MBOT and INFI are longer term plays, meaning minimum several week holds or until they explode higher, possibly even several month holds, correct?
I don’t think that I ever said that? I usually don’t recommend Biotech as a safe long term buy & hold ( But they can be) Here is what my thinking is…
They vary. The sector is hot and so all of these bases are starting to break out as money is looking for the next big thing. It seems like mediocre news or at times no news at all just ignites the spark, and the bases have energy to push price upside.
Some may move higher, bases in place, continue higher and be on their way, while others may break out – get bad news or failed trials , need funding, etc , and drop back later.
I don;t know if I will ever say that any Bioteck stock is a guarantee and a great BUY & HOLD- I usually warn that they are higher risk due to FDA rejection, failed trials, etc. so it is buyer beware, sell the pop if you are happy with 10% gains….ride it to 30% gains – maybe get 100 – 300% gains. They all vary.
i guess we need to clarify our personal definitions of long term, even long term buy and hold. Excuse me if you think I put those words in your mouth, not my intention, I was just asking if this is more a day to day thing that we probably exit a week or two after taking the trade, or are they more a several week to possibly months type setups? I have beden so focused on miners, regrettably I have not paid enough attention to the other trade setups!
No worries, I didnt think that you put words in my mouth, I just need to repeat that these are tricky because of the sector that they are in. I was in an excellent biotech heart stock once and rode it from $10ish to $20’s and ip opened down big one day (Failed trial) and cut my funds big time.
I have been holding some for a week or two ( MBOT, MTBC for example), but I tend to sell a portion on the hugh=ge pop & allow the rest to move about to be able to handle the down days .
For example MTBC – HUGE pop & RUN, but I had to sell a good amount. That was roughly $1 stock jumped to $6! Yikes! SO I sell 1/3 or 1/2 on that kind of jump and now my original investment is back in my pocket with profit & I move on.
MBOT I still own and even added , because it is within the base.
So defining long term. Depending on how they perform, I would hold them for a week, 2, maybe 3 and yes, if it stays well above buying costs – hang on for as long as you want. No real recommendation on it once it gets moving. They can do whatever they want ( See MTBC)
Hope that helps – basically – they vary & could all do different things outside of the base.
Thanks, CF, clears it up perfectly.
1 more ‘guide’that I apply to Some of them ( Look at TENX with a 50sma and a 200sma), are beaten down & even gapped down big before basing. I View those as popping and running to the 200sma (And a gap fill). SO with TENX I bought it at the 50sma…
THAT is where I would sell 1/2 or all at the 200sma. TENX 6 month chart shows this example clearly
TENX is also the one that I mentioned on a 1 year chart is a base on base set up. If it breaks above the 200sma, the second base may send it much higher.
It will be intersting to watch how the miners come out of the overbought stochastics (5) on my charts this week, and could suggest where the next strong trend will be. It is preferable to me that GDX dosen´t come down too much and resists the pull lower, and would be a signal to buy back big positions in my miners. If it does get whacked, however, it will push back my expectations for when to take another shot with heavy positions, at least until the Dec-Jan time frame.
Look at TGB on a 3 month chart ( beauty)
Then look at NAK on a 3 month chart. Very similar, and NAK ( Gapped and closed gap) Does have huge volume for the first 1/2 hr.
I mentioned that I added to NAK 3times last week. This chart is set up similar to TGB short term in my opinion.
Toays gap fill doesn’t bother me, I think it is best that it fill the gap now & not later.
I still own the TENX that I bought last week, though it was down 4 cents this a.m. – these things give quite a ride 🙂
I popped in and out of RPRX this morning for a little pop……might get again at some point…lots of nice chart set ups…just knowing which ones will up and run….I’ve ordered a crystal ball on Amazon 🙂 🙂
Just took off 🙂
SRNE coming on with big volume
Was is you that mentioned this one last week? I jumped in and got some at the time…still have it….:)
I can’t remember if that was my mention or not! If it goes up I’ll take credit tho 🙂
I looked back at Friday’s report……it was you than mentioned SRNE….thanks!
Sure looks like this will be nice when it breaks out….!
Looks good, Another break from a base – nice call on this one last week
GNMX – I still own this one too. Looks like it may talke a few days and build a bull flag here.
I’m still holding that one…
Alex, Look at our old friend REEMF. I held it so long it had mold on it. Said to myself I’ll just put a limit order to sell at .21 and on Wednesday or Thursday it hit it. I had 20K shares and knew it was being accumulated but just got impatient. Wow
Hi Ed,
I did see that last week, it was on one of my wach lists – I keep my rare earth & uraniums on the same watch list . I didnt know anyone still owned it. That was a great pop Thurs and Friday.
Now on a 1 year chart, it looks pretty good again 🙂
SGSVF is a good miner, I used to own it a long time ago, but sold it because I didnt like the extremely low volume. It made it very hard to sell on down periods, but it has been trending higher in bullish manner, since the Dec ICL.
Yes, it has had some deeper pull backs, but bullish Higher lows higher highs for a year now
cycc maybe?
yep, when ? Cant tell, but it has started to trend slowly higher 🙂
I asked u about KEM, and u told me to hold. Of course i didnt… and now its up 5.50 lol
KEM actually still looks good (Also looks like a cup similar to the TGB chart 3 month chart )
Anyone in KL?
Yes, Bay. Been in it since 7/28. I’m a believer.
https://uploads.disquscdn.com/images/5e9db543fc1196d9a9987384fef8d299ad9acc3797107214e2fc65f5cec58303.gif
That’s helpful Edward. Thanks.
Here is the companion page, “CG” the stellar performer on this page is CAGDF in US market.https://uploads.disquscdn.com/images/3b2f785a4650626f3831dc390bfe1f1b76fb864aadb1cec2e4aed60c324269e0.gif
Very nice charts of KL & CAGDF – I just cant trade a stock ( CAGDF) with 10,000 shares traded on per day.
Canadian version CA.to – now that I could get into, trading millions / day
IT has always puzzled me that NGD & AUY are also low, and yet they are rarely the best performers.
May be low cost to pull it out of the ground, but not pulling enough being pulled out of the ground cancels it out?
Or it may be that it takes more to sell a stock than performance like maybe salesmanship. I can think of multiple situations in life where the best performers, be they anything, are not recognized by conventionally established norms. But, to your point there are obviously more metrics at work than what seems to be the richness of the vein or purity of the ore, certainly a big one is debt.
well done!
yes. took a position again after they bought in to Novo.
great add, Evan
thanks 🙂
Time to add to INFI? I think I will wait and see if we can get push a bit lower, another down day tomorrow and I will buy. Might not get it the way these have been trading lately, but a bull flag sideways with today setting the low range would also make me a buyer in a few days even at slightly higher prices.
Appears to be forming a head and shoulders pattern on 5 min. charts.
Quite the candle today, I hadnt seen that, been out all day
CLDX broke just through the 200 dma on Friday…hope it’s going to run now..
Just stopped out INFI at 1.37 how annoying
pierced the support to run the stops?
may get a retest… that was the spike ‘heel’, and now we get the ‘toe’ of the shoe (often happens.. jsut compare INFI with APHB 5min charts )
other alternatives.. APHB , having already pulled back nearly all the way, may wish to see how it acts first.. or GEVO (mentioned in comments below)
I’m now in all 3 of these.
wowsa.. APHB just put on 15% in the last 10mins
I know…..I’m hanging on by a thread and haven’t sold yet…..but…have had my finger on the button more than once this morning on this one….
Yeah, stop was above the 10sma, and the 10sma is usually a target in an uptrend. That is a bummer.
vktx 3 year chart looks nice
Alex. NAK doing more than fulling the gap. Time to worry?
I’m not worried about NAK at all. IT is above to 10sma, 50sma, 200sma. That is a healthy stock
SEMIs on Fire today. AMD, MU, NVDA, ON, CY – SMH SOXL
CLF on life support, ugh.
Alex, do you have TPs for your JNUG position, or are you taking it day by day as the DC matures?
Yes, and I think that I comments below too, to Hawaii50 about a similar day by day approach.
RonB’s SRNE looking good….I think once it breaks through that $2.20-2.15/2.20 area…..maybe it’ll go to fill that up gap to $2.90….hopefully!
EARS looks like it…just….wants…to…pop…..I’m waiting…you still in this one SOG?
yup.. still in.
its loitering with intent..
it has a possible obstacle for pullback at 1.15ish, assuming it gets that far
HMNY – Just incredible…
right?
😀
Crazy good & it isn’t just moving that way due to a bunch of reverse splits, like some other stocks do. This one didnt have reverse splits in the past year or 2.
CRazy big move.
cycc moving on some volume
I got in this morning…:)
hello guys 🙂
BAA is looking good.
https://uploads.disquscdn.com/images/4cdd751df64df05bd97ca95984720b62f4de82e88bff399f7759ca3964de5c4d.jpg
plus the low float.. One of my fav ones to day trade when miners get going.. Thanks for the reminder LeChiffre!!!
bonjour LeChiffre.
would like to,.. but can’t trade that one any more unfortunately.
ahah, feel your pain. lost some $$ on this one. But trading it strictly on tech. tight stop.
it did me alright last year.. but after price collapsed, it disappeared from the broker’s list
hi frenchie :o)
hi Maria :))
Do you own DQ – Very nice run so far. I know that it is one that you watch too
i did not take it this leg.. wanted to.. but my hands were full w/ others … bummer… looks good i know… i took KNDI …. they usually go together… sold too big of chunks on the way up.. same w/ HMNY…
who knew it would be a monster lol
Some really big moves out there, for sure
Nice trading with KNDI
Oh, Hey Le Chiffre – I just got back from being away all day and ran through some charts,
and posted that too 🙂 Skimming comments and see you posted BAA too.
There are a few acting well today .
oh! popped 0.06. Glad I added today :)))
Boom, up 25% now – very nice!!
BAA owns us a bit for its past behavior. ahahhaha
Anyway to make TRX stop sucking as well?
Hello GOLD spike!
Hate complaining on an otherwise positive day but really would like to see a bit more 15 cents out of GDX on a positive day so near DCL. Clearly we’re just not going to go rocket ship mode here, but a little more juice would help. So small miners had pretty impressive day, just really GDX that was lagging (at least off my watchlist).
$CAKE [daily buy]
good r/r with 50 ma just above.
+ target 200ma.
+ earnings 11/1
Alex, what do you think of the ARLZ chart now? Does it look like it could run again?
It may have to do some work first. IT is now dropping bck below the 200sma, may be doing a shake out or starting a consolidation. These often consolidate sideways for a while, look at HOS for an example of a run & sideways consolidation.
BAA following through from my low risk entry in a report 2 weeks ago – It’s about time, but it was waiting for the dcl apparently 🙂
https://uploads.disquscdn.com/images/50658670c90927d29d3074cce2a53e84096d344fbdd6e8e8adc7b2ab1d46bb05.jpg
Whoa! Just busted higher by a lot
Wow! And the Canadian markets are closed:-((( [not that I would have dug in anyway…lost a fair bit on that one last year on the way down, so I’m punishing it by not buying!]
I do the same. Maybe I should rethink, made me miss IPI this year. Drat
BAA closed up 30%.
WooHoo! oh wait, I bought EXK breaking over the 50sma, not BAA .
Congrats to any that did. looks very good.
As a stock market bull I thought I would mention that I sold some of my TQQQ today to lighten up as it appears it may be headed for a short-term dip or “DCL” as Alex would call it. I’m still holding a “core” position, just hoping to sell some now and buy back in lower. However, I have tried that in the past and usually the dip is so shallow that I end up buying back in near or above the price I sold. We’ll see what happens this time. Fingers crossed!
Also miners are very bullish on my charts. I’m back in JNUG/NUGT again. I bot on Friday and added more on the morning dip today. I’m making more money in miners than TQQQ, which is another reason I decided to lighten up on TQQQ and free up more cash for miners.
Good trading to all!
LGCY AND HOS ignoring Oils recent sell off.
Anyone notice GQMNF?
Dropped big time last week, reversed higher by 14% today. Could do an island bottom if it gaps up tomorrow (NOT A BUY RECOMMENDATION, jst may be interesting to watch).
EXK, FSM, THM, IAG — still look like nice chart set ups.
$AAPL is the short gift of the day.
+ Buy some NOV puts. (and go relax)
+ target 200ma. https://uploads.disquscdn.com/images/c99ad26be8b6f959ebf20d15b7824fa775a1e87dcba077fe92f0e51969c15669.png
I see it that way too for a few reasons, AND you are early or right on time really , before the bigger move down really even started, so you’ll catch most of that move.
this candle says it all.
Bear flag.
200ma touch and big bounce with some news on iphone X.
It does look like a bear flag and a little bit of a back test of the break down below the 50sma ( Didnt tag it, but doesnt have to ).
look at the top pressure
https://uploads.disquscdn.com/images/28cda304fd5be947ae0bdcd480b98c380fefb55c9d87a98e3c662c0339507390.png
I think I put JRJC and SIFY in a report last week, along with GRPN, PWXLW, HPJ, etc but I cant find my SIFY chart.
JRJC tagged that 200sma today on this chart that was in that report. SIFY reached upside target and dropped through out the day.
https://uploads.disquscdn.com/images/5c5382b4d88176201682a19c37e7f01e1d8721f966b609ee174ab3689d11e2f3.jpg
Sweeeet
MBOT made a nice comeback into the end of the day – that may be good for tomorrow.
Hey- Markets are closed already! Fast day, enjoy your evening all!
Sure was fast, I just got up a few hours ago! 😛 Seems that picking up MBOT during intra-dsy volatility might be a pretty solid strategy. May look to add tomorrow.
You are confirming the fact that I can never move to Hawaii, unless I retire from trading & market reports .
That is a tough time schedule
I was also off work today. I’ll be up much earlier tomorrow. Definitely a great place to vacation and have fun but it’s so different when you have to work and do “normal life” and not just vaca time!
Well, ok we did take the kids to the water park today and then went to one of my fave snorkeling spots where we saw two sea turtles. So, yeah that was cool. You will have to retire one day! (Or you could trade Asian markets!)
Hey is it just me? Think or swim shows daily volume on Nugt as 60 million, all other sources show 4.191 million shares? Same as Jnug TOS shows 135 million while other platforms show 8.65 million shares???? Anybody else trade with TOS?
Worden shows 4.2 million for NUGT
I’m seeing 4.2 million, same as SOG
RDFN could launch.
+ daily buy for me.
+ breakout of TL and back test would ideal https://uploads.disquscdn.com/images/2a07b551f27033051ebfdc4fda978bbd8f504180b968661fdfd5571c20a94315.png
I looked this chart up – and it looks very healthy . I like it too.
TUESDAYS REPORT HAS BEEN POSTED