Fridays Trading
Friday – The final trading day of the week. Today I want to cover Oil, Natgas, Gold & The Miners, and some trade set ups.
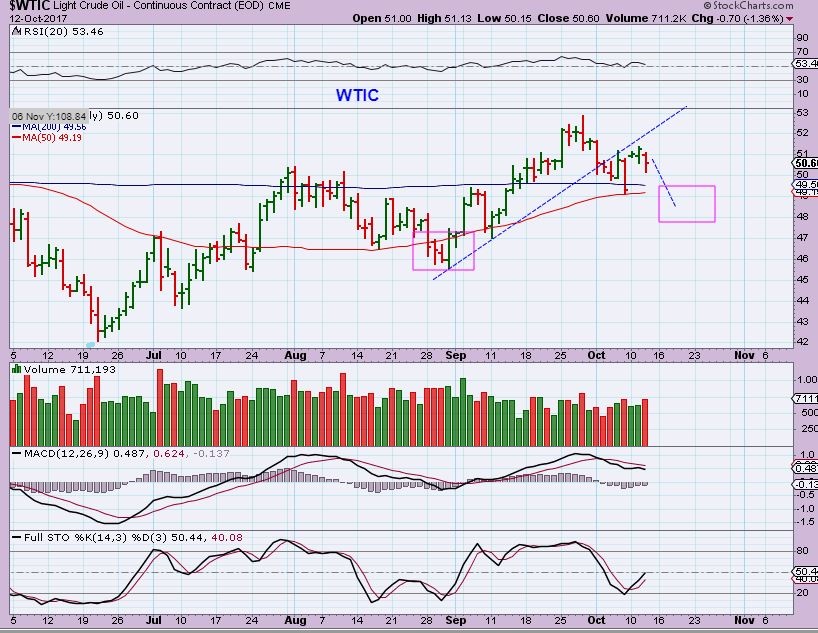
WTIC – In my last report I mentioned that the bounce off of the 50sma was on day 25, and that seemed too early to be a dcl in Oil. I also showed a number of Energy Stocks that do look bullish, but are not oversold and dont quite look ready to go yet, so what did we see on Thursday? When I look at the last dcl, we had a small bounce off of the 50sma, and then a shake out drop (Pink square). I still wonder if this is the bounce off of the 50sma and next is a shake out drop to the dcl. Then the OIL stocks may look closer to a low risk buy. I’m not buying in the Oil sector yet.
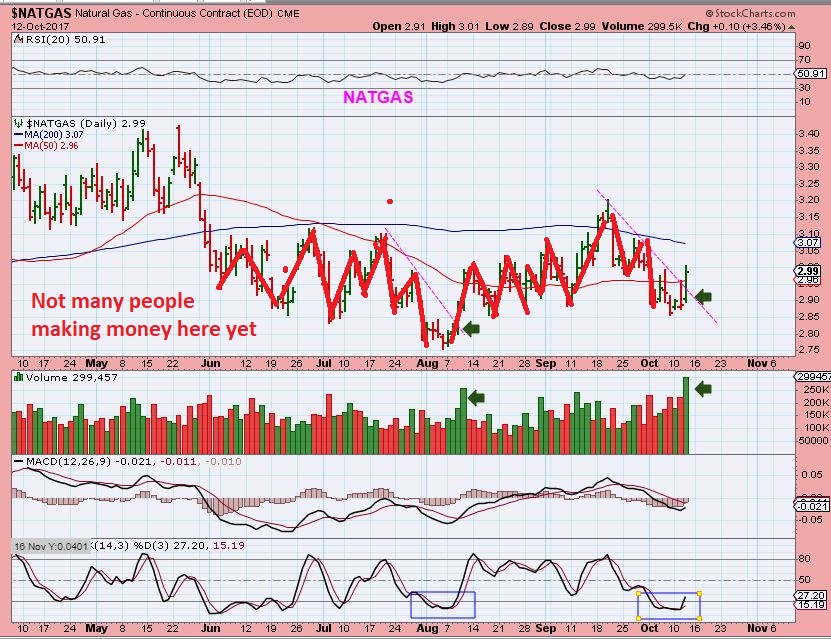
NATGAS– I haven’t been trading NATGAS due to the choppy consolidation. NATGAS inventories come out on Thursday and we saw a good POP in Natgas. Natgas looks to be on day 3 of a new daily cycle, as it closed above the 10 & 50sma and broke above the downtrend line. All of this choppiness has happened with NATGAS trapped under the 200sma. Maybe it has built up enough steam to blast through and put together a lasting run now.
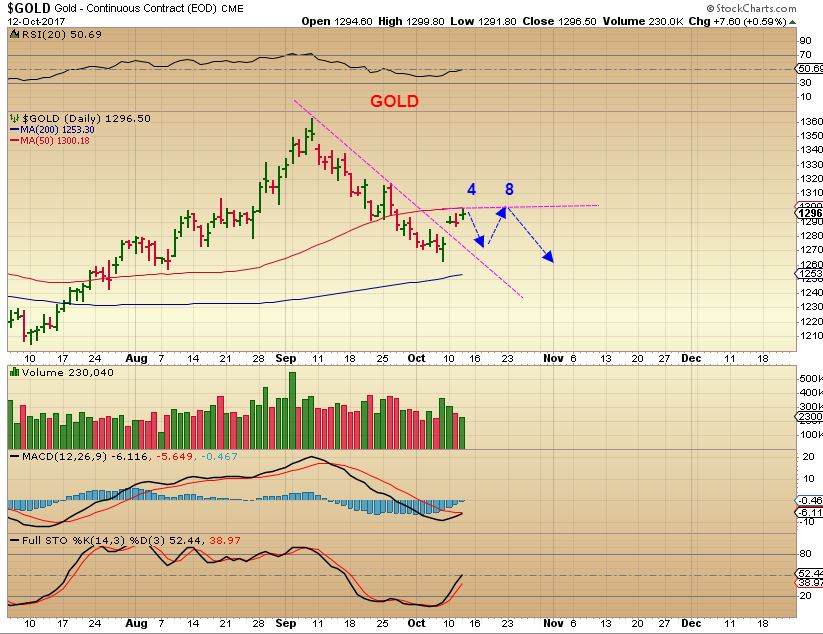
GOLD – Gold CAN go higher, above 1300. This chart is not a price prediction, it’s just drawn this way as a reminder of our expectations of weakness. I wanted to point out that GOLD may not go much higher for 8-12 days, it could just bounce around. I am expecting the USD to put in a solid 2nd daily cycle , and this should push Gold down into a dcl.
GDX – GDX peaked on day 6 so far, and today will be day 9. I am not expecting a rally above Sept highs, I’m expecting this to peak here or pretty soon, and then for it to roll over into a dcl as the USD rallies.
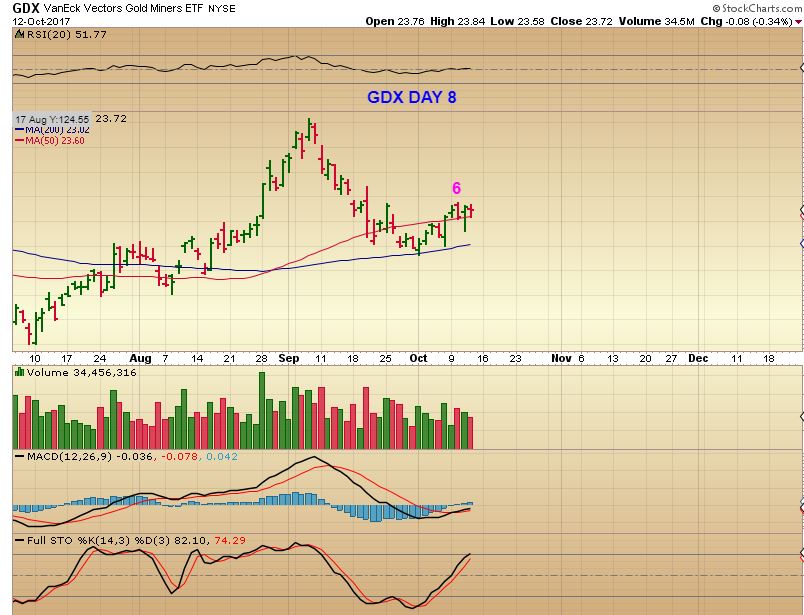
I mentioned that I already sold all of my leverage. I can’t say whether this sector will get a good pop higher over the next couple of days ( it could), or whether we’ve seen the highs, but leverage is not something I am comfortable holding beyond this point.
I want to discuss some trades and trading
MSFT– As you can see, this is a great run by MSFT. It has almost doubled since I called this a “Long Term BUY & HOLD” back when it was consolidating, but that is the point of this chart. Look at those long consolidations in the boxes. I am always pointing out that the reward is great, but holding those consolidation periods is difficult and even boring at times. This is a weekly chart and those consolidations lasted for many weeks. With that in mind…
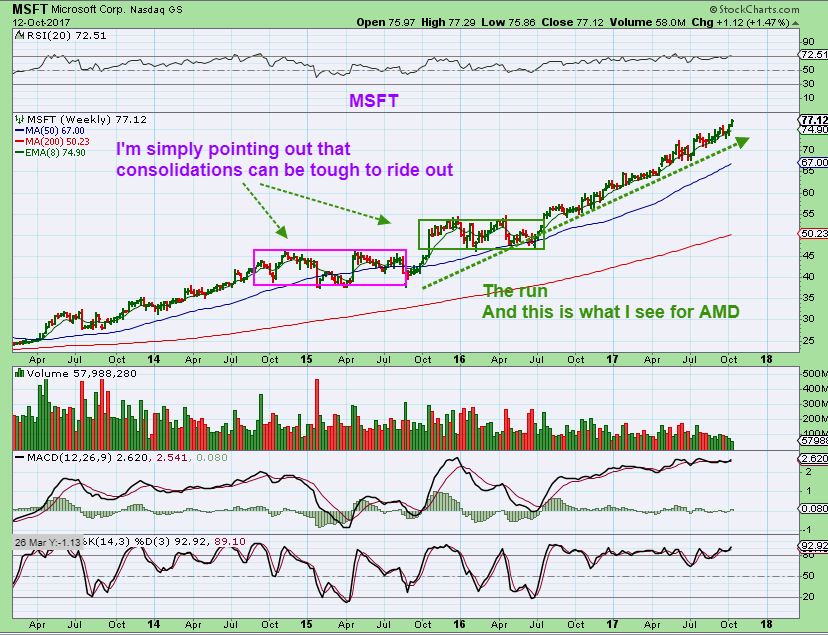
AMD– I recommended AMD as a BUY & HOLD at the $10 area, and it is also going through a long multi week consolidation. Yes, this can be boring and difficult to endure, but I still think that it will be rewarding, especially if we get a parabolic ramp up in the General Markets. Notice the end of 2016 had a consolidation period too, and price ramped right up out of that one. Now let me show you the real potential…
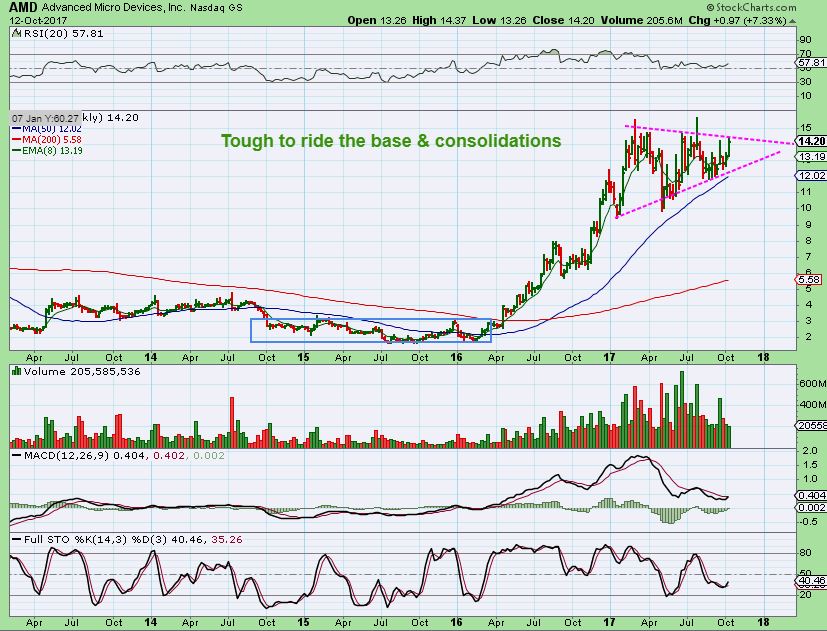
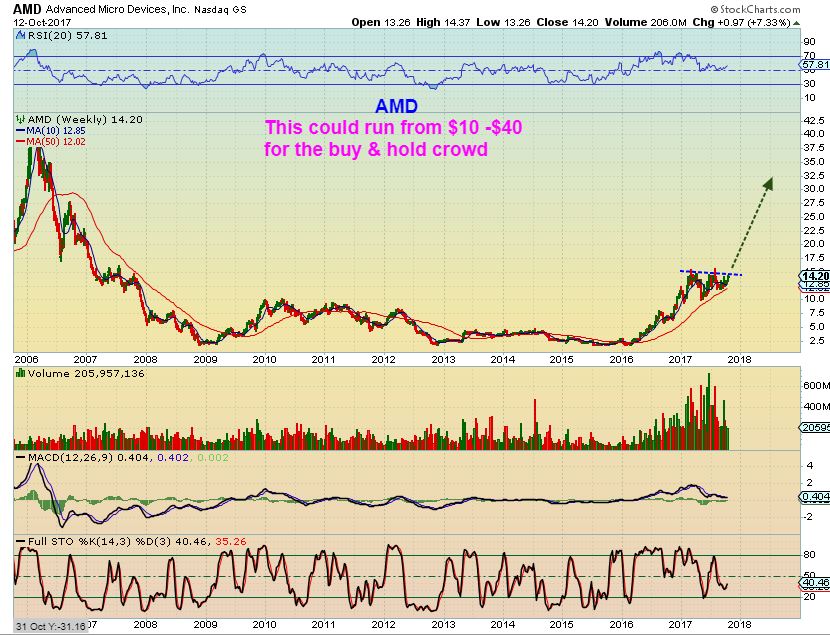
AMD WEEKLY POTENTIAL – Just like AAPL and NVDA – someday we’ll look back and someone will say, “How did we miss that bull run?” – lol
IS TWTR A BUY & HOLD CANDIDATE?
TWTR #1 – I believe that it is in the base stage ( Notice that AMD had one too). The problem is that we can’t tell how long the companies will base out, so some just wait for a complete break out before entering. This looks like it broke out above that blue down trend line though, and back tested. It is still in a base, but may be ready to break higher.
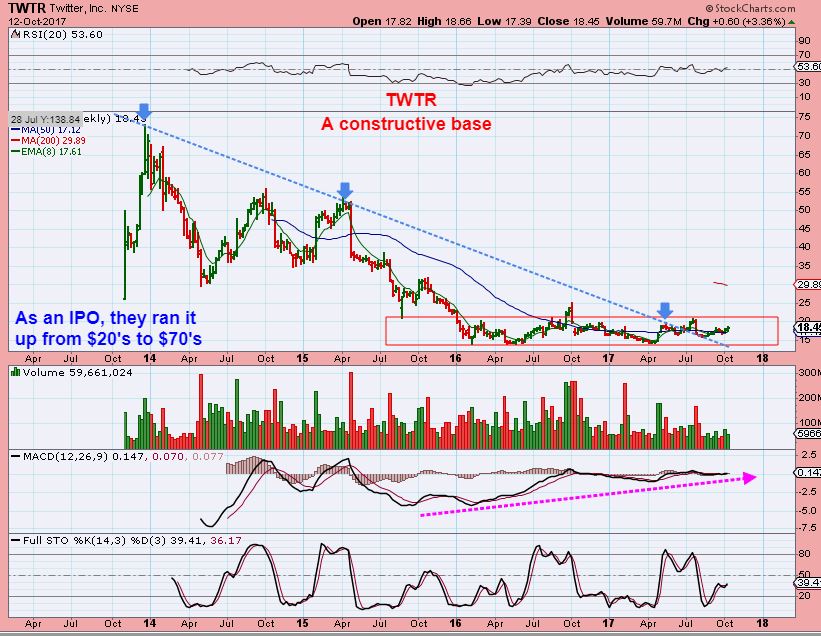
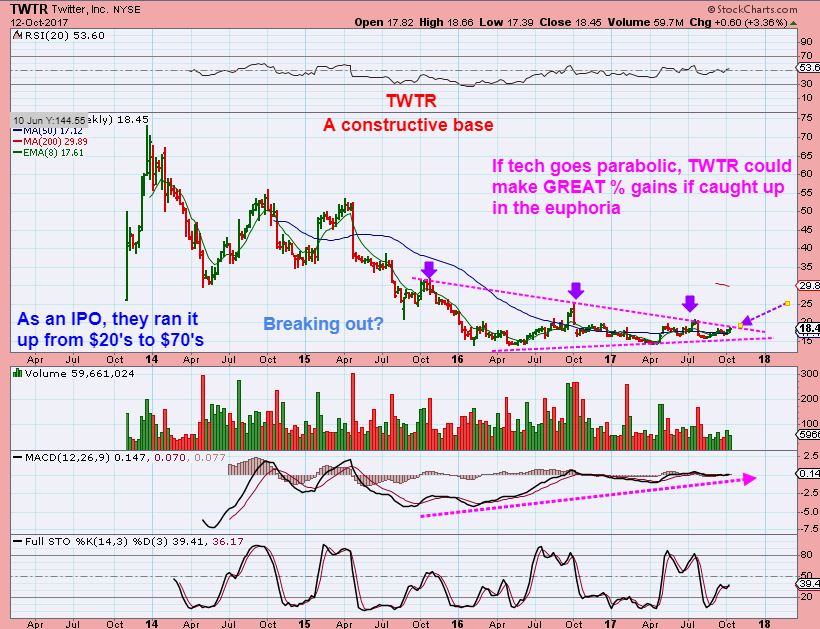
TWTR #2 – It also looks ready to break out from a shorter term triangle. Look at the potential in TWTR over time. It ran to $70 as an IPO.
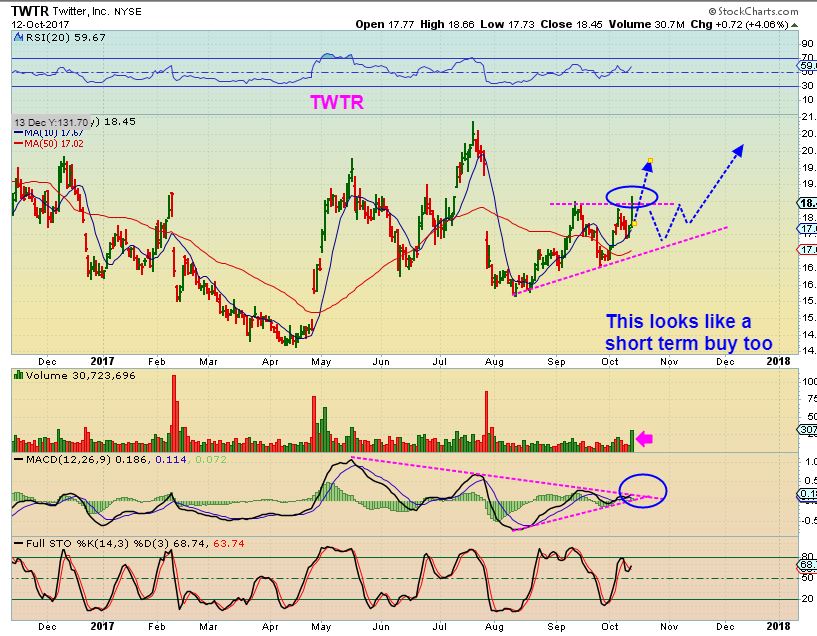
TWTR #3 – This looks like it wants to break higher shorter term too. From $14 to $20 back to $16 and now rising. It is not easy to buy & hold, but this does look almost set to break higher in this wedge.
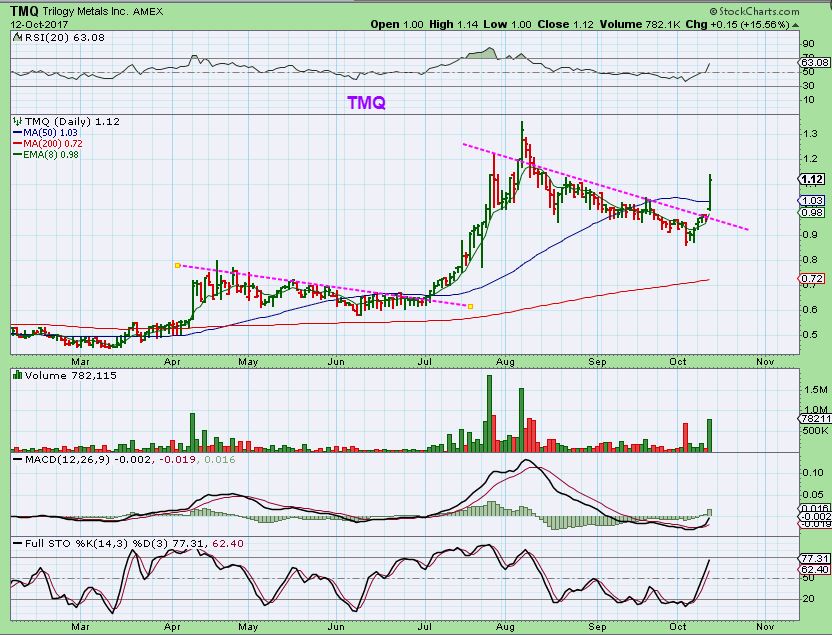
TMQ– TMQ actually broke out and ran 15% yesterday. This spring TMQ was under 50 cents and is now over $1 again. Long boring consolidations and then a nice run higher. It looks ready to run to new highs.
I’ve been talking about and pushing NAK for a while now, but I just wanted to cover it again, since it continues to act correctly .
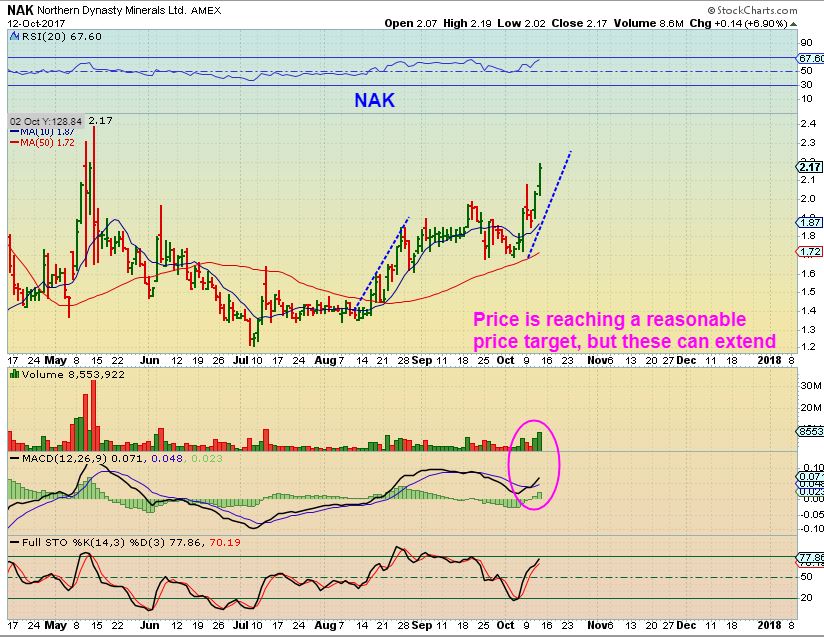
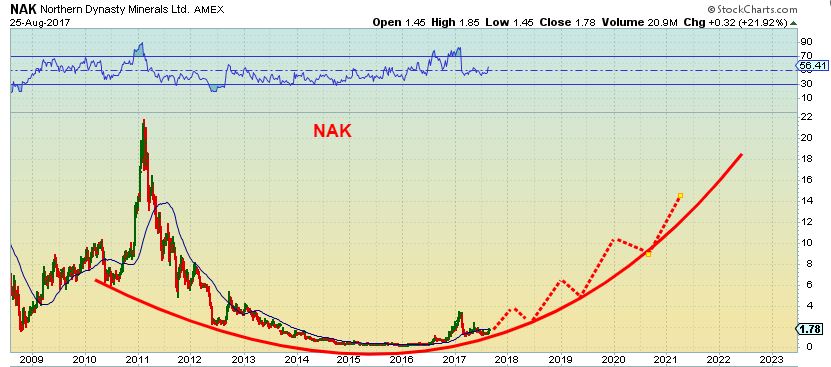
NAK – Nak added on another 7% Thursday, and is reaching a ‘conservative price projection target’. It could tag $2.25 to $2.40 actually, but …
NAK – This was my Sept 29th chart. Longer term NAK should complete this large cup formation, as I have pointed out in the past.
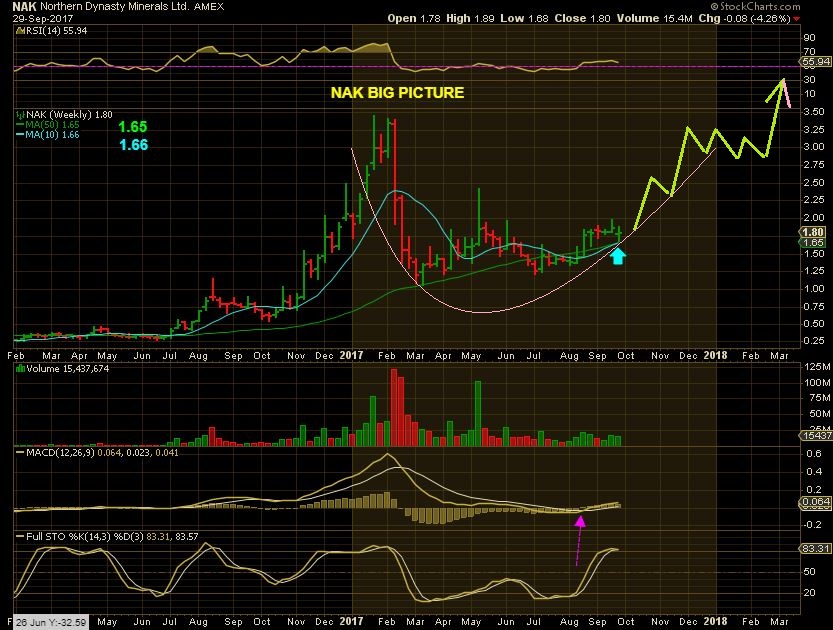
NAK CURRENTLY – So even if it doesn’t make a straight line move higher, this is another longer term BUY & HOLD in my opinion. I have stated this in the past too. Let me give you a bigger picture view again.
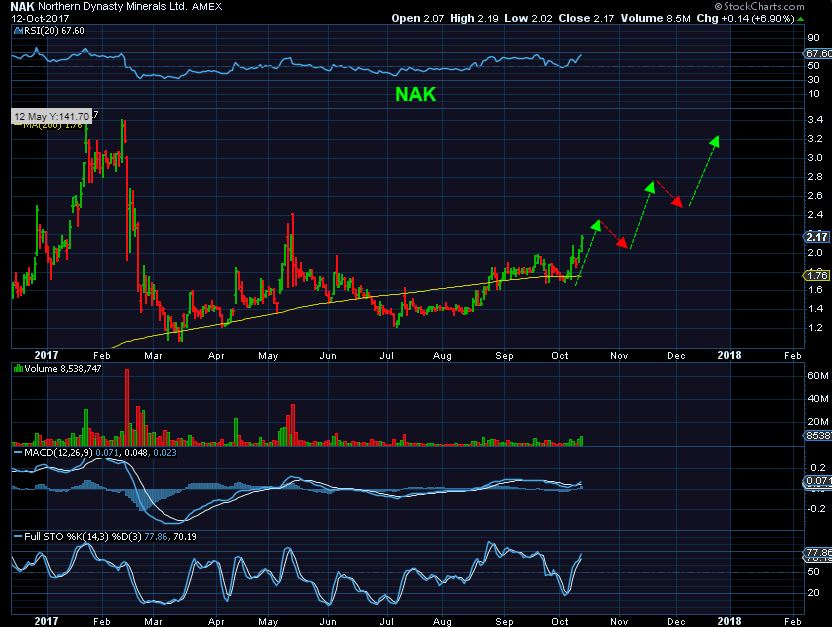
NAK – Notice how NAK makes a strong run, then consolidates for weeks, even months, and then runs again. Look at the 2016 consolidation, it is very similar to the present one. Look at the run that followed.
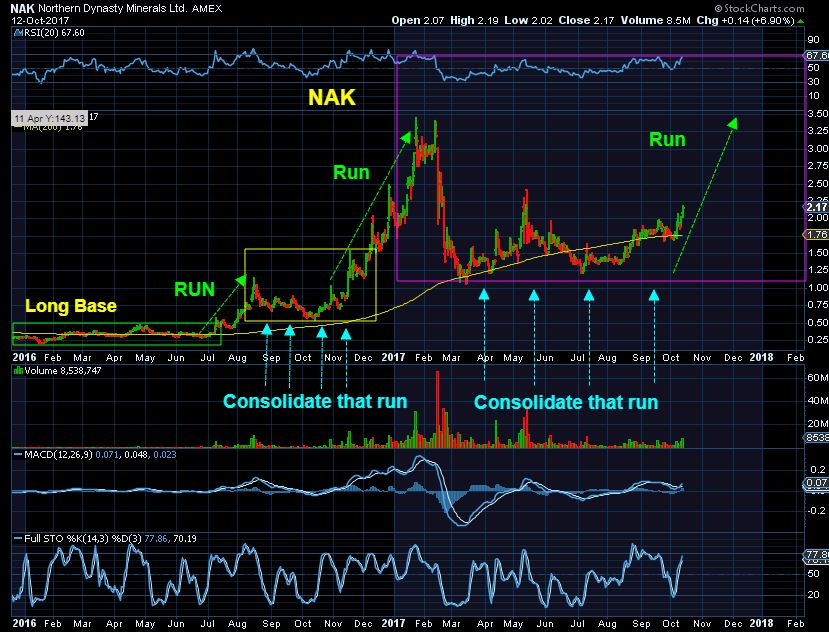
And this chart I drew for my readers in August 2017. If their mine gets up & running, their prospects are stunning. NAK claims to have 70 million oz of Gold and tons of Silver, Copper, Molybdenum, etc. It will be more than a $20 stock if they can partner up and start Mining, but that will take time.
BIOTECH BASES
.
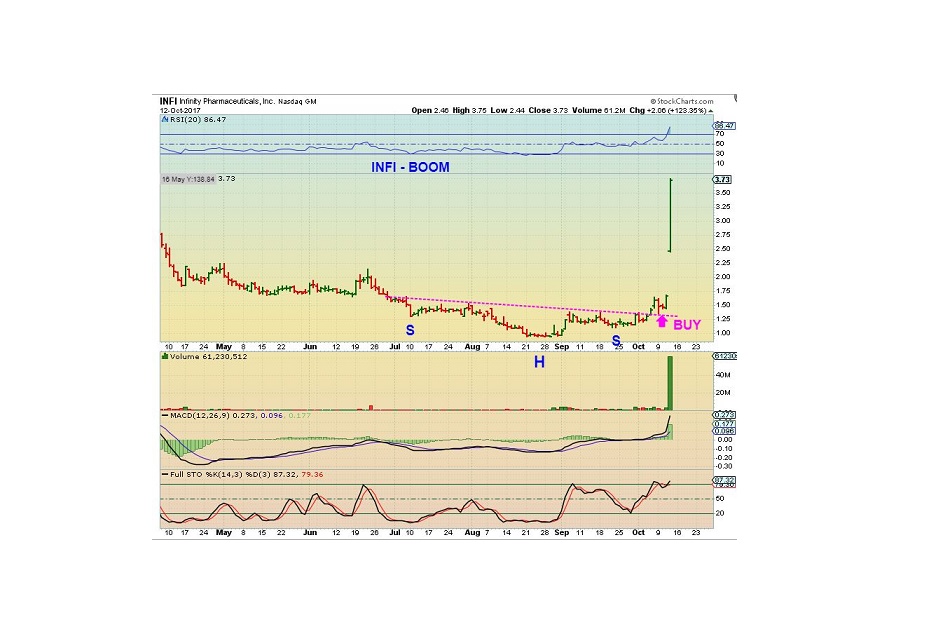
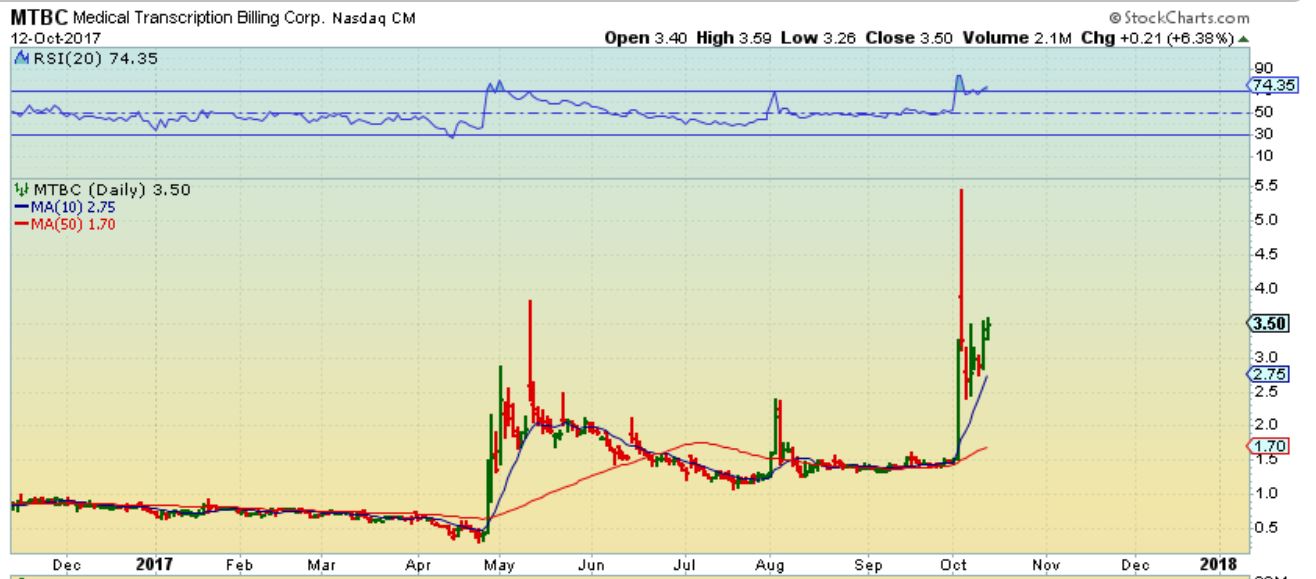
My Disclaimer has been: There are NO GUARANTEES in this sector, but certain ‘set ups’ can build energy for a rapid acceleration higher, and we have been seeing that. When I bought MTBC, for example, it Popped and more than tripled in 2 days! See the chart below of that day. Yesterday INFI doubled. The set ups are explosive, but this is not a get rich quick plan. There are risks, so position size should be reasonable, and these trades are NOT FOR EVERY TYPE OF TRADER. They move fast in both directions.
INFI- Well, it was ready to break out back on Oct 4th here, and I mentioned that I was buying it Wednesday as it broke from this mini base on base. Quite a few have mentioned that they bought it too…
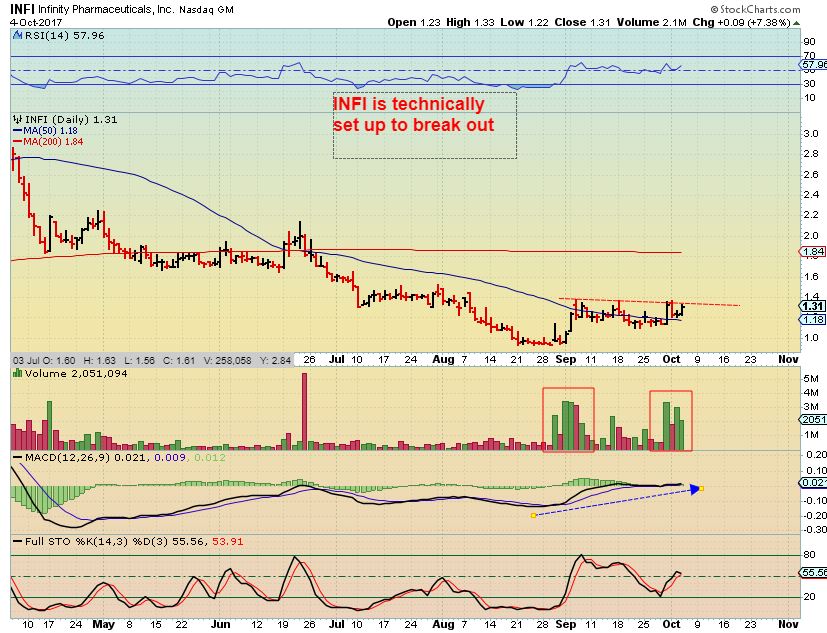
INFI – And it Popped 123% Thursday. Many of these Bases have been exploding in this sector on positive results, and we have seen major moves in this sector as a result. Why not look up charts of ECYT, MTBC, INFI, MNKD, etc . for examples
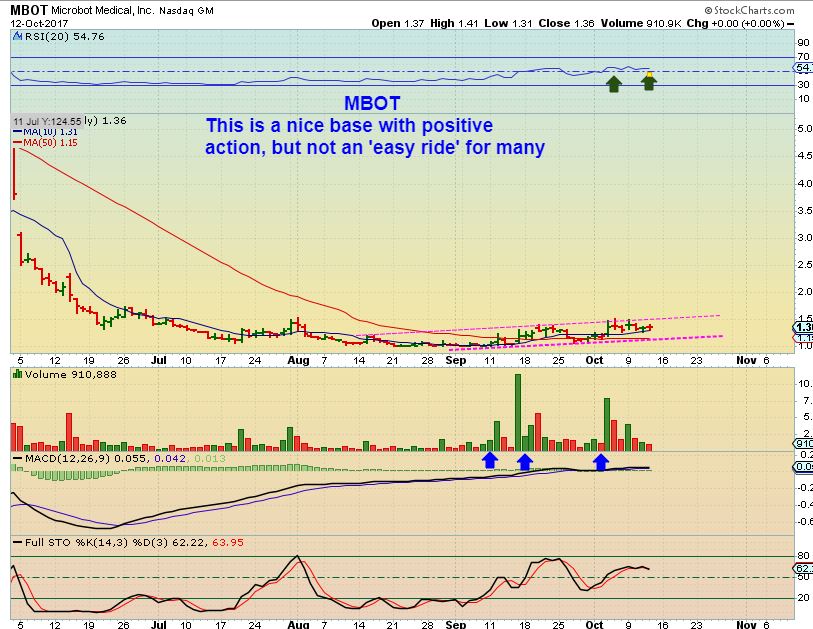
So again, I have been buying positions in some of these Bases if they have a proper set up. I have been posting many charts of those bases and their set ups in past reports, and I am still in MBOT and a few others. I’m not just buying to hopefully grab a 100+% explosion, but that is nice. I am looking at these bases as possibly constructive set ups for future moves higher at a normal pace too. Let’s discuss a few more set ups.
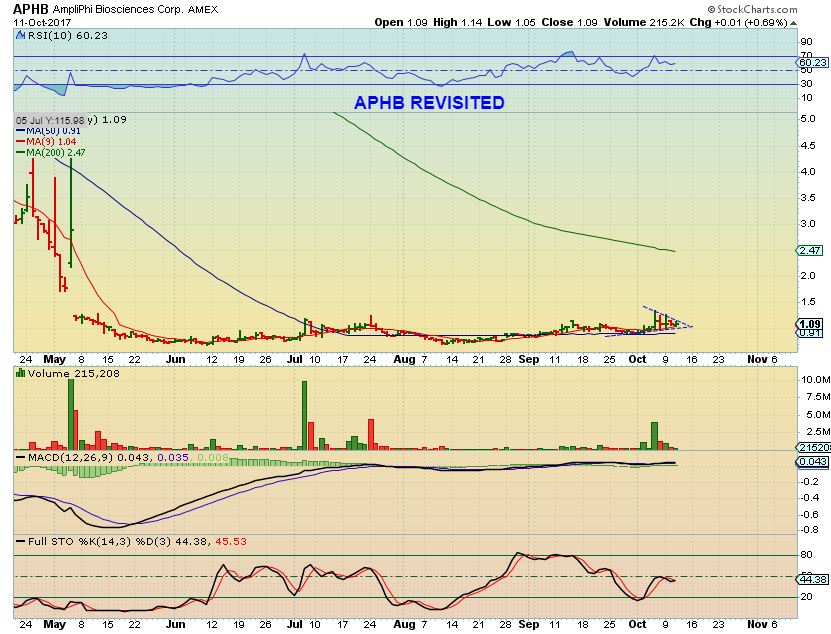
APHB – This was in yesterdays report, and it is a solid base that popped and pulled back last week.
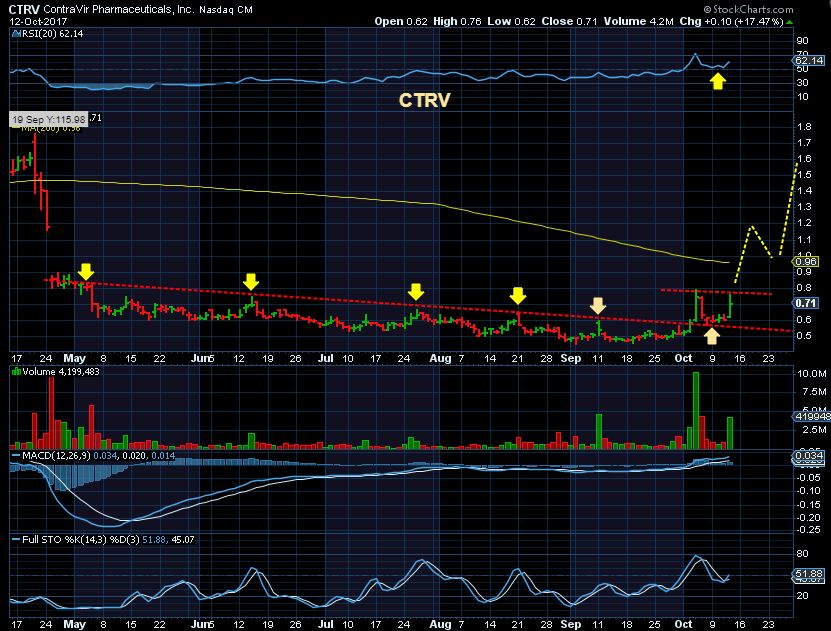
CTRV – I bought this Thursday. Why? It is a break out followed by a back test, and then started to move higher again yesterday. I like this set up and will see if I get the follow through higher.
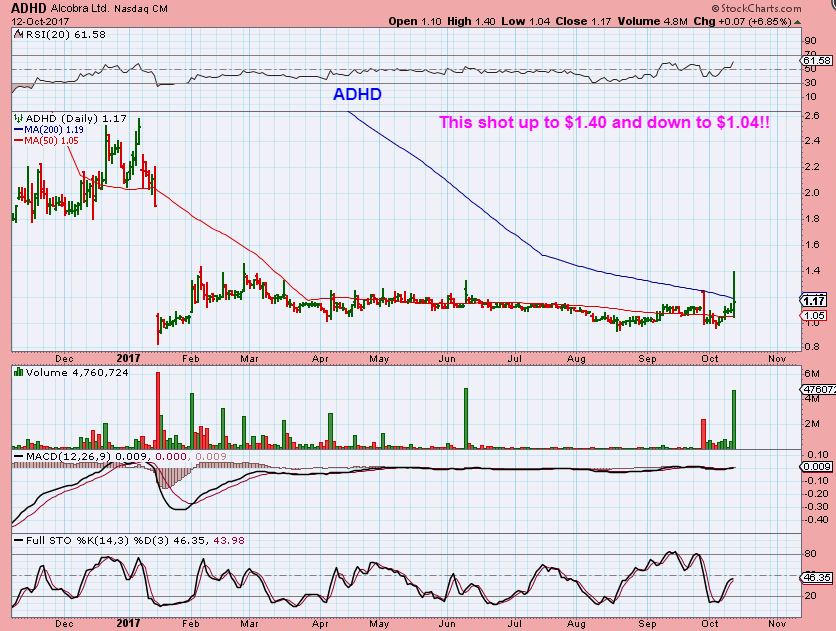
ADHD – This ride was already crazy yesterday alone. I bought in on average around $1.13 and it took off to $1.40 for a while, then it dropped back to red and tagged the 50sma, hitting $1.04, and then moved higher and closed at $1.17. That was ridiculous. I am still in it, but I had to purchase some Pepto Bismol after that ride 🙂 Actually, my position is small. Maybe 5% of my trading account was on this one.
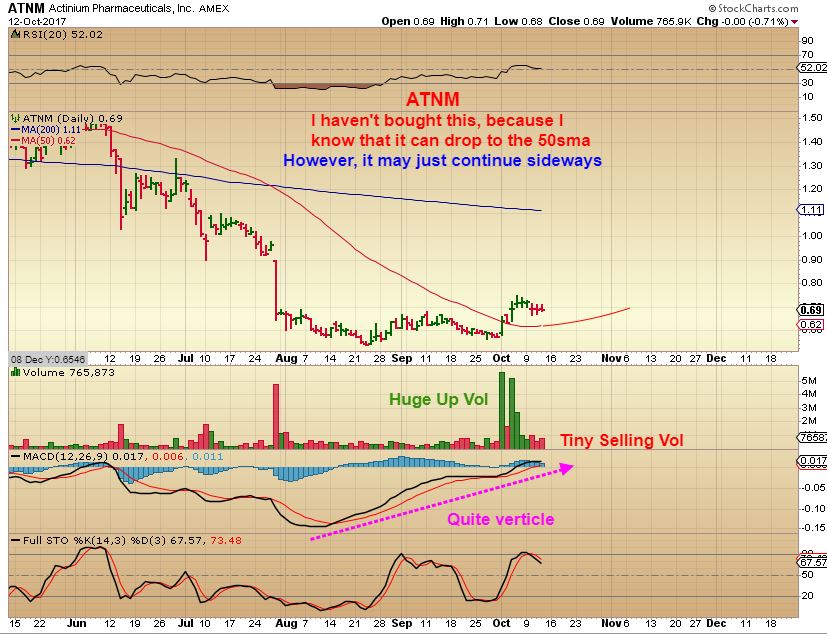
ATNM- I do not own this, but I like that it Popped and is BARELY selling off , and is selling on very light volume. See the chart. A stock like this often runs to the 200sma after breaking out, and that is a good size %-Gain.
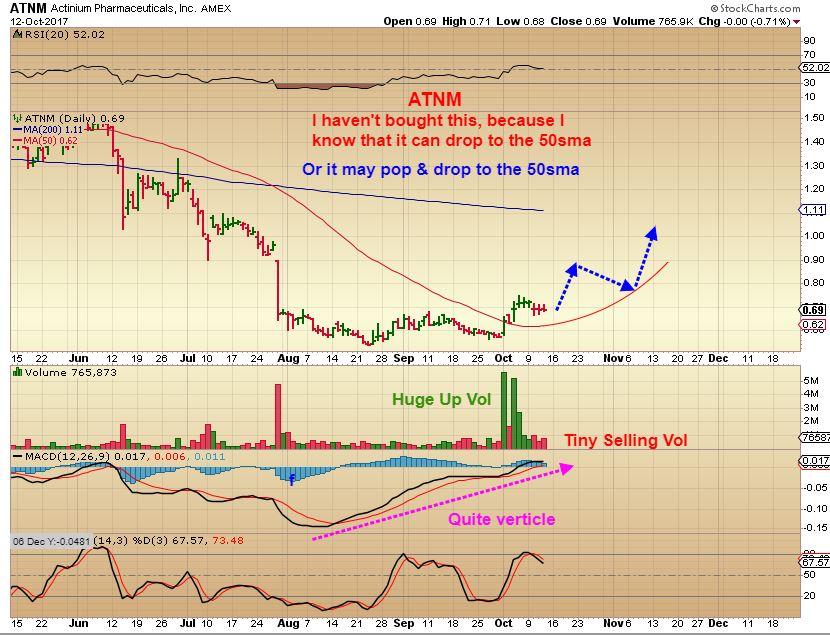
ATNM – It is possible that you’d see a back test of the 50sma, but that may not happen until after a tag of the 200sma. This is just an idea of how it could move going forward.
With the large number of stock picks and charts that I have had in my report lately, don’t let it overwhelm you. This is what I do –
I may start a watch list. For example, We have seen in the past few reports Charts of NAK, APHB, MBOT, CTRV, AMD, CRMD, etc. I don’t buy them all, but I keep a list of them. I may list them and rate them based on the charts that I draw up. Put a star next to the ones you like best so you remember to check them either daily for positive activity, or through out the day. You may just want to buy 1 or 2 Biotech base set ups that look bullish, or wait for a break out and then enter ( INFI had broken higher before exploded).
MBOT – I am still in MBOT for example, and that has positive activity so far, but not always an easy ride. Some may wait until it breaks out higher and starts a stair step pattern. Day to day can be tough with this one, since it moves in big daily swings or it can be boring day after day. The upside potential far outweighs the boring action to me. I’m trying to invest in this with patience.
Enjoy your Friday trading and have a great weekend !


Great report, so waiting on miners and oils to set up for buying, and some of the biotechs still look good now. Nice!
Yes, and there will likely be some trades along the way, maybe Energy stocks will set up again, they arent too bad right now, or Industrial Metals could run before Miners bottom, but the best trade is usually the ICL for Miners.
That could be a while, it is only day 5 for Gold and we have a pop this morning, so I’m still expecting Gold to top between day 8-12 roughly & then work its way lower ( And that can take a couple of weeks).
I’m trying to add to my DNR today in pre-market. So far it only took 100 of my 1000 shares at 1.29.
Looks to be rising a bit in premarket
https://uploads.disquscdn.com/images/a1a376e9253f356badf8846185607734431fb83faf77d525106ca7e7329dae47.png
Tx CF – great week….
Thx Maria – So your avatar is a Pats fan and not a Jets fan?
giggle… actually … im a diehard jerry rice/Montana fan … after they retired .. ehhh… i have to favs … 😉
ITEK has a nice run with a bull flag, and I see that it is up pretty big in premarket.
AKS was pushing on the 50sma yesterday, and in pre-market it looks like it’ll gap up over the 50sma.
RNN public offering, down big pre market
TNDM – I hadn’t been looking at this bio stock, but getting stomped on this morning for a public offering too.
Steel stocks across the board looking strong today
Yes, I see a few up 5%
Gold popping above 1300 , OIL & NATGAS alos moving higher this morning, so energy stocks may follow.
A lot to watch today
I bought ATNM near the open
nice.. i grabbed LBIX … lol
CUR
SO MANY to look at.
Wow!!
🙂
Thank You Nak – For following through with strong volume in the first 15 minutes
ONCE gave your POP at the open, Alex!
Let’s go CLF
And NAK
And miners….. I don’t want for much ha ha ha
Hey Matt! Very big volume on CLF. It has as much in the first 1/2 hr as it did all yesterday.
many of the Steel stocks shot up today.
Same with AKS – Big volume POP
And X – Big pop with big volume
China’s iron ore imports surged above 100m metric tons to a record, smashing the previous high
set in 2015.
Attention Deficit is at it again
I know….geez, I might have to let it go…
my charts telling me its ok above 1.01
preferably 1.04
…….here’s hoping….
yeh.. lets hope it doesnt now do a drift down c wave.
am only in light, so i might stop out at 0.96… give room for this little monster to have its tantrums
hows it lookin to you now? 🙂
um, better……
I’ve had a couple of big wins this week, but my little losses have wiped them out it seems….argh
Break out the Pepto!
I didn’t even see that drop. It did the same yesterday too – ADHD is definitely the the craziest mover I’ve owned in this sector, and it is living up to its name. It doesnt seem to be able to focus on just 1 direction. Pepto – indeed!!
this doesnt look like one you can hang around in if it ever explodes higher.
Good point. Like yesterdays blast to $1.40, then down to $1.03.
Just going to be hard to know when to sell if it does move higher again.
this one minute ADHD chart is like a graphical representation of people being turned upside down by their ankles, and having their pockets shaken empty by the school bully
https://uploads.disquscdn.com/images/6a728daca57508b27f28bf0b7274760587e6589b1a1e2c6b58c15bae2ca39c28.jpg
And 15 minutes later it is up at $1.14.
If people are going to ride this baby, this is a good one to keep the positions on the smaller side : )
1.17 .. giddyup ya little b*st*rd
Now its turning green, forget what I said about small positions, after that obvious shake out – I’m GOING ALL IN!!!!!!!!!!!!!!!!
Just kidding!
1.26 now…..wow
i got next resistance in 1.50s
Yeah, it is a crazy one – Yesterday was amazing 🙂
Stopped out of ADHD
I had a dream last night that I had a stock fall big today….guess that was RNN…..took my loss and cut it loose…in my dream it was something like a $2 loss per share, so at least it wasn’t as bad as that..
I saw that red candle yesterday and took my hit at 2.925.
what happened to SSRM? I thought it was one of the strongest silver stocks and had great earnings last quarter, now down 7%
that does not look good – I jumped out a bit early on Friday – thankfully
Earnings today – I didn’t see it until you mentioned it
http://www.marketwatch.com/story/ssr-mining-reports-third-quarter-2017-production-results-2017-10-12?siteid=bigcharts&dist=bigcharts
THANKS, at least there is an explanation. I had already 2 companies hit by earnings: KL and SSRM, thank God I did not have large positions on those 2, but still it stops in your tracks and think twice about individual issues.
We are at a point with Miners that I am expecting them to roll over and drop into a dcl anyway.
I’ve sold leverage and some miners as mentioned, but am thinking of being completely without Miners for this expected drop.
GDX is now showing a peak today ( And reversal lower) on day 9. It can go higher, but I feel this will be L.T. and could peak anytime now.
stopped out of INFI for b/e on that little excursion up & down since yesterday afternoon
GSS ….
lookin purdey.. still in that one
Stopped out of SSYS…that one crushed me. In and out twice, both for a loss.
thinking this one might just be bottoming out here..
at a loss twice, like yourself
Whoa – that looks nothing like VJET , XONE
It looks like DDD and that drop was an earnings call. SSYS must be earnings too
NAK did hit my initial $2.25 target today
NAK topped on the initial target price of $2.25, and is no heading down but it is not a sell for me due to the longer term potential
Thanks for the update CF
Hi Alex,
Could use a little direction with CLF today… big volume …big gap. Room to run more? Do you think it can get through resistance on the daily chart…the last high? This Gap might of caught a lots of shorts.
I haven’t posted any long tail candles for awhile. I just happened to see a real scary one this morning while flipping around my charts. And since it’s getting close to Halloween I thought I’d post this scary candle of GLD from the AH yesterday pointing to a low near $119.50 which would take out the October 6 low. Yikes!
Good trading to all, I’m just sitting in TQQQ riding the bull.
https://uploads.disquscdn.com/images/6662b1ec50decd47473a5b5da8a381c71fa6796f7fc24e8cc291246dd00d475a.png
Alex, do you think LABU still has more room to drop. I’m looking a for a spot for cost average. Thanks.
I actually had a chart yesterday for LABU – for the report today, but I didnt put it in the report. The chart indicated that selling should slow down, but after looking at XBI – I wasn’t really quite sure that that is the case yet.
Refresh for the LABU chart – But again, I am not convinced that the selling will stop or continue sideways. XBI is not really oversold at all.
https://uploads.disquscdn.com/images/eb30020cfa2fadb692afa8e9fa5055380c88957e098cd51d8826998585f3a0b4.jpg
Thanks, Alex. Sounds like there isn’t a rush.
close to stopping out on BOT here
Shorter term, it is possible that it could tag that 50sma. longer term looks great.
refresh for 2 charts
https://uploads.disquscdn.com/images/00ac63887e4ed0845d43336089d32b0b6e18e1aa579f2a80a5b1c355ef80cf95.jpg https://uploads.disquscdn.com/images/63724c896ba1453c079e92879936bd079d0e5db8da2acf469122d075af2bb672.jpg
yeh.. i was lookin at 1.15 if it breaks here.. but am not gonna ride any of these down if i can help it.
just too temperamental.. or just mental in some cases
Yeah, One could sell and see if it settles down at that area and re-enter on a sign of strength / reversal, etc
I do like the longer term chart
Call me crazy but I’m looking to add!
bitches be cray.
i will look to buy back lower down.. hopefully won’t get stopped out in the first place though., gettin close again
It appears I got ROBBED in ADHD! LOL
I´ve been buying UAN for long term hold down here, this will be minimum of one year hold. Agriculture doing well today, and if commodities ever turn up again, this one will go but any of them will do being so washed out, like MOS also has potential I just know more about UAN.
I like the chart.
MOS, POT, and AGU do look good today too
Thanks for the input, chief.
With any purchase of MON one should be aware of the potential liability of Roundup (GLYPOSATE WEED KILLER LINKED TO CANCER), which is one of the reasons that I think they want to appear attractive to Bayer. A buyout might duck the lawsuits that I’m sure are coming.
Very nice pop this am on a nickel discovery story :
GGI- Garibaldi Resources- GGIFF
I’ve been in a few nickel discoveries over the years, when they get running they can go crazy.
Gap open- flag forming or perhaps a fill. I’ll be watching for a set up for a trade.
Sprott has magic touch lately between this and Novo.
Very nnce chart even before the pop
Yeah, Sprott has nailed others too, like EXLLF. He´s been on a roll.
GLCNF is another nickel miner who is starting to move. Besides lithium, nickel is a big component to automotive batteries.
ATNM from the report looks like it is acting correctly – this chart was in the report
I did mention early this morning that I bought this one.
https://uploads.disquscdn.com/images/afa2ec5e0f8b237429a709b0099f184ce689622b04bf2d6e6ad746e1bf97af96.jpg
I still have faith in MBOT, it´s gonna surprise us with a big gain, or work higher before surprising us with a big gain. 🙂
I´m not even upset about the ADHD, shows we are in the right group that they still work out even after a stop out. That´s my error since I didn´t give that one much room after buying it into that huge pullback yesterday.
CLDX – hope it’s just back testing that 200 day and will pop soon…..been waiting…
I thought that I was going to take friday off too
That never seems to happen 🙂
IPI seems ready to roll again. In retrospect, it just tagged the 50 sma.
Stopped out of DNR for a small loss.
folks .. git watchin GEVO.
as stated yesterday, a stay above 0.71 might start the ball rolling
Don´t have a clue what they do, but I´m on it! lol
GEVO was my largest trade ever gain wise.. And on accident.. I bought 10k sahres at .5308 last summer and meant to sell when up 900 at the close. Something about AA flights using their corn oil had the stocktwits world going nuts. I didnt sell and when I woke up in the AM, price was 1.40… I hit market sell ASAP…
fwiw, here’s one commentator’s thoughts on one of our sectors:
“Drug stocks are under pressure today. 60-minutes is airing a segment on the opiod epidemic. Traders are jumping ship ahead of Sunday’s show. Today’s action will probably prove to be a “sell the rumor” event – which might follow thru a bit on Monday morning. But, I suspect that will actually create a good short term trading opportunity on the drug stocks from the long side.”
What are the drug stocks? Biotech seems absolutely normal.
I see XBI & IBB barley down ( IBB is at 336 and isnt even down $1)
PFE is up near new highs today ( PFIZER) – 🙂
Looks like the comment wasn’t worth much!
I thought it might apply to my LABU position having dropped from its high –
I have no plans to sell it (again fwiw)
Oh – lol – I thought that there were some ‘drug stocks’ that I wasn’t aware of that were tanking or something 🙂
When I read that – I went right to PZE & it was green, so … thought that was odd.
SSYS recovering
Crazy, same with the ADHD, and I´m thinking instead of stopping out at obvious levels to instead use those areas to bid for stock. I probably won´t get filled on many but it´s a gift when it happens. Yesterday I happened to bid for NURO at $1.98, came down and filled me, instantly was back up 10 cents from purchase price. Perhaps with these nasdaq bio names, the bots are more able to manipulate them to favorable price levels?
How about PZRX? Or does news like that keep the CF away, that they are cutting costs and eliminating jobs? Not exactly a discovery of a barnburner new drug.
Yes, Thats good for the watchlist. Had a huge pop today and gave it up and now it still has a 30 gap up open below it.
Buying here, you might get caught in a gap fill
ThinK I will put a stink bid in the 90 cent area, take my own advice learned from the ADHD trade.
AUPH
They’re still popping !
Hi Alex,
Do you think this is sell the rally for steel stocks….AKS, CLF. Or does this move look real and could move for a bit. Thx
I can´t remember the miners ever being so quiet, for so long.
I mentioned that Some of the Shippers were looking bullish a month or two ago – and since then, some have still been holding bullishly in consolidation, and now some seem to be ready to move higher again
SB, NM, GNK, FRO, NBR and so on – held up rather well.
I thought that ATNM was acting correctly ( And it is), but take a look at the 1 yr weekly chart with volume.
Now that is a nice chart
CTRV – same thing on a weekly
fat fingered a 600$ loss today..
how so?
ill talk about it next week… really bad trade for me
https://media.giphy.com/media/9ftLoOjZMF8Bi/giphy-downsized.gif
Just ignore Newman – I only saw Jerry & Kramer
FAT FINGER TRADES ROT : (
LoL.. Newman.. always felt like punching that swine
yea… It was a JNUG trade
I was going for a starter tester, and didnt realize I added a 0… walked away and sure enuf hit my stop….
Worst part was… The wife walked in and informed me of it when it happened…
OUCH.
BT, having made a few “fat finger errors” myself in the past, I now place every stop order for 1 share in case I accidentally sell at the wrong price when I don’t want to. Once the stop is in place and I have verified it is at the correct price, I then edit the order to the correct number of shares. That has saved me many times in the past because I still sometimes get filled with my “fat finger” order but now it only costs me 1 share instead of hundreds or thousands of shares (depending on position size).
Steve, I use Streetsmart like u… I know u jsut explained it but im trying to understand better what u mean… And to avoid this crap again… I woulda been ok losing 60$ today… add a 0 to that and its NOT ok..
OK .. I will walk you through it step-by-step. In the upper left corner of SSE you will see the “Buy/Sell/Short” Action options. Click on “Sell” then in the next field to the right it says “Quantity” The default setting is 100 shares. Change that to “1” share. In the “Order Type” drop down select “Stop” then enter your stop price. Then select day order or “GTC” and click on the “Review Order” button. Check to make sure the numbers are correct and “Place Order.” If you are in a rush and accidentally have a “Sell” order instead of a “Stop” order (as I have done in the past) worst case you only sell 1 share of your position. If you screwed up, start over again and set the stop price correctly. Once the stop is set you will see the little “S” symbol on your chart where it is set. I like to drag that “S” tag up and down on my charts based on the MA’s it’s a very handy feature. Also, as you are moving your “S” tag around you can see where other people have set their stops. For example if you have a stop set at $20 and start dragging it down to $19.90 you will see where other stops are because the program “helps” you by showing other stops traders have set, so you might see $19.97 $19.95 $19.94 $19.92 and so on. Where there is a gap in the numbers that means there is no stop there. Keep mind that all the brokerage houses can see ALL stops and they share that info with each other … that’s how they know where to set their sell price to run the stops. So If I want to set a stop at a certain price and I see there is already a stop there, I will go a couple cents under that price and hope they get taken out and I don’t. Once you have set the stop at the price you like it will now be set to sell 1 share at that price. Let’s say you are holding 500 shares and you want to set a stop to sell half your position. You would got back up to the order area in the upper left corner of SSE and you will see a little icon of an “O” in a gray box. That is your order. Click on the “O” icon and a window will open showing your open orders. Find the stop order and click on “Change Order” then click in the “Quantity” field and change the “1” to whatever number shares you want to sell. In this example, you would change the “1” to “250” then click the “Review Order” and “Place Order” buttons. Now you have a stop set to sell 250 shares instead of 1 share and you have protected yourself from accidentally selling 250 shares at the wrong price. I hope that makes sense!
Imm going to have to copy and paste this.. Thanks Steve this is awesome!
I just fixed a few typos so copy and paste again. 🙂
Thanks for this explanation. Like Bay, I will copy/paste it too to keep. My OptionsXpress just was meshed with Schwab…worst roll-out EVER! All week I had NO charts or streaming data at all! Made some bad trades because I could see no data. Bad. Spent most of the week on hold waiting for help. Finally found out I could use the Street Smart edge and am just trying to figure out the platform and charts. So thanks for this.
Miners have been very frustrating. Took a position in JASO on this 50 dma + trend line backtest.
Looks like it is trying to break the recent down trend line and close above the 10 sma too.
I see OIL , UCO, USO moved higher, but the XLE & many energy stocks didnt follow ((Popped higher & then gave up the gains).
It still makes me wonder if the dcl is ahead and this is a false bounce in Oil.
Check out that HMNY using only a 10 sma
Crazy stuff
aDhD bustin a move?
I have to look at it on a 2 month daily chart to appreciate it now. The 6 month chart looks like an electrocardiogram
But the 1 yr weekly? That looks interesting.
yeh looks miles better removing the candle noise too… if this holds at this level today, we could see 1.50-2.00 next week
Just shorted bonds via ZB futures for next week, testing the 50 MA from below.
http://stockcharts.com/h-sc/ui?s=TLT&p=D&yr=2&mn=0&dy=0&id=p91931149076
Bought a chunk of UCTT 3 days ago…I’m putting in the drawer and holding for quite a while..please check this one out. It’s a good one IMO.
am not gonna hold GNMX over w/e, unless a quick blast higher occurs
Yeah..I dumped mine yesterday….have few others I really didn’t want to hold over weekend but kept some, ..set ups are good…..hopefully won’t regret holding the ones I have 🙂
Why can’t all my holdings be like my VALE?
Have a good weekend everyone!
SOG do not look at TRXC now
holy moly!..
all occurring after hours.
it closed at a point i wouldve bought back into yet, so no big deal.
i hate it more when i couldve got on board, but was asleep at the wheel.
thx Bay
WOW – I see it closed at $1.46 & up $1.16 after hrs. Boom
Took 4+ hrs to chart & write the report today, but I was able to get it done before going out to dinner. : )
WEEKEND REPORT IS POSTED