
Weekend Report Sept 30
In the weekend reports, I like to visit the BIG PICTURE look of various sectors and see if things remain on track with our expectations. Since my day to day reports cover the daily market action and fluctuation, let’s take a look at the Big Picture, shall we?
.
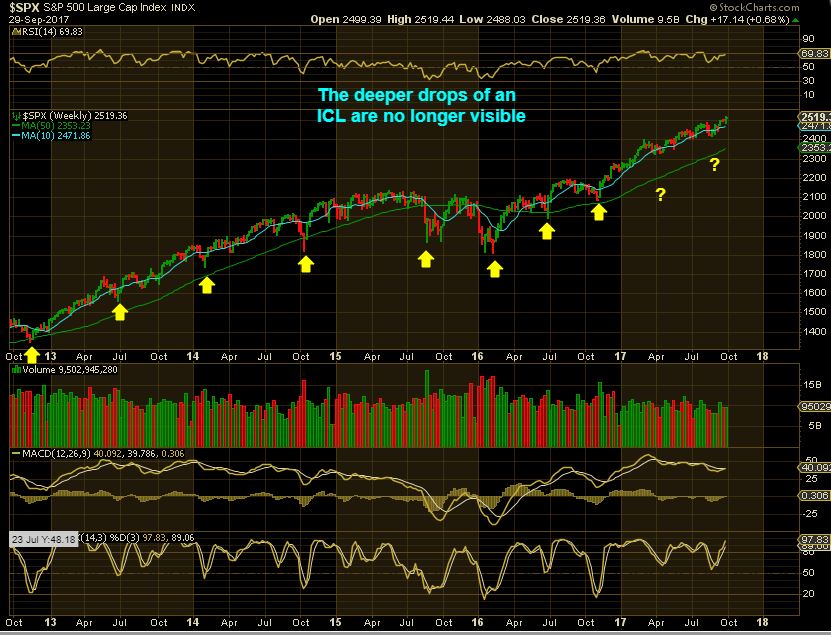
SPX – I mentioned in many past reports going back to last spring that if the markets begin to enter a more parabolic move, we will not be able to see the ICLS, based on past parabolic moves.
The highly visible ICLs come from deeper sell offs, but with the recent bullishness and ‘buy the dips’ that we’ve seen in the markets, we no longer see the ICLS clearly. The small dip / consolidations that you see above my question marks ( when considered timing -wise ) would represent where the ICLs should be. A Steeper ramp up and less sell offs is a bull run. The big picture simply remains very bullish, until we see a change in character.
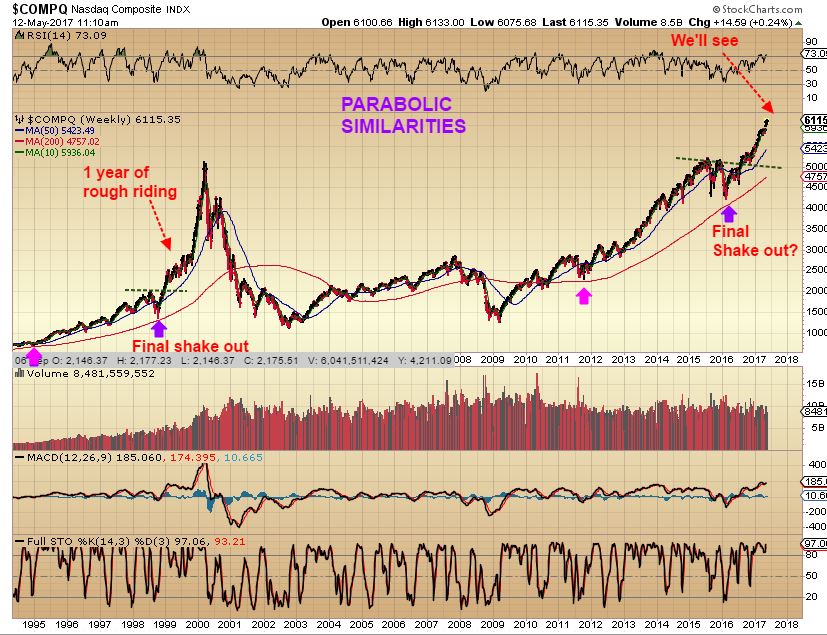
NASDAQ – For newer readers, this is one of a few Parabolic Nasdaq charts that I have posted. This one I posted in MAY to show the similarities of this ramp higher. I was pointing out here the “Rough ride” for 1 year in 1999 that can come before the final ramp up. Bull markets are not as smooth as they look in hindsight, they can buck and kick. I wanted us to know that choppiness could also be present.
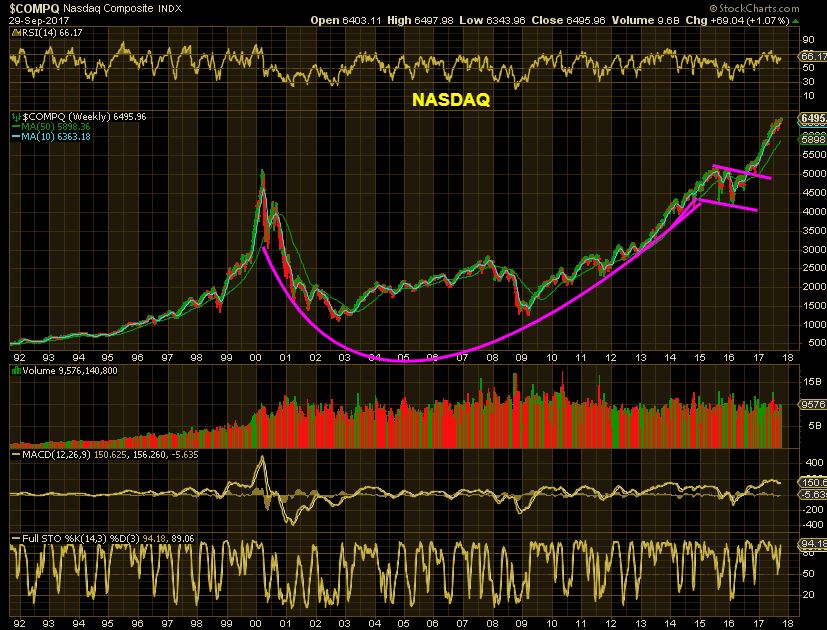
NASDAQ– This is the current chart and you can see that as choppy as the Nasdaq has been lately, it is still in a very strong uptrend. This summers choppy/ sideways action hardly shows up indicating that this is still on track to move higher.
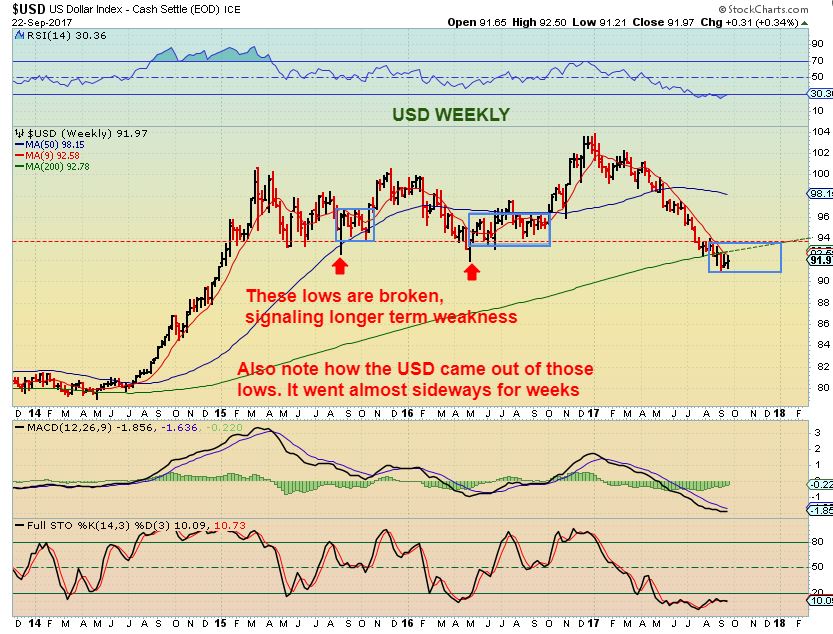
USD DAILY – I will switch to the DAILY USD chart, because we are witnessing the expected change. We have an ICL that has formed with a daily swing and break out higher ( A break above the trend line, 10 & 50sma). So we have a swing low in the daily and a swing in the Weekly charts. Daily cycles for the dollar tend to run SHORTER that the stock markets, so day 15 could lead us down into a dcl, and that could help Gold find a daily cycle.
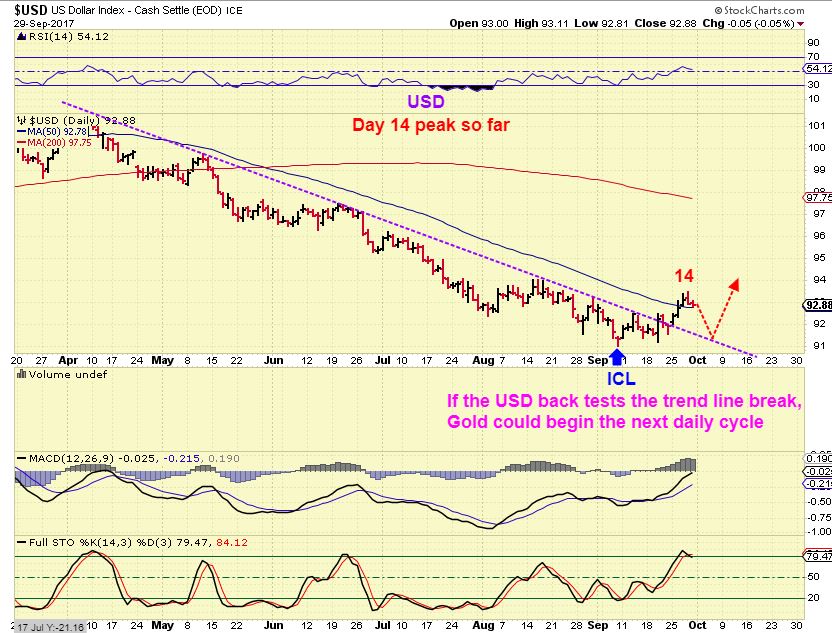
I would THEN expect a 2nd daily cycle in the USD to break the day 14 peak, and Gold could begin to roll over into its next DCL. I think you can see where I am going with this, but I will obviously explain it more in the GOLD section and day to day in all of my reports. We need to be patient as this unfolds, to see how it will play out.
The BIG picture for the USD still looks like it wants to drop, and this was last weekends big picture chart of the USD. Please read this chart again, about the blue boxes. We are under 93 now, but with an ICL in place, we expect the USD to move higher over the next month or two (or sideways).
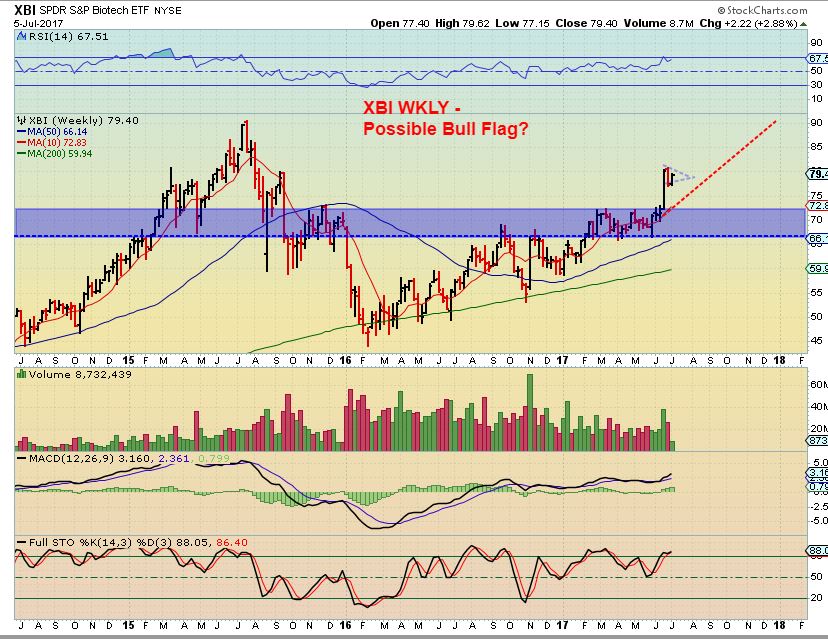
XBI BIOTECH ETF WEEKLY – This summer we discussed my price target of 90 after a break out and I suspected that a bull flag consolidation would take place.
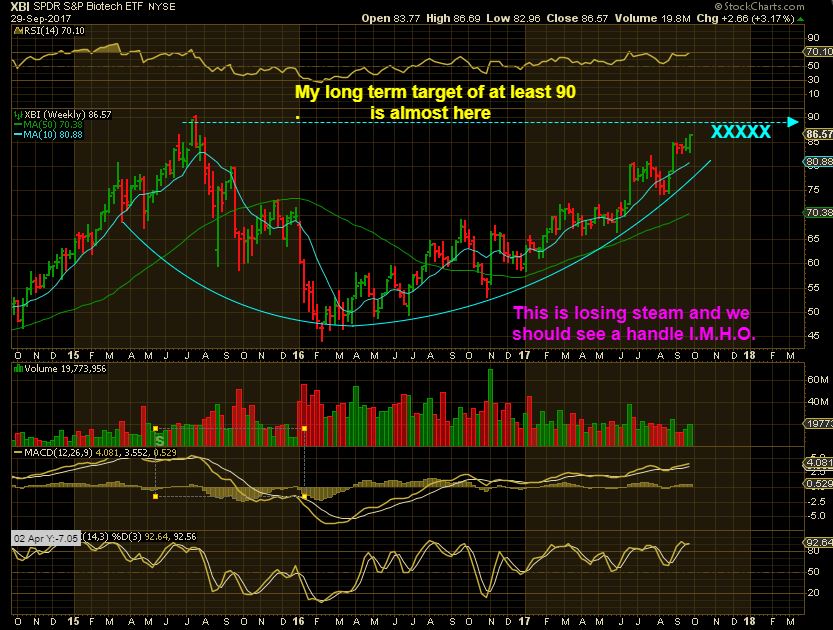
XBI– Slowly but surely, the ETF is approaching 90 and it still has a very bullish look to it ( Big Picture). AT the 90 area, this could form a handle, as drawn with the XXXX.
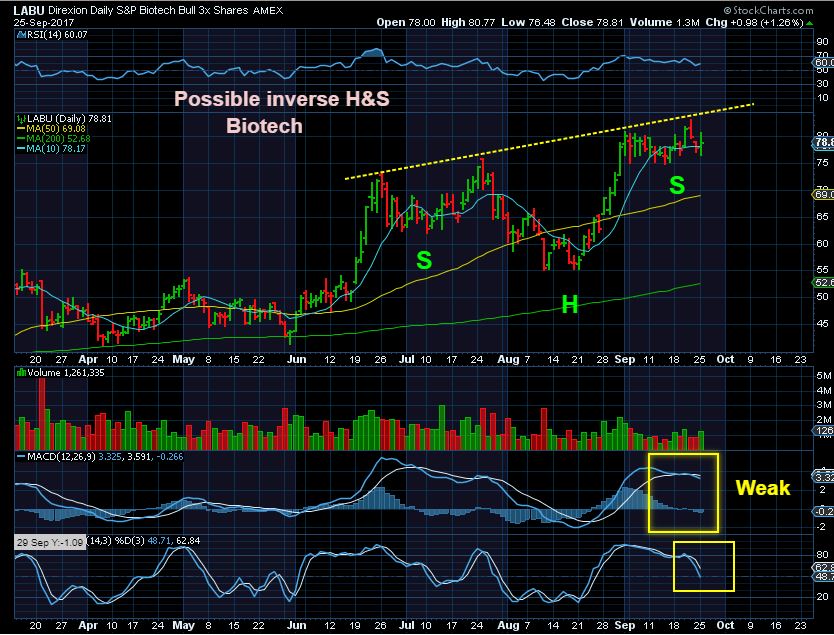
LABU – SO LABU has been a rough ride, too difficult to ride from last summer to now ( I sold mine for decent gains a while back), but if the XBI goes to 90 this inverse H&S could run to 100 in my opinion. This is my chart in a report from Sept 25, as a bullish set up. It is now 85.50. In AUGUST XBI went from roughly $75 to $85, LABU went from $55 to $80.
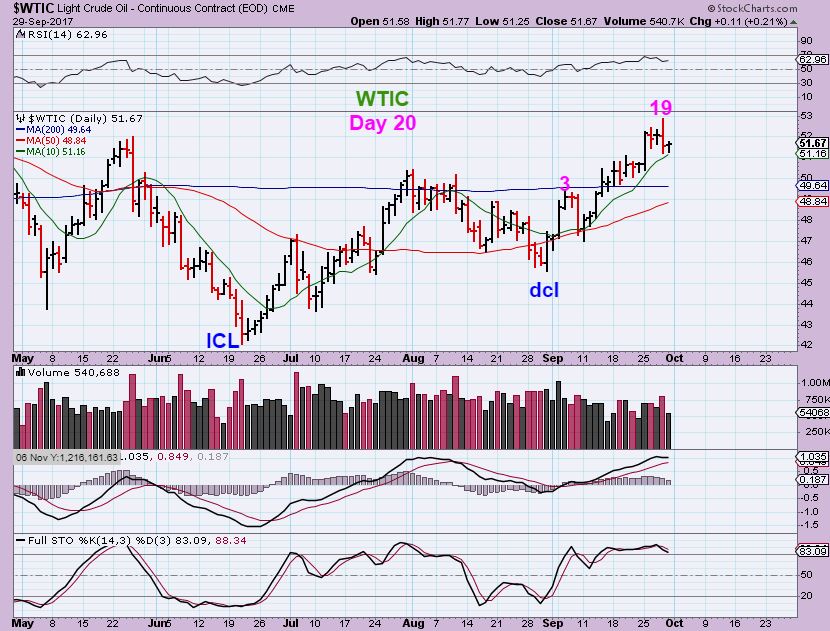
WTIC – Oil has been bullish after putting in a YCL / ICL in July and I believe it is still a bullish set up. Oil & Energy stocks have done very well.
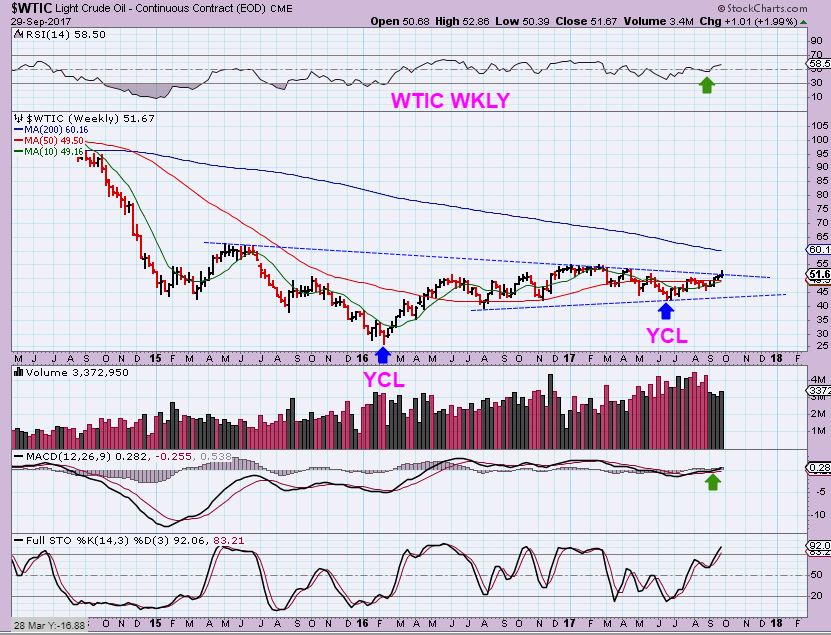
WTIC – The daily peaked on day 19 and Friday tagged the 10sma, we may only see a 1/2 cycle low here, since Oils daily cycles can be 50 days long. I think that OIL has more upside, so Oil & Energy stocks have been mentioned in the daily reports. This may run sideways to the new trend line from the low and Sept 11 dip.
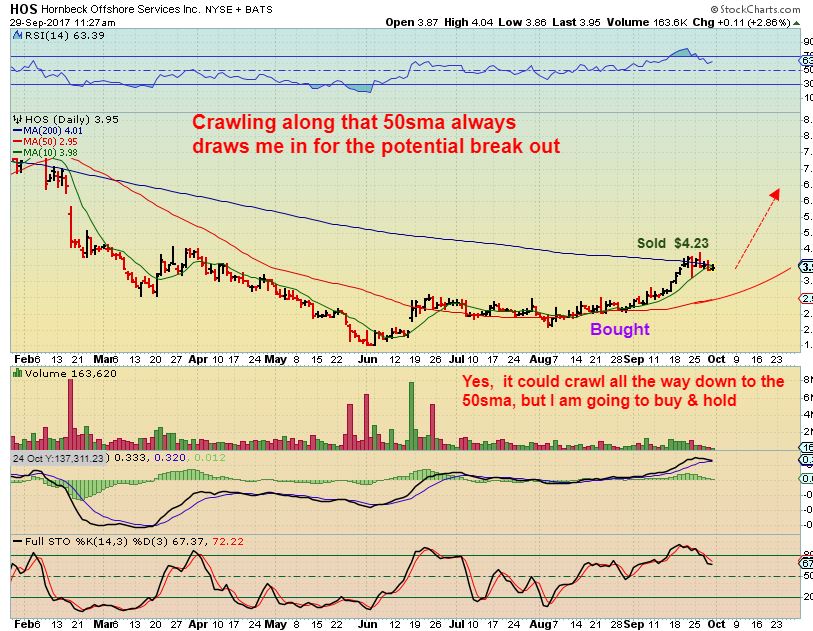
HOS – As an example, I bought HOS along the 50sma and sold it when it broke out above the 200sma. I was thinking that I have seen these drop and crawl along the 200sma repeatedly, so I would re-buy if it did that. It has done that, so I bought this Friday and posted that in the comments section. THIS CAN STILL CRAWL or even drop further, but I like the sector and this stock moves quickly. Once it gets going upside, it will be difficult to enter, in my opinion.
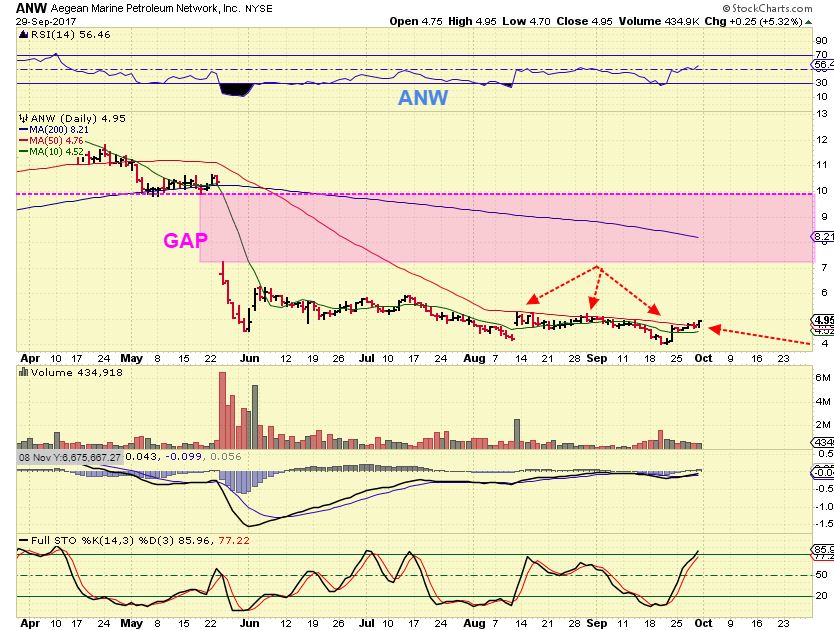
ANW – I am eyeing this $5 stock as a possible long base that just broke above the 50sma after a long crawl along it. I almost bought this Friday late in the day, but I wanted to read up on that huge GAP DOWN in May and see why that happened. I still haven’t had time to do that this weekend.
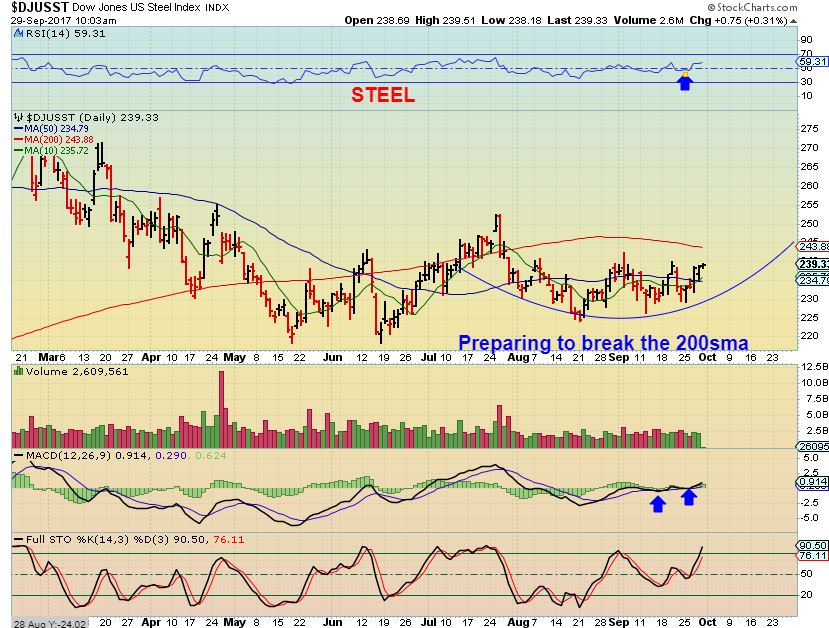
STEEL – Steels consolidation ( and Copper too) could be ending, so I am again looking at X, CLF, SID, AKS, SCHN, ZEUS, etc – also TGB, HBM, FCX, SCCO, etc.
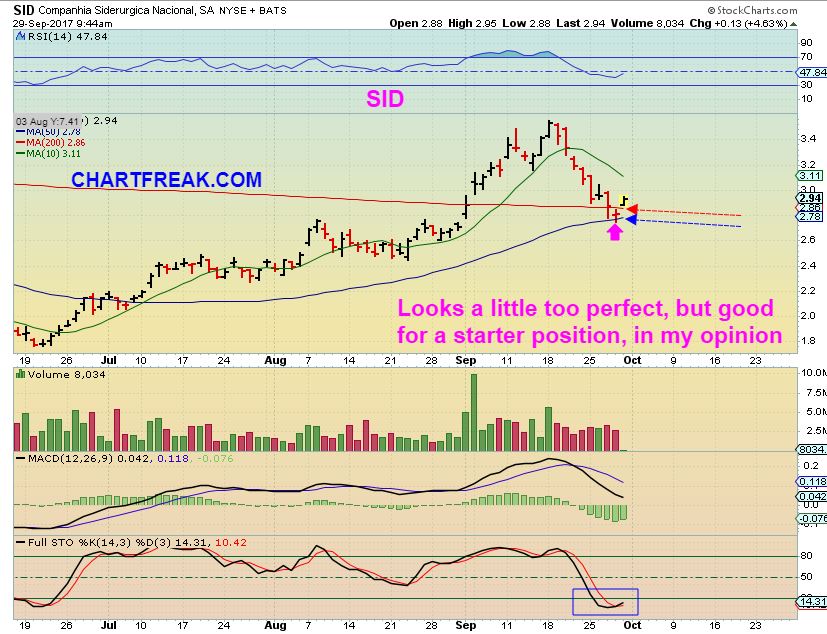
SID- I liked SID Friday & posted this in the comments, but it is almost too perfect. Look again at STEELS chart above. If that has 1 more drop toward the 50sma, Sid may do a quick ‘shake out’, so I want to wait a bit more ( or start a small position & add on a dip or break out higher).
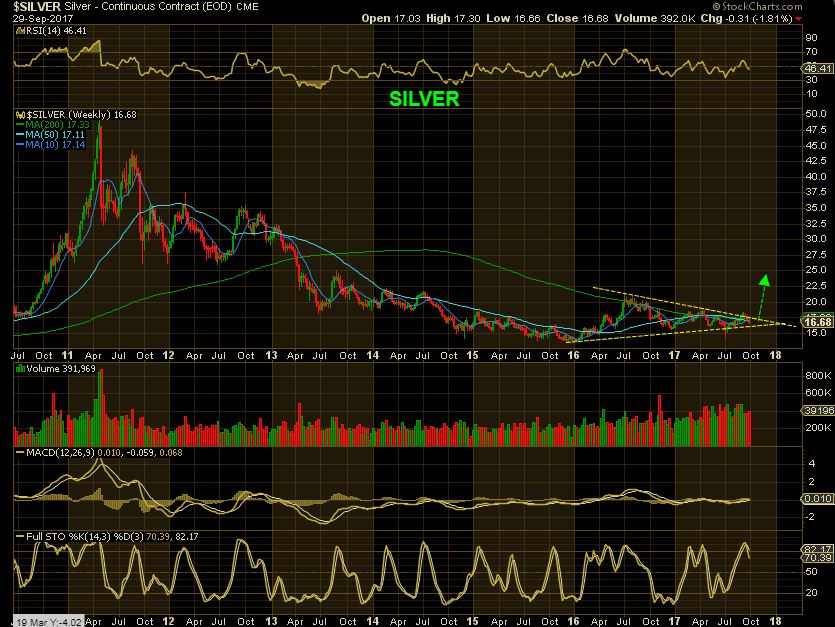
GOLD, SILVER, AND MINERS
GOLD – Deep in the timing for a dcl, we are looking for one to form any day now, and the USD dipping down may help.
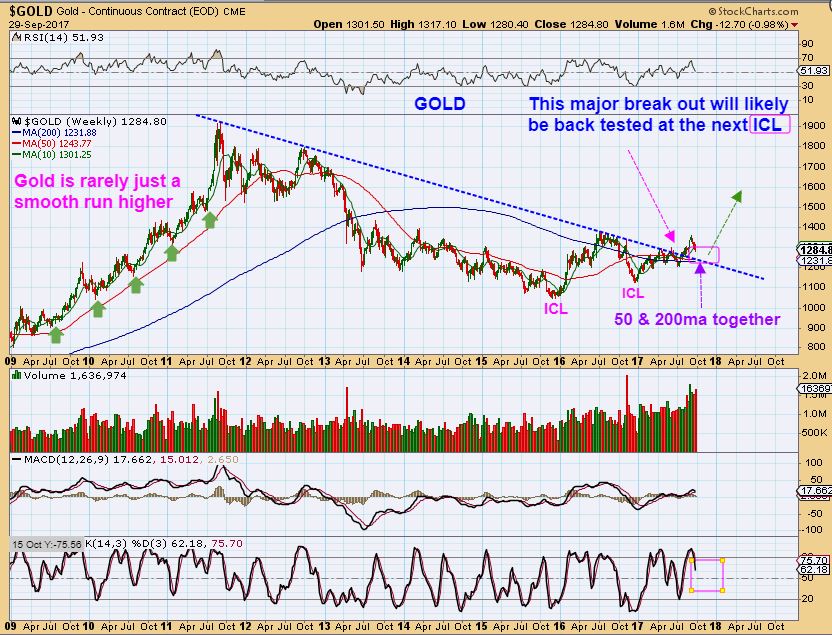
GOLD WEEKLY – Bigger picture- Yes, I hate the dip into an ICL when I am planning on a strong bull run too, but with the USD putting in an ICL, we now may need to recognize that Gold can eventually roll over after the next bounce. An eventual ICL drop is NOT saying that GOLD has to sell off in a bad way. A back test of this trend line should be expected, so maybe that is what the ICL will do. These dips are normal in Bull markets too, take a look at the Green arrows in the 2009-2012 Bull Run. Dips were normal. Currently we have an ICL in 2015, a higher ICL in 2016, and another higher ICL in July 2017. After a back test, we could make a run for the 2016 highs and then break them.
SILVER -This Big Picture also looks bullish.
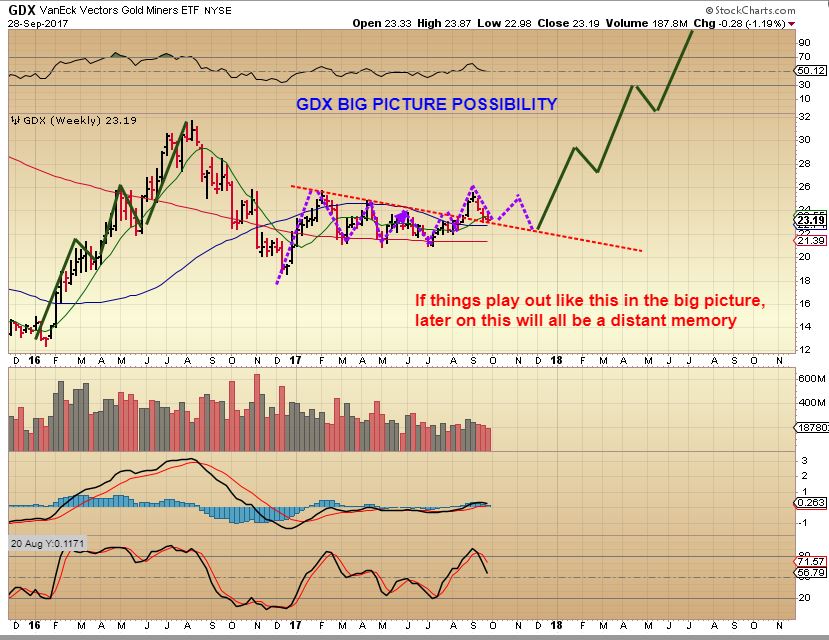
GDX – I used this chart to point out that I DO expect a bounce (dcl) when the USD dips down.
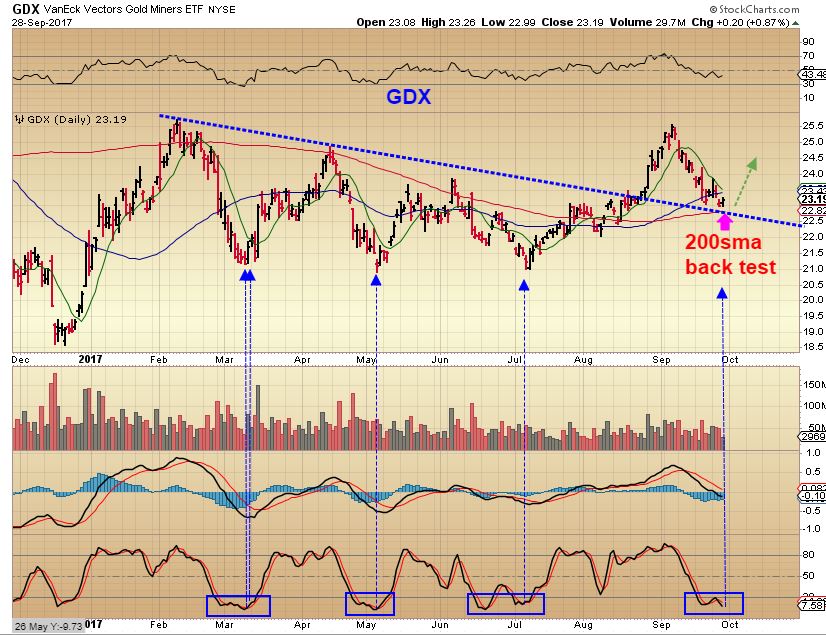
GDX – If we have a day 12 peak, this was where the GDX was 12 days ago, so maybe we run this high or higher. What about the bigger picture with the drop that follows however?
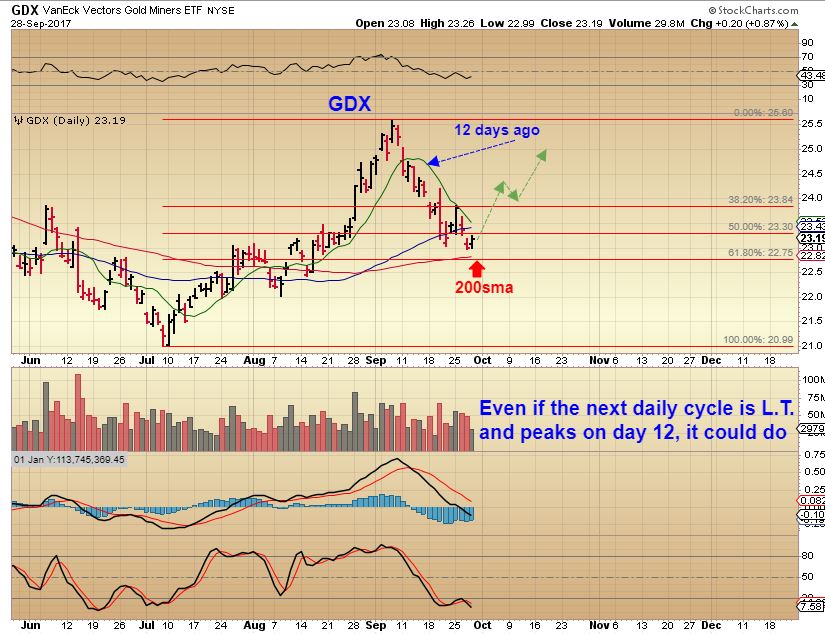
GDX – I can picture it this way. If we get ANOTHER daily cycle after this one, it would extend the ICL out to November or December, and both are normal timing for an ICL from Julys lows.
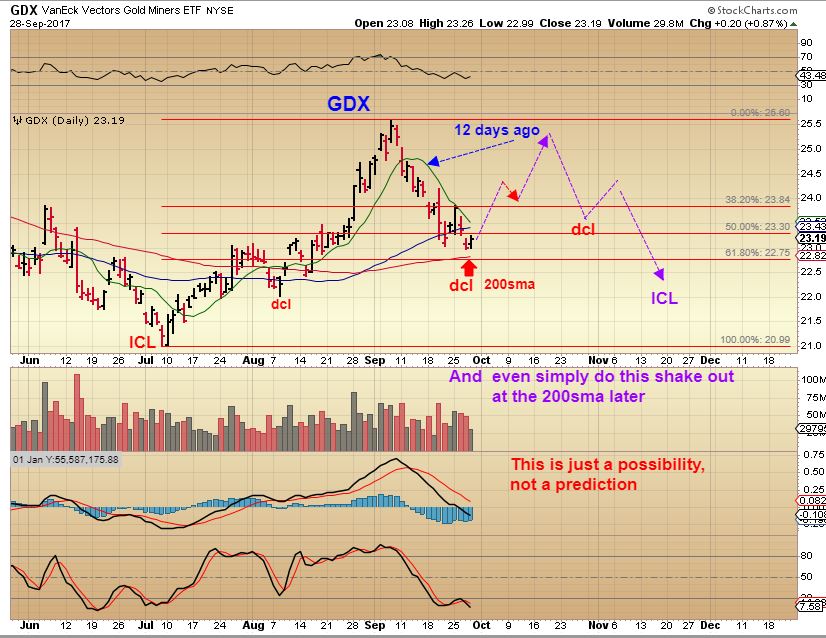
GDX- Bigger picture.
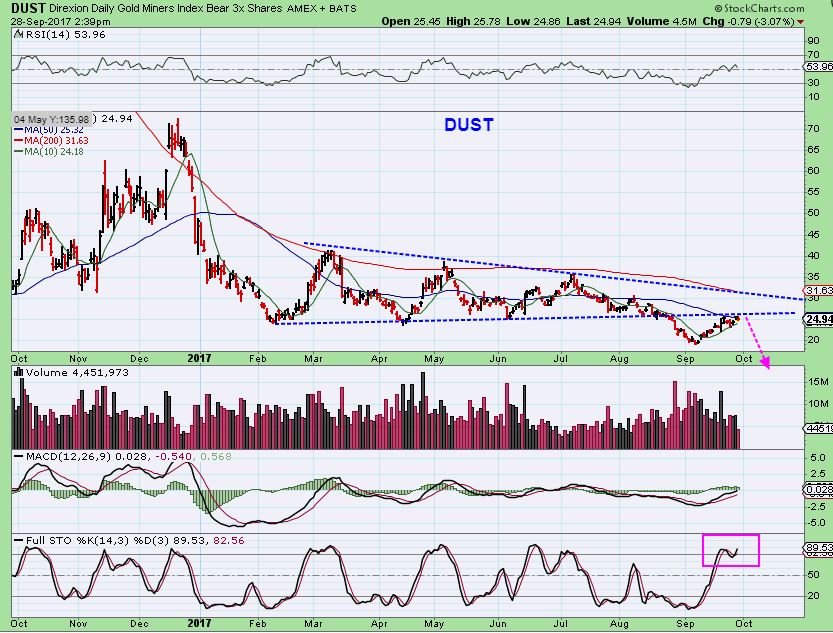
DUST – If we get our GDX DCL, this is what DUST looks like at this point.
GDX BIGGER PICTURE – LETS GO BACK TO THIS CHART FOR A MOMENT. A LONG CONSOLIDATION WITH DAILY CYCLES EVIDENT.
I hear people say things like, ” This bouncing around is not normal” “This is weakness and not a good sign for the Bull Market in Gold!!“.
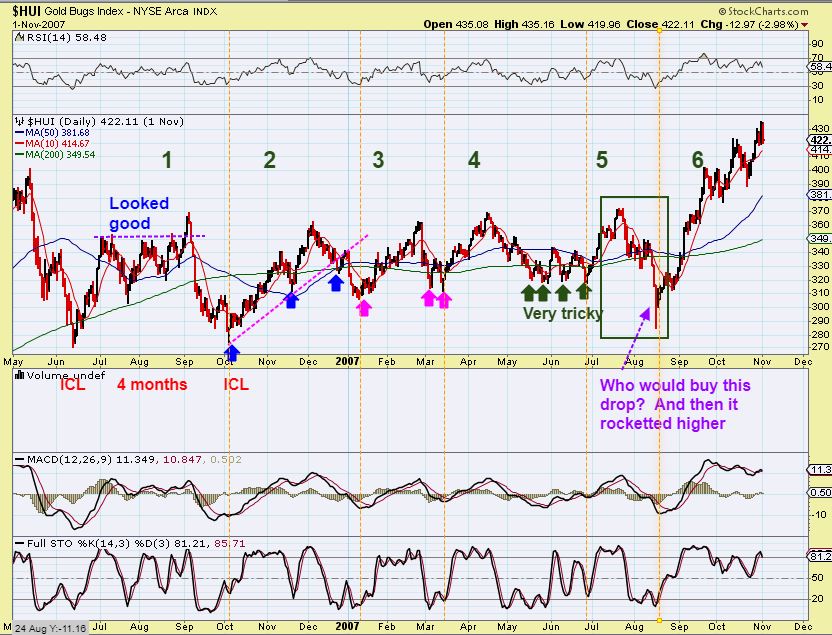
HUI – 2006-2007 – A LONG consolidation with daily cycles evident. I hear people say things like, ” This is not normal” “This is weakness and not a good sign for the Bull”. 🙂 They are guessing and letting their emotions and frustration get to them. They are not accurately reading what is taking place.
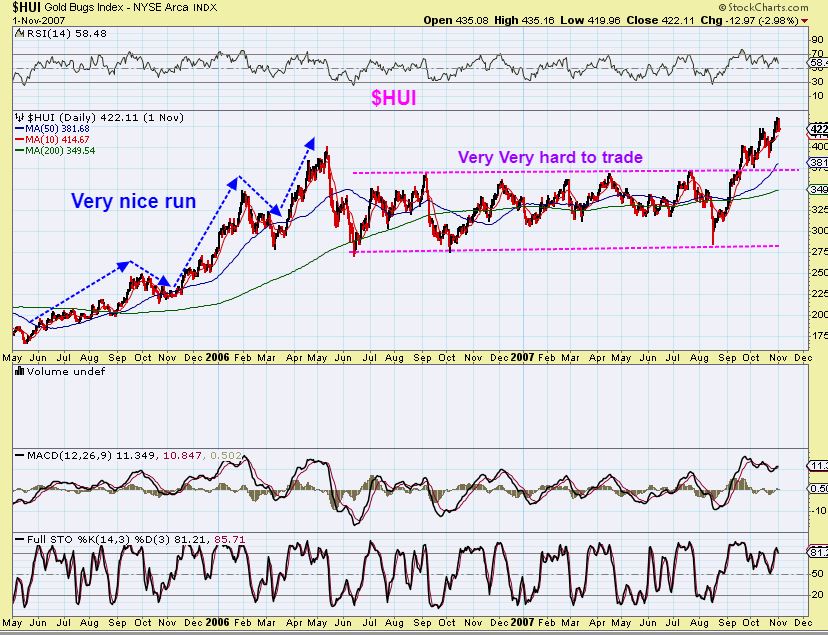
HUI – Look how many peaks a dips there were then. Frustrating? Yes. This was very tricky at times, especially when waiting for a dcl (double bottoms, false starts, etc), but the deepest sell off shake out into August lows of 2007 was the ICL to buy after such a consolidation.
MINERS BIG PICTURE – BULLISH OR BEARISH?
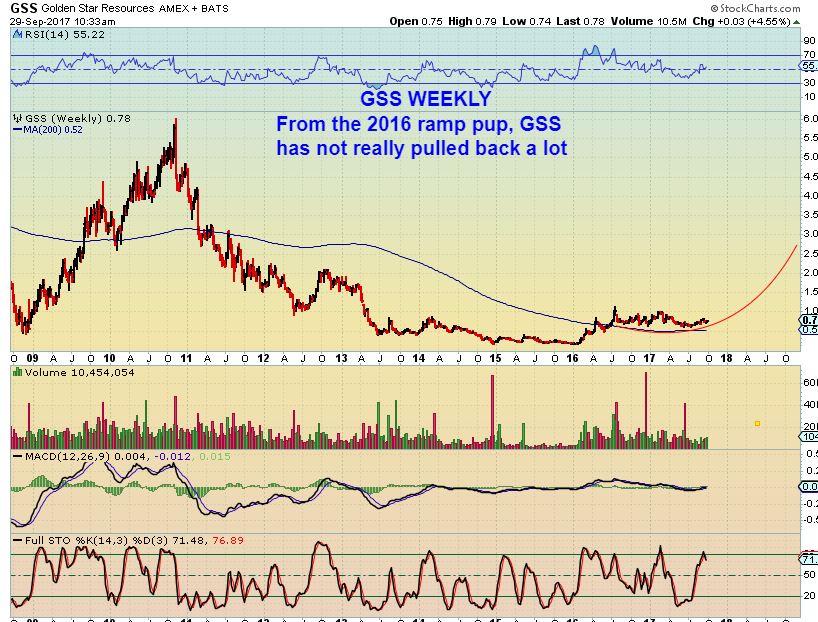
GSS Daily – That was a huge run from $0.14 cents to $1.13 and the consolidation has been mostly sideways.
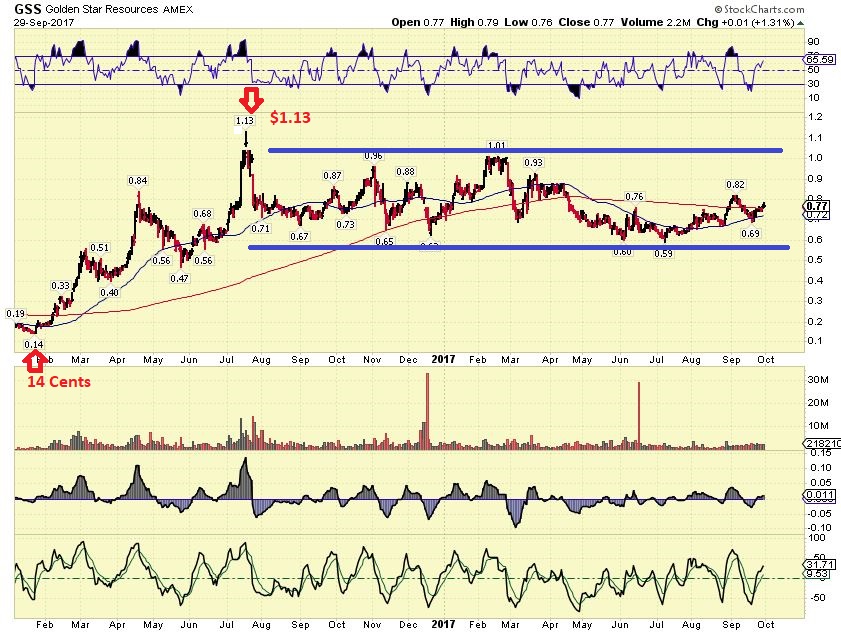
GSS – Very Bullish looking potential. The pull back from the 2016 run has been sideways. Please do not ask me what a ‘Ramp Pup’ is 🙂 I meant 2016 ‘Ramp Up’ higher.
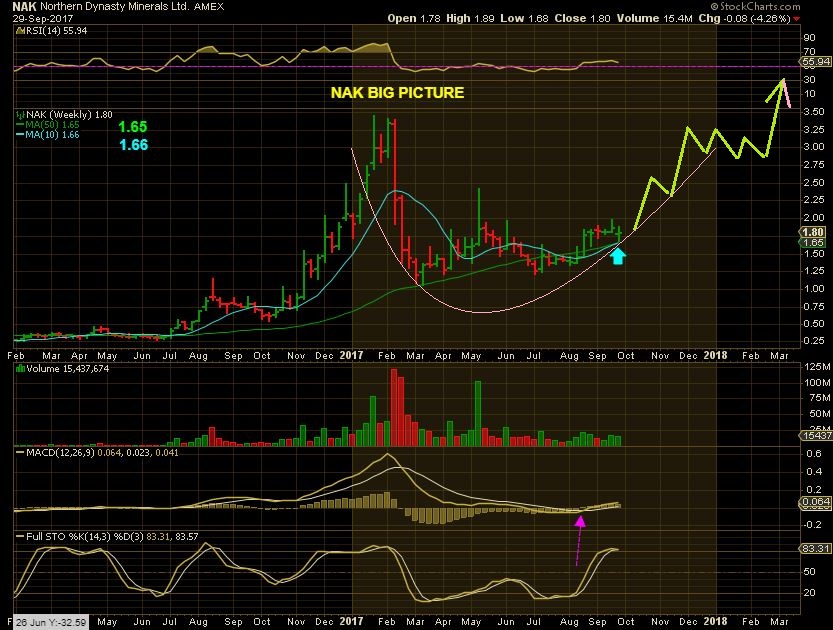
NAK– Though there is a possibility that NAK could drop in an a-b-c fashion, there is also a possibility that the shake out at the 50sma is all it drops. Let’s look at the big picture.
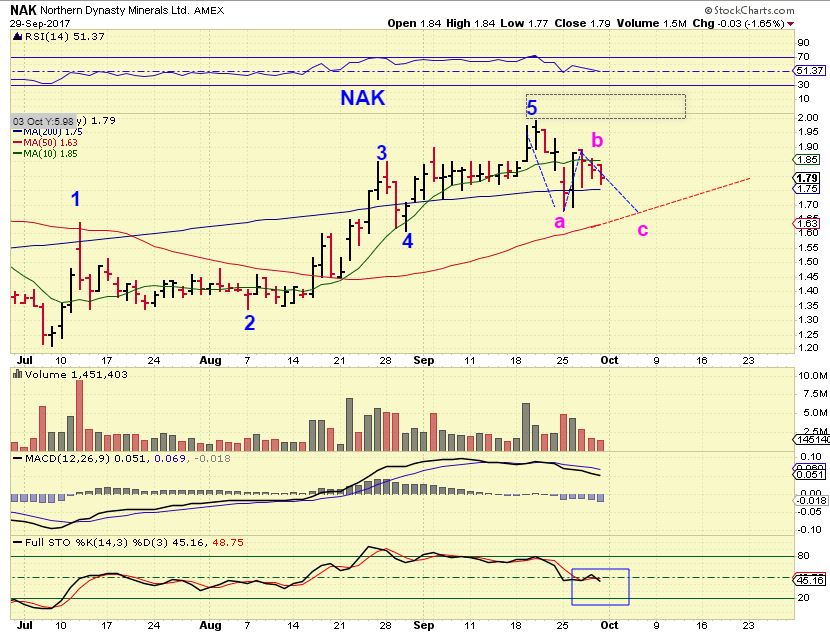
NAK – NAK bounced right off of the 10 & 50 weekly MA combination last week. Big picture bullish after a huge run on 2016 from $0.20 cents to $3.50ish. Can you picture this forming a large Cup?
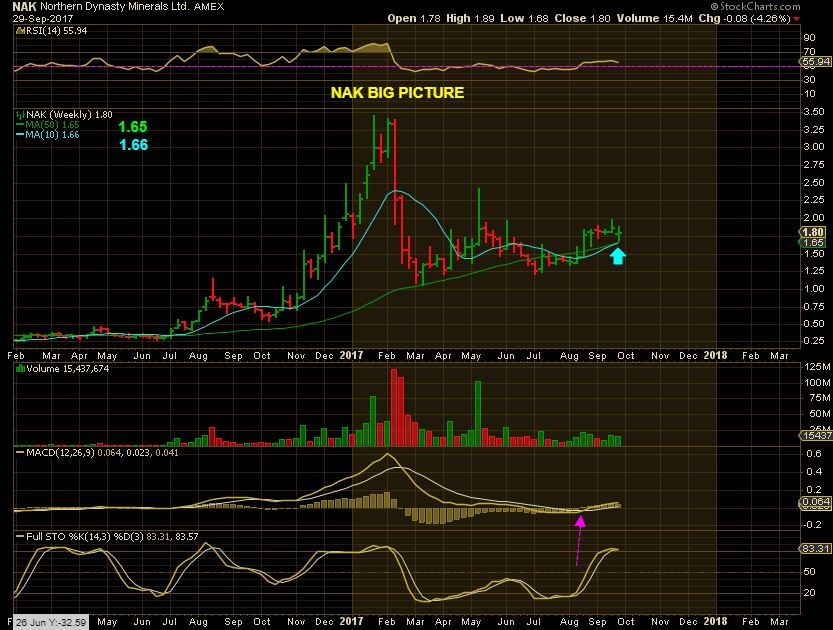
NAK – Maybe this will help. The chart is still Big Picture bullish, whether this plays out this way or not.
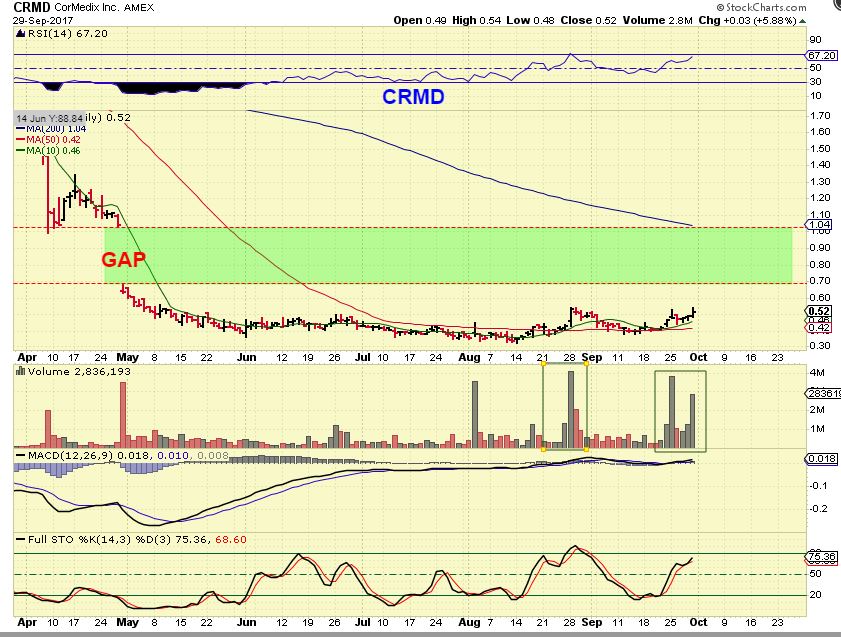
CRMD – I owned this a while back, but I think I bought it too early. I think it was August and I got stopped out on that drop. Suddenly it looks like it wants to join that XBI and move higher again.
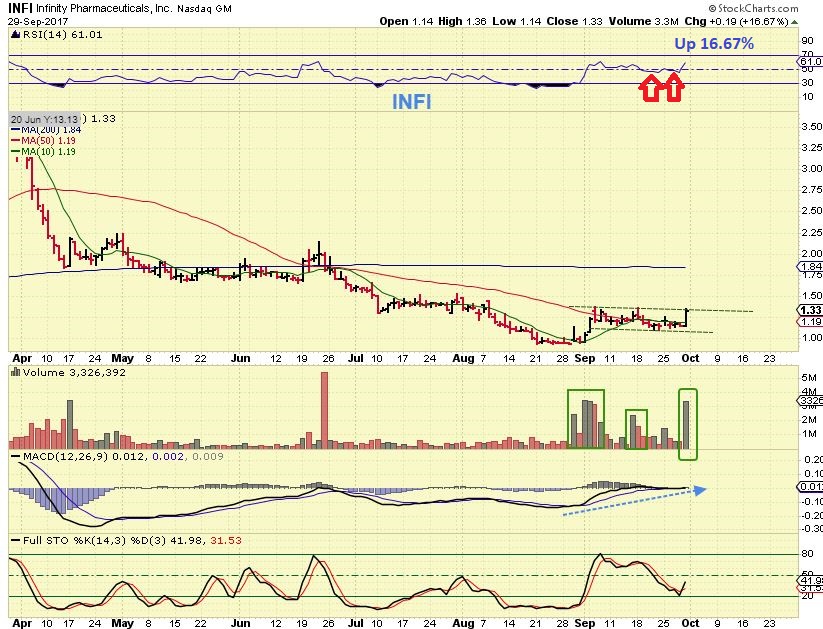
INFI – This chart looks great. I actually noticed it Friday when it was only up 10 cents, but it had big volume. I didn’t buy it then, but I should have and still may. This chart looks quite promising.
That is our weekend wrap up, Enjoy the rest of your weekend!
~ALEX
I am doing some extra research this weekend related to Gold, Miners, and USD to try to grasp better what may be happening currently. Things still look bullish in many ways, and as I have pointed out, several individual Miners still look bullish, despite the ICL in the USD 14 days ago.
I will share anything that I find of interest in the next report.


The weekend report is complete
What’s a ram pu…. 😀
Nice NAK chart ……I like ur thinking…;)
TX for releasing report early
. ……. and then proofing….giggle… Sundays r busy football days round these parts.. plus 2moro is opening day bow hunting.. gives me time to digest….:)
Peace brother…..
Thx MaRampu
giggle
Thanks for the early report CF.
I know youre a busy man.. when/if you have the time… I have a few tickers I wanted to ask you about… maybe some will be good buy and holds pending market conditions…
Im really like CXW.
ALLY, BSX, IVZ, KEY, MNST, SSNC, WY, STOR, BP, CVG, DSW, AL (I know this is alot… but if you have some time, ro time to time..)
Also, OMER… Reeeeeallly liking this one
I will run through these later, I dont recognize some, so it’ll be a good search later tonight or tomorrow morning.
OMER took off!
It’s a good set up, the chart does show good potential.
Right now it is up over 3% , broke back above the 50sma after crawling under it for a while.
I like that kind of set up and this could move nicely higher.
I like the CXW – I dont know about Long term buy & hold, but medium upside seems good.
I did not look at what they do, why it dropped like a Rock at one point, or fundamentals.
Chart had a very sharp recovery after the sharp sell off and then a more profit taking mellow type pullback to now.
refresh
For a ‘traders’ mentality, however, BUY & HOLD needs to go straight up all the time or you are viewing it as losing profit. That you may not find. I ran through Many of these charts . Good long term, very choppy month to month .
https://uploads.disquscdn.com/images/ca20ff35050a124547dde4f6496050dfa9756afac5ae8ba9508e705cd16866f8.jpg
Thanks for the early report!! Appreciate the effort….haven’t started it yet but it looks like a lot of detail! 🙂
From a elliott wave perspective…My take is that we are in Wave 3.
Now, the big question is… Where in Wave 3?
I know now many are in W3-2 retrace in their counts.
But there is another option, and that is that we are in W3-1 still.
The consequence is rather big on the whole outlook. Because if we are in W3-1-4, we may have one run higher before rolling into the ICL.
Below 1274.11, we invalidate this count and we may get the expected failed cycle which should follow on a ABC move down.
This would be perfect as we could then make yearly higher highs too as a good bull.
https://uploads.disquscdn.com/images/2587fbaa572b1ba01ad1c0e691dd72084bef9305870cf04a95be13fa1b139b90.png
Yeah, I’ve done several counts using E.W., but that is the way it always is for me. The 1-2-3-4-5 that you have shown is what I was ‘looking at’, but in hindsight, I look back and things change ( 5 now probably truncated due to cycle theory).
However, if iv breaks below 1, that isn’t supposed to be a valid count anymore, so then the 2nd count that you are discussing would come into play for me
where lll would be l and iv would be ll- That, however, just doesnt match the stronger USD and its ICL, and other cycle rules.
That doesnt mean that the count you mention above is wrong , but that count calls for a large 3 higher right now- and I cant match that expectation with cycles count, strong dollar, etc etc. Time will tell.
I have been looking into a few other things this weekend too.
Alex, Can you take a quick look at Japanese Yen. maybe look at $usdjpy. Obviously, the USD is correlated to gold, but I think gold and the Yen have an even tighter correlation. Even if the USD is expected to have an ICL, perhaps the Yen still could be stronger and GDX 30 is still a possibility.
I dont wanna take anything away from your weekend, I am just curious if this could be a factor.
Hi Rob,
yes, as I think you know, I did an entire report on the correlation of the YEN & GOLD – they are often quite similar.
The problem is, I’m not sure that I understand your question.
Are you asking me to look at the YEN, to see if it looks stronger than Gold & could be predictive that Gold is going to go against the USD?
If that is the case, I do ( On my own) look at the YEN at times, I just dont put everything that I do in my personal research into the reports, (sometimes I think that they are too long already).
I see the YEN as a bit weker than GOLD at this point, but I also see stronger divergence in the YEN, which makes it look like it wants to move higher.
Al together, this simply (at this point) , still matches my report. The USD could peak around day 14 or so, and drop into a dcl. Gold & Miners are due for a dcl (As is the YEN), and so the divergence in the YEN could be indicating that the dcl is coming. IS it any more than a L.T. Daily Cycle that is coming, when the USD finds its dcl and moves up in a 2nd daily cycle? It is just too early to tell.
I hope that helped, but I may not be understanding the question.
Thanks, Yes, your assumption was correct with my question, “YEN, to see if it looks stronger than Gold & could be predictive that Gold is going to go against the USD?”. That is a much more clear way of asking my question.. Thx.
A clear and fresh review! Thank you Alex!
Hi Gimli – Thanks! I dont see you post often, I appreciate the feedback. 🙂
I have been feeling similar about GDX to what CF lays out in his charts. It looks like I will have until roughly December to get back up to fully invested, and I will keep what I already have because while we are the bull is not trending higher at the moment, the potential downside to only $22 or so isn´t something I will try to avoid since we are almost there.
The timing for the Next ICL would be around then, and if you look back to 2015 & 2016…when was THE LOW in Gold? The ICL was in Dec 2015 & DEC 2016. The Dec 2016 ICL & RUN to peak also matches the ICL JULY run to Peak in distance pretty closely, indicating that we are in a consolidation phase rather than a runaway move higher ( Due to the need for a back test of the triangle break out , etc). We’ll see, that, like anything else, can change , especially if geopolitical situations remain tense.
Not sure if that makes sense, but it is how I am seeing things.
Yes, makes sense. Time to be patient, we will get an another opportunity before long. No sweat at all.
Thanks Alex. Great report. Very clear!
Thanks H50
Any thoughts on aumn? Ty
Hi Rm,
I’m not sure exactly what you are looking for, but I’ll try to help.
When I hear “Any thoughts on XXXX.” – I go & look at the chart and have many thoughts, good & bad, but I dont know if you mean “Should I BUY here?” -or – “I own it, would you sell or hold?” — “I own it should I add?” “I shorted it on the break of the 200sma, is there more downside?” etc , it is tough to comment in a helpful way on AUMN.
SO I’ll just say that ………….I owned it a few weeks ago, but I mentioned in the comments section that I got stopped out a while ago, because I did own it when it broke above the 50sma. Now it lost it & now the 50 & 200 are above price, so I am not buying it here. Right now it is going sideways and could bounce in a dcl, but that could also be a bear flag, because what I dont like is that the 50sma is sloping down again. It gives it a weaker look. I’m staying away for now, until I see some kind of strength sustained.
I hope that helped.
Thanks Alex. This has been a rough three weeks. I left a lot of profit on the table by not selling at the peak. Problem now as we get along is that I have two more that I should trigger stops on – Paas and Rgld. If I don’t, I break my rules. If I do I could be selling just at the wrong time. Dilemma.
Yes, and expectations were for this consolidation to end and Miners to move out higher, but if ( As shown in the report above) We are getting an ICL in the USD and Miners back test triangles, etc- we are basically still in a prolonged consolidation.
Some Miners held up better than others, as pointed out in the Friday report, with a few still up near recent highs, others are selling down. I understand the dilemma with letting a stop trigger or not based on the idea that we are due for a dcl and should get a bounce soon. I obviously want to sell in a bounce 🙂 I bought a new position ( leverage) with a dollar cost average of just under $19 and its at 17.93. I was buying at the lows, so it is not that bad, but those lows broke on Friday. I do not usually mess around holding leverage in a sell off, but I also know that with the Timing Due for a dcl, this could run to $23 in days, so I am still holding. 10% loss may be all I can accept though, and THEN the dcl will come – lol
My other Miners may be longer term holds ( GSS, DRD, etc) I havent made up my mind, but my leverage may need to take the loss and decide to try again or not when that dcl arrives. Delemma.
I agree with you. We are at moment where reality is colliding with predictions and it’s so easy to give it one more nickle or one more day. IAG told a story last week – strong strong strong and then a big red candle.
Well,
Look at IAG in June. Strong strong strong, one huge sell down day, and then sideways.
Last weeks IAG drop was near the 50sma…it could be the same story as June. Sideways consolidation.
IAG probably had too much profit taking and then hit the too close stops. I just hate to throw in the towel on these great companies.
Great report as always Alex, You continue to keep one open to all possibilities. As for the Dollar moving up, do you expect that to pressure oil and commodities as well as much as it would gold? Usually a rising dollar hurts the commodities and im heavy that sector right now expecting a little more run upside but definitely agree wit your take on the dollar and gold here.
I own some OIL & Commodities, and I am going to watch things going forward.
I do expect a drop in the dollar soon ( Dcl) so I want to see how Oil / Commodities move during the USD drop.
A weak bounce maybe? Then it is a sell.
I like the response to this. I’m pretty much all cash with a few starters in some to make sure I keep eyes open.
I’m looking for some long term buys. I’m liking ANW but will wait for your green light. I don’t like getting in too early – seeing deep red waiting on the rebound and take off never sits well lol.
$$ ripping higher overnight and has dropped gold quickly to 1272, hope we get some recovery soon, didnt think this DCL would take so long to evolve. Probably is that like others now I’m just looking for a way out. Wouldn’t that be a way to get shaken out – be in too early and then exit too early when it finally goes. Either way, I’m ready for this move!!
I’m reposting this gem that Phil put up late on Fridays report just because I really like the last sentence in it. It will give me pause to let stops be hit today without a really good reason.
http://www.zerohedge.com/news/2016-10-09/theres-one-very-simple-reason-why-precious-metals-were-pummelled-week
Thanks Ron, very good and I hope U R right.
oh oh. https://www.travelchinaguide.com/intro/festival/national.htm
All banks are closed for Oct 1-7 – interesting
? Whats that
We are discussing a Chinese holiday on this thread of comments
The story could be valid, because obviously that 1 week holiday would be an annual event…, but I wrote in the comments about this earlier last week and wondered ‘when does that weekly holiday fall on this year”?
I ask because I wonder if anyone besides me read the date that it was written??
#Due diligence
i did teacher…
😉
https://uploads.disquscdn.com/images/33150856f2867a4448b49ff2a078d397c1b3673acdc86623b8e7c2c45e0eab29.gif
Did u grab some SNAP?
nope
Silver is up on the day, and miners not down as much as I´d expect. Still sitting on over 50% cash ready to allocate to miners when they either resume uptrend or puke out really hard, a sharp day down with a down open following morning would also have me buying. Until then it´s time for me to just wait.
I wonder if GLD will fill that gap down at $120, not too far away.
I let RGLD get hit – I had too small of a position, don’t want to put more in it, does not seem to swing enough and my loss was teeny.
So far not a good sign for metal and miner bulls, both gold and GDX are at critical points on my long term chart monthly charts, flipping to sell today if they don´t get up and get going today or tomorrow. It doens´t mean they are going a lot lower, just that they aint going up anytime soon if stay this way. They also could go a lot lower but my guess is they will stay in range, giving further credence to Alex´s potential December area for a turn higher again.
I only have two longs left and will not sell unless stopped out. In the past I have tried to ¨save¨ the extra money of what I though might eventually stop out, and it has cost me more than it has saved. At times if the miner can hold in or inch higher while the group is going down, it´s best to keep it. So I will just let stops do their thing and NOT look to add anytime soon until my monthly charts cross to buy again. This is all longer term stuff and dosen´t apply to the short term traders here, if I were short term I would be looking for a bounce.
mornin y’all
took some CATB at open
from last week SGYP nice followthru
KNDI as well
CATB…once it broke that 200 dma…..off she goes
ARLZ is another that is just at it’s 200 day and trying to break over it…
GDX broke below the 200sa, reversed higher and went green.
Can I get a dcl now please?
NSRPF – That is a strong Miner. No pullback, just a flag like consolidation
GSS – also still holding near recent highs above the 200sma
CDE – Still above that 200sma too
I do now see many green Miners after that opening drop
PAAS, ABX. GG – (nice reversal) AU, CDE, AG VGZ, GORO, MUX (huh?), etc
See if the reversal can gain traction
I feel like gold will NEVER go UP again. There is your sentiment reading for the day!!!
I might take a 6 to 10 day trade shorting oil drillers OIH, as soon as I find the weakest charts in the group, but also must note that the OIH has now turned bullish on the monthly charts, so next time they pull back on daily chart (like when I cover the shorts I will put on later), I will be buying them LONG for several months.
One thing I like about energy is they don´t seem to cap the gains, energy is allowed to run more often than metals from what I have seen.
Oil daily cycles can be twice as long
Thanks for the reminder, was thinking just to play it out of overbought stochastics (5) on daily chart. Not even sure I have it in me at this point, really still focused on miners and the big score that lies around the corner.
The longer we go sideways, the more likely it will be another sharp rally like the 2016. Had it started this summer like we were guessing, might have been longer lasting and not as steep of a run from what my charts suggested.
Yes, the longer consolidations do lead to the best upside, as long as we dont fall asleep during the sideways moves 🙂
Look at the base on ECYT and CRMD 6 month charts – Not a miner, but I’m just pointing out that THAT base would put you to sleep, bore you to death, make you want to sell, and then Boom.
I’m hoping that MIners going sideways lately ( not that tight, but consolidating) can get some upside thrust this year too
The HOS purchase last week is working out well, as it crawled along that 50sma
hey man.. U said no more talking about this one…. Look what u did. lol – u gave me entry
I am holding, but Oil is pulling back here, so you may get a lower entry if you wait.,
It looks good crawling around that 50sma, but the crawling may continue.
im looking for LOD entry..
GDX & GDXJ green, several Miners reversing to green after the opening sell off. Hopefully that means today is the low of a DCL, an tomorrow would be day 1 of a new daily cycle – but we wont know until we get follow through
Refresh
Unfortunately – it looks too perfect again, but we’ll see
.
https://uploads.disquscdn.com/images/c7f559134d4e2e104448849f22dae7bf8201798cf6cf5c300d4b0f568feb8509.jpg
so it looks like both gold and GDX have made a new low today, the dcl seems to get longer and longer, could it be that we made a day 2 peak on sept 25 and it is downhill from here?
CRMD nice …. 😉
Very nice, huge volume
I still like INFI too.
No joke, I like long tight bases, so I was watching ECYT last week ( Did not buy it).
The base looked constructive, looked at that along with CRMD and a few others.
Just looked at ECYT – up 88% 🙁
oh man….
yeah i know u like those tight bottoms….
good… i bought CRMD so … giddyup…
*MEOW
kndi lookn good .. jnug next ;o)
giggle
Very nice break on KNDI
i have little short of 9 as my target….
woulda think of somethin like this… ;o)
#polyanna
https://www.tradingview.com/x/FPCIFVMC/
Steel stocks looking good
X, AKS, CLF. SID all following through upside after a selling period.
Maybe it’s wave 3 time?? 🙂
FYI – I look at UCO & USO – Islamd top. That would indicate to me that OIL is likely selling down into more than a 1/2 cycle dip, it might be selling down into a dcl. They can be (Roughly) 30 – 50 days long, so caution on the energy plays.
I am holding HOS & LGCY, but out of SN at this point
was waiting to see how these little O&G plays handled the first significant pullback in oil, several bouncing nicely from the lows today: PGH, AREX, WTI…DNR
holding strong. GUSH looking pretty good too
I took a profit on all oil stocks ERF, HOS, SN and left the party. I don’t trust the oil over supply issues.
Yes, even XLE & OIH (when compared to OIL) are holding on nicely
Just shorted OIH etf at $25.78, don´t have the time to go through all the individual charts so the etf will have to do. Also BOUGHT some more MOLOF, small oil stock that Bob Moriarty likes. I usually don´t take investment ideas from other people (trade ideas yes, but not longer term investment), but Moriarty did give me a 350% gainer in NSRPF. Wish I had hung onto some!
CLDX tagged 200 day, moved down, trying to regain?
T.. sent you mail
Ya, just saw it, just responded 🙂
I started a position in NGD this AM. Just enough to keep me aware.
I like it!
I’m holding JDST.
I always sell too soon, whether long or short. I was hoping to see some real bearishness on this board to guide my sell and convert me to a long. Haven’t seen it yet.
Is anyone else in DUST or JDST?
i was.
DUST … small position with a very tight stop at 25.40 which got took out earlier today.
may add back, dependin how it plays out
Maybe a ‘shake out’ first.
GDX below the 200sma, and GDXJ is sitting right on a trend line from May.
I remember when you posted that you took a position in JDST on that 1 day slam, somewhere near $51.
Brave buy 🙂 And up near 10% now I would guess ( thumbs up)
looks like oil/energy trying to bounce
CLF news:
Cleveland-Cliffs (CLF +2.7%) agrees to acquire U.S. Steel’s (X +1.2%) 15% equity interest in the Tilden Mine for $105M; CLF already owned 85% of the joint venture.
With the additional capacity, CLF forecasts pellet sales volume in its U.S. Iron Ore segment will increase to 20M long tons in 2018 from an expected 19M long tons in 2017.
Tilden is a Michigan-based iron ore mining, concentrating, pelletizing and railroad operation with ~900 employees.
SSYS decides to finally play catch up
yuk.
did you get back in it?
nope… I missed alot of my entries today. I wanted OMER, PGR, KW, and AL today… Missed entry on all…
Im still struggling with entires on swings as Im so accustomed to day trade entries.
actually tis not as runaway as i first thought.
has overhead resistance up to about 26 then clear to around about 36.. so may still dive in
dive in?
water analogy… to jump in
dont you have such an expression in US?
LOL, I need coffee brother
just noticed SINO did a +30% round trip back to the level where i got stopped out below the 50sma, bout a month & half ago
Shake out at the 50sma.
DDD playing along too
Crazy volatility in WTI today!
In the report – CRMD – It looked ready with that Volume pattern. Up 18%
INFI – in the report, because it looks ready – pulled back a bit today, may bull flag here
ECYT – Not in the report, because it didn’t look quite ready – nice base, but needed volume. Up 105% today on Mega volume. Ugh
wow………………
well at least i jumped on some CRMD… not bad… not bad CF ;o)
Nice job
GALT is one that I used to trade too – getting some love, but I’m not in it
Biotech picking up speed – caition just because this sector can have th dreaded failed trials, etc, but upside ( And downside) moves can get crazy.
CRMD — stretching it out now, up 25% now.
GALT really breaking out now up 16% ( These started slowly, but just kept going).
ECYT – forget it = 106%
SO –
PLX – trying to break out? Could be a buy right here
ARDX – This looks like it wants to go to $10 , great 6 month daily chart
thank u .. i took some GALT
also this am .. CDE and VGZ …red to green nice…
Hi Alex – I’m trying to understand your analysis on LABU a little bit more. Are you suggesting we’ll get a drop from current level to complete the inverse H&S and THEN a rally? Or a continued rally from current levels? Thanks.
Hi Peter,
The LABU chart in this report is from a report a week or so back. I called that back on Sept 25 as an inverse H&S in place.
That inverse H&S is drawn to point out the 2 shoulders and the head, so it was the correct call, it has broken out.
Refresh for LABU Now
https://uploads.disquscdn.com/images/eea696ddc59973395e66da626196df9c84aa9432d76ecf10cd185bac6c17c4ce.jpg
Still in LABU but I’m ready to book profits here, not willing to let them slip away!
IPI – The gift that just keeps giving. It seems like it is down on the morning, and then up in the afternoon.
Fate … vrooom vroom .. gearing up….. ?
I wanted to add to HOS , but there is a chance that it back tests not only the 50sma, but the break out from that consolidation June through August. For now, I am just holding my position that I started again last week.
Pretty big intraday swings on this little energy stock.
PXLW ….
Yeah, I see a lot of nice TECH set ups, just a tad leery about NASDAQ with the VIX under 10, but so far it is acting fine.
I do like DDD, SSYS set ups right now. I used to trade a good number of Tech out of lows and lately many have been surging. NETE, SIFY, PXLW, GRPN, and so on, but I haven’t traded them in a long time. HPJ, JRJC, FIT, CY, AMD,
SO MANY to look at- but better for quick trades
these days im scalping.. holding just a day ish… or even just selling on the first am pop.
;o) thank u … 😀
id much rather leave some on the table then watch it disintegrate …
Ditto …
and rather be too late than early… 😉
much rather ….
https://uploads.disquscdn.com/images/049f9d4362e5af990a2734a1b4ea4f4792ffbe608ab91c730f68c5906507abf7.jpg
Is that scene not from an Indian movie?
? no clue… just grabbed from images …
Yes, it is from 1996 🙂
If you one of the train running over somebody…
Anyone notice how nicely CDE still is with that 200sma.
It will not sell off
Oh, And NSRPF – Champion
Nice, all the silvers doing well today.
Alex, any tips on when to add to NSRPF positions? Can’t seem to get a good dip on this one. Terrible problem to have 🙂 Silver lining in my gold portfolio at the moment.
That has a price target of about $7, so its pull backs along the way have only been around the 10sma.
It formed a sideways consolidation, (which drops more to the 20sma) cup & High handle, and looks like the handle could be finishing up actually .
If we get a drop tomorrow, it may offer a buy, but if we are putting in a dcl, this will probably just run higher.
Thanks Alex!
anyone still in *BOT?
recovering nicely today
Me…still waiting for some fireworks
have a target of around 3.00 if it can get past 1.40ish
That would be nice, where ur stop? I’m at 1.04
1.02 was my initial stop on the first run, but i’d be tempted to raise it higher now..
my break-even is at 1.09, so that’s where i’m likely to exit
I’d be out before then, but might move my stop to 1.10 now
LoL.. snap (more or less) 🙂
M 8 0 T 4 month chart still looks great 🙂
it has formed a nice right shoulder on the dip to 1.07 or woteva it was
lol … dorks…
Yeah. Did you try to MB*T more?
not sure which works best.. maybe we should also test out MBO* & M*OT
Just locked in SNAP from the 50sma break. 14s to 15s
OIH XLE are looking like OILS drop is still just a 1/2 cycle low.
VOC, BBG, WTI , etc look very good.
WG, WLL, AXAS, AREX, CPST, not hurting
Many Oil stocks recovered to even or green, and that ANW chart is just getting better. The one I own (HOS) looks like it is repeating last Tuesdays move.
grrr.. SN recovered just as i stopped out at break-even
I did too, and it is a perfect reversal, shake out kind of move.
HATE that, but it happens.
LGCY has been selling off daily and coming back, now in bull flag type formation as it moved sideways to the 10sma. I am tempted to add, but there are SO MANY things setting up ( possibly Miners) that I want to be a bit more patient.
Refresh
https://uploads.disquscdn.com/images/2dd7357a851bf5e48ec8912091985660c3acadd889ab14dc74b482886d1ece96.jpg
problem with being in these energies for so long at the lows, is that i get conditioned to expect deep pullbacks to a right shoulder… but they not necessarily gonna play that game anymore.
surprises to the upside!
Anyone like the look of GENE for total speculation, thinking about 2k shares with a stop at .80
nice wedge type consolidation – I could see that POP to the 200sma ( About $1).
TWTR looking nice here as well
DRD strong come back
I guess I should have just jumped into ECYT when it was ‘only’ up 30% this morning. Man!
Up 130% right now. really?
Never happens to me lol
first non-GDX/GDXJ stock i bot after coming to CF went up 700%.. i bailed at 500%
It was bad though, cuz i then expected all CF stocks to do that 🙂
LOL – So do I, even now 🙂
.. ps.. and that 700% happened in about 3 days
now please advise CRMD … to follow suit.
awesummmmm start to the week….
txCF ;o)
woop
URock
interesting close watching gold drop and GDX rise…
Also good to see some strength in the GDX:GLD ratio. Today was the first day since Sept. 8 that it closed above the 10 sma. AND GDX held it’s 200 sma. I’ll take as many small victories as I can get at this point.
Dave , thats a good call 🙂 GDX:GLD and a few other things do look like the selling is drying up
Alex, I just noticed that small caps (IWM/TNA) have been rocketing up since mid-August while my old favorite TQQQ has been flat. SPY/UPRO and the Dow are also doing well, but not as hot as the small caps. I have never traded small caps so I don’t know why they are so hot right now. In hindsight, I really missed the boat. I should have gone into TNA heavy on Sept 11 after I bailed out of my miner positions. I would appreciate it if you would take a look at the Russell 2000 and give us your view of the chart. Thanks!
Alex, any reasonable price targets for crmd, might have to use trailing stop?
In the weekend report (Above) I pointed out the gap may fill, 200sma may get tagged, but who knows if this will stop there.
Moves like this aren’t reasonable 🙂
Tuesdays report has been released