Actually, we were expecting higher prices in many of the Market sectors yesterday, so this Green Board that I captured Thursday afternoon was a welcome sight. Let’s discuss these GREEN market Sectors and some Stocks.

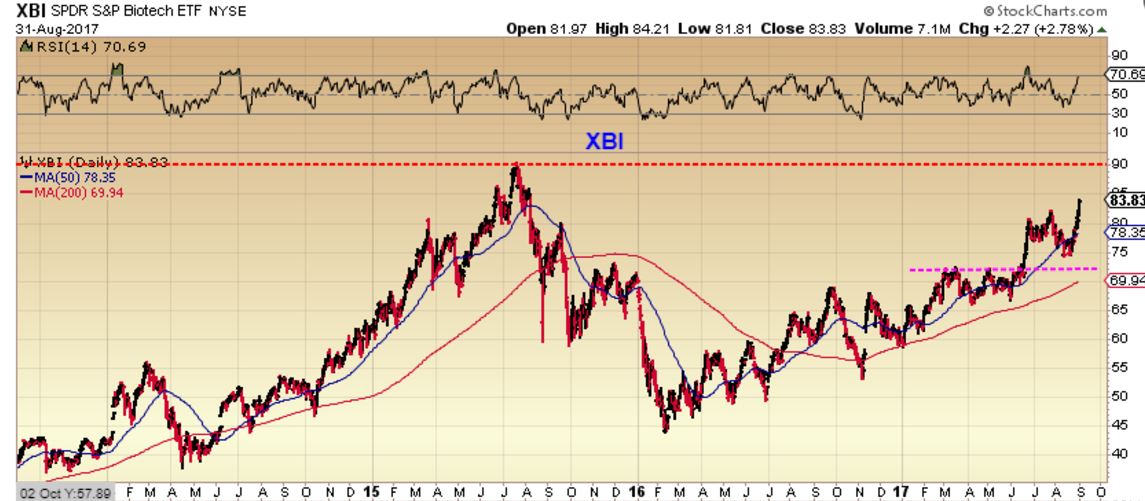
XBI – Continues higher, and when it broke above the magenta line, I said that my first target was that $90 area. It stalled when the general markets corrected, but I believe we are back on track.
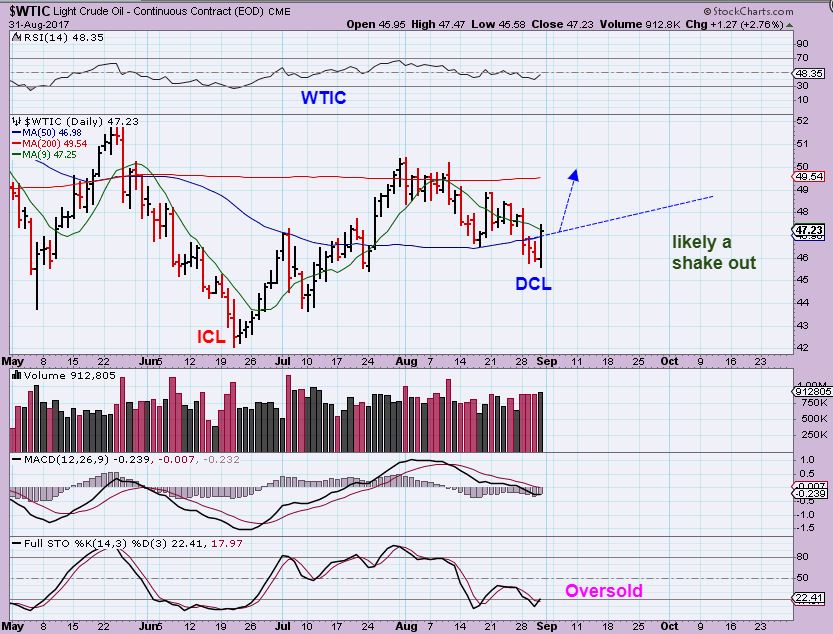
WTIC – Tuesday we were on day 48 , and due for a dcl. That was pointed out as a ‘shake out’ to get those buying the tag of the 50sma to sell and buy back in later.
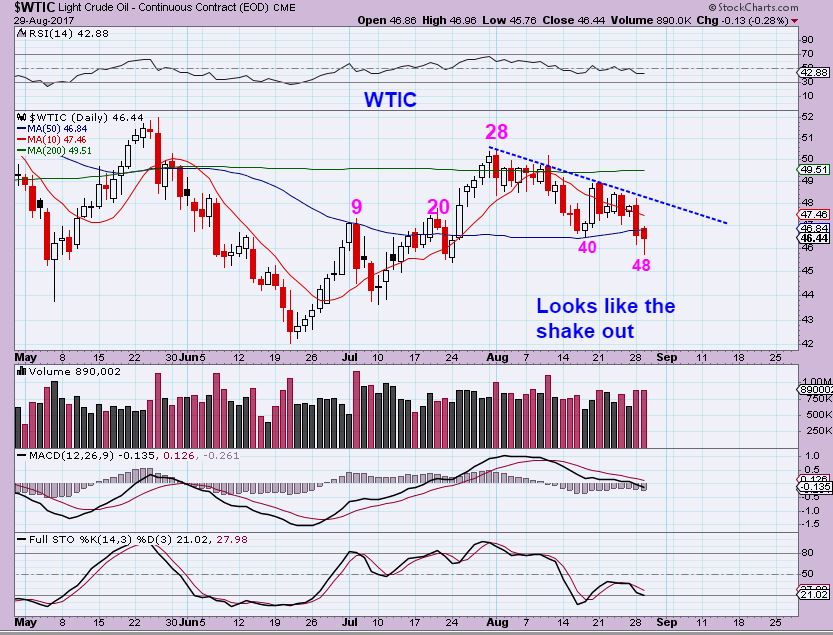
WTIC – We did not get the follow through higher on Wednesday after inventory reports, and that surprised me, but we did get it Thursday. This should be the low on the 1st daily cycle and the start of the 2nd one.
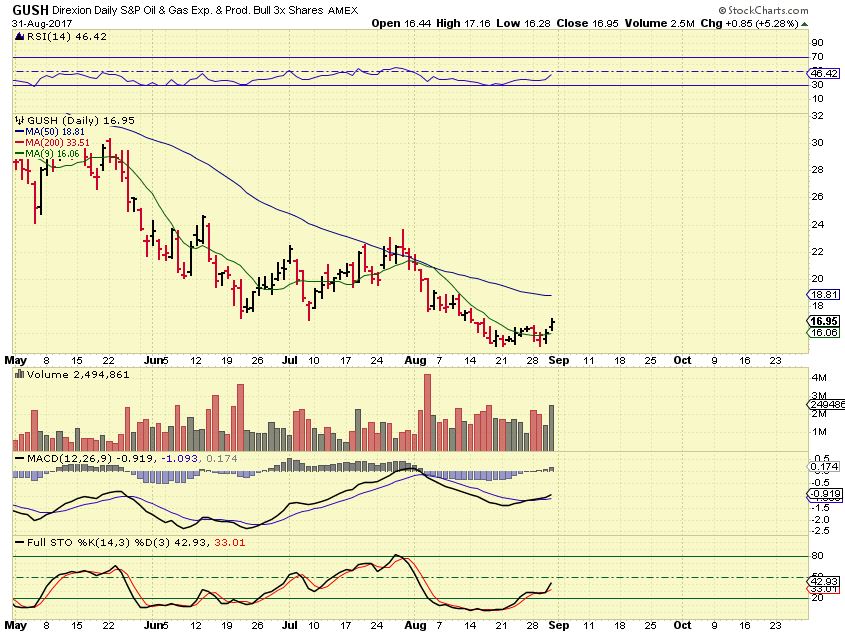
GUSH – I pointed out this low risk entry (in a very high risk 3x etf) for GUSH on Tuesday just under $16.
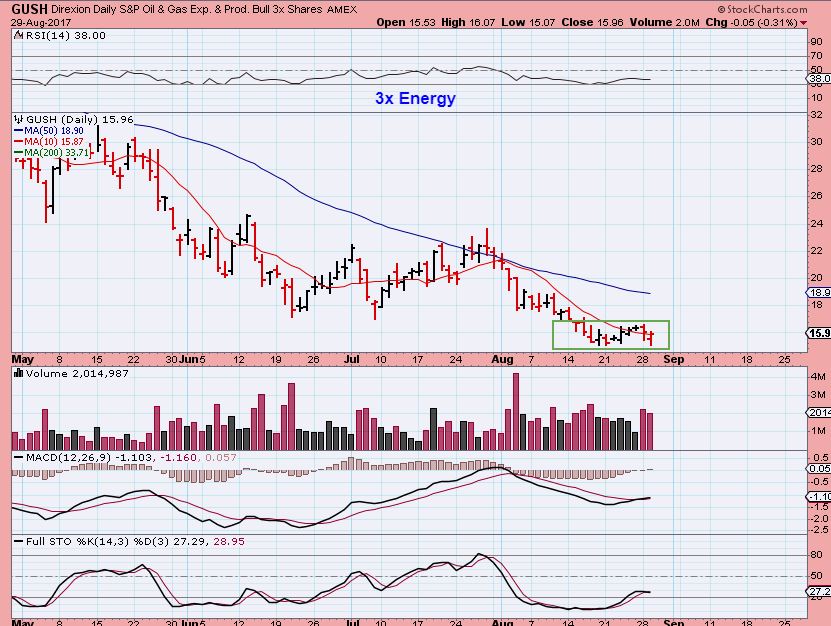
GUSH – Gush is now breaking higher with OIL. I believe that this has a decent run higher ahead of it, but even s mall scalp to $19, the 50sma, would be good.
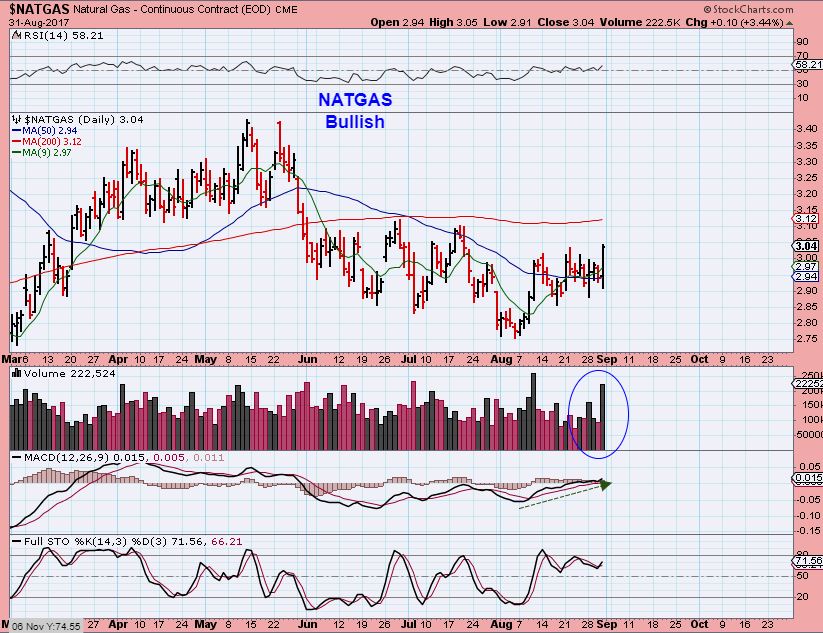
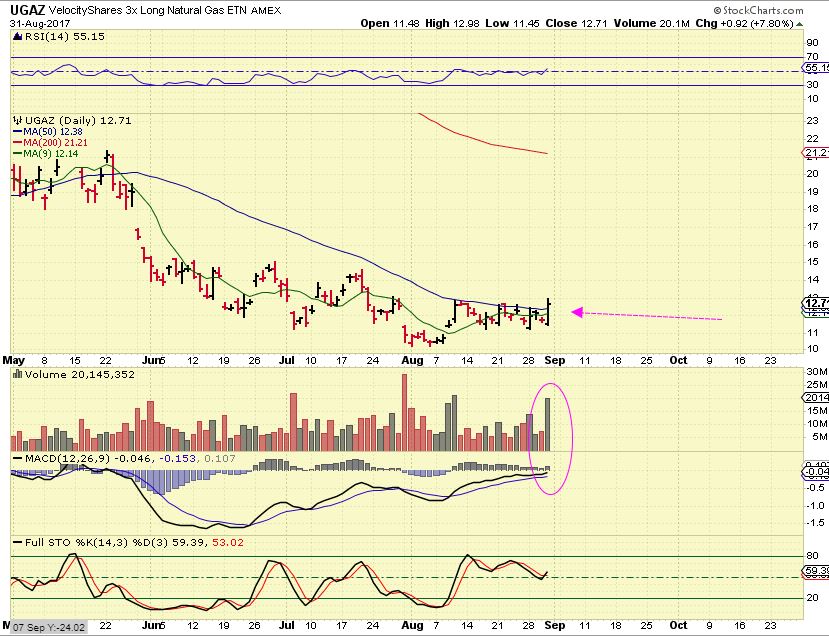
NATGAS – NATGAS was setting up bullishly too, I mentioned BOIL & UGAZ for the higher risk traders too.
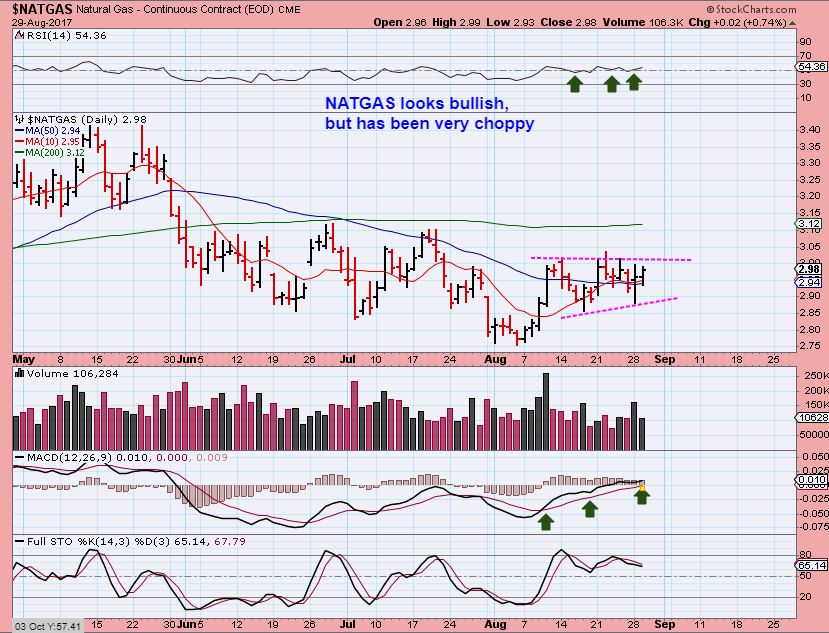
NATGAS – Thats a nice high volume pop
UGAZ – And also on Tuesday UGAZ & BOIL were Pushing against their 50 sma. I expected a break out and this could be bought for a scalp trade, or wait for a break.
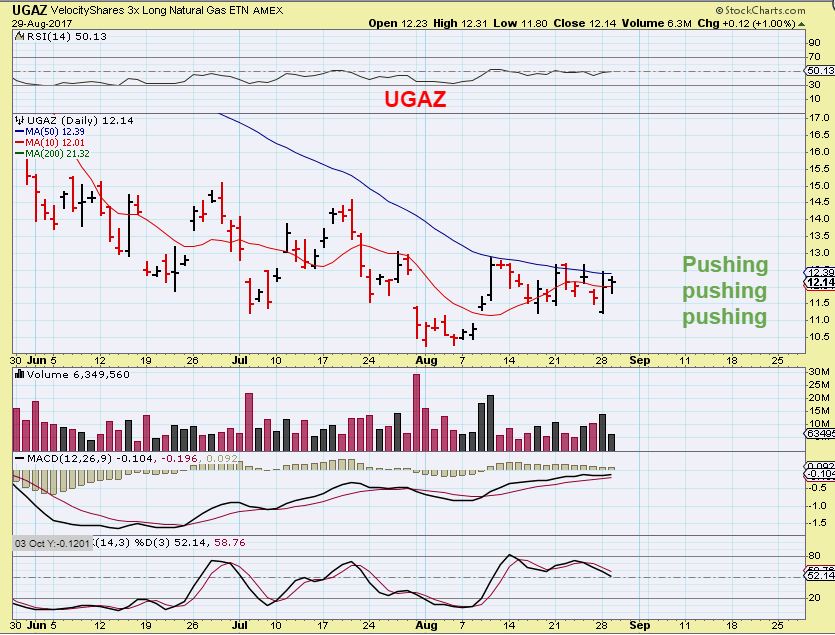
UGAZ – And yesterday, after the NATGAS inventory report was released, a Nice pop came into UGAZ & BOIL too.
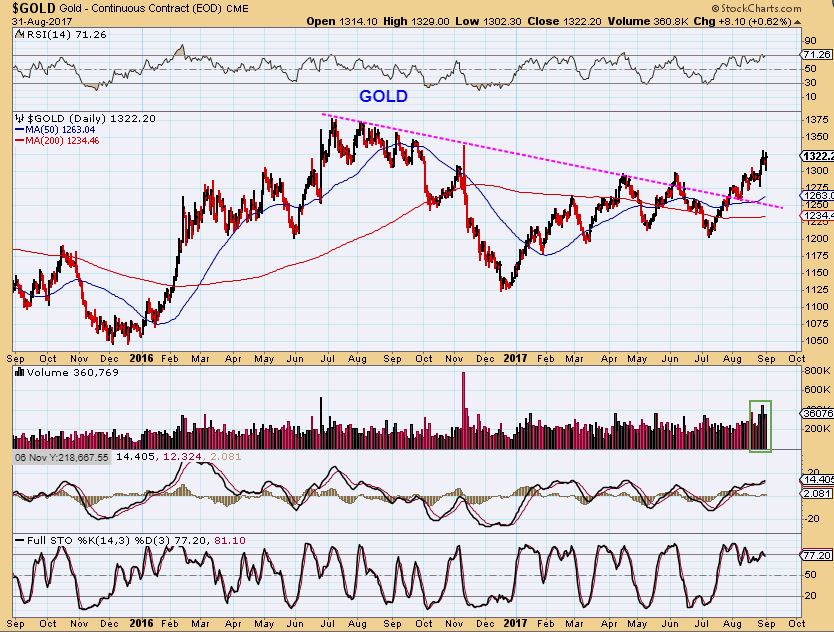
The GOLD expectation was a possible A-B-C drop to that $1290- $1300 back test
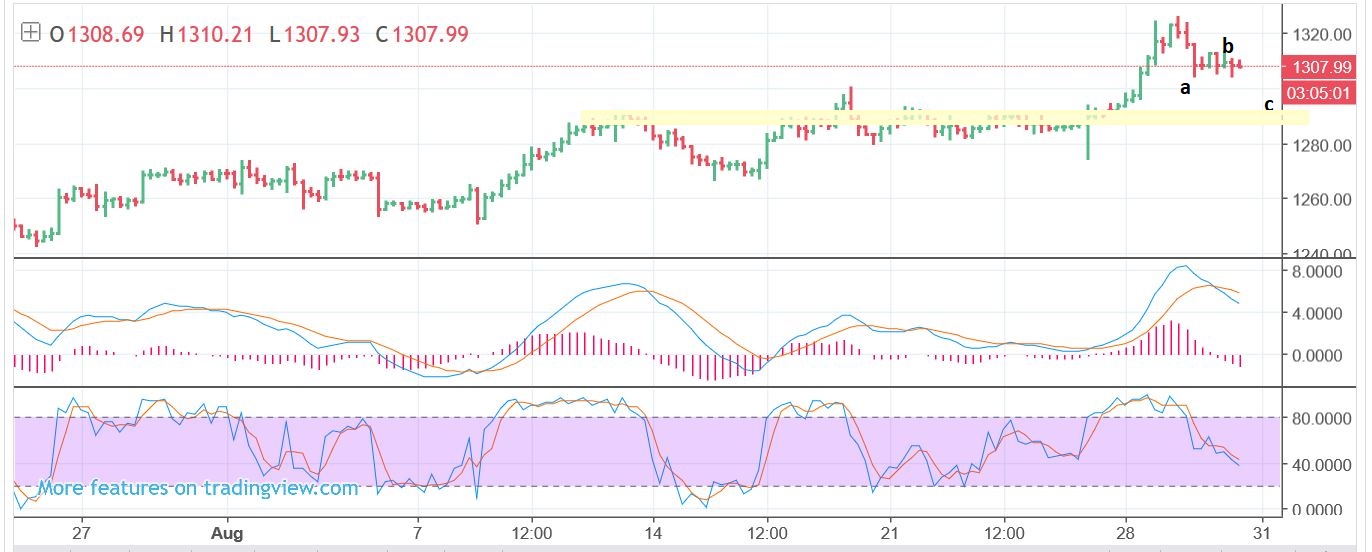
GOLD – That drop to ‘c’ seems to have happened overnight on Wednesday. Gold then moved higher yesterday. This could be a short term double top because…
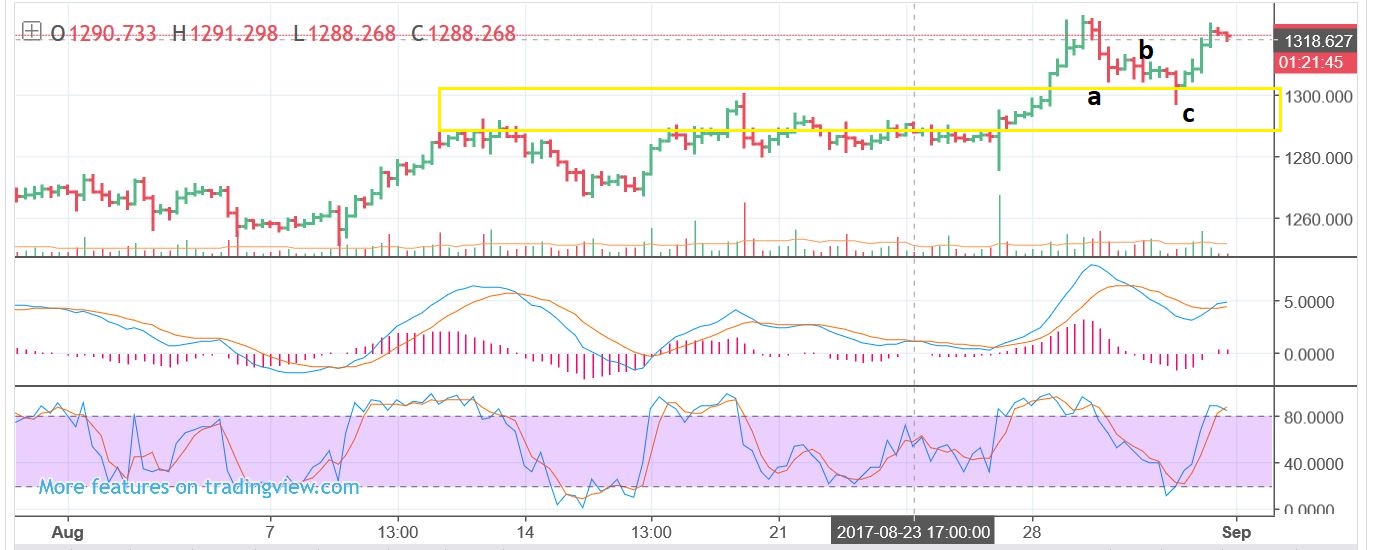
On the daily chart, Gold is in an upward sloping channel, but is already at the top again.

GOLD – So far, this move higher out of the ICL has been very steady and bullish.
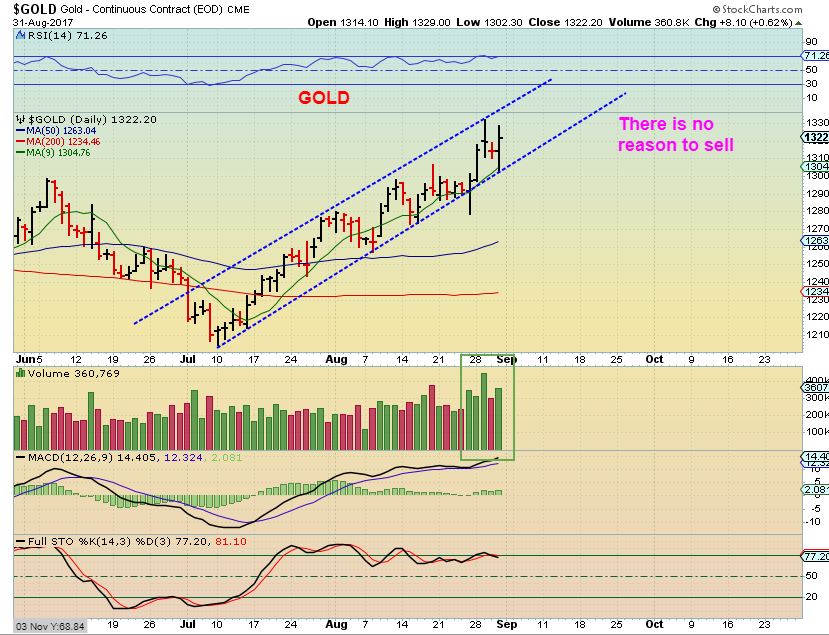
GOLD – We got a tiny back test immediately after breaking out at the 50sma ( day 21), I hope that that was enough so we dont have to revisit this area again.
2 charts of GDX
GDX #1- This MIGHT just run higher, matching the run from Dec to February, with small pullbacks along the way. This would then be forming a giant cup. This would be a bumpy ride, not a straight shot higher every day. OR…
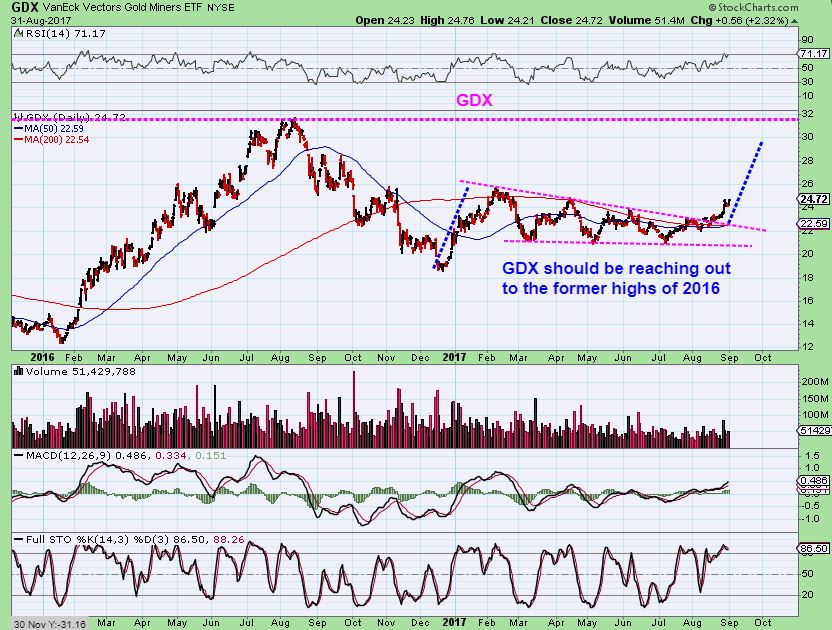
GDX #2- It is absolutely normal to expect that a back test could come, so let’s just keep that in the back of our minds as this plays out. Buying & holding miners at this point has been a good trade. If the move unfolds like the chart ABOVE instead, our Miners will just continue to grow. I will discuss that.

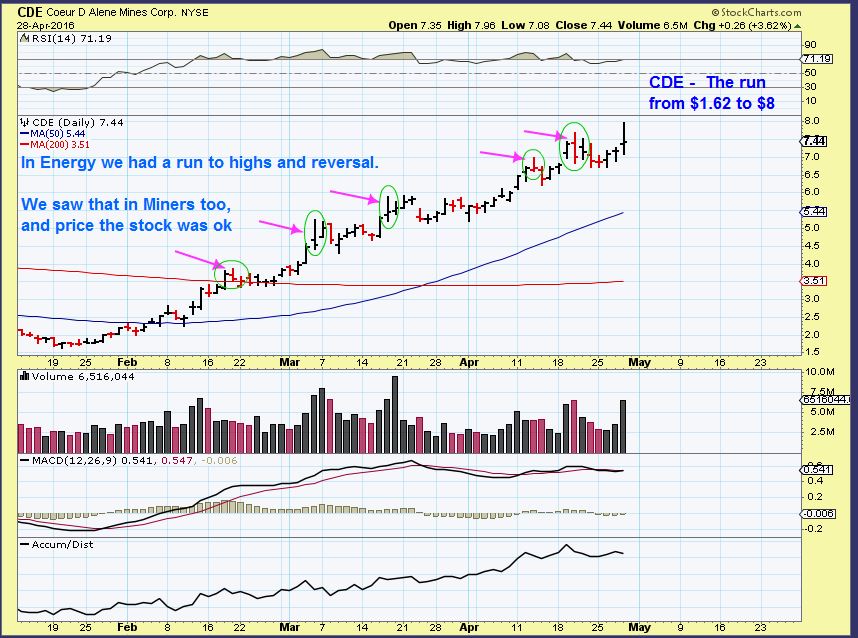
I WANTED TO GO BACK AND LOOK AT A STOCK LIKE CDE ON IT’S RUN HIGHER IN 2016. THIS CAN HELP US TO SEE WHETHER THE CURRENT MOVE IS SIMILAR TO THE 2016 RUN OR NOT. THESE ARE OLDER CHARTS FROM THE 2016 RUN, SO YOU CAN IGNORE THE WRITING ON THE CHART.
CDE 2016 – Notice how CDE, as it was coming out of the lows, moved higher to the 50sma and stalled, then pushed above it, and next had a dip to test the 50sma. From there we see it move to the 200sma, then it ran along it for days. No major pullbacks along the way, just higher, sideways, higher, sideways. WILL WE SEE THAT NOW? I THINK THAT SOME MINERS ARE MOVING LIKE THAT. IF SO , YOU WANT TO OWN SOME MINERS FOR THE RIDE. We also had strong reversals or dojis that did NOT lead to a long sell off ( GREEN CIRCLES). We have seen that a couple of time recently too.
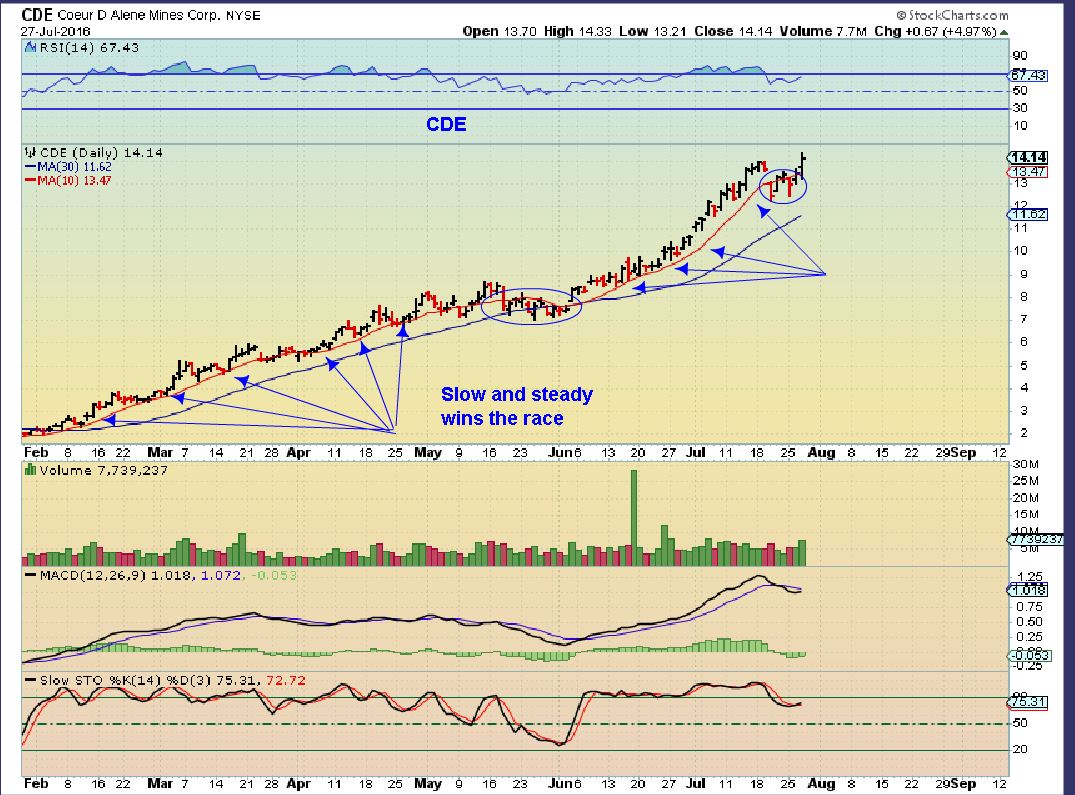
CDE 2016 – Please notice that there WERE multi day pullbacks, but for the most part, it rode the 10sma higher. I do see a few small 3 & 4 day pullbacks / sideways moves, so it may be best to ignore the wiggles and apparent weak days if we get into this type of a move higher.
This weekend in the weekend report, I am going to go over this in detail. I have found some interesting similarities ( so far) with what we have right now. That could help us to see how this may play out going forward. It looks pretty good, at this point. Enjoy your Friday trading, and I have a large number of charts below for you to look over. Have a great Friday and a great weekend!
~ALEX
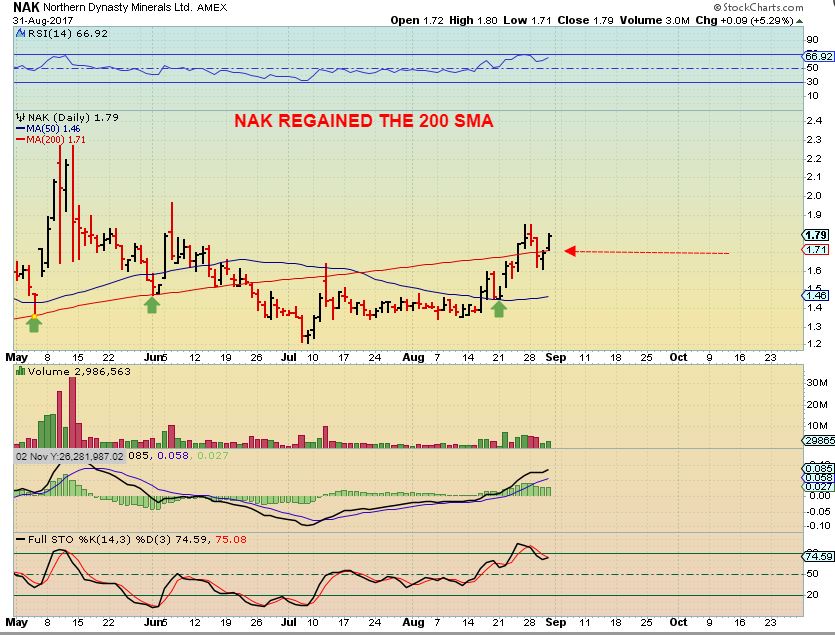
NAK – I added yesterday as overtook that 200sma again. NAK has reacted around the moving averages as expected, but still looks bullish. Miners & Metals sectors have been bullish.
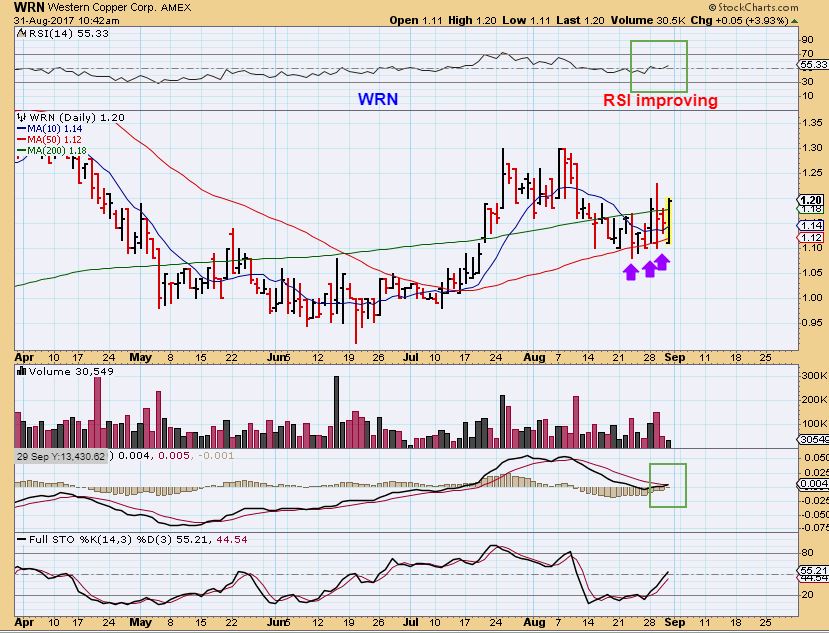
WRN – I also Bought WRN here, since it is finding support on the 50sma.
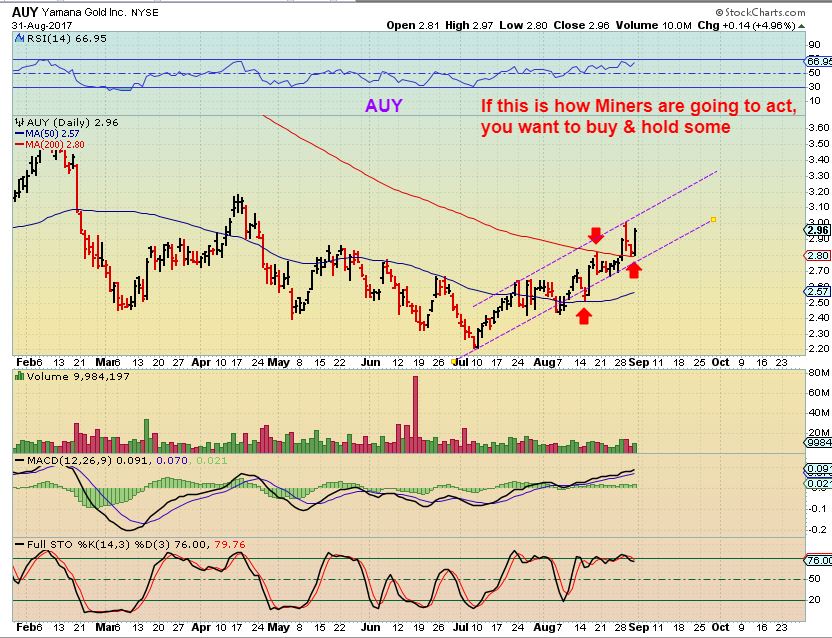
AUY– Is this how Miners are going to progress? If so, you just want to own a small basket and accept the wiggles. Notice that it goes higher, then mainly sideways, and then higher again. I wanted to point out how AUY ( red Arrows) Moved at the 50sma and the 200sma too, and then we’ll examine other Miners currently working in those areas…
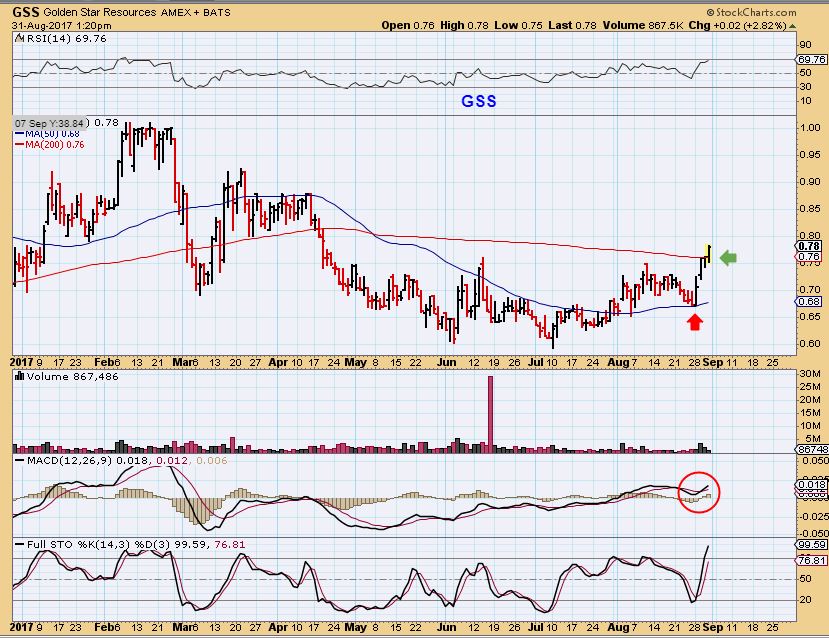
GSS – GSS broke the 50sma, back tested it ( the 1st Buy), and now pushed above the 200sma. I added again yesterday, even though this could drop. My thinking is that price may never go below this area again, and if it does, the 50 should hold it.
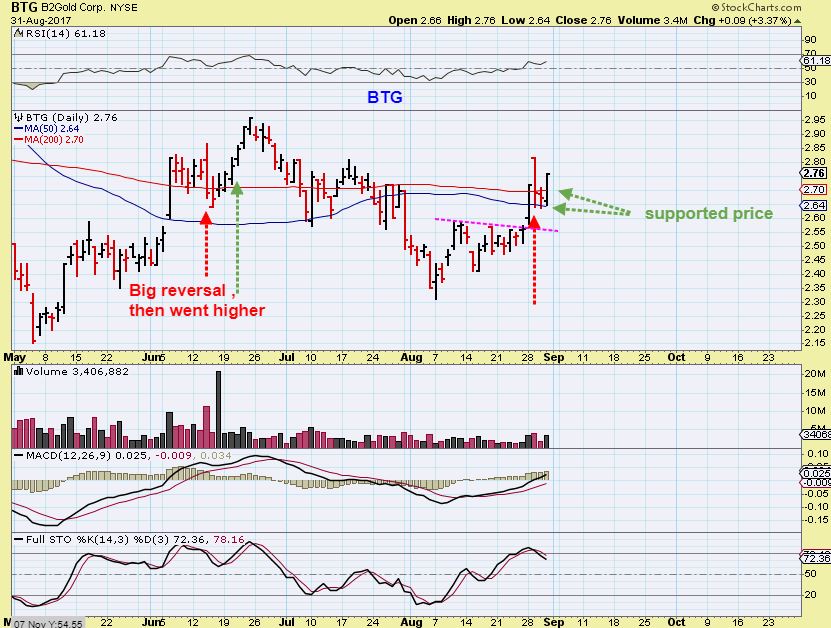
BTG – Is also doing battle at the 50 & 200sma and winning as of Thursday.
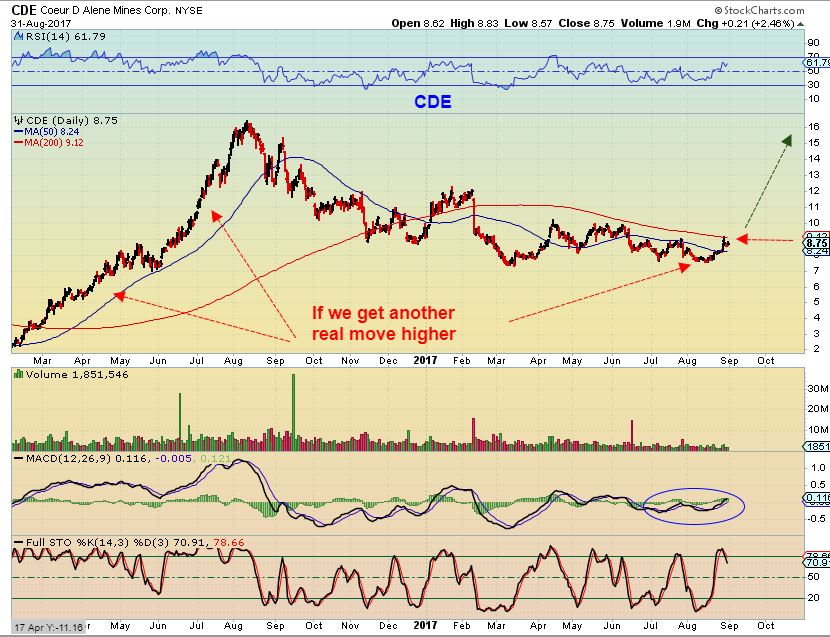
CDE – CDE has broken above the 50sma and pushed against the 200sma and then pulled back. I would buy it above the 50sma, and also if it successfully breaks above the 200sma. You can see huge potential in this one if it gets going again.
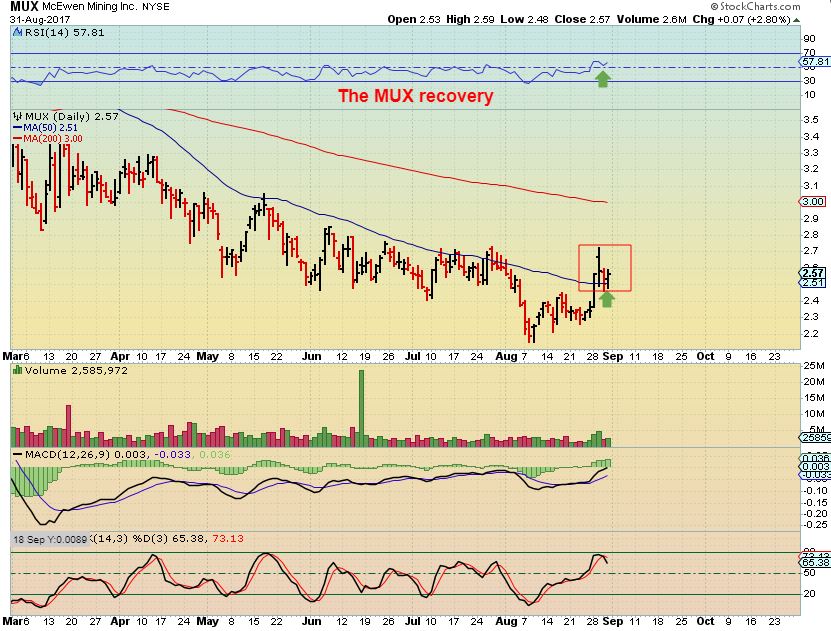
MUX – MUX broke above the 50sma and sits in that area right now. Mux looks to have had a shake out, since it regained that lower trend line. It is recovering and is cheap at the lows.
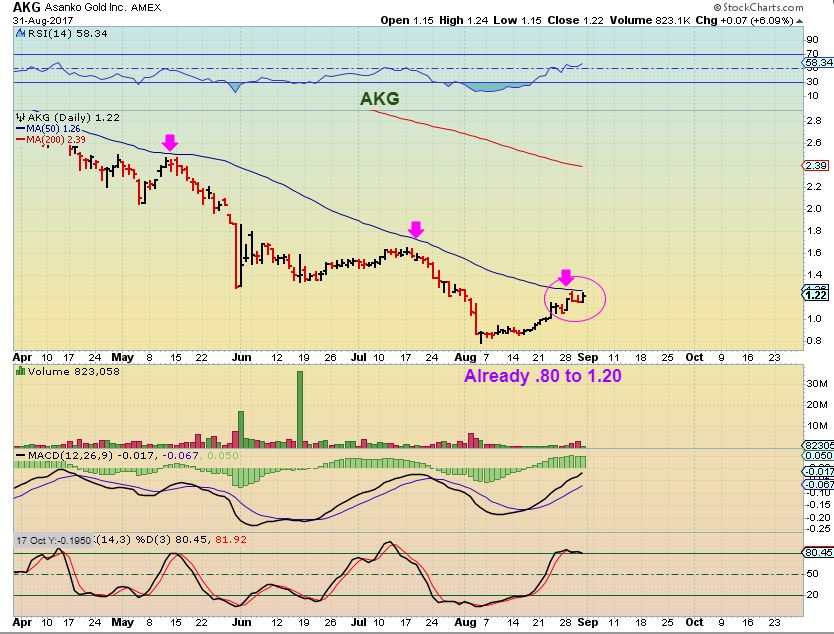
AKG- So far, that was a pretty big move already, but it looks like it has a lot further to go in a bull market. It pushes against the 50sma currently
IPI – I bought this break out, but with IPI , we did have seen a false break out and a drop to the 50sma in May-June. ( green writing). I will add at the 50sma too, if we drop there. If someone buys this break out, your stop can be below the Magenta line.
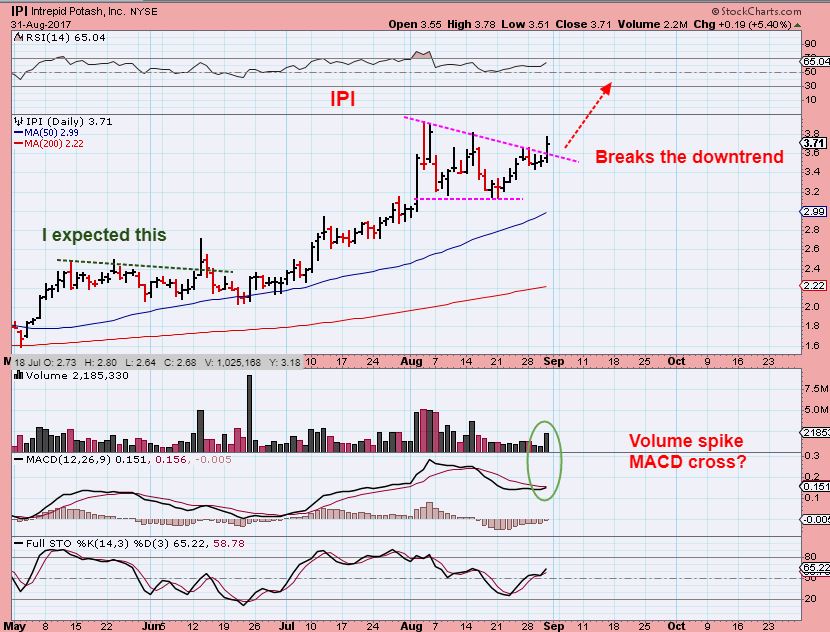
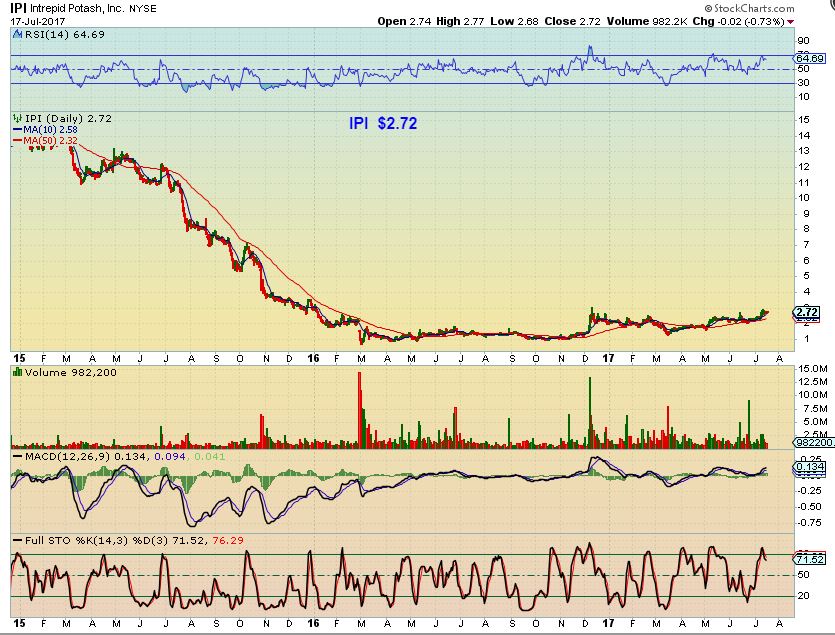
IPI REMINDER – BIG PICTURE POTENTIAL
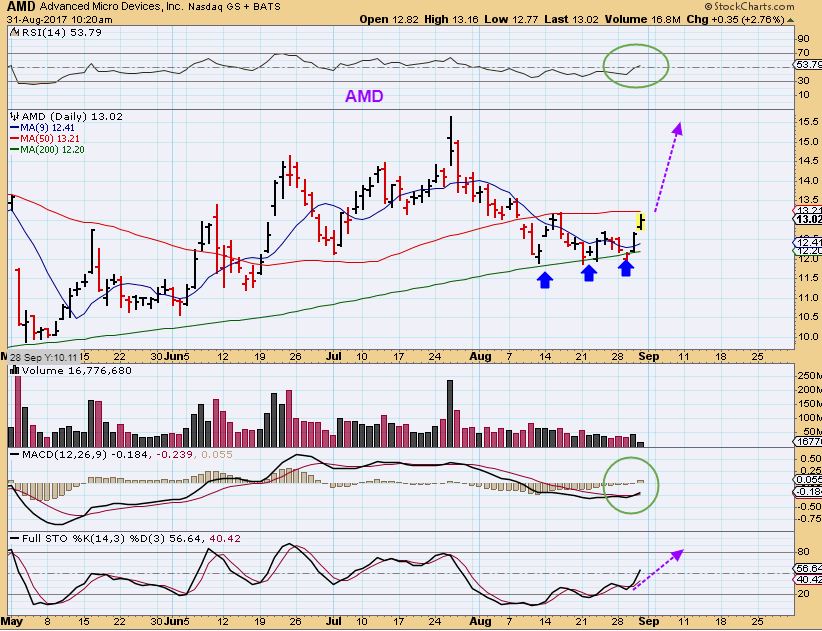
AMD – This held up nicely on the 200sma and looks ready to break out above the 50sma. This buy would place a stop under the 200sma.
GRPN & PXLW from yesterdays report broke higher too, but still look like nice charts for the longer term.
Thursday August 31 
 SEPTEMBER 3 – WEEKEND REPORT
Scroll to top

Thanks Alex. Great report. I especially like buying close to the bottom. GUSH, ALO, DRD, for example and just letting them ride. That to me is somewhat easier then buying high and/or buying breakouts after they occur. One of the problems, I had in Hawaii was having to buy late after the move had already occurred in the morning or getting lucky enough to have a late move. The only other solution would have been to get up at about 2;30 A.M. I wonder how Cason will deal with this.
That said, I almost put GSV in the report. It didnt react to Golds push higher yesterday, but it is still good looking. It is sitting around support at the 50sma, and is not very far off of its lows. See a 6 month chart with a 50sma.
That trading from the west coast or Hawaii does seem very difficult. I would have to anticipate a move & buy early ( I do that now a lot. For example: If I see SILVER pushing on that 200sma day after day, I buy it before the break out. The last chart in the report is AMD, I would just have to buy that bouncing off of the green line 200sma, rather than wait for an all clear above the 200 & 50sma). Not easy when you cant watch it at the open the next day though, that’s for sure.
Thanks CF. What is your exit strategy for NAK? Will you sell If it falls back below the 200?
I dont have an exit strategy – I am in the accumulation mind set since the early summer, expecting it to move to former highs eventually. I would probably stop out under the 50sma, but the 200sma was just re-gained and I know that that might be lost again too.
Great report. Nice to see them moving. KL seems to be mimicking the move by CDE .
Thanks, and Yes, I was looking for a few that seem to be mimicking more of a surprises to the upside type move too. I noticed that CDE in 2016 kept throwing in those strong reversals, but the selling never really had follow through, so I will be looking for that in some stocks going forward and sharing it with the readers if I find that.
RIC is another one acting bossy
Alex for keeping us all confident. Awesome work!! Oooops! There goes $GC :-)).
LOL! Forgot the “thanks”…so excited by the ‘unexpected pop in GC…
That is the hard part with Gold & Miners- we have all seen the surprises to the downside enough ( over & over again, right?) to really hinder our confidence. So far, confidence is building going forward 🙂
Alex or anyone are you seeing a discrepancy between gold and silver. It seems to me that silver is lagging. Did someone post on this the other day?
Silver has been outperforming Gold since July lows.
PM & miners reacted nicely to the employment report – glad I went ahead and added to GDX/J yesterday.
Now where to add again? I generally use ETFs instead of individual miners, but with your wonderful basket of miners in this report, Alex, I may create my own “ETF” – Thanks for the great ideas!
Edit: Gold futures hit your first target of 1333 this morning, Alex
And there is nothing wrong with ETFs, I have just found personally that my gains are better with my on basket of juniors.
The one bad thing is when you only own say 2 or 3 Juniors, and 1 does a public offering and sells down 12% in one day. Something like that can hurt, but often we forget that by the time they do a public offering, they are up 80% off of the lows, so we feel like we had a big loss, but only if we were recent buyers.
I try to keep 5 Miners or so to avoid the hit. I got hit with GPL last year, but it recovered nicely in time & I got back in and made more that enough back.
Thanks for this, Alex!
I have a feel for what time of day to buy GDX/J (from successes AND failures) – do you have time(s) of the day that you look at most when buying these small individual miners?
Not really, they vary, but one thing that I have found is that a gap open at the morning can often close around mid day and then buyers step back in going into the close ( Final 2 hrs or so).
I look at intraday charts to see if I can see signs of a tunrn back higher using 15,30,60 minute charts.
Sometimes the gap open closes, keeps dropping, and we have that 2 or 3 day pullback to deal with, then I just flip back to a daily chart, maybe watch that 10sma & 50sma. It is tricky, and often more work than necessary if we are in a bull run. The dips really do go away eventually if that is the case 🙂
thanks, Alex – the miners you listed in today’s report have close stops, which is nice. AKG bumped into the 50D MA you mentioned. Frankly, since I believe the bull market in miners has resumed, I can just buy the ones you listed. In a couple of months, these dips won’t matter
Alex – any thoughts about the strength of precious metals during September to December. Can often be a tricky period for PMs…
Not really – I have made excellent money in the past riding from August all the way into March ( I am saying this from Memory). I have also experienced trouble in October and last fall was tricky with the elections.
I have touched on this in the past, and I will explain more in the weekend report
Thanks Alex.
Sure – I wrote myself a note to cover it in the wkend report 😉
My post was late yesterday, so just in case someone did not see it, I went to the Canadian listed version of WRN and found much higher volume for 6 of the last 7 days – like double and yesterday was triple. It is being traded in dark pools which is a bit surprising for a low volume low price stock, but my order did not show up on the charts until well after the fact.
thanks Rob. I trade in both Canada and US too so nice catch.
Yes, I actually have quite a few Canadian subscribers, so that is useful, thanks Ron
wow… check it out … this amazes me….exact replica of previous move???? tehee
https://www.tradingview.com/x/H6FDRY8F/
props to you maria, great chart….i like your fresh perspective
Humdinger!
THM dang………………same story as GDXJ ???? ONE CAN DREAM
https://www.tradingview.com/x/bW0mF1su/
Alex, what do you think of UUUU now? I am looking to exit, but don’t want to dump too soon.
Youre gonna make it out alive!! and not just even!
Thanks…I am finally green and getting scared…oh, wait…scared because I am going to have a tooth pulled out shortly! Yikes. So Bay, can you suggest a target area? It is over the 200 finally. Need some volume!
am gonna suggest (& hoping for!) 2.50 – 2.70 before next substantial pullback.
Thanks for chiming in SOG. I’ll go look at my chart.
Let me just add, I don’t want to keep someone in a stock when they want to sell and break even, but the weekly chart suggests a nice run higher, and in line with what SOG said….this could eventually go to the Feb highs if you look at it on a weekly chart.
How it gets there ( Choppy?) is always the problem 🙂
Thanks for the reply CF. I will hang on a bit longer. I am just getting antsy to get some gains locked in somewhere. I am usually really patient, but this has been a challenge. Not like early 2016 when I joined you and enjoyed that ride!
I totally understand, we have been in choppier waters lately ( Seasick), but there is a possibility that with Metals ( Commodities() and Miners, we may be seeing similar moves to that time period of 2016.
too early to tell, and you can always get back in, but the pullbacks are shallow now again ( See TGB, GGB, SID, HBM, ETC) Since July lows.
Is anyone trading CVVUF (Canalaska Uranium)? In my Fidelity account I habitually have difficulty in having it listed and must search for a current price.
I see it at .31 today
Thanks, Ron B. I found it on Yahoo finance.
Well that drop is unpleasant – just wiped that move.. anywho.. UGAZ with the follow thru!
UGAZ & BOIL looking good that way
Day by day, my stock screener for miners has another name that pops up as trading above both the 200 and 50 MA´s, signalling confirmed uptrends. Also, my long term charts flashed a buy in MUX this morning, happy to see it and ready to buy as it was one of my best trades in the 2016 run. Already started small buys this morning as I intend to have a very large position as a percentage of my accounts over the next couple weeks. Even though I am well stocked in other miners, I must say I would not mind a good two day walloping to the downside to let me load up on MUX and a couple others, but that might not happen.
You watch your mouth! ‘A good 2 day walloping’. Shame on you – lol 🙂
Alex has really been in sync with the miners lately, not just callling long or short, but having a good measure of the relative strength or weakness. I´m happy he is seeing parallels to the 2016 bull, I am thinking the same, and it would be great to have another chance at a move like that. When I pull up a long term chart, that run dosen´t look all the special, but it was the second best trading time of my 25 year career, second only to the ´99 dotcom craziness! Let´s hope we see 2016 type action in the miners again.
That run in 2016 was so nice. I was able to ride many up, sell some and enter laggers just starting up…it was like juggling helium balloons for months, unlike juggling bowling balls with spikes in them, as is often the case with Miners. Sweet!!
Me too, ahhhhh, those were the days!!
It looks like my GUSH trade is starting to work. I bought pre-market at 17.04 only to see a big drop. Glad I held now. I almost sold.
Me too. with the volitility of these 3x I buy a smaller position and keep my stops back further. I probably turn it into a 2x, but I hate getting stopped in a market like this
exactly – A stop under the 10sma on Gush was a big drop, but wouldn’t get hit and now it is off and running again.
My view is that Smaller positions can keep you less sensitive to the wiggles, because the smaller position = smaller risk, even though it is in a risky trade 🙂
Keep it small and it’s alright! 🙂
Trying to decide to get back in CDE after the report. The drop on July 27th from 9.0/sh. to 7.8 at earnings does not look like much on the chart but in real time it was a hair-raising experience for me. I guess the question is how long to the markets remember?
I went for it this morning in pre-market and got in at 8.78. I think it will base along sideways and then go up, but I could be wrong.
Thanks, H50. That disclaimer goes without saying. We all roll the dice.
DXY completed wave 2, now setting up for nice wave 3 up. https://www.tradingview.com/chart/DXY/awVHNxZg-A-bullish-break-in-a-bearish-trend/
Glad i got out of natgas before the report. Looking now at the 3.1 zone for resistance. I dont think the downward cycle has completed just yet. 2-3 interesting weeks ahead.
Added to WRN- great volume coming in now
I put on a starter position after your note – the 200d MA is a close stop, and all the other averages curling up and hugging below the 200d looks good – Thanks
Maybe my eyes are old (well, not maybe) – I looked back a couple of reports but didn’t see a WRN chart. Do you mind posting one that I can print?
CF – How my RIG looking now? Im pretty stoked on this one
Looks very good, I’d hold it
How do u do this!! LOL… Im here from 7.50 and it was supposed to be a day or two.. I took half off and now I wish i didnt lol…
IPI back below bo. no beuno. next stop 50ma?? holding tight for the long term.
Maybe 50, hopefully only the 10 sma, that has also been supportive on past moves. I’m holding too.
CF – Any new thoughts on TGB?
It is getting extended on the daily , but I’m still riding it. $2.20 is the initial target on a weekly chart, but it could go higher.
by the way MundoX- I have contemplated taking 1/2 off and adding that to WRN now that that is moving.
Having a hard time buying WRN up 14% on the day.
Yeah, I think that it was only up around 8% when I wrote that
If it happens to dip back under 1.30 I might have to take a stab at a starter position.
Thanks for the input 🙂
WRN now up 9%, volume coming in, and I think that this run is just starting 🙂
HIMX… hmm nice
anyone talking GGB and SID? Sheesh with the moves!
And Maria, HIMX in 10.16 out 10.42 market.. Annnnnnd Got rocked on a TVIX scalp.. so right around breakeven* on the day 🙁
u the man…….;)
been watching SID since it made the run at the 200 DMA on 8-29, pulled back and now looks like it has the strength to push through and move higher. looks like it could do 2x the volume of 8-29….mas fuerte
Yep – I posted both SID & GGB in the reports this week. Nice follow through in both . SID hitting the 200sma, still looks good https://uploads.disquscdn.com/images/d29e9349c8e01d2423bf295ea4551240193c9e666b8bc32c10cf8d045d55e646.jpg
https://uploads.disquscdn.com/images/eea72467544adc7b846541f2b1e1f49893775d0adbdf7a13e5bf7c85e5da4cc2.jpg https://uploads.disquscdn.com/images/5095ddcda94216932748b6cdf07fc1a1281bb293332696e80129ed5164112a26.jpg
I know u posted em, but seems quite in here today about them.. Both making 6% plus moves!
Probably just because there is SO MUCH to look at. : ) I own more stocks than I usually like to ( Over 10 I usually cut some). My biggest problem today is which should I cut, they all look excellent. IPI is red, but I still like the chart. I didnt mention SID or GGB, because WRN is the one that looks very bullish so far.
Not sure if you got this but do u have PTs on GGB and SID?
I didnt answer that email? let me check, but I think I said former highs
EDIT: Yes, I sent an email reply that I think they can run to former highs of February, that forms a big CUP, and they could make a handle from that point.
yeah.. he never answers mine either ……………………… ;o)
HA HA
oh my RIC…? i know i posted this before but still …. wowza.. lets do a repeat
https://www.tradingview.com/x/2WZHXomK/
Shot u a quik email boss
At lunch, but will check soon
HEES….nice
Lunch? I’ve haven’t gotten to breakfast yet today!
I answered your email, but then I had 1 more thought, so look at both emails, not just the first one.
Yeah, I’m in THE. Also been holding CLF since May/June lows.
I cannot emphasize enough what WRN is doing today and with very strong volume. $1.70 initial price target over time ( See the weekly chart) , but breaking that could lead to greater gains
This was RONs comment yesterday, I think that he may be correct 🙂
CLICK TO ENLARGE & READ
https://uploads.disquscdn.com/images/4c2c9e570fb2bbf48a2da4cbb6aa15b15004150b2e5843499ace14a37a561288.jpg
Sold my LABU yesterday. Early I am sure. Watching this. Just doubt it will burst higher on the first try given how overbought it is. Anyone else see it differently or holding this one? https://uploads.disquscdn.com/images/a29a296633f58dae2f83e0ab4ac1de5516b0d153f380f104a8f3fce68443dd02.png
I see a possible $85 -$90, but at least your gains are locked in.
Thanks Alex. Been burned a few times, so I guess I pulled the trigger a bit early and locked in some nice gains. May add right back if we see a pause that refreshes.
3X etfs don’t always let you keep your gains, nothing wrong with locking them in 🙂
which is why Ill hold a individual but its hard for me to swing ETFs lol
I parted company with GUSH – a 3 day weekend would just give me too much time to fret and the profit does not hurt
Would have done the same, but no position currently.
In support of Alex´s idea the bull might not give latecomers a clear, easy entry, I just went back and looked at how often stochastics got oversold in the 2016 bull, both on the daily and weekly charts.
I was surprised to see that not only did the weekly charts never get oversold stochastics (set on only 5, not the usual 14, so should get oversold more often), even the daily charts on had two occurrences int he 6 months or so. Actually, one was clearly oversold the other only came close.
This was an extraordinary market move so not likely to play out the exact same way, but I point it out since we are seeing many other similarities at the moment, like individual stocks taking their ¨turn¨.
The takeaway is I am not going to wait for deep pullbacks, at this stage I prefer to pay up and will have to risk that miners pull back sharply, knowing that it is pretty clear now the trend is up so will see higher prices if I can hold on.
I´m already at 65% invested and with respectable unrealized gains, so don´t feel too bad doing some buying today on my way to 100%, even as I feel we are due for a break. Surprises come to the upside. I also like that some other newsletter guys we all know have already jumped back on the sidelines or reduced exposure. They also did this WAY too early in 2016, thus missed most of the move with any good size positions that would make a difference.
I missed 2016. That won’t happen again!!
Days like today I feel like I should sell, because I’m sitting here admiring my account gains. But when I check each chart, they don’t look overbought, and in fact look like they are just starting.
EXACTLY… “when to sell” or is it OK to ride the ups and downs and hope for a trending move?
Many that were red earlier went green again ( Even NAK, and that was down almost 10 cents at one point).
When in doubt, I sell something, but not everything 🙂 Today I’m pretty much just riding everything.
Same place, IT. We hear you. I’ve done that before – smiled at gains and then wondered what the heck happened the next week. But this time it’s different?!
Some of the recent strong miners are taking a breather – IMG.TO, PAAS, RGLD, SA, IPI – it leads me to believe it is the hot-to-trot money that is taking a turn at the PM’s that are moving today, and in a day or two it will move on to something else. The constant rotation.
IPI is being a little trooper so far too, it wanted to sell off, but seems to be regaining that break above the down trend line.
NQ
I missed this post. We used to trade that with S. Quite the pop and a nice base. looks good
yes… i remember 😉
I know you do, we traded in & out of CHEETAH too, and that thing ran like a cheetah them (CMCM). $15 to $30 back in the day 🙂
don’t wanna p*ss on anyone’s parades .. but we are not out the woods just yet i fear.
we are at a crucial point.. almost identical in AXU to 2011’s moving average topping pattern.
current WRN pattern very similar, but no data going back far enough to compare.
if this point can be cleared without repeating the drop, i would suggest the bull is on.
9day charts in AXU & WRN….
https://uploads.disquscdn.com/images/b81003c13f2f7db15fa39317f079ea7ab6e42dbc79d177d4c54851b724e540fe.jpg
https://uploads.disquscdn.com/images/0dfe1aacb6f2f4f166f1d36484cf1eb0127397ba4df53e8a2c303fa48b43cf67.jpg
Just to be clear, I am replying to SOG, who is talking about WRN- not Nord, who is talking about Gold
Well, I dont want to rain on your parade either….it could be a valid view, but a very different view. A lagging view in my opinion.
Monthly chart , weekly chart, you cannot use them for early entry and catching gains out of low risk areas, right? By the time a Monthly or weekly triggers a buy, I have 20- 40% gains. 🙂
‘9 day charts’ are like a 2 week chart, somewhere between a weekly and a monthly.
In my early entry charts for WRN, a buy at the 50sma, I already have 20% gains.
The multi-day charts are just giving something of a bird’s-eye view of where we are.
Am not really bothered that its a 9day or an Xday as such… but that i can see large scale repeating patterns to provide info on where the snag points/lines-in-the-sand might be.
Not suggesting anyone trade on them, since they are such laggers.
I’m 50% in miners myself, and in WRN since 1.10, but i am still interested in the fact that 1.35 is something of an *interesting* point for whatever reason… and that at such points, as in 2011, reversals have occurred
Makes sense. Thanks for the explanation.
It is good to know, is it not, that if WRN breaks upside to 1.36+, that a sea-change has occurred.
Personally, having seen that big period chart, i would be more likely to go all in if i knew that the 2011 ‘downer pattern’ is invalidated
Was the downer pattern negated in TGB?
its funny you should ask that.. im jst looking at it right this minute 🙂
i’ll post in a few mins… but its acting as it did in 2009-2010
Thats because I’m still in it 🙂
https://uploads.disquscdn.com/images/edd79bf79164d96cb045feaf81c27960b94a77a2622e67a2fde5378caee0914e.jpg
Yes, IAG has been on my very bullish action list since last Decembers move & mild pullback in the summer, and still breaking higher & higher.
Pullbacks will come, but the 3 month daily charts of IAG & TGB are beautiful. 🙂
I wonder about IAG too, since that was acting differently.
It too is following the 2009-2010 route
https://uploads.disquscdn.com/images/3b73a235b016b606d59416a2b888fc093384489aee85aacc97e30a2403449220.jpg
Sure, you may understand that, but you threw it up as a cautionary note, and some followed me into the trade.
It is my responsibility to help them to see what you and I may already know. A 9 day chart is lagging even a weekly chart ( Attached) which is very bullish right now 🙂
This looks very bullish to me,
https://uploads.disquscdn.com/images/89dfeadae130ba9fc7368985ad2b43c71d532a87d89fd538d505c883e901520e.jpg
RSI levels above current normally happens 1xyear in bullmarkets. My main view is that its gonna happen, but in December. For now my main view is retrace. But lets see what happens. https://uploads.disquscdn.com/images/ffe9ef9e529da1b91ab63a154dc7427d722e898c5af53b2cd61bb6da20805262.png
I haven’t made an trade in a couple months. But I bought WRN today. So I’m hoping you’re wrong on the rain forecast:) *bort*
I was looking to sell a position or two, and had trouble fining a set up that I didnt still want to hold on to.
ENPH or GMO came up- but now ENPH is suddenly moving higher and I want to stay in that one too (Solar).
GMO has light volume, but it looks like a mini cup & handle and we saw what SIDS mini cup & handle did…so I have not sold anything today .
Alex, do you have an opinion on AG?
It was mighty good last year, just wondering if it’s too early to dip a toe back in
I’ve been watching AG & EXK and I do think that they are going to recover.
AG is at resistance now, but with all things turning bullish, I think the lows are in & it wants to break out & move higher too. It currently might battle that 50sma first.
Thanks
I was trying to think like Alex – not knowing if the 10d ma crossing above the 20d, and them both curling up was going to win you over, OR if you would wait on the 50d
I’m learning!
Also, 127 slow & steady comments so far on a Friday – not a blast all at once. Looks similar to your slow-motion breakout!
Sometimes I front run a position if the sector itself is acing bullishly- so you were thinking like me.
I am not opposed to taking a position if a Miner is near the lows, and the sector is on fire- but I often wait for a sign of strength or life. AG has been perking up a bit 🙂 I dont own it, yet, but thats because I own more positions that I like to.
Hoping for a late afternoon (well, morning here!!) quick pop in GDX and friends before close. If so will close a few more options, for no other reason than risk reduction/profit taking. Bid in for next week BTG if it retests that 8SMA on the climb.
G-Morning Cason- And then you get the rest of an entire beautiful day in Hawaii to enjoy!
Morning! I have the day off from my job but make no mistake I’m working today. Our house is still a HOT mess full of junk and half-full boxes.
BUT, tomorrow we’re headed to North Shore, probably gonna do some snorkeling. Taking the family kayaking as well on Sunday. Plus the obligatory cookouts and beer!
Happy weekend all!
Helenas is a must in the city Cas!
I’ll check it out, thanks!
Dry Hung Ribs!!
I sold at the close. Not that options are for everyone, and I only had a few calls. But I did sell 8 Sep Weeklies at +300%. I think I’m going to go a bit larger next time CF calls a DCL!!
CF, any thoughts on CF?
yeah… ………. he’s a man of many words…..
*smirk
haha..I meant the stock,CF
ahhh … *snap
myBad
https://uploads.disquscdn.com/images/550f83a48ca53433693999b7ce503da61c74b53ac2c5ef1fbbc9465e4f383ec3.gif
Maria, your posts are so cute. Always bring a smile.
🙂
Define ‘cute’…lol
Looks good, reversed on that 50sma, oversold, breaking a down trend line. It would be an easy entry to place a stop under that shouldn’t be violated. I love the ticker 🙂
Thoughts on Adding CHK for a swing
Yes, throw an 8 sma on it and look at the MACD. It is a swing buy in my opinion
ya seen TRXC today?.. dunno whether to bail out at your suggested gap close target… or outstay my welcome., seeing as it did break out of a 2 year indi d/t
Holy smokes! Well done SOG!!!!
scared the sh!t out me yesterday 🙂
well not only that, youve caught the eye of the day traders come monday with that surge end of day. My buddies are talking about it now. well done. I still like that gap lol
SOGs famous!!
lol..
hows it going Cas?..
Johnny said you’d been in touch with him… hope he’s still ok
He’s was in better spirits than I would have been, that’s for sure!! House was ok but one of the vehicles was, well, gone.
My account had been a bit underwater but I made a solid recovery last two weeks. So, I am praying the same for all of our friends in SE Texas that the water recedes and the recovery begins quickly!
neat segue..
from Texas….to your account being underwater 🙂
The sun is starting to shine again…
gap still +8% away.. worth a jump in if one is a quick trader like yourself,, unfortunately im not.. im the supertanker of trading
With today’s new high the 50 % retrace will fall quite exact on my long-belowed target. I can count 5 up as possible complete.
https://uploads.disquscdn.com/images/59e7ae070862262e873698dd81b396a24d0cd9e579605b8d10fcff422f0f907d.png
are you all out of all gold positions until bounce?
Indeed. I like to sell into strength and buy into weakness. RSI blinking red, sentiment extreme and my grandma called the other day to buy gold 🙂
I noticed a ton of adverts on TV.. buy G&S!!!
Gonna protect Grandma from a North Korean attack!
If its gonna be DCL now, i think its gonna be quick and painful to release the RSI on daily, we are not overbought on weekly.
LMFAO Gotcha brotha
That being said, I am a goldbull for 2017 as stated several times with a Dec 2nd target of 1592.
https://www.tradingview.com/chart/XAUUSD/eM0WhELL-The-golden-bull-2017/
Glad to see SWN catching a bid again.
Huge numbers for SPX on Wsj. https://uploads.disquscdn.com/images/c2decd203957573d4830033d5638a249f62030901b57028347391b8c7479ac01.png
Funny that the QQQ show buying on weakness,
Indeed 🙂 Maybe option expiration can have some influence?
Could be. I’ve been meaning to take data on money flow for a long time, but haven’t yet. The questions, among other might be, how often it’s meaningful. Does it take affect the following day, two days later, three, etc.and how much of an impact does it have.
THE WEEKEND REPORT HAS BEEN RELEASED