
September 28 – Still A Mixed bag
Last week I pointed out the differences that I was seeing in the General Markets. For example the SPX, NASDAQ, RUT & IBX , XBI ( LABU) were all acting a bit differently. Let’s revisit a few of those charts …
.
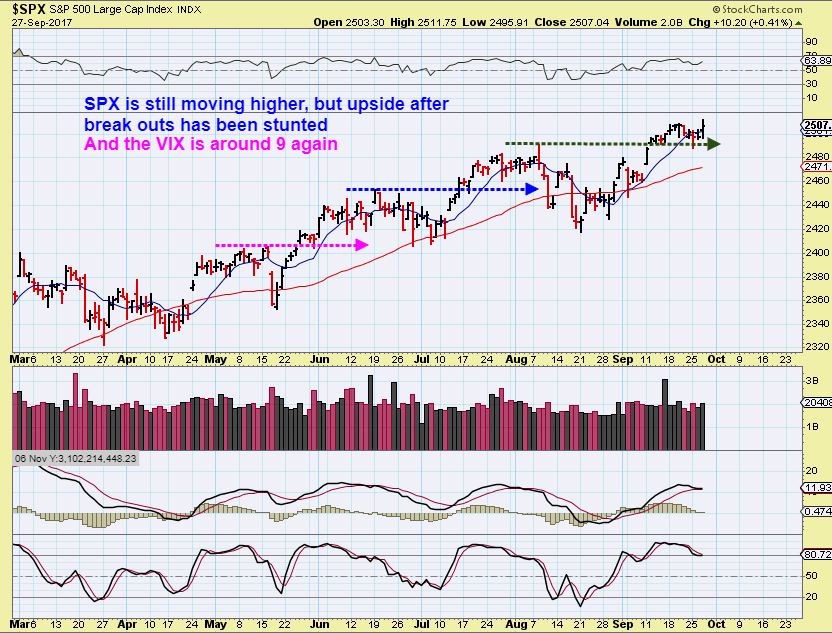
SPX – The SPX looks ready to break out higher, but I had mentioned that I felt that the upside is limited, since each prior break out has simply moved up, gone sideways, and then dipped back to the 50sma. I’d still be ready to lock in profits in the near future.
Now let’s look at the NASDAQ…
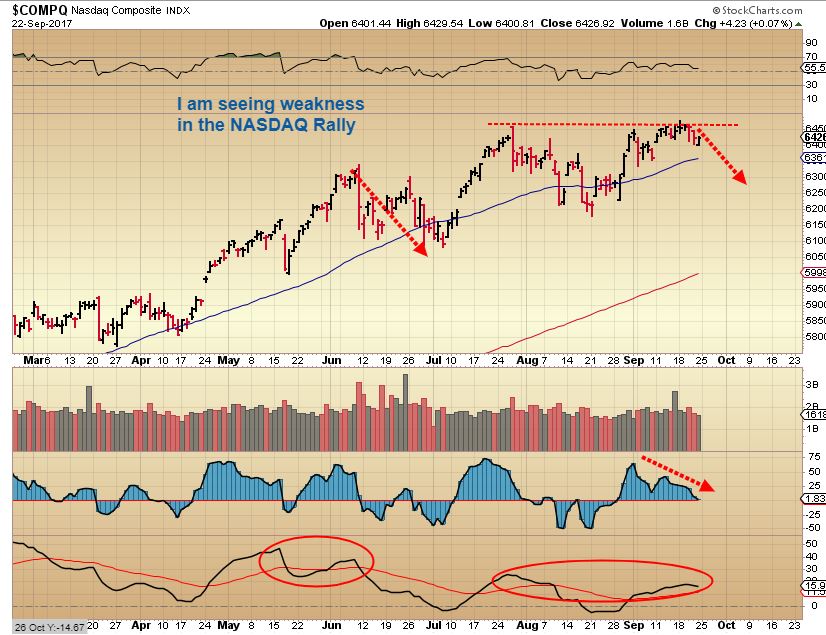
NASDAQ – Sept 22 I was seeing weakness in the NASDAQ chart internally, so I expected a drop, and not a break out.
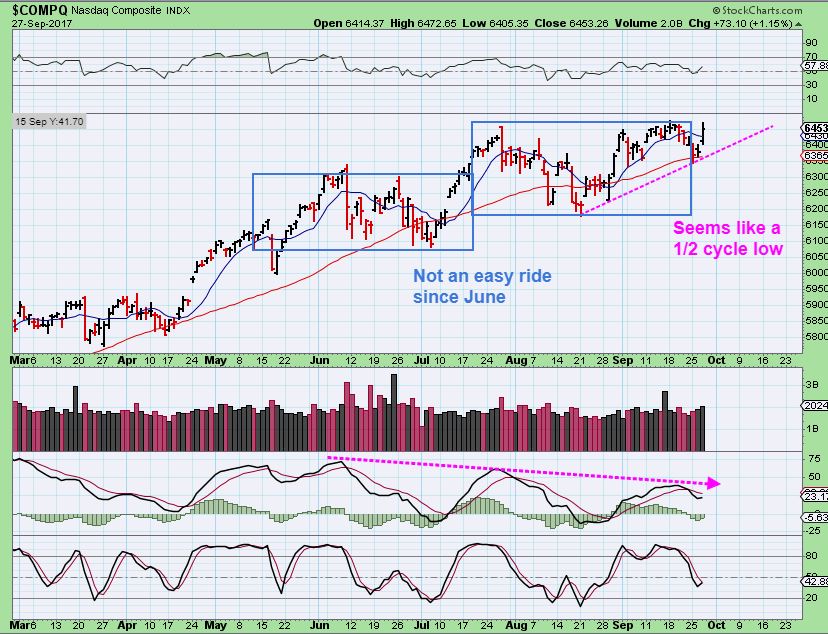
NASDAQ– You can see that we got that drop to the magenta line and now we have a pop. That may be a 1/2 cycle low, but I would still use a trailing stop under that 50sma, because the upside here has been very problematic on each pop to new highs. Take a look at the chart…
Look at the promising POP on July 18, for example, at the end of the first blue box. For 6 days it slowly drifted higher and in 1 swift crash, gains were wiped out. I mention this because 1. The NASDAQ has been quite volatile, and 2. the VIX is under 10 again. We may just see a pop, drift, and drop again. It is all time highs again, so that is very respectable.
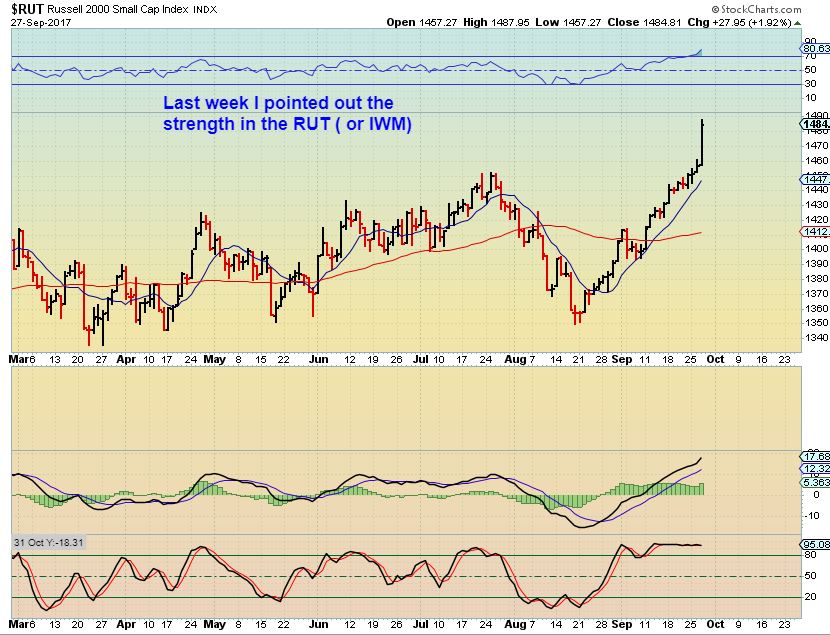
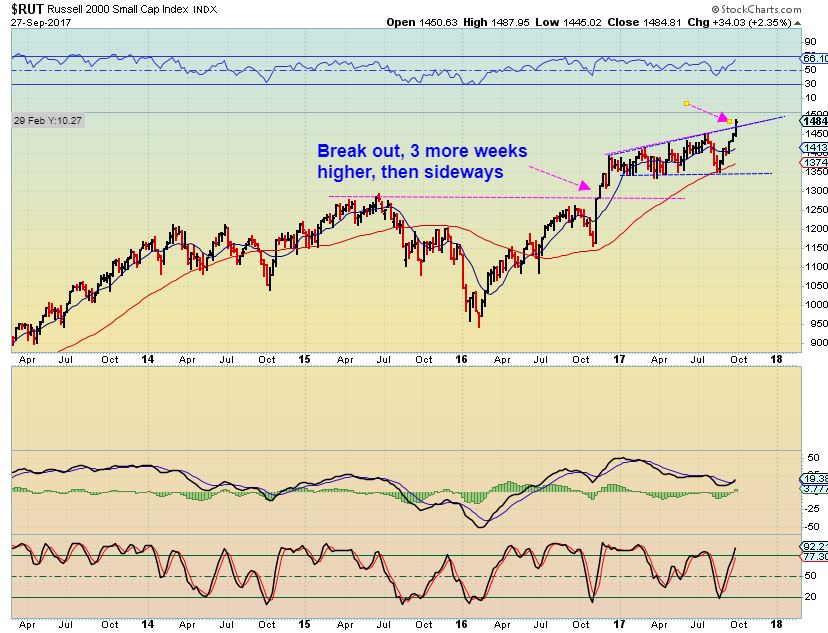
RUT – On Sept 22 I was showing that the Russell 2000 was bullish and had put in a sharp V-Bottom, even though I was seeing weakness in the Nasdaq. Strength was in the small caps after a sharp sell off.

RUT – What a strong move higher on Wednesday. This is now hard to buy ( IWM), but certain individual small cap stocks may be buy-able. A pop like that after a run like that can top the run and back test soon.
RUT WKLY – That slam down v-bottom was part of a Megaphone pattern on the big picture
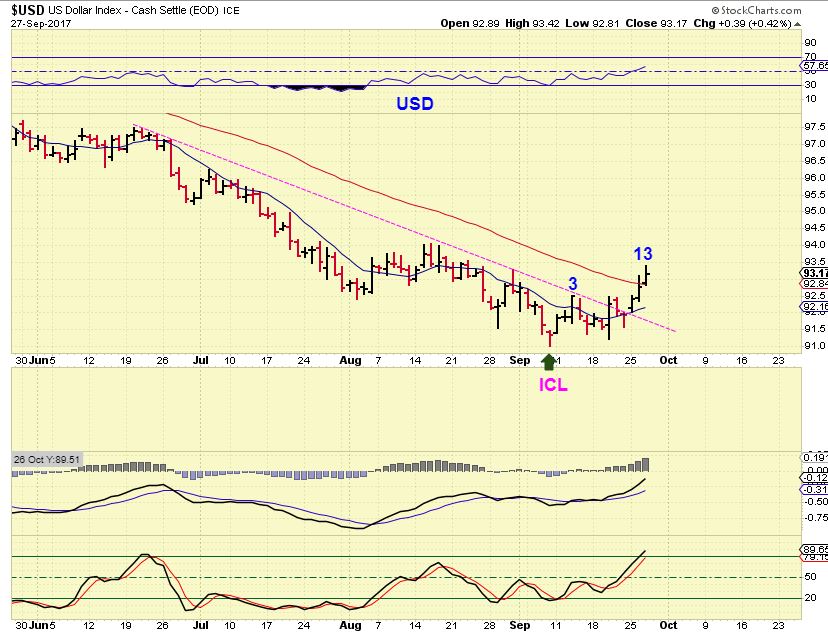
USD ICL – Day 13 closes above the 50sma and leans this daily toward being R.T. ( Bullish, and an ICL in place). THIS is concerning to the Precious Metals rally, but so far, some Miners are still resisting selling. When the Dollar dips into a dcl, Gold should bounce or rally. That will be a sell the bounce now, in my opinion.
WTIC – On day 18 we can still see Oil move higher, but as it gets later, you want to protect profits if you have been riding this ( Or UWT, UCO, USO). I would sell some & let the rest ride, or use a tighter stop. $54 is a possible target for this run.

NATGAS – The inventory report is released today. This has been a whole lot of sideways up & down action, very difficult to trade until it chooses its direction (Which should be higher ).

PRECIOUS METALS
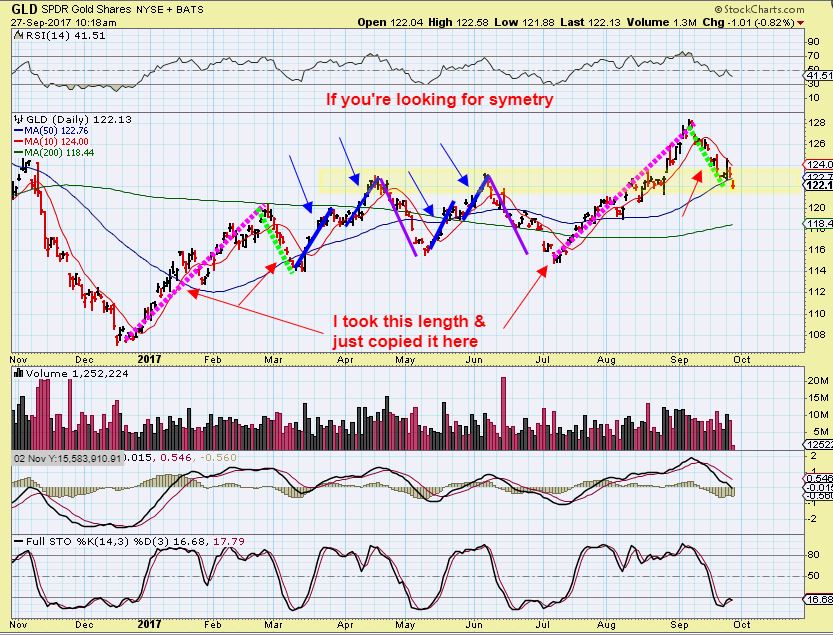
GLD – Symmetrically, the Dec to Feb run is the same as the July – Sept run. The following pullback ( green line) is about the same too. The following bounce or daily cycle could happen as the USD dips into a dcl soon.
GOLD – Gold didn’t close above the 10sma, so the swing was not a confirmed swing low, and therefore the daily cycle count continues. I said this before, at this point it does not matter if you believe that this is day 35 or day 54 or you have another count over 30 days, either one signals that we are well overdue for a dcl.

GOLD symmetry pattern – When I look at Gold this way, it looks like we get a 2nd leg down after tagging the 10sma. I’m hoping that this is a shake out below the 50sma yesterday and recovers quickly instead. Also, many Miners are still holding up well. That is encouraging, but as mentioned before, LEVERAGE this late in an intermediate cycle is difficult and is a personal choice. I did buy some hoping for a dcl expecting a good bounce, but a 2 legged drop like these would have me out. Time will tell.

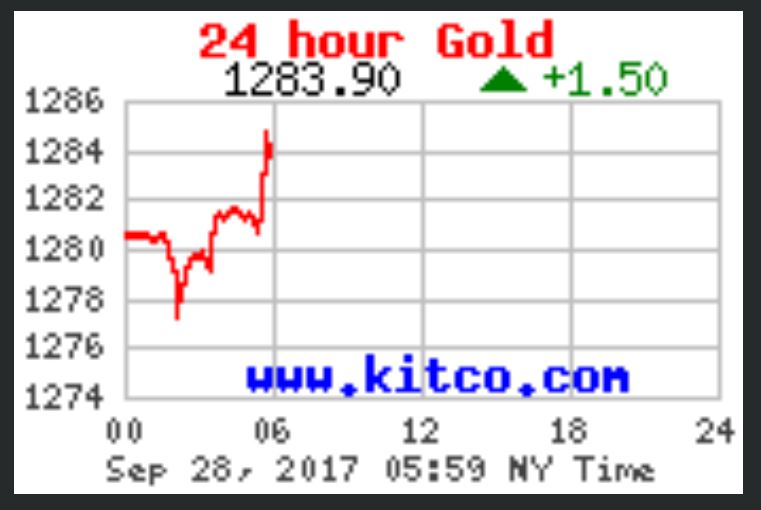
GOLD – This chart tells us a few things. If this drops to the red line in a back test, it looks like 1275 area on this chart.

EDIT: Looks like Gold hit near 1277 overnight, and reversed, lets hope that we continue higher from here and the USD starts to dip down into a dcl.
GOLD – Note: A break of the weekly trend line & 10ma weekly usually indicates that it is time to begin dropping into an ICL, rather than run to new highs at this time. There can be a good bounce when a daily cycle bounces it higher, but the peak of this intermediate cycle may be in place, with this trend line break.

GOLD – Let me explain why I have a problem calling this 1 solid 54 day 1st daily cycle out of an ICL.
1. That would give us 1 very long, very Right Translated first daily cycle out of an ICL / YCL –
2. And then it is immediately ready to drop into another ICL? So we’d only have a 1st very strong Daily Cycle run, one that ran 54 days, R.T. & Now drop to an ICL? That is just hard to believe. If we had 2 daily cycles, and this was the 3rd, I can see it rolling over and seeking out an Icl.

Conclusion: I have already said numerous times this summer that when triangles form, Cycle counts seem to get messed up. This seems to be due to the formation of a triangle, and the movement necessary to shape it, so I am not Using CYCLES exclusively here. I mentioned a long time ago that if a trinagle was forming, cycle counts would vary among cycle guys, and that is what we see now. The count does not matter to me, it is used for timing the intermediate cycle length more than the daily cycles at this point. Now for Miners…
.
GDX – The Aug 8th low did not break a ‘timing band’, so others didnt count it as a dcl. I called it a dcl back in August anyway when it broke the 10 & 50sma and recovered ( See the chart now) . This dip is visible on Silver, GDX, and GDXJ. Gold had more of a mild dip on August 8th. We would be looking for the start of the 3rd daily cycle, which COULD roll over into an ICL as the USD bottomed. This is all short term stuff, and I will explain in the weekend report. Here we didn’t close above the 10sma yet, so we are still looking for a confirmed DCL and what I would call the 3rd daily cycle.

GDXJ – This also broke down below the 50sma and recovered on Aug 8th and ran higher. It may now be at a support (again). I bought leverage for an average price of just under $19 JNUG. I am still in it for now, expecting a dcl and a bounce. You can see on this chart that I bought in this area, but leverage exaggerates the move, and I have to allow deeper losses at times ( Stops). I am OK with that as this plays out. Leverage is a personal choice, I have not ‘recommended’ it, I usually recommend caution at this point.

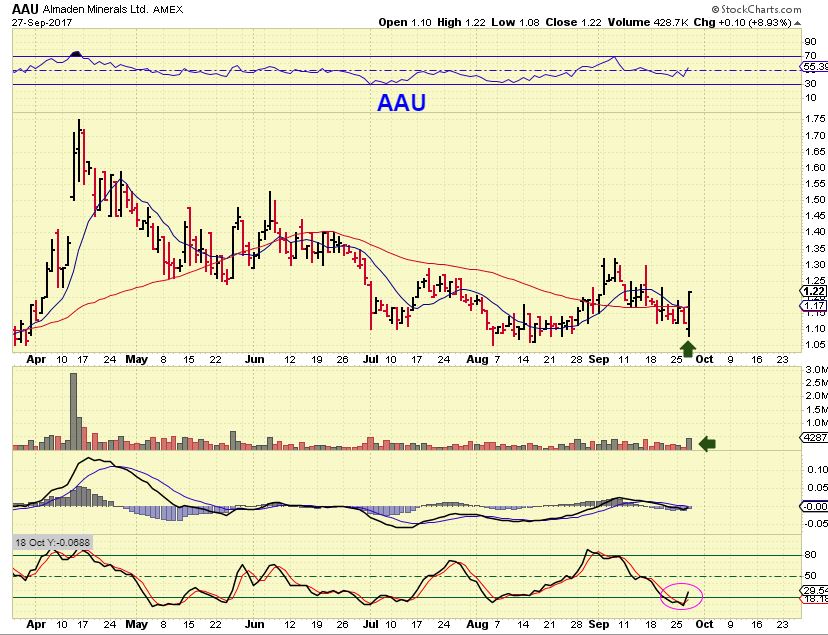
AAU – This was a strong bullish engulfing for a day when Gold was down $10 2 days in a row. As I mentioned, some miners are holding up nicely, so I am still expecting the dcl soon. DRD Still didn’t fill that gap.
Summary : Those are the various market sectors. Stocks, especially small caps and those in the semi conductor sector, look bullish. See TSEM, MU for example, CY looks like a buy, and FNSR also looks to be setting up. These may only be short term trades of a week or two, since the General Markets could peak & begin their dip into a dcl in the coming weeks. I just don’t like the VIX under 10 when I am long. Oil remains Bullish, NATGAS looks good, watch the inventory reports today. Finally, The USD has that ICL that we were expecting confirmed now, and that means that for the next month or two , it could move higher (or higher & sideways). This can stifle Golds progress, UNLESS a Geopolitical event ( N. Korea Tensions?) pushes it higher. Time will tell on that one. In the meantime, the USD daily cycle tend to run shorter than other ones, so I would expect that it might peak soon & begin to drop into a dcl, and Gold should put in a dcl as the USD begins to peak.
I am pointing out several trade ideas after signing off below, enjoy your Thursday trading.
~ALEX
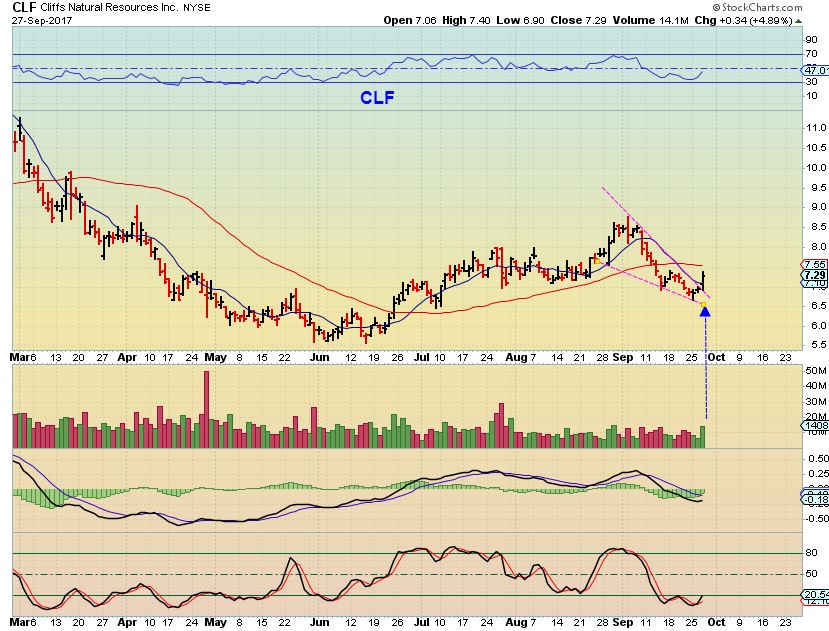
CLF – This break out is a buy in my opinion, with a stop under recent lows.
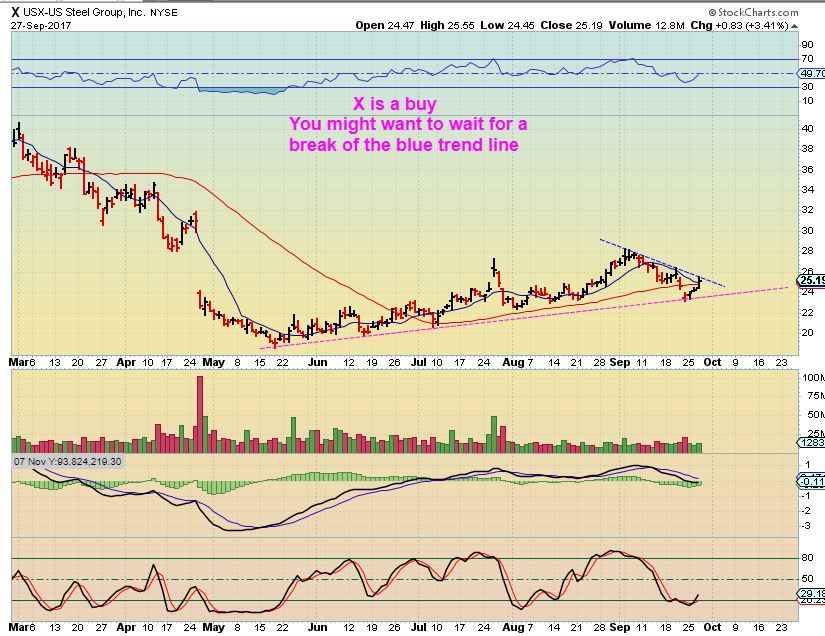
X – Steel & Commodities setting up bullishly again? It looks that way.
SID – Read the chart

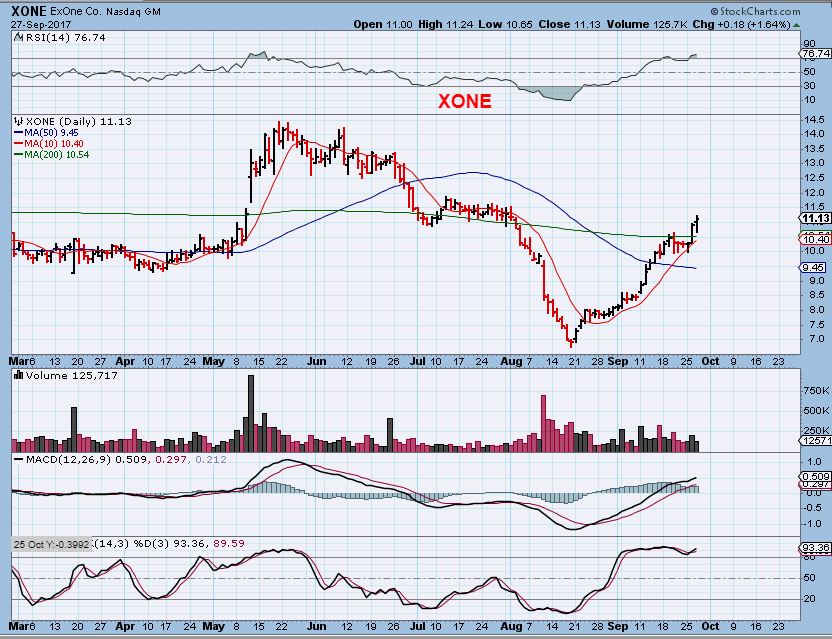
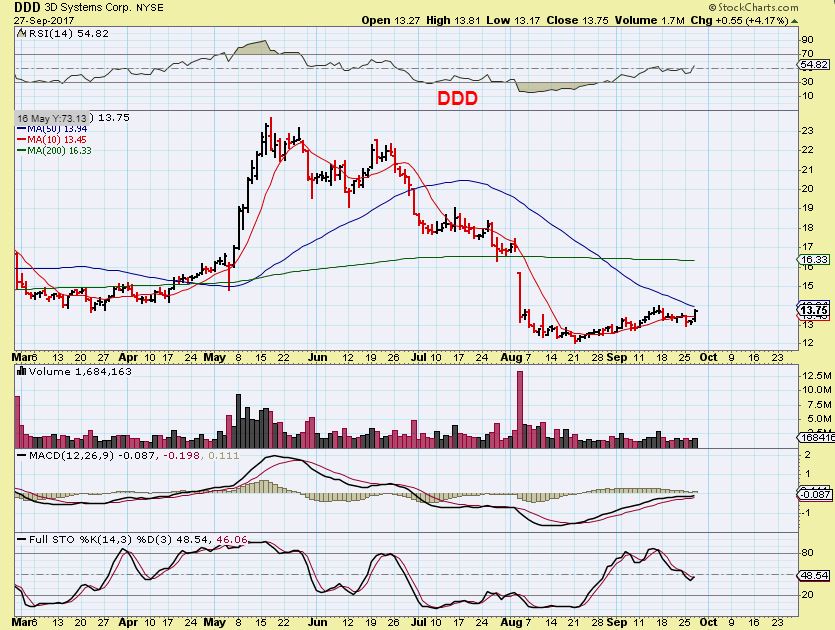
The 3-D printer group is active again
An example of how they can run, See this run of XONE ( and see VJET too)
DDD – Basing out under the 50sma, and trying to break higher, this could run to the 200sma.
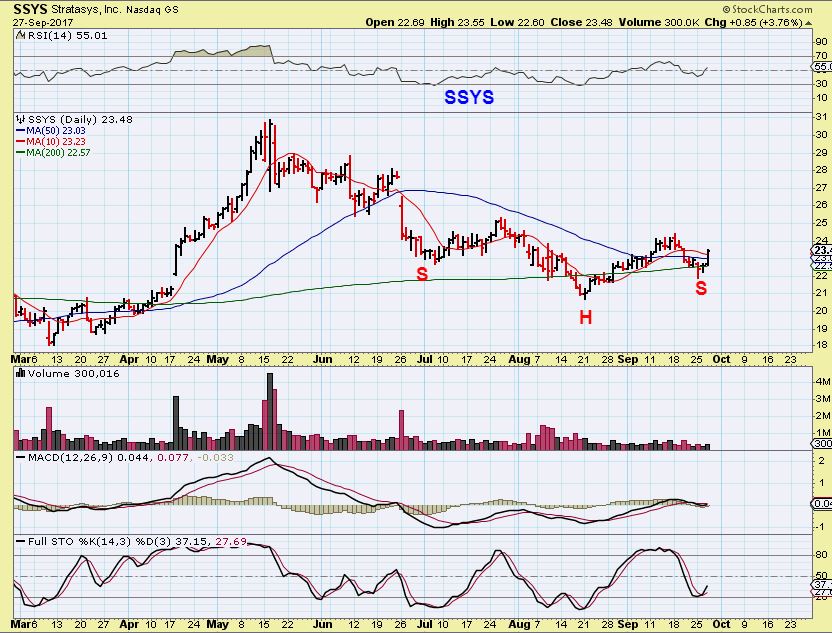
SSYS – This looks like a quick shake out of the 200sma, but now formed an inverse H&S supported on that 200sma.
CAMT ( tech stock like semi conductor)- This was in my Energy watch list, but it is also a bit more like semiconductor. It had no shake out at the 200sma, and then crawled along under the 50sma, then Popped through it Wednesday. This looks ready to go, I almost bought it yesterday, I may buy it today.

HOS – OR I may re-buy this one instead. I owned it on the last run, and it ran strongly out of this base. Please take a minute to look at charts of WTI, WG, REXX, CDXS and so many more. we are seeing surprises to the upside in Oil / Energy stocks after the beat down.

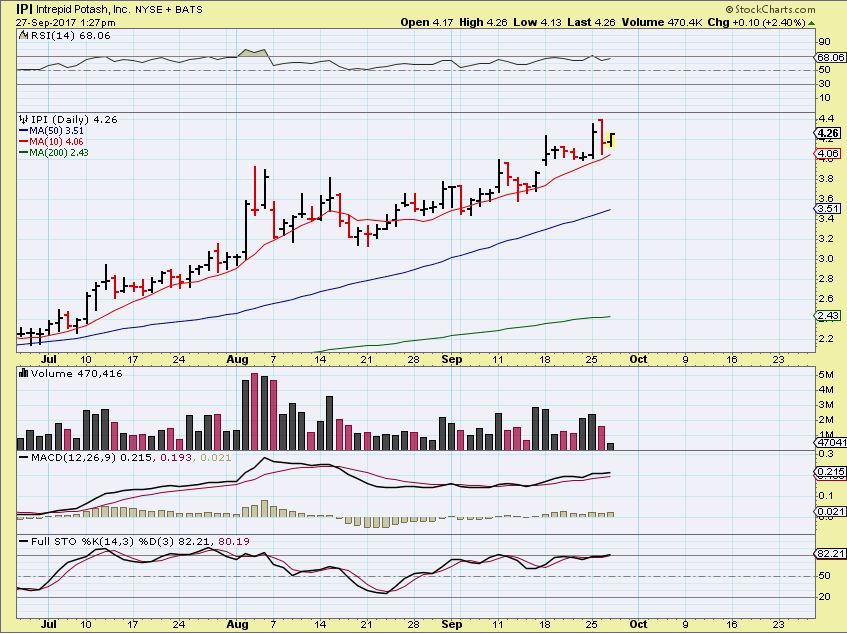
IPI – Just a nice slow steady ride higher. Notice September 11, it dropped form $4 to $3.60, but the trend is your friend. Bull runs are not easy to ride if you watch them day after day and worry on normal dips. Use reasonable stops, and you can ride these higher over time.
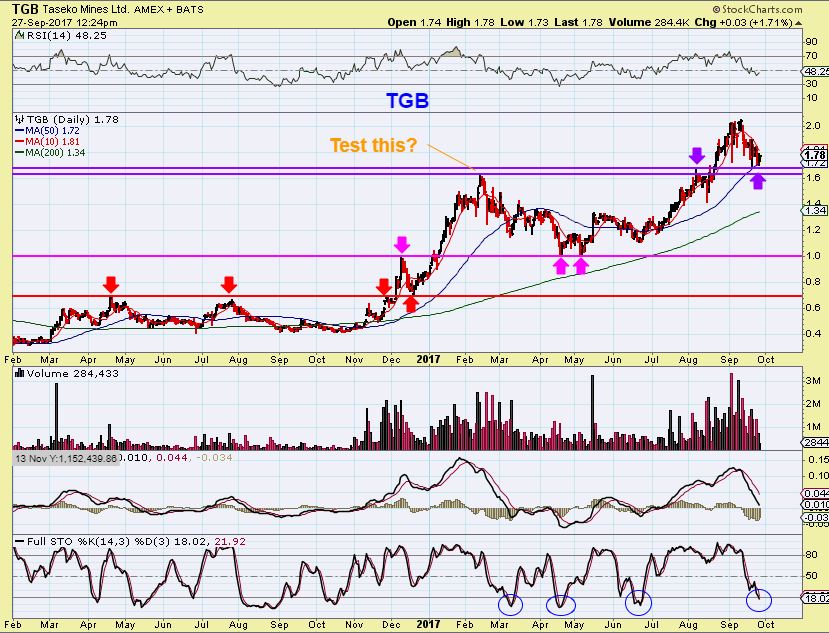
TGB – This is in a support area, but a bit more of a drop would get us on a back test of the Feb highs. I sold mine in the $1.90s, and was hoping to re-enter. This was a really nice run from July onward. It has become a break out & back test. If Copper runs, this may not pull back further, it tagged the 50sma yesterday.
REVIEW OF ANOTHER BULL RUN AND HOW DIFFICULT THEY CAN BE TO HOLD
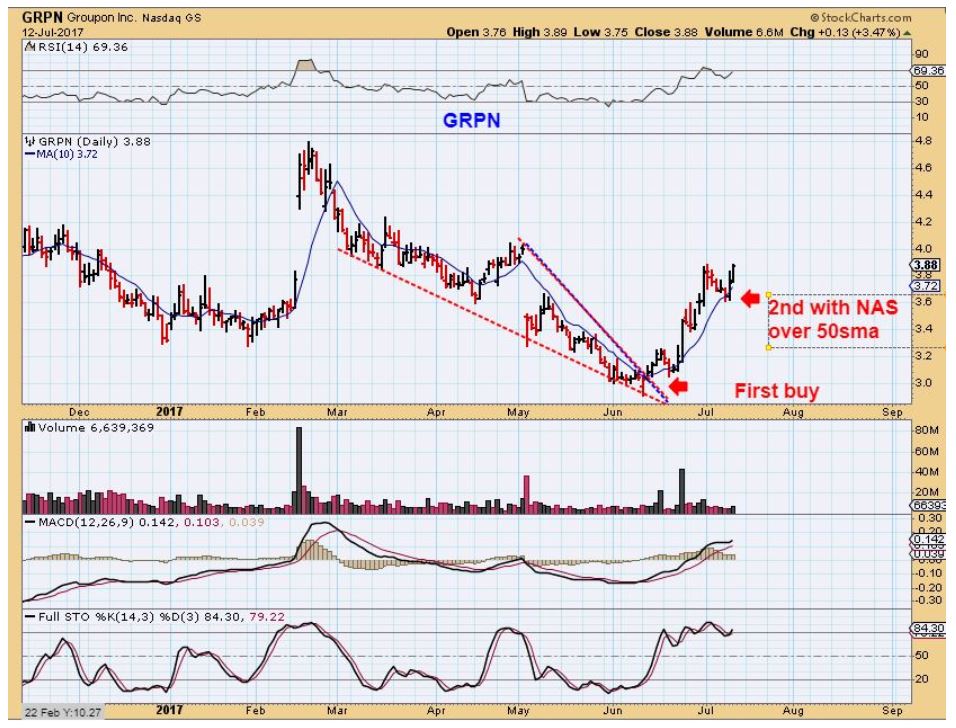
GRPN- I posted these set ups this summer, but I did not take this trade. I’m reviewing it because, it is good to go back and see how a bullish trade played out, if it continued higher. Why? You may catch another bullish trade ( like out IPI, TGB, HBM, etc) and if you are in one, this can help you to see that the ride is not always easy, but can be rewarding.
GRPN from July 12 – This was coming out of the lows and offered a 2nd entry. This looks so easy to ride, but honestly, if IPI or TGB drops from $3.90 to $3.50 – people get anxious and may even sell. GRPN dropped from $3.90 to $3.50 in July, but reversed at the 10sma.
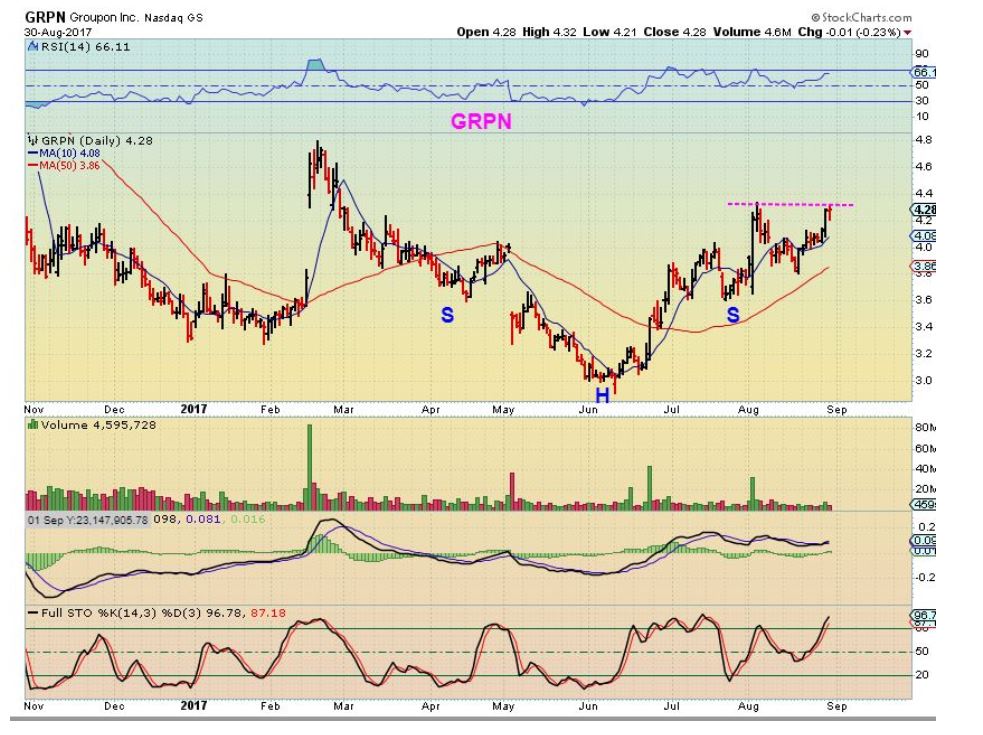
GRPN – It repeated that same drop and that formed a shoulder for an inverse H&S. I drew that out here. The target is former highs near $4.80- $5.00.
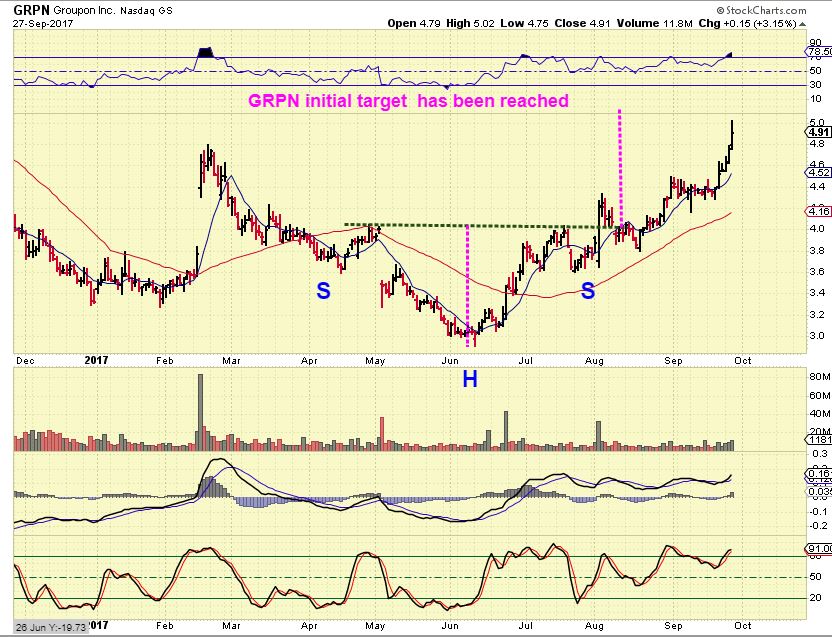
GRPN has now reached the inverse H&S target. Was that an easy ride? Not at all, but that is a great % – gain from the lows, and the selling never violated the bullishness.


Thanks for the comprehensive explanation of your thinking on gold and the miners!
Ur welcome H50
It feels like the USD is going to have a little time in the spotlight with an ICL , and that could stall progress of the Gold & Silver, though some precious metals stocks may still hold up better than others.
I’ll have to cover it in greater detail in the weekend report.
Yes, but it does look like we may get a pop in gold/miners as the dollar appears to be under pressure so far today.
Thanks for the summary
🙂 I actually remembered you saying that you appreciate a summary
And I do!
#HFT
AMRS maria
nice tx…
3 month daily chart – Kind of a bull flag, but I’m not sure if it is ready to break out upside right yet, or will it keep building. Watching that 10sma for a break higher
The bigger chart looks good too ( like a 1 yr)
looks done.. i can count abc complete… hmm
Thanks for the in-depth explanation on the cycle situation in gold/miners.
Just for further clarification, assuming gold is declining toward its ICL (which you said was signaled by the trendline break), we can assume that any upcoming daily cycles going into the ICL should be left translated, and further, that they should not take out the Sept highs? These left translated daily cycles could loosely correspond with the right-translated decline of the USD toward its first DCL, and subsequent right-translated rise into its intermediate cycle high? The upcoming ICL in gold would then complete the first IC coming out of the July YCL, and, assuming that this ICL doesn’t break the July lows, the IC high of the next/2nd intermediate cycle should ideally be higher than the Sept high, and possibly hit sometime in late Dec to early Jan?
Sorry if this is basic cycle stuff… just trying to understanding the setup as best I can.
That was a good review : )
BUT somewhere we want an eventual rocket ship wave 3 and not just nominal new highs but a screaming rally!! 🙂
Did anyone see me recommend AQMS to KEN the other day?
I hope he took a position ( I Didnt) though) : (
NSRPF – sweet
Bay Trader – Did you sit tight in that SN, or did you get fidgety & bail out. Looks good.
WTI – just crazy
still in that Boss. And IAG.. feeling good today
I am in it too (SN)
So this is another one that I can’t mention by name or it will sell off ? 🙂
annnd just like that… lol back down… HOLD gains!! lol
Got lucky and scalped RIG for 10 cents today.. so not mad at that
It does this everyday. Up and then right down.
But look at the chart. Even if it runs up & doesn’t hold highs, it is making gains. It went from a low of $4.24 to $5.25 in Sept and is still above $5 so far today.
Its like a slow motion climb 🙂
Good to know.
a lot of these small O&G plays feel like beachballs on strings in a swimming pool. they are being held back from the big bounces out of the water but it is getting harder and harder to hold them down.
nice analogy… lol
*now i wish i was at the beach w/ the sounds of the seagulls and waves .. smell of the ocean & cocoa butter ……………………….
*soon
H50-U R a go getter. I bet that U R a millionaire 2 times over by July 4th. Good Luck!
wow REXX … sheeeet
WTI & WG – Maybe REXX is the next one?
Alex. Are you still holding JNUG?
Yes, I mentioned that I was in the report under the GDXJ chart.
I dont recommend it for everyone, but I can handle draw down while expecting a dcl
without any emotional feelings about it. And if I have to sell for a loss, that is fine too.
Alex…on ARWR..do you see it getting through that resistance area around the $4.40 to $4.70 or so area and then on to $6 or do you think it will stall a long time at that resistance? Yes, a crystal ball question….:)
nice tam….
🙂 Finally one going like I want it to 🙂
🙂 hope u r well :o)
Thanks 🙂 Doing fine….trying to get back into life 🙂
I think that it could get through it to the ( Roughly ) $5 area, but I’m not sure if it will be a straight shot or climb the way IPI does.
It is pretty much doing what I thought it might – filling that gap on the left hand side and it looks like it has good strength.
Yeah, gonna stick with it….pull back now…tempted to get more…but also wishing I’d bailed when it was up .38 today…..I’ve been patient this far…..I flip flop back and forth all the time on what I should do….ha
IPI… what a steam roller…. keeps on keepn on … great trade my brother….
im rreally liking nak…. really… i think its heading straight to 4.70…. u?
*or at least prior highs…. 😉
I do, but ‘when’, right?
SNAP looks good Bay… may nab some of that on plbk
yes it does.. I grabbed some at close yes
SWN pull back….time to get more? Looks good on 3 month, 6 month, 1 year charts to me..
KURA went long 13.75 for a day trade
Out 14.35 and 14.5
Nice!
WOOHOOO IAG
Alex, when you get a chance – what do you think of ARDM chart?
I have nothing really constructive to add, just the obvious-
Since it is very extended, it could keep powering higher, or drop rapidly, or bull flag.
Trying out CLDX…we’ll see
so today we got a lower low at around 1277 in gold and I think in silver at 16.7ish, would this be day 1 in case it is the low or we start counting tomorrow?
Hi Marinho – Tomorrow if it started to run higher. The lowest point becomes that daily cycles low (DCL), then next day is the first day starting the next daily cycle.
So SOG has been adding SXE for a while (I believe it was SOG) and energy and oil is pulling back today and SXE rips 10%… can I borrow your ball of crystal brotha?
i bot it monday. when it was breaking out my indi on a massive (haha) 3.7k volume .. maybe bit premature considering SXE nearly always pulls back like a catapult prior to launch …got shook out last year when it did this.. but now wise to it 🙂
did just look ready to go
Good catch
remember when i said … DQ KNDI JNUG … ahem….
yesssm…
by the deuce, you nailed MU…
once in a great while i get nailed….oops i mean nail one 😉
*snicker
DQ nice nice….
nice to see FCX finally catching a bid
Agree, and HBM, TGB looking good too. They look like buys , but WRN – Lagging
was anyone brave enough to take a stab at the ROKU IPO?
GDXJ closed yesterday’s gap at $34.10
Chinese holiday next week has me inclined to hold my JDST into next week.
http://www.zerohedge.com/news/2017-09-27/real-driver-golds-recent-weakness
Good luck
Thanks for posting that about GDXJ Gap
So looking at SCO & UCO – that does look like a ‘bearish engulfing’,
This would be indicating that Oil could be topping and will seek out a dcl.
Will it be a drop straight down and time to panic? I wouldn’t expect it to be, but those charts do look like the sellers are overwhelming any new buying.
refresh
https://uploads.disquscdn.com/images/2ece139049653a9121cebf00ebde83ab78d003768a67ce405e1b5eaebc39606c.jpg
Does this diminish your view of SN?
I sold it.. Couldnt take the constant revisiting of my entry lol
No – I still like the Energy stocks,
Oil did the same type of engulfing on August 10. It didnt lead to a disaster for the energy stocks.
Use stops though, some of those rocket ship energy stocks may cone down in a nice orderly manner & offer a buying opportunity
Thanks!
I threw a chart in above as a guide
It is very close to the 50sma, so that could be a stop ( or just sell it), but there have been so many shake outs and stop runs in these sectors lately, that a stop under the 50 is probably going to get hit. I’d like to see if it acts individually rather than follow exactly what Oil does.
Again, look at that chart of UCO above… Oil does just drop quickly 1 day and carry on higher after, its just that this looks like an engulfing, and that is usually a topping candle.
Chart attached
https://uploads.disquscdn.com/images/2802b60ce532677d27195b1a2dabcdaca128c1f7cbc68c1bcda7c78bd1f56cec.jpg
GSS … snackn on some .. i likey
Alex. I am disappointed to read.yhat u think golds IC is.im decline. I was really hoping for a move to 1400 BUT we have to trade what we see. And glad u see a change in the trend this early. I went heavy GDX so will have to lighten big-time on a bounce
Yeah, I know – I’m not liking that either. At least I have had in my mind that we already had 2 daily cycles and I thought that the 3rd would ‘peak’ as the highs- some are reading Gold as having one long strong 56 day right translated daily cycle, and they must have expected the 2nd to be very strong too- now they have to say that the first daily cycle out of an ICL is R.T. & rolling over. It’s tough.
This run in Gold looks about the same as the DEC to Feb run.
Its all due to the weekly swing high and a break of the 10ma on a weekly chart, and what we anticipate from that.
I am still going to be holding on to some Miners, because of Geopolitical tensions, Triangles in play, and the USD having an ICL could be a strong start & a sideways consolidation , then roll over again.
I think it may be time to rotate to “metals” again, we’ll see.
fwiw.. this is a DUST 4day PPO indi ‘cloud’ (and a purdey colorful one for Nancy:) .. gives some interesting info.
this tells me DUST is a breakout ..or a fakeout. of a 2 year downtrend
if it was a stock i’d been tracking, i would be buying
https://uploads.disquscdn.com/images/f50501b3cc2a1d2702c66b73c971720523c5a49ab51913cadc81c4cb7c232ed2.jpg
Refresh-
Well, GDX & GDXJ may not have held on to thier FED SWING LOWS, but IAG ( 1 of the leaders last time) Sure did.
This could be a good sign
https://uploads.disquscdn.com/images/40795521c025ce778cf98fb030275984286b24a50cd721f7c7d03ca87e0b47c9.jpg
Well… This feels like the longest Ive held a miner but its only been since last week. I almost cut it twice already but Im sure glad I didnt… Honestly going to be locking in half today.. Ive let profit slip my hands too often lately.
Lock in half the loss? 😛
No I reentered at .08
I was looking at PRTO a few days ago but didn’t do anything about it….argh. It’s not too late according to the chart…if it does an ARWR and goes back up to fill that huge gap….wow….but…it’s a bio company..so…have to be cautious..
Dare I say it??
Unconfirmed swing in GDX & GDXJ – needs follow through tomorrow and especially a break & close above the 10sma.
And we can all hope that IAG , AUY, NSRPF, GSV, NGD, SA know something ; – )
Guys, Look at SA, NGD, AUY – their (and other individual miners) swing low was on the FED day
ticker SA
( & IAG & even NGD)
Ignore cycles and just look at it from a technical chart view.
Bullish
Okay I’m back in CLF ready for another beating….hopefully not again though.
Peter, you still riding GV ( I think it was you that took the hurricane in Florida play).
Congrats if so- it is doing very well.
Yes, still holding. Nervous about adding (unless you feel stronger about this one) but up 16.4% so far!
I’ll put it in the report, I do have a few readers that told me that they took that trade when I mentioned it. Todays break out looks good..
Overall , it looks very good,and if it had large increasing volume, I would say yes to adding at anytime. At this point it is a tough call, it could pull back to the 200sma for a bit and offer a better entry – but it also may not. I do have a price target much higher ( Near $8) so I would recommend riding it and not selling it ,
See attached for a basic idea for now, I’ll have an update in tomorrows pre-market report
https://uploads.disquscdn.com/images/e1ffe87cc8bd0eee1bc2bcc09d417367cf0a2c8420e34724454e589b7314dbf4.jpg
And congrats, I was hoping that you were still in it.
I’m still in in – part Stock and part March Calls
So I was looking at AEHR today…..and started to get it, but they were announcing earnings today and I didn’t want to get in on a possible fall….well, up 16% AH’s…argh. Guess it was a good report….we’ll see how it opens in the morning, but likely has more room to run anyway…
CATB – another ARWR scenario? Don’t know anything about the company…
That’s funny, I plugged it in and it showed up as a ticker that I have looked up before, but I dont remember it. Long term chart looks nice
It seemed familiar to me like I’d read up on it, so I just went back and looked at past paper notes I take…..on 9/17 of my notes I have a star by it with a note: “like MNKD or ENPH?? might continue higher, watch it”………if ONLY I looked at my notes more often….ha
So now I’m going through past notes to see if I can find any gems….
Two of my trading buddies are in that.. Chart looks great!
You might have been the one to mention it….just found another note with CATB and your name beside it ….hahaha…
VKTX looks good….1.20 to 1.80 in 6 days, 3 year chart looks awesome….they’ve had positive results come out in September that has pushed price up..
GV playing out exactly how CF mentioned… jesus man.. Share the crystal ball
FRIDAYS REPORT IS NOW POSTED