SEPTEMBER 20 – FED WEDNESDAY
Today we have our FOMC meeting, so lets discuss a few things that we will be looking for…
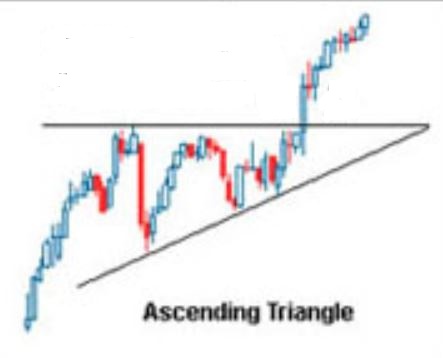
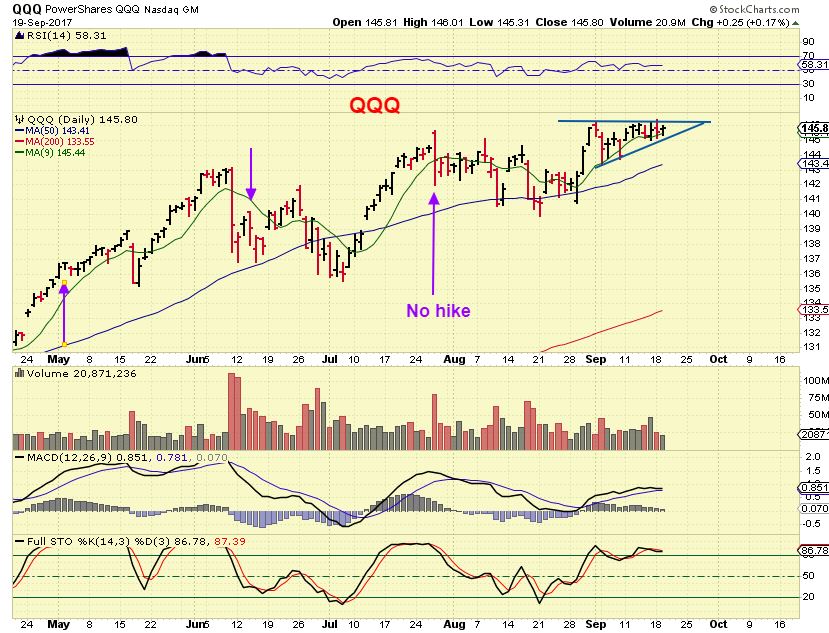
I want to start with this. I posted a chart of an ascending triangle in a prior report and showed how they often break out & run to the upside.
ASCENDING TRIANGLE –
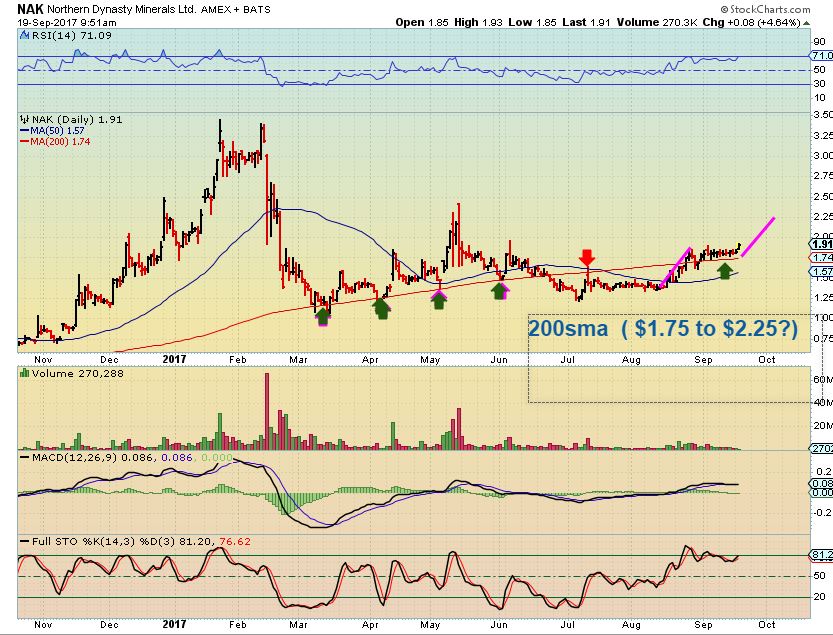
NAK – I pointed one out in NAK
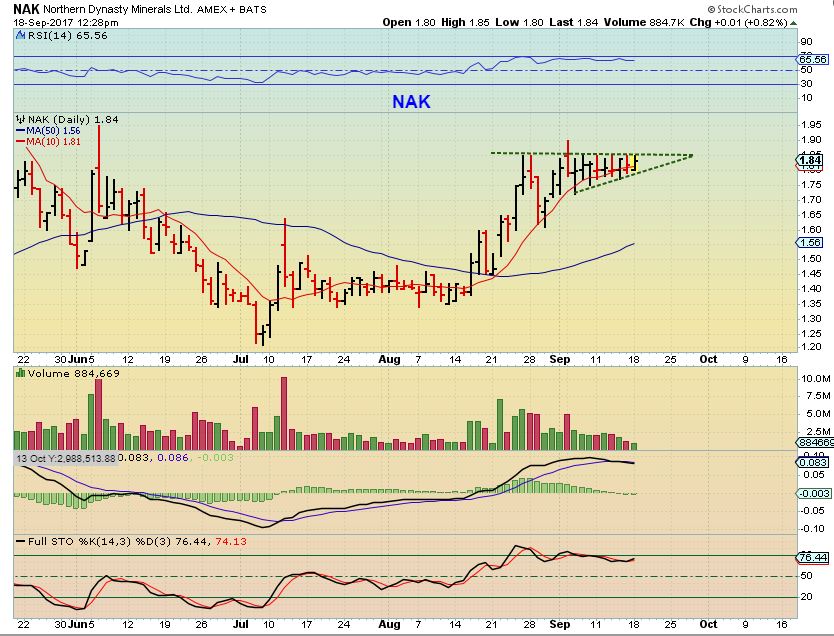
NAK – NAK started to break out higher yesterday, I would expect follow through to at least $2.25, but also…
QQQ – We may be seeing on the the NASDAQ, right at the FOMC MEETING. SO we may get a break out to the upside. Note: They are not fool proof, and they can do a false break out, but if I was long from the dcl, I would stay long for now and watch how this plays out. Also this is often played by buying the break out with a srop below the lower triangle line.
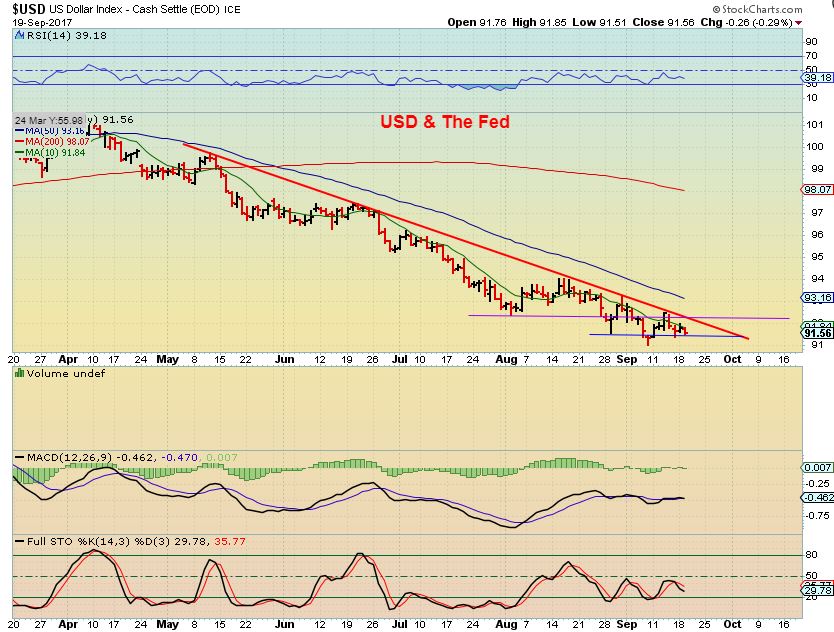
USD – The USD is overdue for a bounce or rally or an ICL. It has been weak and unable to gain traction, but the FED DECISION could definitely affect this in a bullish manner or a bearish one. Let’s take a look.
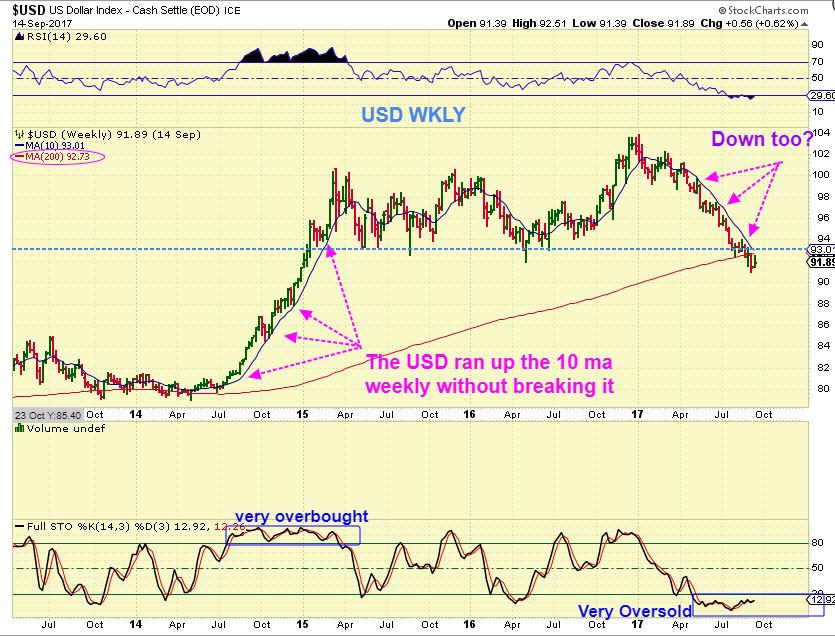
USD WEEKLY – This chart was from the weekend report, I pointed out that the USD is pinned under resistance. If it stays here too long, it could drop the same way that it ran higher in 2014.
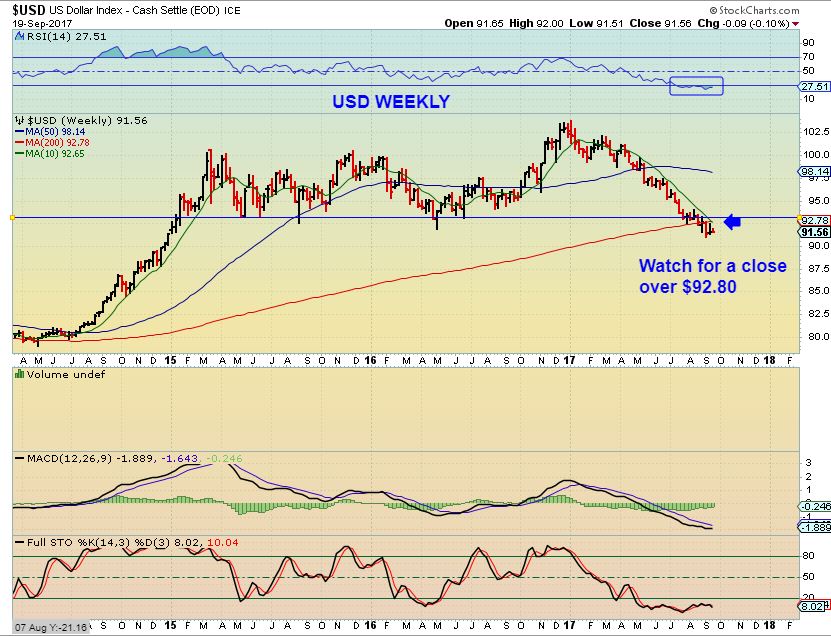
USD WEEKLY – Today the USD remains under that resistance. I am watching for a close above 92.80 to give the USD short term bulls hope. Again, if it lingers here, I dont see why it wouldnt fall in the same manner that it rose in 2014.
Nothing has really changed in Tuesdays trading with OIL & NATGAS, so Let’s move right on to Gold & the Miners. We all know the FOMC MTG can affect this sector, so I want to dig in a bit and prepare us for what may happen today.
Let me start by saying that VOLATILITY often occurs, and the initial knee jerk reaction at 2 p.m. Eastern time may ( or may not) have follow through. I have seen the initial 2 p.m. reaction run for an hour (higher or lower) and then reverse completely into the close. That said, itf that kind of volatility frustrates you, you do not have to be buying right after the FOMC Decision if things start rising. You do NOT have to catch day 1 – it is often best to wait for a swing low to form. Let’s look at this sector.
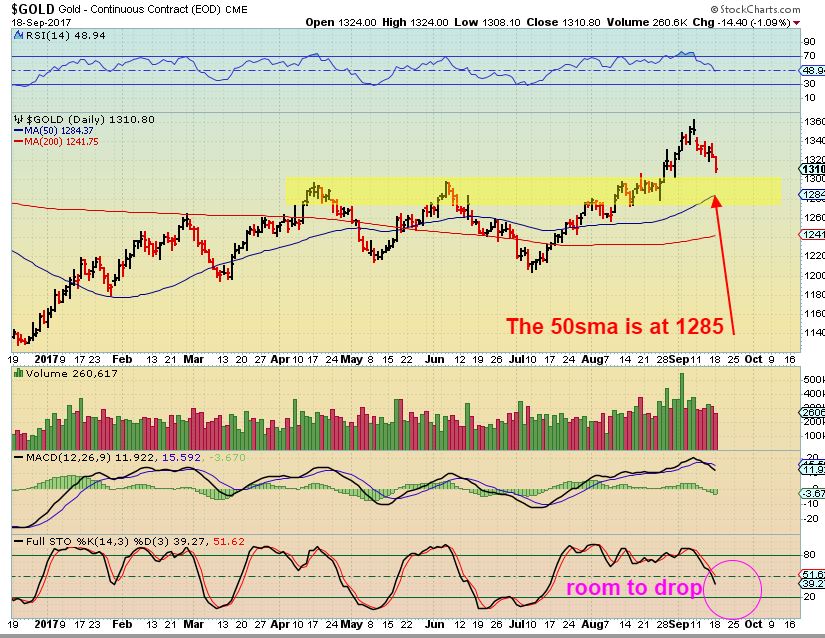
GOLD From Tuesdays report – I would like to see a back test here at 1300 or lower for the 50sma, but that almost seems too easy,right? Everyone might be waiting for that exact back test, so maybe we do not get it. We are in the timing to seek out a DCL too. I do believe that we are close.
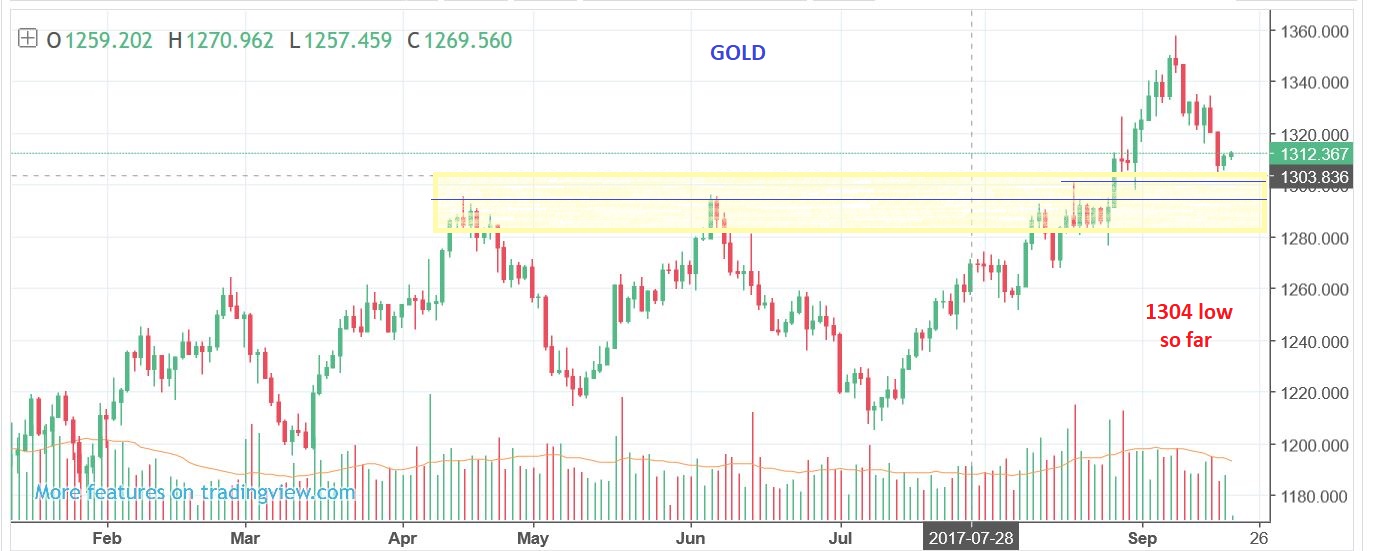
GOLD TUESDAY – $1304 is the drop so far, that MIGHT be all we get. I grabbed this chart on Tuesday night Eastern time. $1304 to $1313 occurred already.
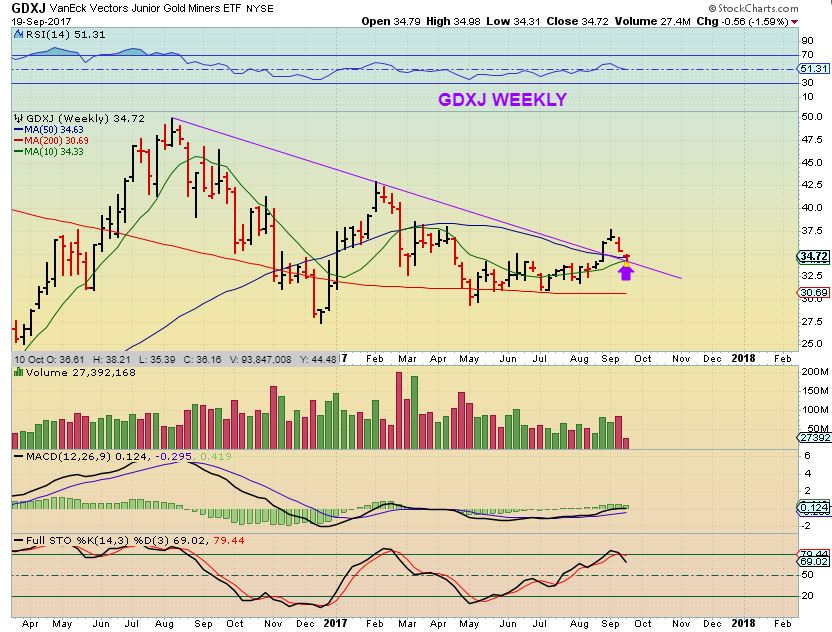
GDXJ Look at this. It seems to have in place a good back test of the triangle and the 10 weekly MA. In Technical Analysis, I would buy this with a stop loosely under this support, but with the FOMC and the USD the way it is, it would probably be safer or at least less nerve wracking to wait for some solid proof of a reversal. We may get that with the Fed. This is a weekly chart, a weekly swing low cannot happen until at least next week.
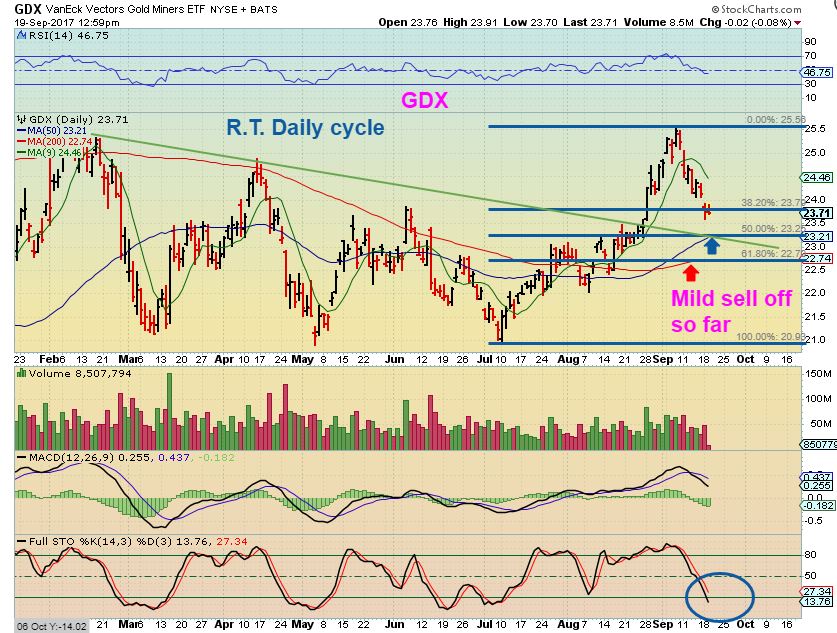
GDX – SO far the selling has been mild for this entire run. A 38% pullback. We have a 50sma and a trend line at the 50% pullback, so maybe we’ll see that after the FOMC Meeting. Maybe. On this chart, the low was Monday SO FAR, and this could form an unconfirmed swing today if price moves above Mondays highs. Is the selling in Miners just about done, considering that back test on the GDXJ chart above? Evidence suggests that selling may be just about done, it looks like we are close to a DCL here.
3 CHARTS- THIS IS WHAT YOU SHOULD KNOW
I wanted to go back and show you on clear simple charts what has happened at prior FOMC meetings. THIS TYPE OF INFORMATION CAN BE VERY HELPFUL in showing us not only what we might see today, but in the past at FOMC decisions.
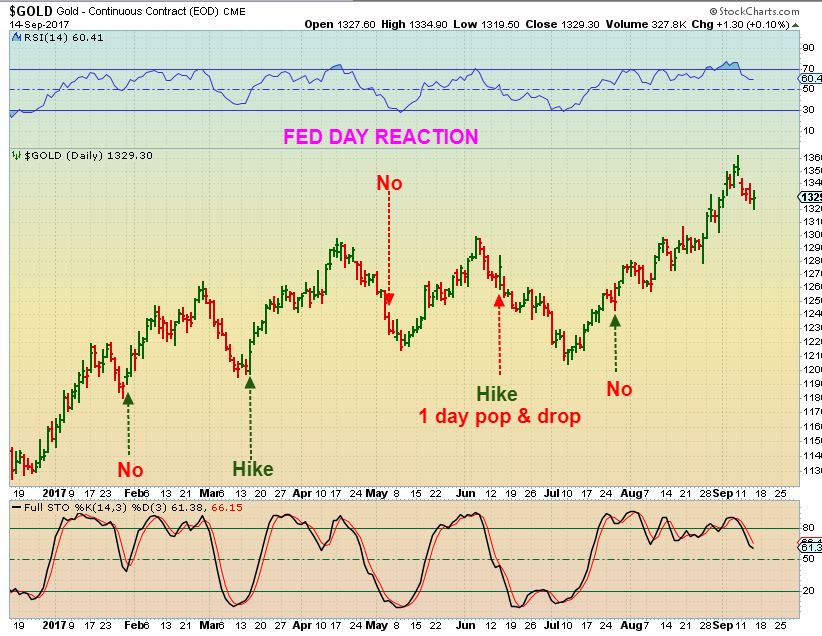
GOLD – I’ve listed whether we had a ‘No rate hike’ or ‘Yes’. I have noticed that in 2017 a Rate hike didn’t seem to really matter from what I see below. What mattered was where Gold was in ‘time’. That FED DAY got volatile, but direction was not likely affected much. In other words, it was already baked into the cake. Transparency gave us no big surprise. I do not think we will have a big surprise by the Fed today either. Follow along on the chart…
JAN -FEB No hike = A dcl & a rally
March – A hike on what turned out to be day 3 and a dcl & a rally
MAY was no hike, and 3 more days down, then a dcl. The DCL was due.
June – A Hike and a strong Fed Day POP, that failed. That June strong reversal higher failed.
July – no hike – we were in the middle of a rally
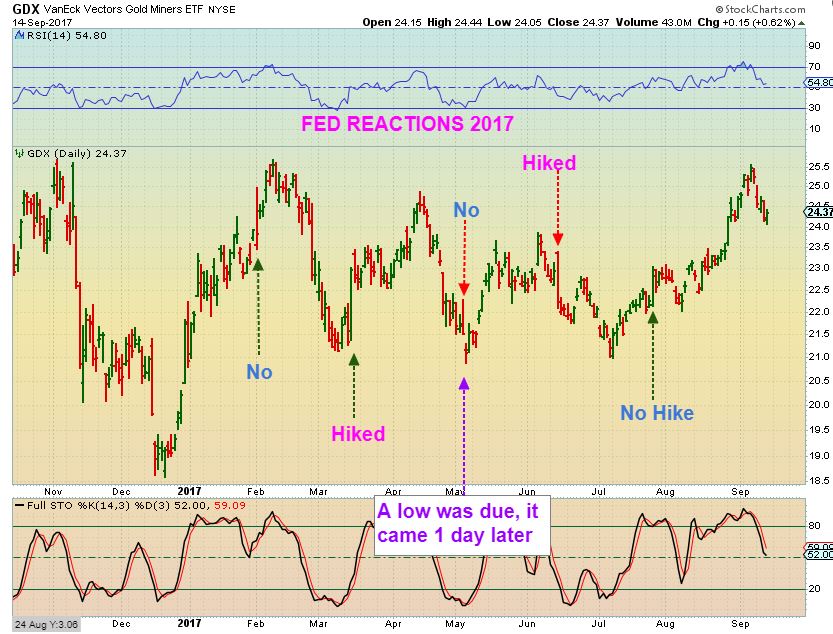
GDX – See the chart and follow along the same way we viewed it above with Gold. GDX had a couple of VERY LARGE 1 day FOMC candles (volatility) and then the next day, not very much more. Does knowing that help you today? Interesting, isn’t it? If we get a Huge move after the FOMC today, it may do nothing big tomorrow as far as continuation, allowing you to relax and take positions. Or you could risk front running the big day.
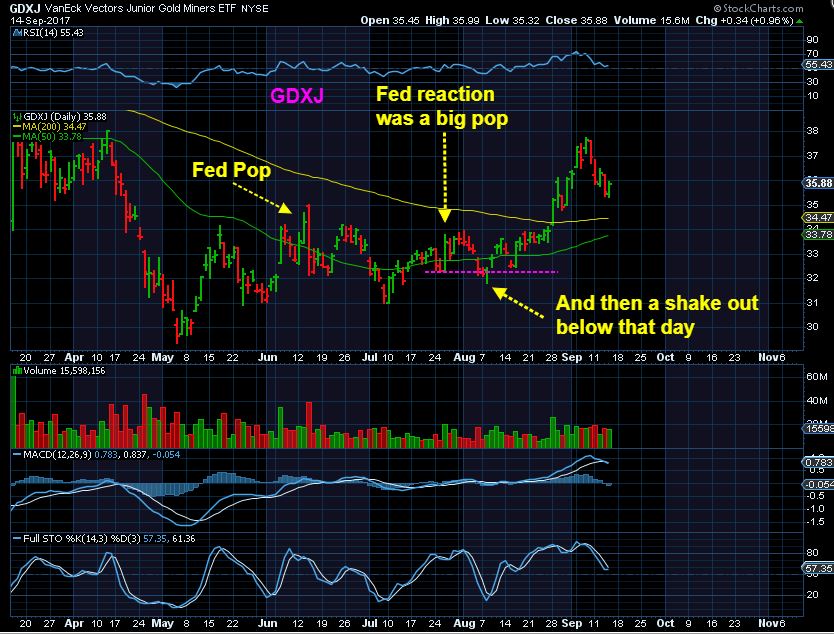
GDXJ – We see the same here with the GDXJ. Big Pops and little follow through, but remember too, we were forming a larger picture triangle, so GDXJ was ‘directionless’ for a while.
What do the above charts show? That we may get a strong reaction at 2 p.m., yet tomorrow it may not have strong follow through, unless time is up for the daily cycle selling and a DCL is ready to be put in place. We are close and due for a dcl.
So I looked at a few Miners yesterday and I did see some trying to reverse after selling off. Could this be indicating that buyers are stepping in or some type of smart money could even be accumulating ahead of the Fed? The timing is right for a DCL, so this could be signaling that we are close.
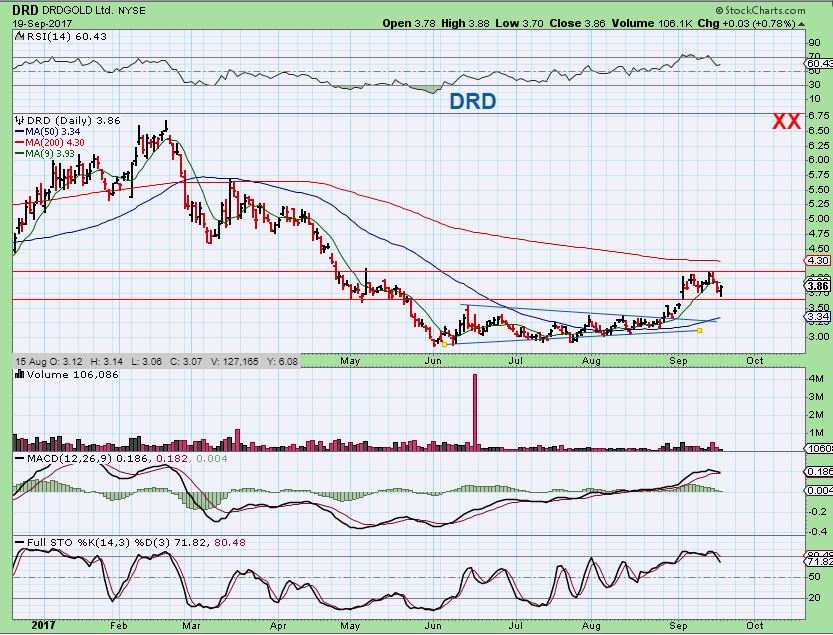
DRD – I thought that DRD was dropping to fill that gap, and it acted as support instead Buyers stepped in and we got a reversal at the gap.
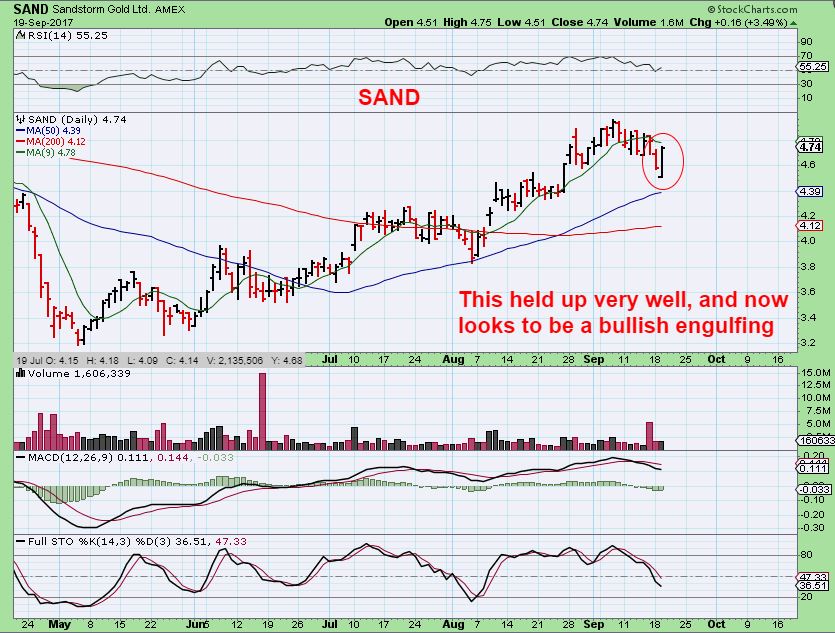
SAND– Sand has hardly sold off at all from the top, and this looks like a bullish engulfing on Tuesday. It MIGHT tag the 50sma on the FED Wednesday, but this also may just be all we will see for selling here. It is too hard to tell with the volatility that we often get on a Fed Day, but this is usually bullish.
Waiting for a swing low is safer and less frustrating, but buying the dip if we are waiting for a DCL usually sees higher price later over time. Personally I am still holding IPI, HOS, WRN, NAK, and a few miners like DRD, GSS, EGI, etc so I may just hold on and wait and see what happens. I personally am not even sure if I will be in front of a screen today at 2 p.m., so I may just have to wait and see the end results. Note: Use leverage at your own risk, I simply cannot coach everyones leveraged positions day by day by day, but I often get emails daily when readers own JNUG or NUGT asking me about the wiggles. You MUST expect it to be a bouncy ride, leverage exaggerates the moves higher & lower.
I will post one more GDX chart below, enjoy your FOMC Decision day trading, and strap on your seat belts at 2 p.m., it often gets a bit shaky 🙂
~ALEX
.
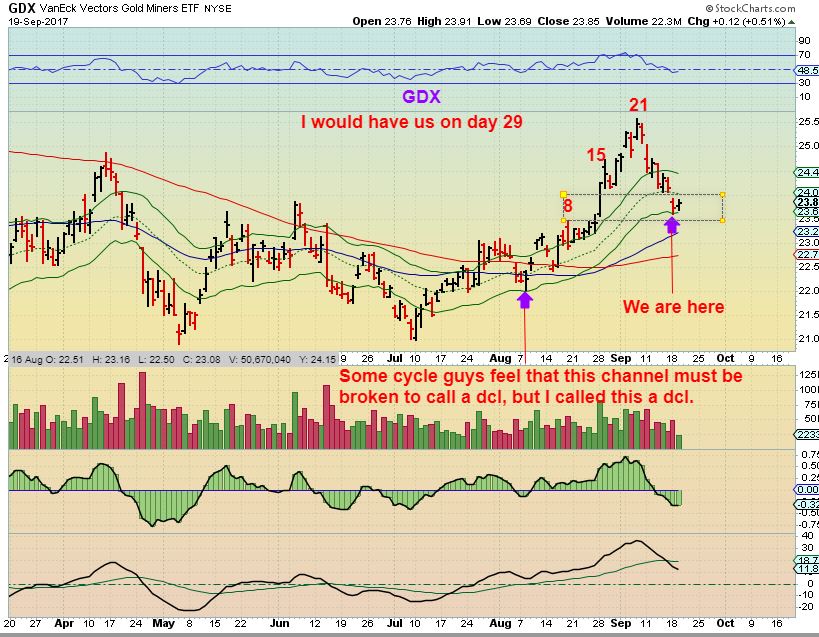
Final GDX CHART – I would have us on day 29, I called a dcl on Aug 8th the day this reversal occurred. Day 29 would have us due for that dcl ( low). Other have us on day 45+, way overdue for a low, because they want to see that green channel broken- so take that for what it is. I have never seen a day 40+ daily cycle, but it doesn’t even matter much in this bull run. It means either day 29 or day 50 or whatever, we are due for a low anytime now, and GDX almost has an unconfirmed swing in place too. A break above Mondays highs is an UNCONFIRMED swing on Fed Day.
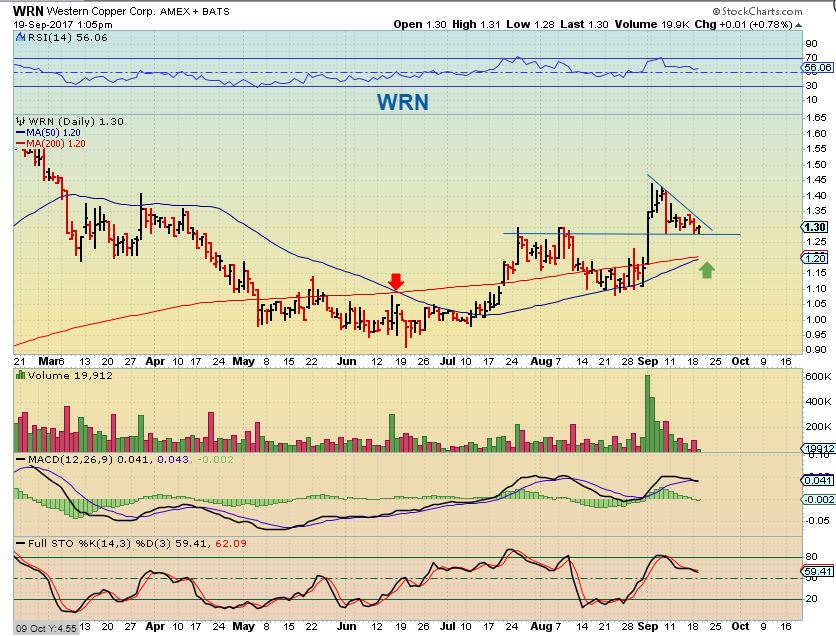
WRN – This looks like it is refusing to sell off below that support area. The 50 wants to cross the 200sma , as price remains bullish.
I am pretty focused on Metals and Miners – but some of the Medical marijuana stocks have been setting up nicely, like GBLX, XXII, maybe EDXC is basing, and a few others like the 2 bullish charts below. I am just monitoring these at this point, but they are bullish and I know some like to trade them.
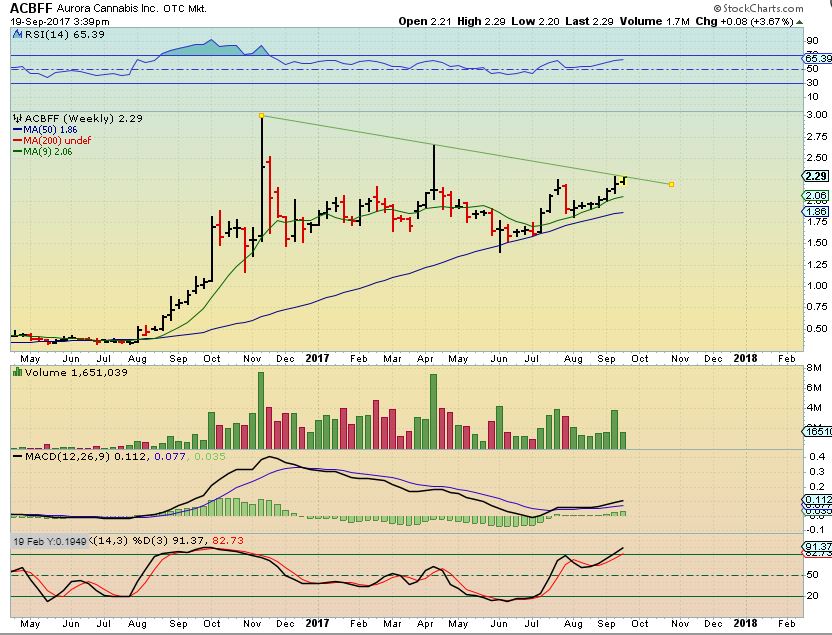
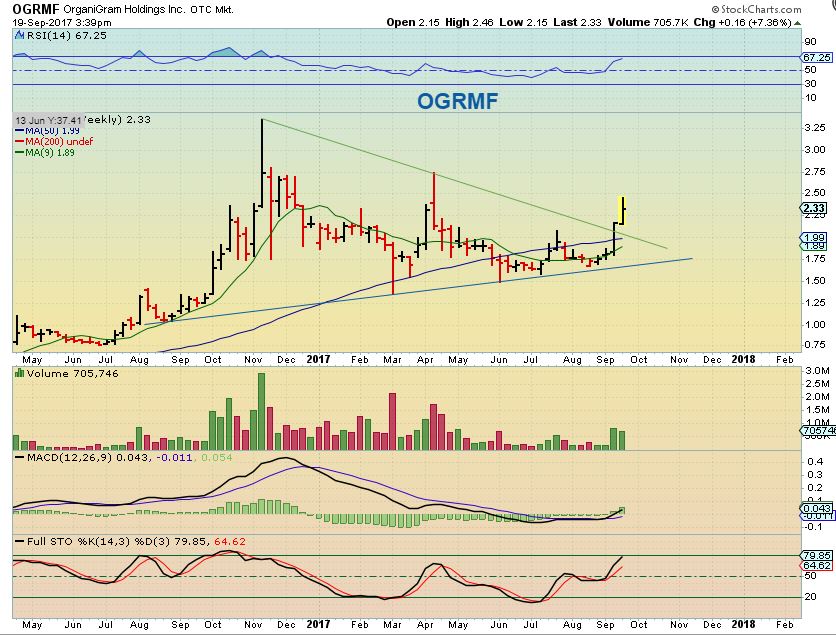
ACBFF – A medical Marijuana stock weekly chart that looks ready to break out.
OGRMF – And this one did break out. Again, these are weekly charts but they are showing that this sector has consolidated the huge gains in 2016 and may be ready to continue higher. The Daily charts of these and others seem to be firming up and for some reason, these Marijuana stocks seem to run at the end of the year.


Really well laid out CF. I like it. There is no need or desire for me to take on additional risk right at the moment until we get some direction. So today might be a good day to go chop wood.
Great repost CF – To those Holding MB_T – congrats! of course I sold 10 cents ago…
SSYS not making it easy.. gotta reverse here or i’ll havta bail
Ditto – but HO_ is killing it!
it sho is.. last eight 4H candles are green
GDXJ sitting right on that 200 MA.
TGB almost touching 50 sma 1.67. Ready to start the rally?
DSX …. DNR … 😉
at the 10 DMA now, check out how it has popped in the past at this point https://uploads.disquscdn.com/images/49b8f9c335ed7d4a778bea8deb8de662e0b49c0c23d9ed0dd61ff44fb6a7433d.png
yesss…. that’s why I like to trade this one … quick pops
I know im supposed to hold but closed second half of HO* today.. Biggest single swing this year! thanks CF
I was just looking at that chart – congrats, great trade!
Well GDX is finally above Monday´s highs, lets see if it means anything.
PLUG ….. FTB ..?
https://www.tradingview.com/x/Tb0CJSvO/
USG goin…
That thing moves so fast lol
Sure “feels” like a DCL is in place – sure hope Lucy doesn’t yank the football away at 2pm FOMC
fwiw, here’s 30min chart of GDXJ
hmmm… let me try again above
…
https://uploads.disquscdn.com/images/352748737c24d58df45126251f14552dabcbeeb61d46261e508b6cf240ab305e.png
I’m out of H_OS at 4.13. I’m going to see if it can hang above the 200 sma today before buying again.
I got out a cpl nickels below you, but great trade from low 3s!
Serious props to Alex.
Nice trade Peter 🙂
Hey CF, I got out jsut shy of the 200… I told u this one Ill hold more than a week. My account thanks u! lol
I remember your double buy BT, and you did say you’d hold it for a bit- Very nice ending to that story.
If it crawls along the 200sma, I will be buying again for a break out and run. Look at a 1 year chart & it wants $8 in my opinion.
I am holding 100 shares just in case lol – with such a tiny amount from where I got in im up , but it forces me to keep an eye on it.
I took the profit too but still holding ERF and POU.TO in the oil world.
Rock on brotha! My Long term acct has BBG, RIG, and SN.. SWN seems to be my dud at the moment – not even sure if these are all oil lol
Can’t believe I took a big hit on AUU yesterday just to see it come back today without me aboard. And I even gave it extra latitude on the stop.
Is it AAU or AUU? I cant find AUU, but maybe it is Canadian
If it is AAU – it looks like the shake out at the 50sma, and not your fault, that was a deeeeep drop for a shake out.
That’s crappy HO, but you gotta be solid on those stops. A few days ago AUMN stopped me out, and I had given it a bit of extra room – and then it dropped another 10%.
I agree, over-riding stops has cost me more money than any other trading mistake.
who u callin a HO
no one – I meant H0 – but could you please blow GSV another kiss
Yes , it was AAU.
Quick Update: I watched HOS break through the 200sma this a.m. , and looked great, then on a a 5 minute it did a double top and I sold at $4.23. I didnt post real time, because I am on slow internet and it is NOT a sell anyways on the daily. I told someone in an email that a false break of the 200sma is possible and then HOS would “CRAWL” along that 200sma and if so, allow me back in… so this is a ‘trade’ , but I consider this set up in HOS to still be bullish longer term
So basically all I did today was sell HOS ( SIMPLY BECAUSE I have very good profit in HOS, IPI, TGB, NAK, ENPH, and MBOT etc – I decided to front run the Miners GDX / GDXJ) since I will not be in front of my screen during Fed Mtg – I will be with family. IF I bought leverage at $20.03 🙂 I would only plan on holding for a week or 2 depending on how things unfold. THIS MAY NOT BE THE DCL, but I have a relatively small position that can easily be weathered by me with recent gain. I do not panic in volatility, but please know your self as a trader / investor and trade to your expectations.
THIS IS RISKY, but refresh for 2 charts.
1st One is why I let HOS go, but it is NOT a bad stock. This pop eventually double topped along the top of that channel. I think that anyone still holding will be fine , the daily chart remians bullish and it could go to $6 = over time. I am going to re-enter HOS if it crawls on the 200sma or even pulls back a bit. ALSO HOS COULD RECOVER TODAY, who knows? I sold for locking in gains and try to re-enter near the 200sma
@nd chart is just technical analysis got GDX- it looks bullish, but FED DAY trumps bullish in a flash at times. Proceed with caution.
https://uploads.disquscdn.com/images/a727053e0b72ec5fb5d81e8cafd6f481ea94705362f4aaefa3b74a21bb36dce5.jpg
https://uploads.disquscdn.com/images/22d34ff566b3a2bcc71f44e4685af6ac48d7418b954ebf9b49a879567108490d.jpg
P.S. still in ENPH and it seems to hug the 8 ema
NAK trade is following through today
M8oT 🙂 Doing fine
CF, I have some BBG in my IRA from about 3 weeks ago at 325… I want to lock in profs today, but will wait if you think I can test the 200 first… thoughts?
Gotta run, Fed volatility is probably a given. We are due for a dcl, it could be in place, it could come a day or two later, but Some Miners do seem to be showing resilience.
The USD has me puzzled a bit. have a great afternoon all.
UWT rocking and rollin – good play Maria
I entered another stock we shall not speak of but rhymes with FNUG.
LMFAO
not so funny now
just lost my shirt on IAG…
GSV gettin hammered.. bet you glad that one went last week
Hopefully you still have your pants (or am I assuming too much?)
It landed on the 50sma, down 15 cents.
CF – I may have overstepped… I lost about 300$ on it. Luckily, AMD end of day, and a few other day trades saved me on that.
I went a little heavy yesterday thinking I caught the bottom and set a stop at what i thought was low enough.
I didnt see it land on any SMA that I use.. The 50 and 200 are well below? The 50sma is at 5.82..
Im not too worried, You gift wrapped quite a few trades for us these past few weeks and for that I thank you!
Hope we take the “F” out of it at 2PM today. Whoo!!
Haha I also started a small position yesterday.
I’m not sure I like the intraday run-up in miners going into the Fed release… I feel like it’s the market’s way of drawing people in for a sucker punch. Any other day, it would look like we were setting up a swing low…
We’ll know in 4 more minutes!!
ARWR really climbing today after a drop a few days ago….
LABU looks great on the daily
Higher lows on OPHT. I was barely able to hold on through the correction. Hopefully, there’s follow through on the upside going forward! https://uploads.disquscdn.com/images/f4a6491d949e42fb1adc84db099b4dae23cc636e42609c6460d920b6f269706e.png
So, buy the dip, completely avoid, or wait until tomorrow?
too early to tell, GDXJ/GDX look like they want to move down more
Agreed with you right then, just wasn’t able to post that second. Thanks!
looking for a nice bounce here
That was ALMOST really cool and then… 🙁
I suppose it depends on how much you own already. If I was flat going into this, I would be buying some today, some tomorrow too, no matter if higher or lower.
JNUG? Only a little. I still own my miners bought from the breakout which are essentially back to breakeven at this point.
CF had 31% retrace from bottom in July. But a lot of us waiting for the triangle base and from there it was 81% as of yesterday now a Full 100% so thats a completely different point of view.
I got filled on a few buy orders just now, more to remind myself it is what I should be looking to do. I´m in about the same position as you, after seeing my miners up a good amount, they have all pulled back to around where I bought them, except MUX which was stopped out a few days ago. I don´t have JNUG, just individual miners, and 20-25% of my funds still waiting to get invested in these things hold up.
stopped out of IAG hardcore
what happened? FED raised?
quantitative easing officially came to an end and gold futures dropped point seven of a percent
FCX…I am now an investor. Ouch….:(
EVERYTHING is going down today on the Fed news. Fortunately, I’m still 100% cash in all accounts. My charts indicate more downside ahead for miners so I’d be very careful buying the dip in miners today. Yesterday, I thought there MIGHT be chance that miners bottomed on Monday so I took a small starter position in JNUG/NUGT but I bailed out of those when a strong bounce did not happen because my daily miner charts were (and still are) bearish.
I’m looking for buying opps in miners and the general markets and it may be better to wait a couple days for things to settle down IMO. As always, check your own charts and make your own trades and keep following Alex!
Good trading to all!
Not everything,, I mentioned adding to PGH yesterday and nice move today so far, Quite a few energy stocks stil looking good https://uploads.disquscdn.com/images/9dc68f2573789fd6e74a6113ae8ff72347c1599bf90b847d442dd7510d9f2b69.png
Obviously I didn’t mean “everything” literally … I meant miners (GDX/GDXJ), bonds and the stock indices (SPY, QQQ). Of course there are stocks that are green today. Personally, I don’t trade individual stocks.
I guess the word “EVERYTHING” in all caps threw me off, 🙂
LOL
HA
GDX´s 50 MA is at $23.25, a few cents away, and the 200 is at $22.75. I haven´t added yet, but will if we can touch those.
Tagged the 50 MA on GDX finally, and gold futures managed to break $1300 by 50 cents. I have some orders in to buy below market prices, good enough for me.
In God we trust, all others bring data… we are due for a DCL, seems like an undercut low. I am jumping in.
But Steve’s indicators say that we shouldn’t
Rob, I am posting what I see for info only, please check your own charts and make your own trades. I’m very cautious, I never try to catch a “bottom” because you only know for sure that the bottom is in after prices start going back up. I’m tempted to make a SMALL buy in my trading account today just in case this turns out to be the bottom, but in my retirement accounts I will wait for confirmation that the price trend has reversed back up. I will miss getting in at the bottom but I greatly reduce my odds for a draw down. I have done very well this year and I’m content keep the money I have in cash, even if I don’t make another dollar this year. I’m in no rush to take big risks.
Same. I bought lightly before the minutes. Buying the rest now.
Gold tagging support @ 1300, silver tagging 50ma. All unleveraged positions that I can just hold to the 3rd DC / IC top.
Wouldn’t it be great to close green today… Just as Alex noted in today’s report “I have seen the initial 2 p.m. reaction run for an hour (higher or lower) and then reverse completely into the close. ”
Fingers crossed.
YES!!
am just watching KGC.. dropped about 4% to backtest its breakout triangle & 50sma.. now reversing back up..
will it stick? dunno
abc down…?
C=A
https://www.tradingview.com/x/kePz9wbx/
what yer mean C=A?
sorry … at work… had someone in my office… (my ceilings leaking… lol)
hulloha.. Mama not taking questions?
s’ok just twigged what you were on about (superimposed A wave on top of C, i think)
yes… exactly… ding ding ding …. Gold star For u….;)
Probably an historic buying moment opportunity and I’m like a feakin rabbit in the headlights
if it is such a thing, can surely wait till downtrend breakout, and you’ll be just fine & dandy
isnt it “funny” how there is GAP at the same EXACT place/time on both A & C …..
https://www.tradingview.com/x/LDGHbpUy/
Damn. I thought Day 2 was too late so I went with day -3!
day -3 ?
book early, just to make sure
sooooo what’s the WORST that can happen….? You buy on Day 2 ??? ;o)
true true
Let the short covering begin.
Nice volume in Jnug and pretty good in Gdx also.
Apparently the S&P likes that the Fed is tightening. LOL!
Much easier to make money in stocks than miners. Check out the YTD for TQQQ vs NUGT.
Until it isn’t.
That’s why I’m a trend follower. I buy TQQQ when it’s going up and get out when it’s not. I’m all cash now, I’m not in TQQQ because it is not currently in an up trend, it’s trading sideways. BTW I did the same thing in NUGT, I bot in low in August and rode it while it was in an UP trend and sold it all at a 30-36% gain when it rolled over into a down trend.
Agree- who was long TQQQ ‘all year’ vs someone that was ‘long NUGT all year’?
They are trading vehicles, and easier in hindsight …not real time.
Alex, I agree. Every year I say “I should just put all my money in TQQQ and forget it” … but I never actually do that! LOL Nothing is “easy” to trade, my only point is that stocks have consistently been trending up most of the year (with some NASTY down days) while miners have been a much rougher ride. I’ve made a lot of trading mistakes and should have done better … what I have learned this year is take profits near a “top” rather than trying to play longer term and giving back big chunks of my gains. I finally did it right with my recent NUGT trade … earlier this year I held my JNUG way too long and gave back way too much of my gains.
Just throwing this out as food for thought … I mentioned earlier this week that on my charts the current down trend in miners (GDX/GDXJ) looks very similar to the move down at the end of April that bottomed out on May 5th. If this pattern continues to match that pattern, miners could fall much farther from here. For example, NUGT fell from around $35 to around $27. I’m not saying this WILL happen, just pointing out that it might happen so be very careful. As an old “bottom picker” I got burned many times by figuring a drop would end at a certain MA or Fib line. Just be open to the possibility that miners may drop farther than you expect. I’m not trying to scare you out of your trades, please check your own charts and make your own decisions, I’m just providing some “alternative facts” to consider. If today does turn out to be the bottom, congrats to everyone who had the guts to load up.
And as always, let Alex be your guide!
Come on FNUG. Let’s do this. HA!!
I ended up buying 100 shares of NUGT as a starter. Altogether, I’m at about 47% of port and expect a bottom soon if not already.
My IRA acct just went Bananas… AMD/Tesla News… And I was getting damn close to cutting AMD
https://www.cnbc.com/2017/09/20/tesla-building-an-ai-chip-for-its-cars-with-amd-globalfoundries.html
Wow,,huge last 10 minutes to the close for AMD,,nice. Should be some good follow through on that, even short covering
Started a position in PDS today.
Closed and holding 10w MA for first time since Feb, yearly double bottom if it can hold and MACD just bottoming. Lots of resistance above though, fairly congested. but volume looks good lately as does daily chart.
Weekly https://uploads.disquscdn.com/images/c235fde650011fcb82c69d885d387a8758c17037459c773f40da184eb1fa4151.png
Daily
https://uploads.disquscdn.com/images/d9a23b1473aed8357debdc2cefb1f1aaa391f1f42e47a47933c3496d7000f147.png
BOW/SOS. Huge BOW number on GDX 200m plus, and GLD worth a mention @ over 80m. Streight from the for what its worth department.
Thanks – I like the added info Crawdaddy
Is AMD a sell or a hold on this news today? Its up after hours.
I have a full position in the ira from last year. That’s going nowhere.
Grabbed a good size at close and plan on holding at least until tomorrow to see how it plays out. Up almost a dollar from my entry end of day so even if it starts to drop, I’ll cut.
Not sure if this news is a long hold type news… waiting for both companies to confirm as well.
HOLD
Thanks.
I am working on this mornings report. I have charts uploaded & drawn up, but still need to write the story.
I want to be BRIEF to get this out before the markets open, FED VOLATILITY does make that difficult to do.
Thanks for your patience
The report for Thursday has been released. Please ignore typos