Let’s review the market action from last week, and see where that puts us.
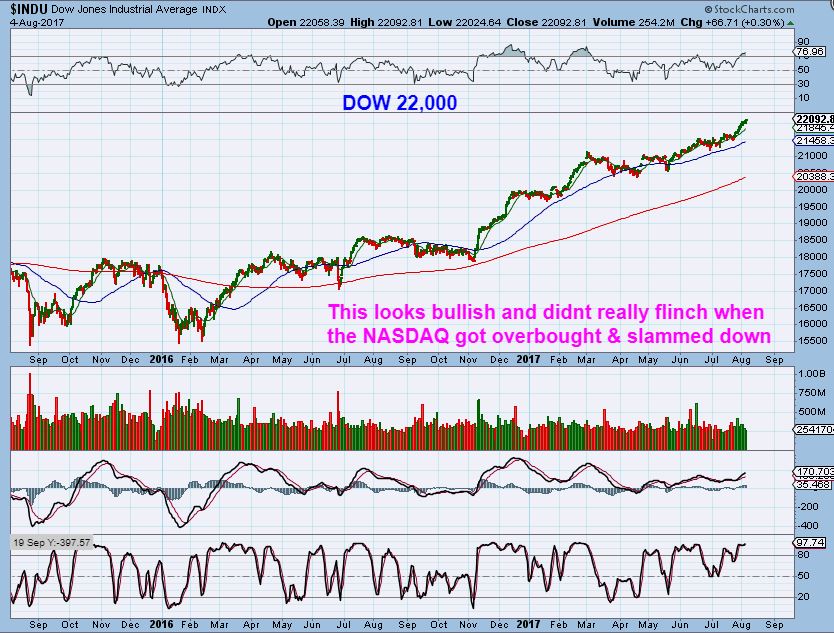
DOW 22,000 was the big deal. The NASDAQ had its day in the light, and now it has been consolidating as the DOW & SPX have been moving higher.
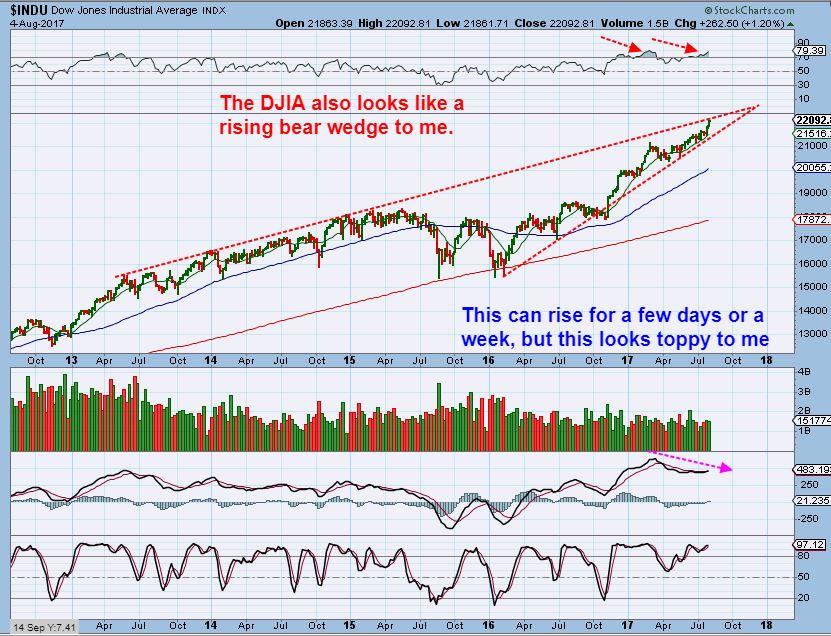
DOW WEEKLY – However , is the DOW getting a little ahead of itself too?
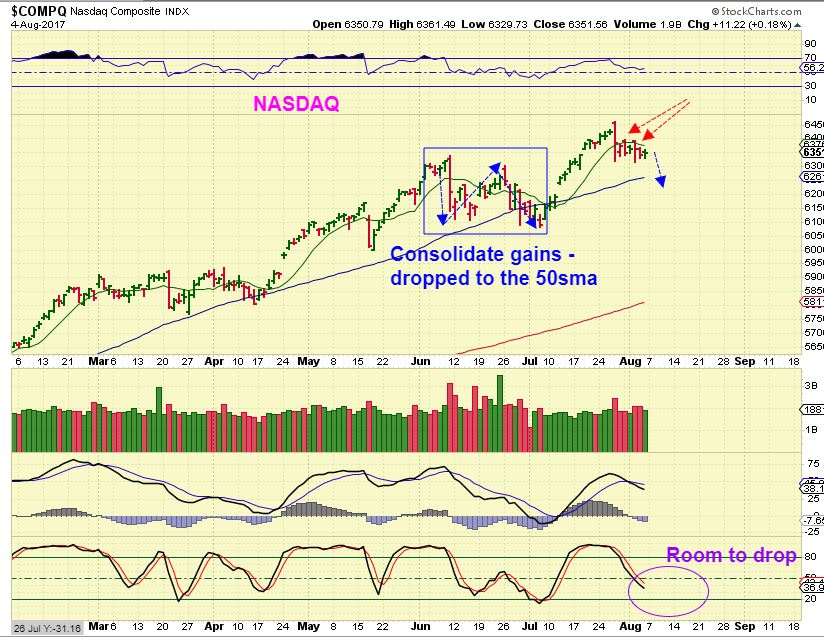
Let’s have a look at and discuss the SPX & NASDAQ too
Ever since the NASDAQ had that 1 day crash, it hasn’t been able to regain the 10sma, even while the DOW chugs higher. I think that the NASDAQ may dip to the 50sma. It even broke below it last time.
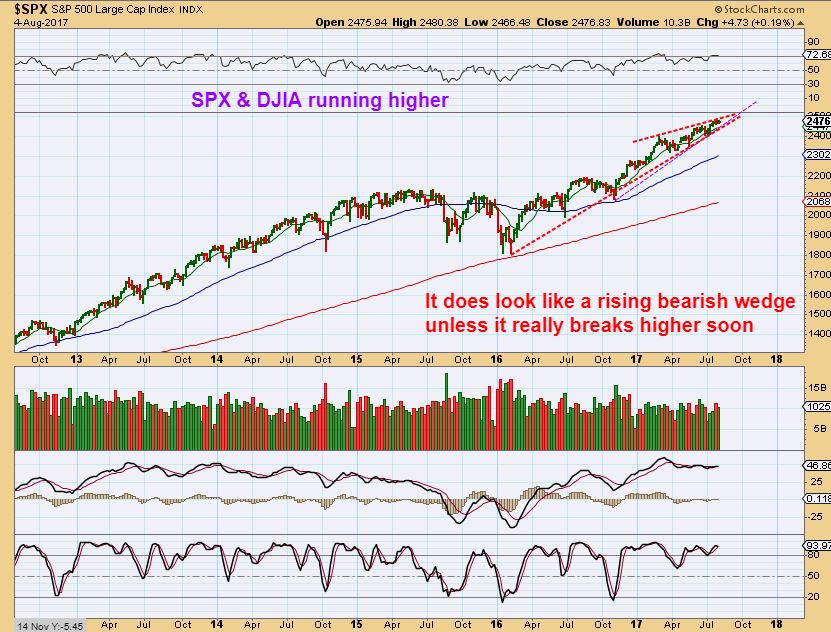
SPX WKLY – The SPX does have a little room to move higher on its daily chart too, but this looks like a bearish rising wedge and the MACD is flat lined, so I am wondering if all of the general markets are going into a resting period, while commodities run higher. Energy & Commodities are set up rather nicely.
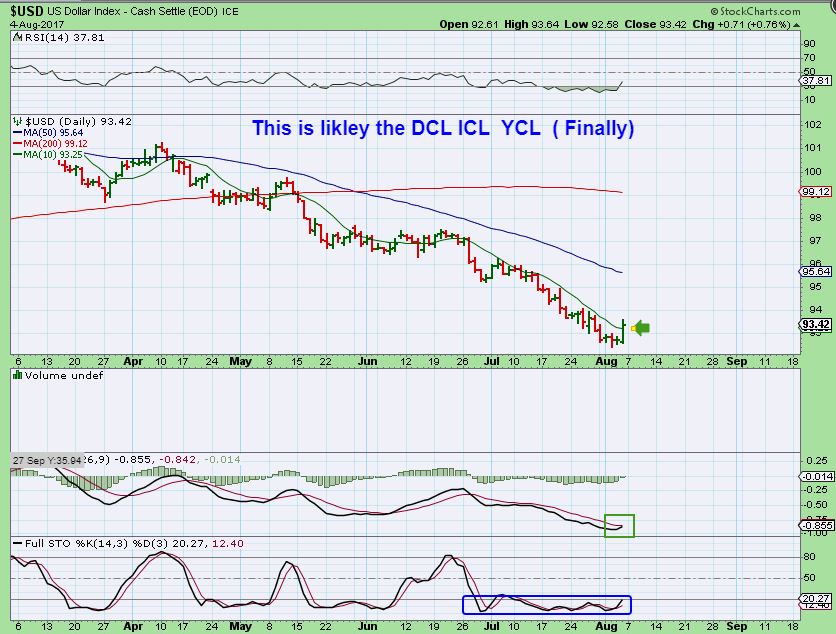
$USD – Strong reversal finally captures the 10sma, so this is an unconfirmed swing low. This looks like it could be THE LOW, and you’ll see why in a minute. What this means for Gold we will have to wait & see, but usually they have an inverse relationship. Recently it has been a bit off, but this is something that we would not want to completely dismiss.
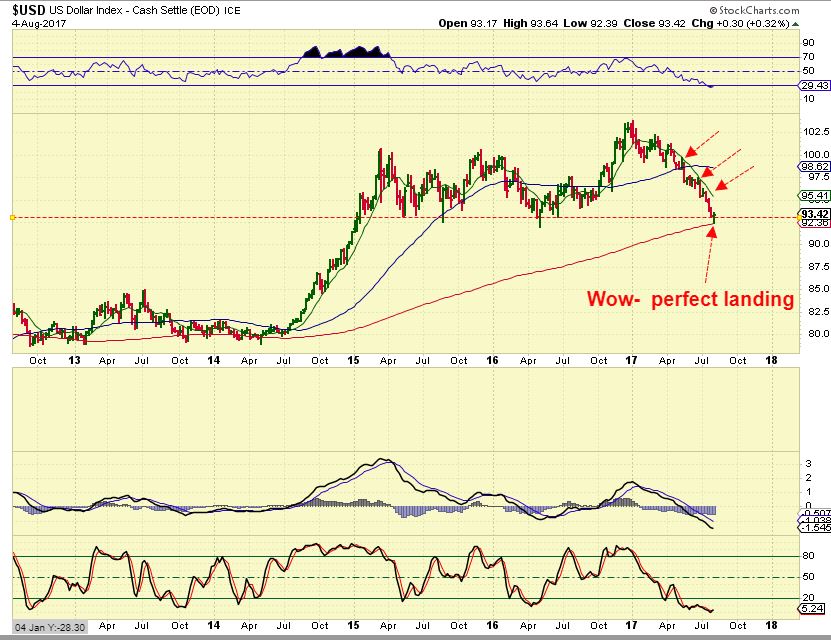
AND will you look at that! The USD WEEKLY REVERSAL was right on the 200ma. We have an unconfirmed swing low on the daily, but this is why I think that we might have the lows in place. It looks picture perfect so far.
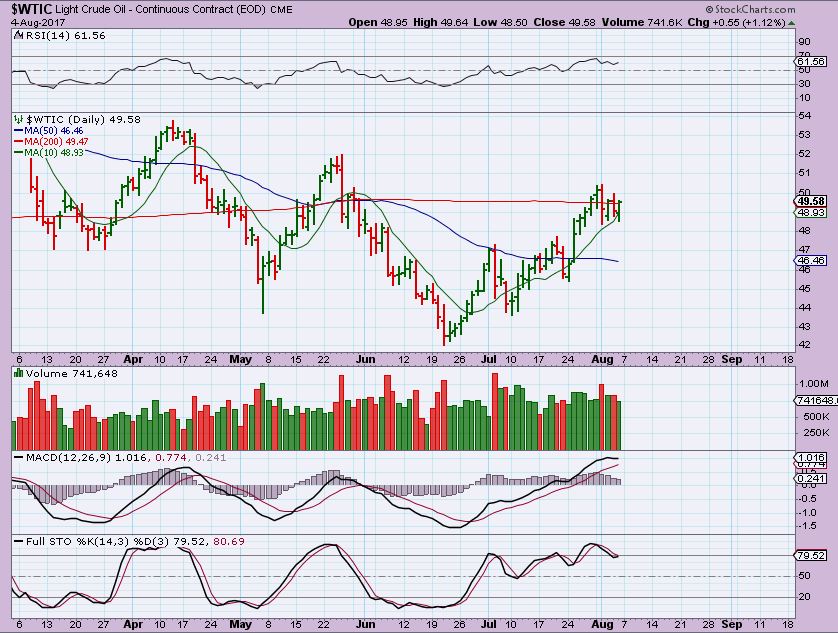
WTIC – Oil dropped to the 10ma and regained the 200sma. I traded Oil out of the lows, but was cautious due to the energy stocks lagging so much. I have now been viewing Oil as even more bullish because of the successful push higher of the XLE.
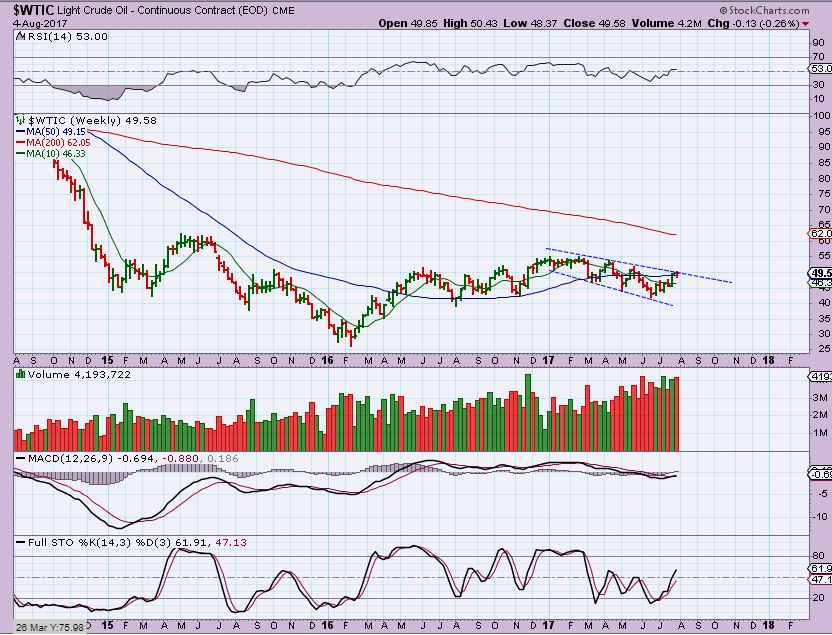
WTIC WKLY – Above the 10ma on a wkly basis ( Bullish) and now just pushing above the 50ma, this looks set up to break higher. I know that many people that are shorting Oil here, I would recommend that you give this time. This could break out.
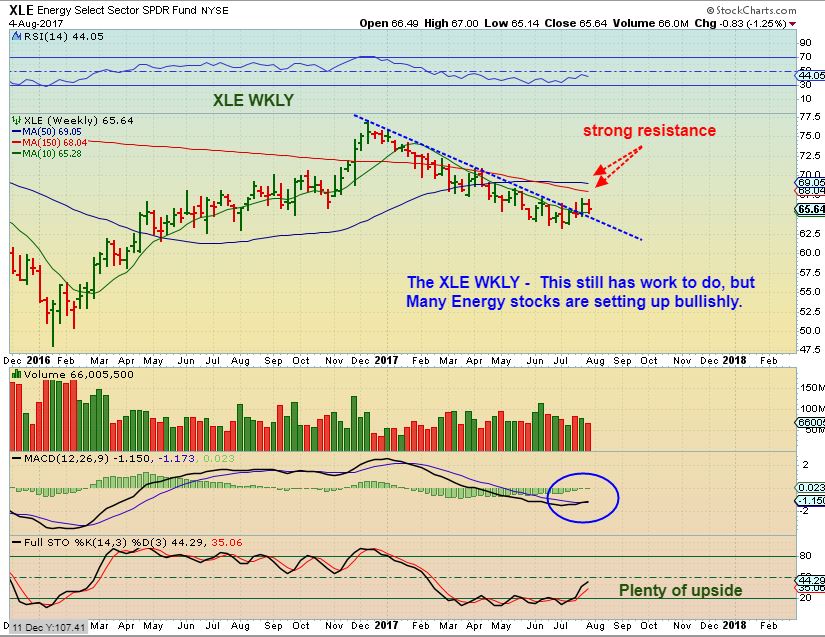
XLE WEEKLY – Read the chart. This is 70% bullish / 30 bearish in my opinion, Trading above that break out & the 10ma is overall bullish. I have basically avoided energy stocks ( & the pain) with the exception of solar & Uranium stocks since March. I am now warming up to quite a few, and they will be in future reports if this area remains stable.
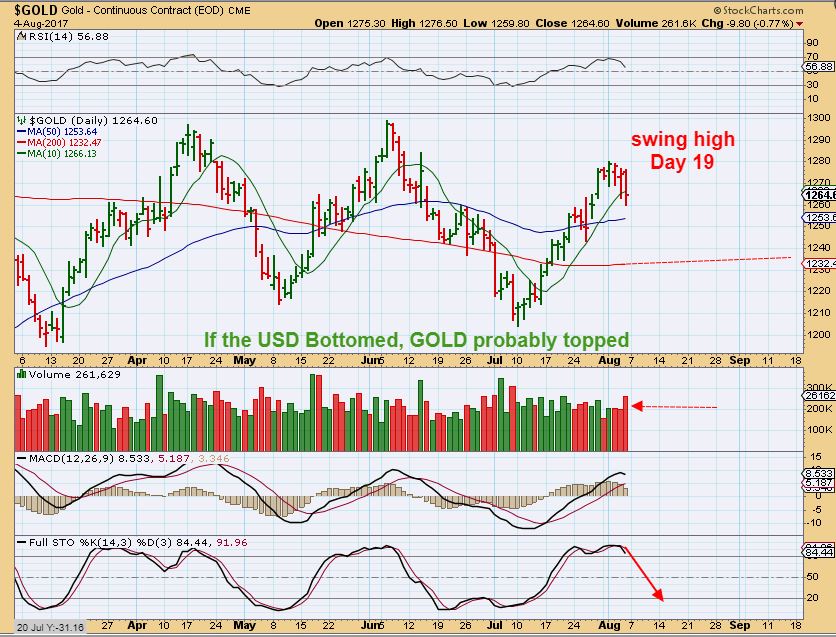
GOLD – The daily saw Gold put in a swing high, and it closed under the 10sma ( Right when the USD reversed). The COT had been rising into Tuesday, but may fall next week after This drop and any follow through into next Tuesday.
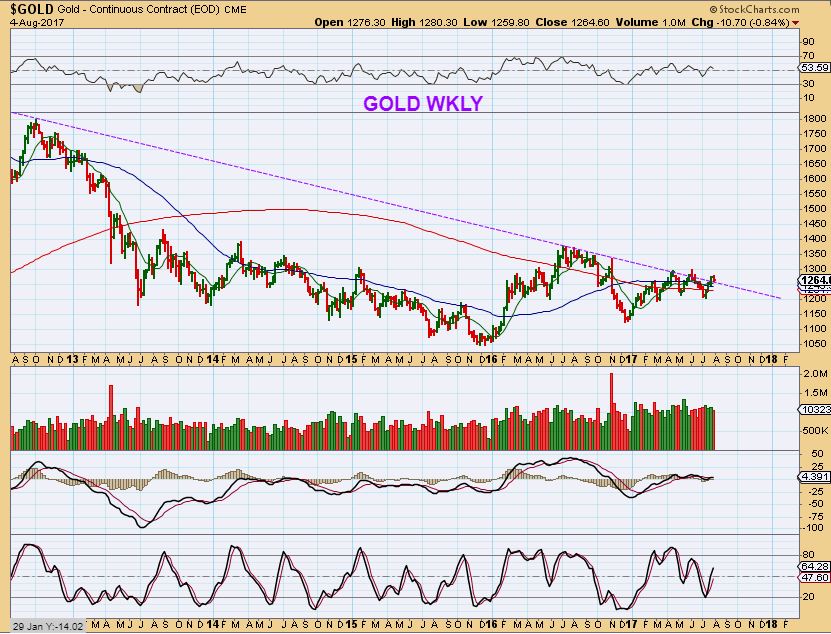
GOLD WKLY – The big break out? Not quite yet, but if we have an ICL, then next daily cycle should break free.
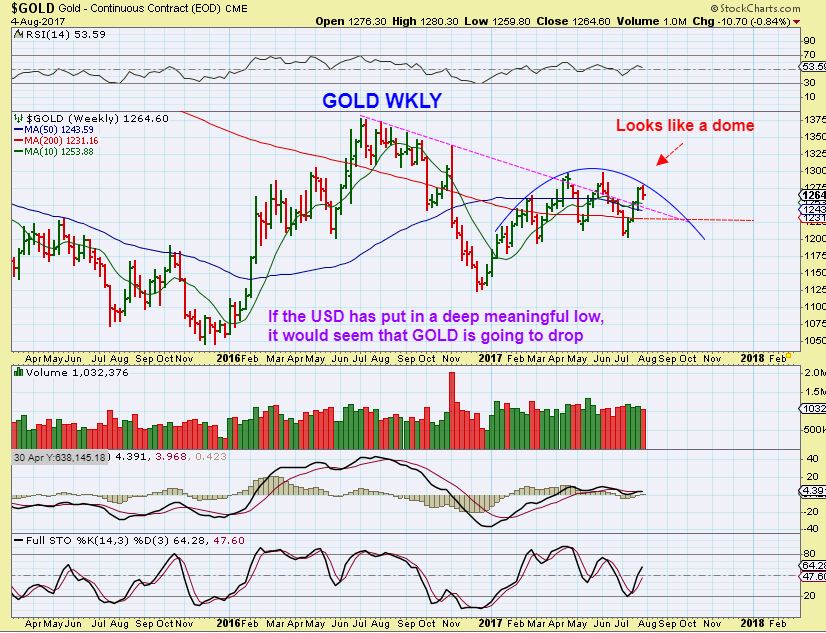
GOLD WKLY CLOSE UP – This looks like a bearish dome actually, but a break out during the next daily cycle would negate that. I am watching the support below for a dcl, and I did get stopped out of my leverage Friday, so I am only holding GSS, LODE, & GPL right now.
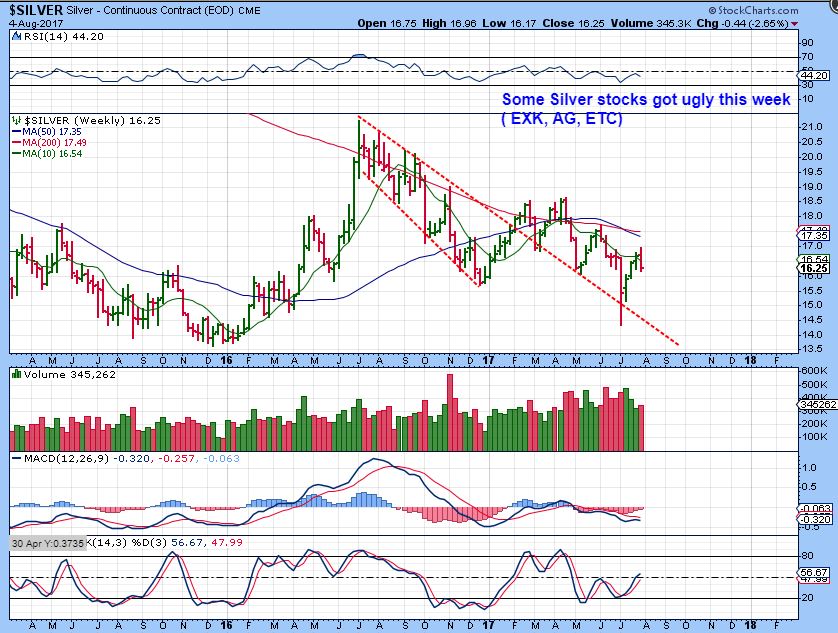
SILVER WKLY – Silver just looks ready to drop.
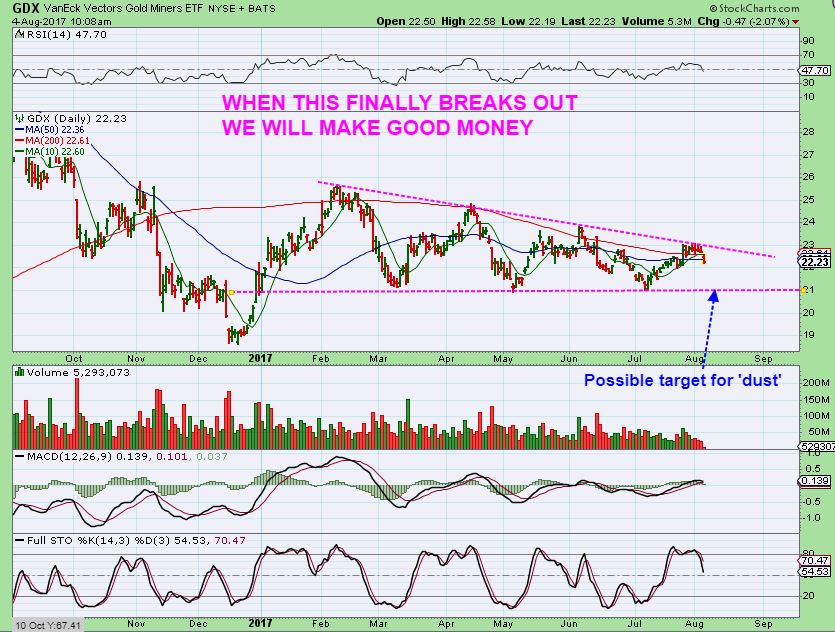
GDX – Miners turned down at this persistent resistance area and this long consolidation continues. I was certainly hoping for a break out and back test to be the next DCL, but it looks like GDX will seek out the next DCL inside of this triangle.
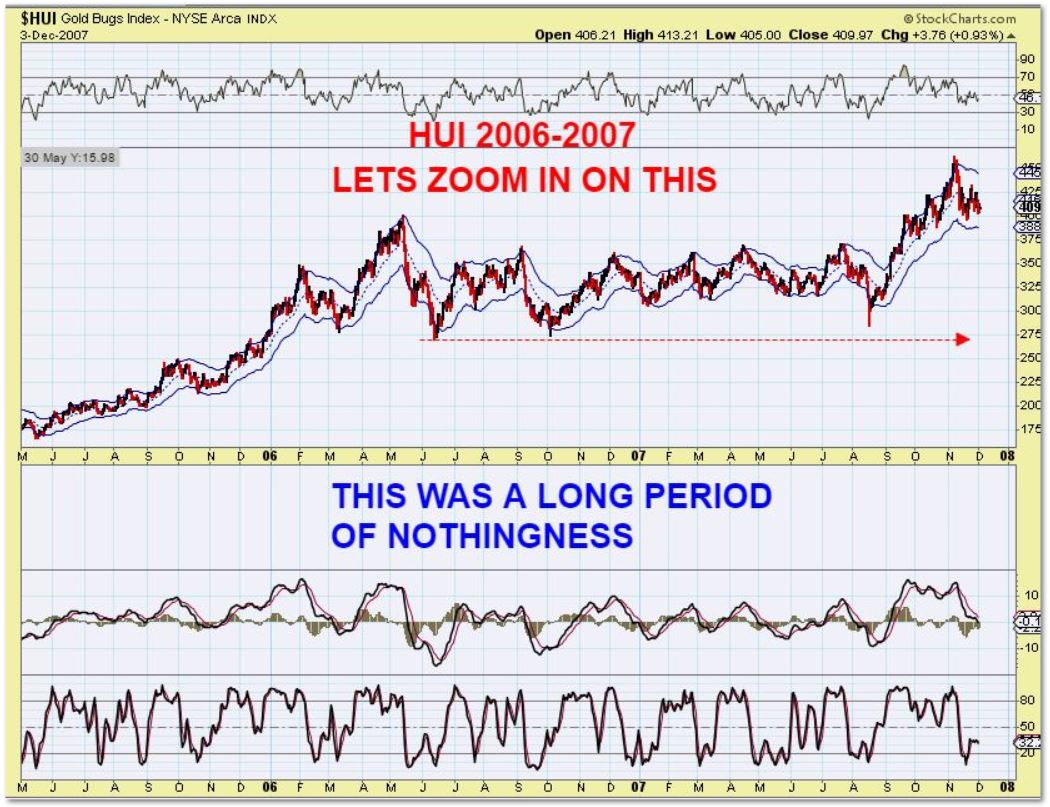
I put this LONG CONSOLIDATION in my other weekend report. Why? Because it too was a BULL MARKET, but this was absolutely frustrating. Well I am sure that the down turn on Miners Friday was a bummer for many too, knowing that this consolidation seems to be continuing. We cant control what the markets do, we can only trade the probabilities and look for the low risk entries while doing so. The TRIANGLE should not be as long as this HUI consolidation was, and we will be looking for the next dcl to form. THIS CONSOLIDATION WAS RATHER UNPREDICTABLE, you just had to take it daily cycle by daily cycle and it was disappointing for a while, but you can only take what the markets are giving, you can’t change it, right? SO we keep investigating as time moves forward
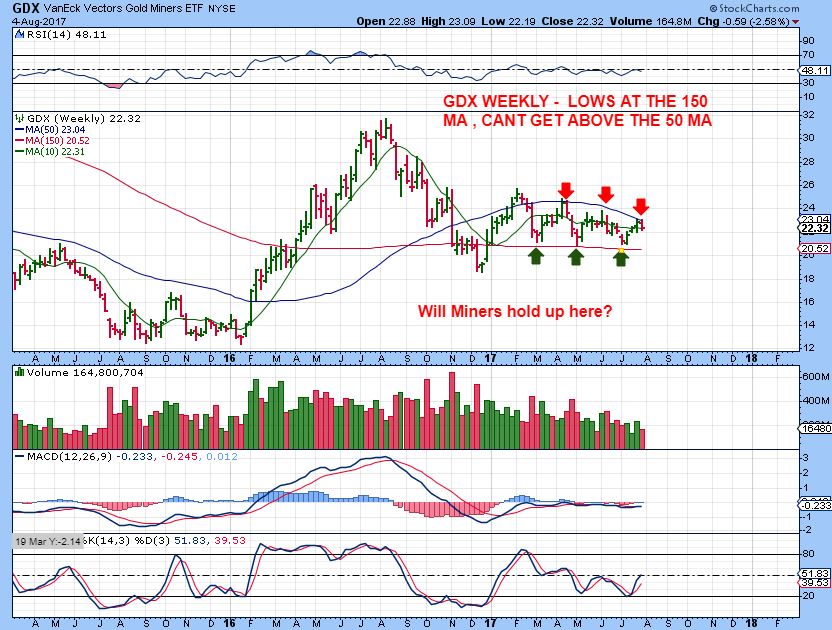
GDX WKLY – Support & resistance at this point. I would NOT expect GDX to break below $20.52
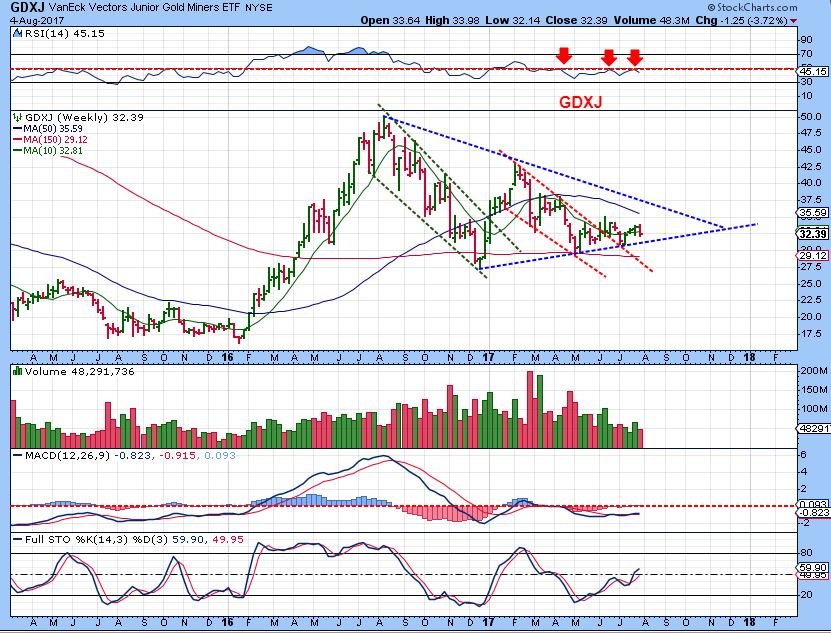
GDXJ WEEKLY – Just another way to show trends breaking and trends starting, and simply a sideways consolidation at this point.
So I Now need to decide if I want to sell my individual Miners or ride it out. I may sell just to raise cash and see how it plays out, but the ones that I own barley dropped Friday. Selling now is the safest way to play this obviously, and one can always get back in. SOME miners may hold up, like RGLD & IAG did on the last dip to a dcl, but like I said, we can always get back in if things remain stable.
I’m Closing this Weekend report here , and I want to say that I do still see good looking set ups that I like. While waiting to see how things play out in the precious metals, I have been trading commodities, Solars, fertilizer stock IPI, etc, so I am thinking that Monday morning I will have a much shorter part 2 to this weekend report. I can see 10 to 20 good looking stock picks, but Mondays report will only be to point out 1-5 of them. It will be released pre-market, but possibly a bit later than usual. Have a great weekend everybody! 🙂
~ALEX
EXAMPLE:
Some of our commodity stocks, though not always an easy ride, just keep acting correctly. I have mentioned that I think that this is one of the safer places to be, BUT BE AWARE OF EARNINGS. The Monday report may contain a couple more commodity plays. Most have done well, with the exception of AKS after earnings.
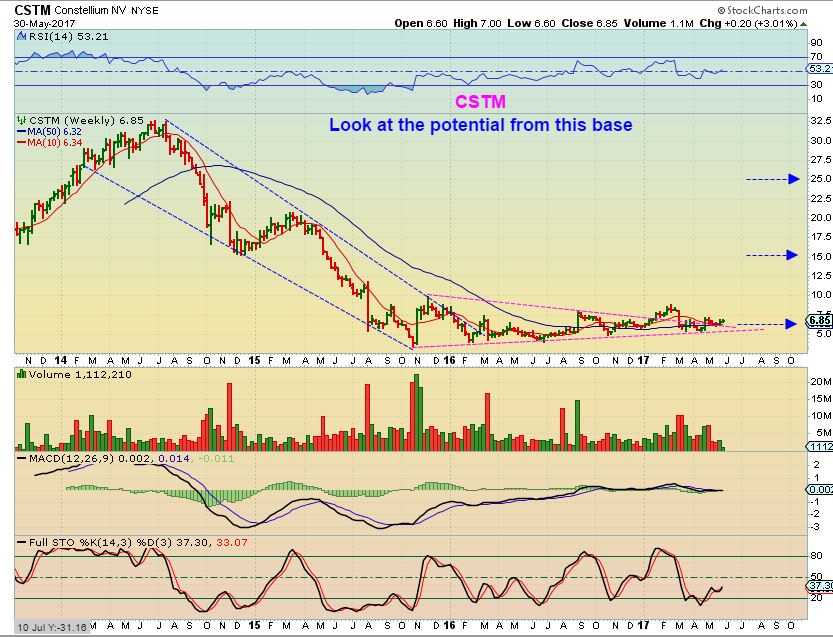
CSTM MAY 30 – This was a steel stock in Fridays report and also one that I traded in last spring. This chart pointed out a large base with good potential back to $32.
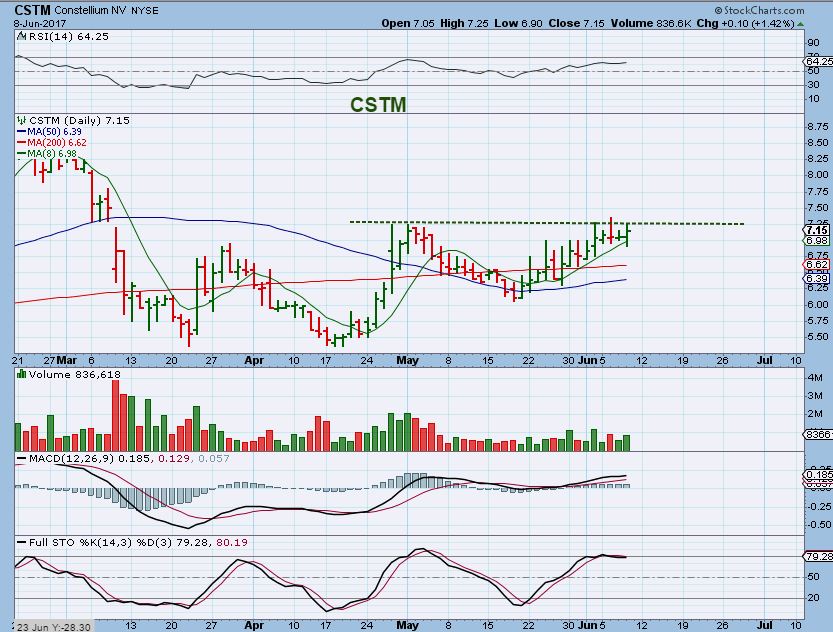
June 8th- Buying at the 50sma and again before this break out
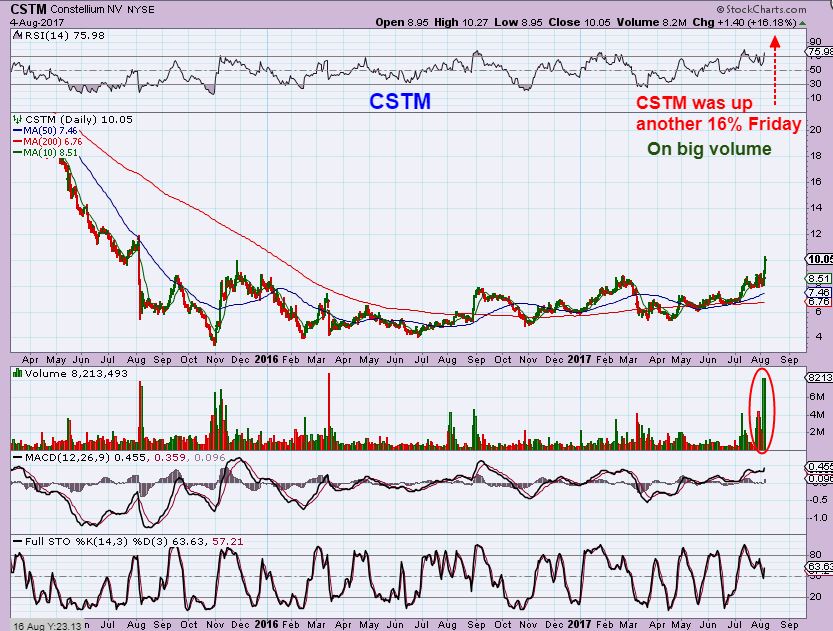
CSTM AUG 4th– Ran up another 16% after mentioning it in Fridays report. Above $10 – it is almost a double from $5.50 this May, this is now also a big break from a long base. Eventually it could even double from here and head bak to that $32 area ( a triple from here). Time will tell, but some commodities look to be trending higher.
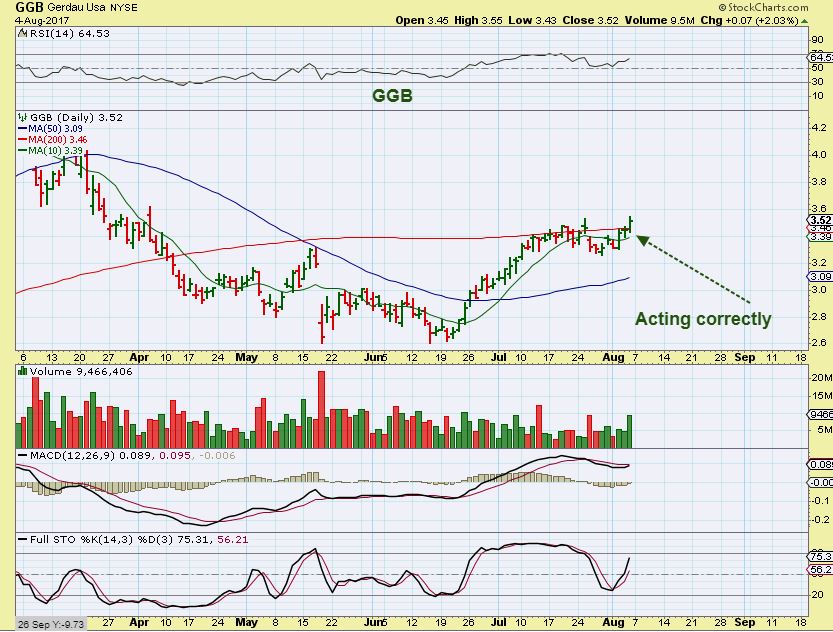
EXAMPLE #2 – ACTING CORRECTLY
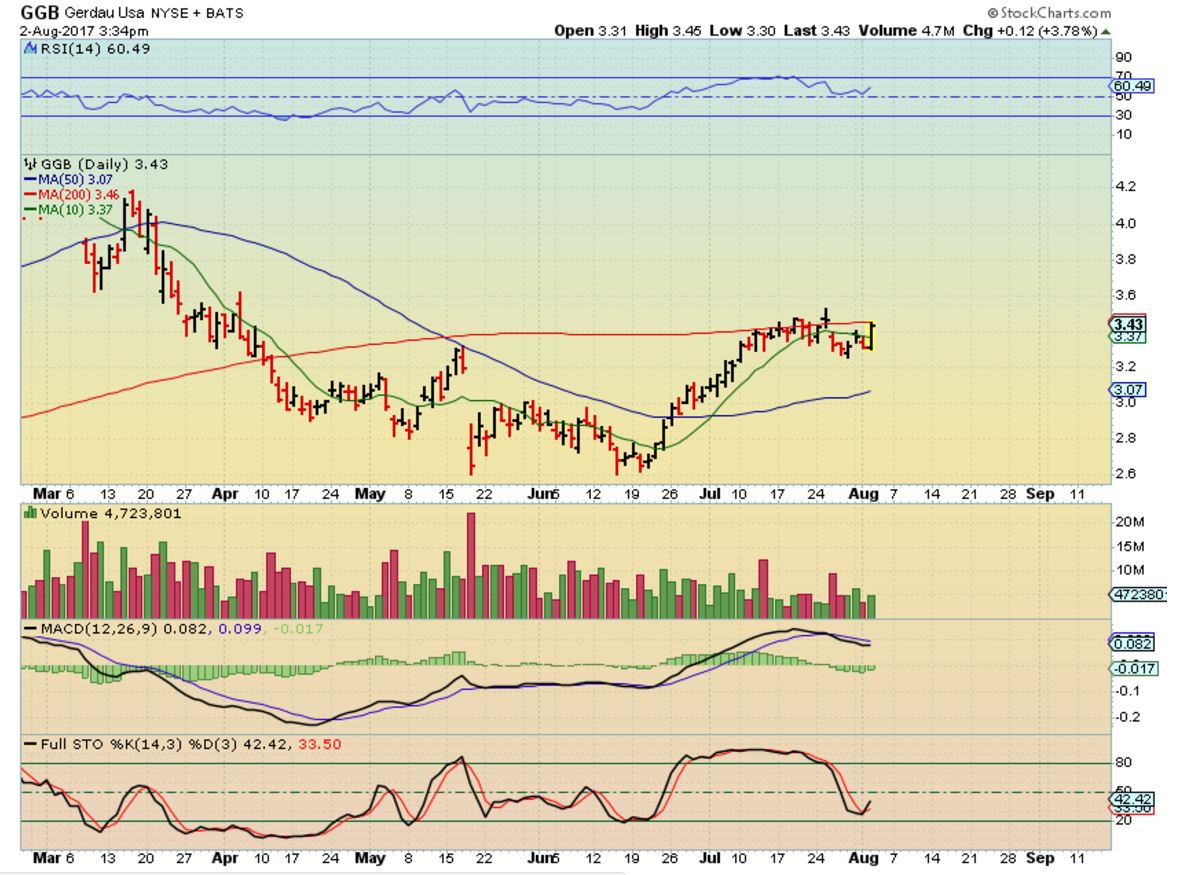
GGB AUGUST 2 – A buy or wait for the break out
GGB FRIDAY AUG 4th – This is still a buy if you ask me, but I can’t find their earnings date, so I’d put a stop at the 200sma & hope that it doesn’t gap down. EDIT: Crystal says earnings Aug 9th- thx
Friday August 4th 
 AUG 7th WEEKEND REPORT 2
Scroll to top
Hi all, back from vacation. Cuba and Spain was splendid.
Some volatility in the precious metals complex while I have been away I see.
Regarding AG:
I took (luckily) profits in this before the big collapse when I saw it faced some difficulties in getting above 8.
There are some support here at current level of 6-6.2, but the greater support is found at 4.7-ish. It start now to have the more look of a proper C-wave.
https://uploads.disquscdn.com/images/ad337fdffc3265d2f71647dd1a7fed5ec3b97085e5b009ca40190a7f3e3c4356.png
Regarding gold:
It is at a descision point now, right between the two channels.
I have it in my view that there will be an intersection break of 1260 occuring Tuesday or Wednesday in the bullish scenario.
What I would like to see is a retrace to no more than 38.2-ish at 1245-1247 level before next leg up.
https://uploads.disquscdn.com/images/6916deb03bfb444957f1dd9af5abdec8964302848a080717a5259fc6b65bd2f0.png
Ideal path I would like to see in the coming days. https://uploads.disquscdn.com/images/c5fe85f6b04c0b4118d55a961d0ac6503dcde8e6815a0ce7738cba05ccd969a1.png
And in a bit extended period:
https://uploads.disquscdn.com/images/9c743f145f7cd68c4d2be75892c935920f20a3e7e81dbc29f1041e7631612717.png
https://uploads.disquscdn.com/images/1110290b77ecd34adbe96dab6a411e1063077f7c234ce337cae28d475b3e8a51.png
GDX has had 365 days of decline this Friday.
If we are to have trend-change in metals it fits my pic of Tue/Wed this week.
https://uploads.disquscdn.com/images/08261c01bece5f58f50d4124a6f2625acc6a987c25044839f184062154c5d701.png
ooooh lah lah …
Thanks for sharing!
As we can see, we are now exactly 10 years in time from where price ended consolidation phase and started trending advancing phase. Someone famous said to look back 10 years for guidance in price.
crazy….
greetings viking.. 😉
sooo … you I’m thinking we have 1,2,3 .. need 4 and 5… whichhhh … kinda looks like yours…
I’ll take that ….
I think I see it as more or less a “flag consolidation” wave 2. Let’s hope this is start of a larger wave 3 move in gold; that wave 2 was a consolidated one. But then again, I am not by any means an elliott-wave expert 🙂
well .. the way AG face planted ….. kinda added a point to the ‘this is just an ABC in a bear market’ hypothesis ….
https://uploads.disquscdn.com/images/7d01f3f64f7ac34088c68cb0d0dc11a93fa3cdbb2df539da16b069f305f06620.png
Do you need to see the dollar cycle too to get more convinced? 🙂
Yeah.. and there’s that too…. ;). Funny that EW it’s perfect cross off both…one is ABC and the other is 123…. Dunnn Dunn Dunn..stay tuned..same bat channel…Sam bat time….
Thanks for sharing the charts! I am feeling same direction as well.
Only the manipulators know for sure . . . . .
Welcome back and thanks for the nice charts again.
GURE still holding up well. https://www.screencast.com/t/v73iRuPDeiU
Alex, great report as always.
My charts are suggesting some pretty interesting targets in the near future in the event that the next daily gold cycle fails. Do you have any thoughts on these possible targets:
Thanks in advance!
(And sorry for the links instead of the charts, but I am posting from my iPad instead of my computer).
GDX weekly:
http://stockcharts.com/h-sc/ui?s=GDX&p=W&yr=3&mn=6&dy=0&id=p73197703551&a=461661368
GDX daily:
http://stockcharts.com/h-sc/ui?s=GDX&p=D&yr=0&mn=9&dy=0&id=p35827845924&a=363051472
GDXJ Weekly:
http://stockcharts.com/h-sc/ui?s=GDXJ&p=W&yr=3&mn=3&dy=0&id=p67621837895&a=410247662
GDXJ Daily:
http://stockcharts.com/h-sc/ui?s=GDXJ&p=D&yr=0&mn=10&dy=0&id=p82364519349&a=366110084
We are also coming up on the two most intense weeks known for major hurricanes which are the last two weeks of Aug. While I hate the idea of benefiting from disaster, and pray that homes and lives are out of harm’s way…. when hurricanes hit — this season is supposed to be more active https://www.google.com/amp/s/weather.com/amp/storms/hurricane/news/2017-hurricane-season-forecast-atlantic-colorado-state-august-update.html
I know HD and LOW are considered as hurricane trades — but don’t commodities generally go up as well?
NXE is running
EDXC what a roller coaster
Good call on BITA Alex!
AKS double bottom. X and STLD breakout , retest, and moving higher. Steel sector looking up. Maybe a good entry point, stops tight.
Well, CHK….the low in June and July was $4.41/4.38…waiting to see if it breaks below those numbers….if so I might have to sell…..although maybe that is when I should buy more…?
There was a new report released