In some areas of trading, we see stock picks and stock trades stretching out nicely, and in other areas we see ‘cycles’ also continuing to stretch out, so lets examine both today.
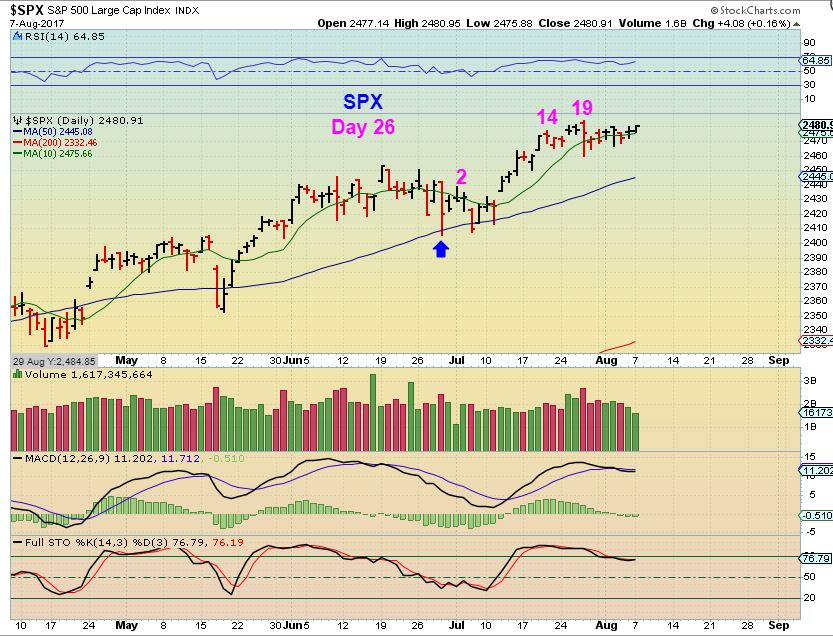
SPX – I do not think that day 19 was the peak and the daily cycle low of the daily cycle, so that would mean that we are on Day 26. This could pop and run a bit higher, but it is probably going to drop to the 50sma area for the next dcl.
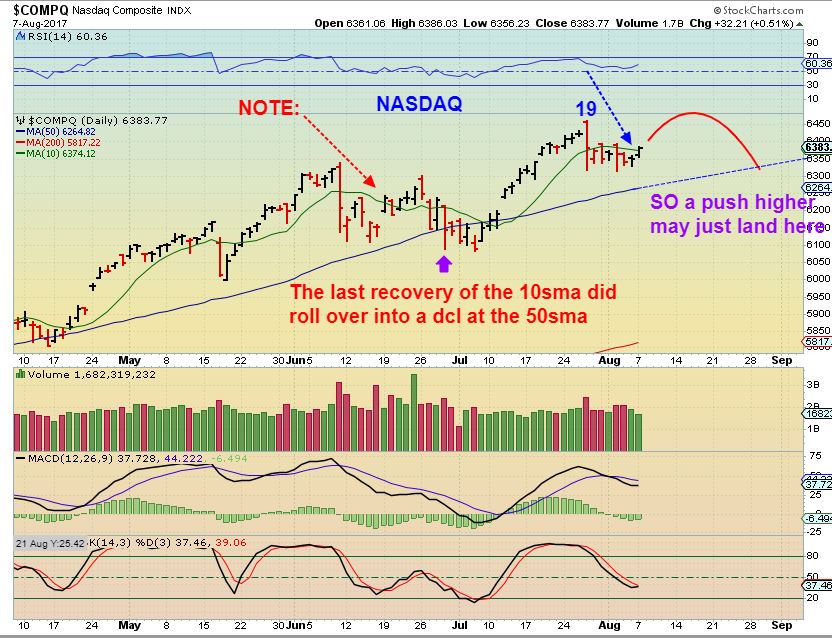
NASDAQ – The NASDAQ got above the 10sma, and that it bullish, however I would imagine that it is only good for a short term trade.

And this is the reason why…
NASDAQ – Notice that in June, after that 1 day slam, the NASDAQ went sideways, regained the 10sma, and then dropped to the 50sma. At this stage of the daily cycle, I would not expect this to just run higher from here.
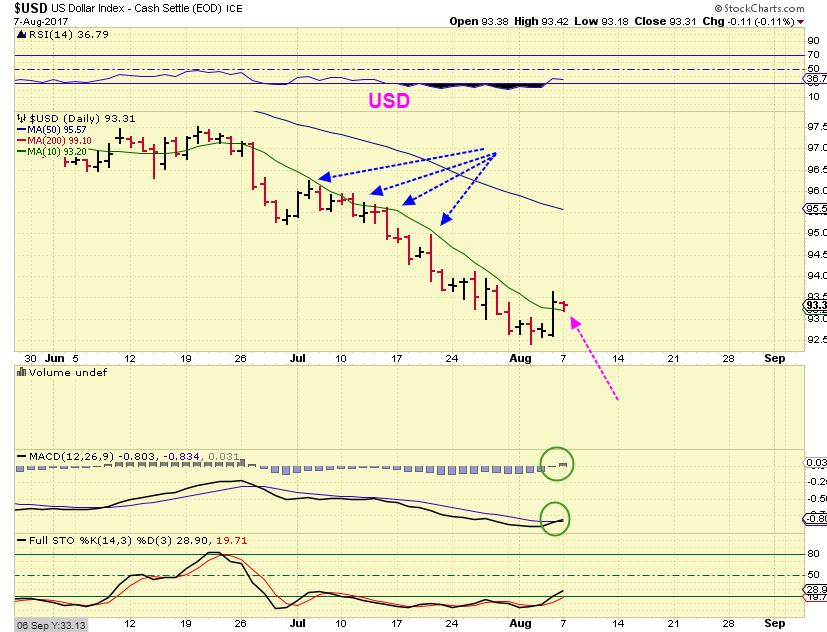
USD – The USD broke out and did a little stall / bounce off of the 10sma.
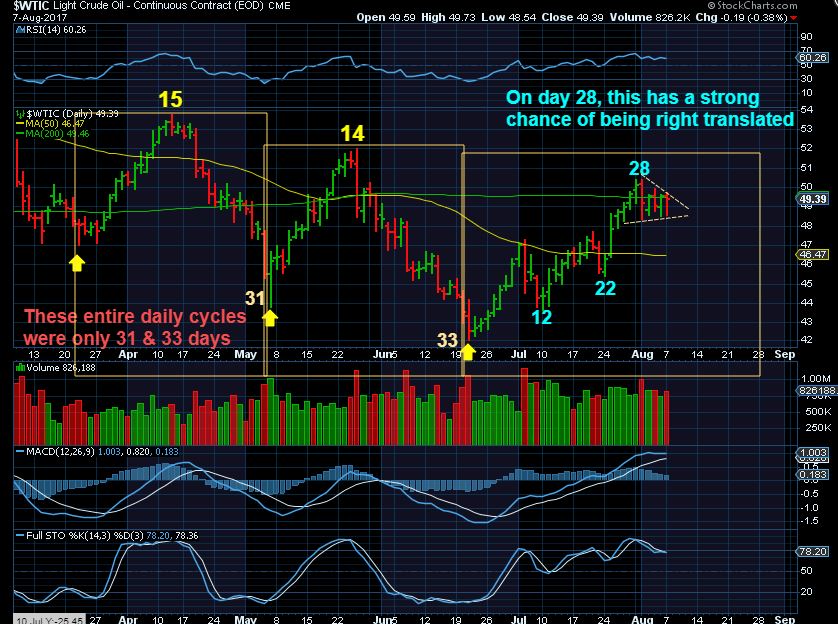
WTIC – The C.O.T. number of smart money shorts was getting higher as of last Tuesday, and Oil has begun to flag out under resistances. A drop to the 50sma could happen…
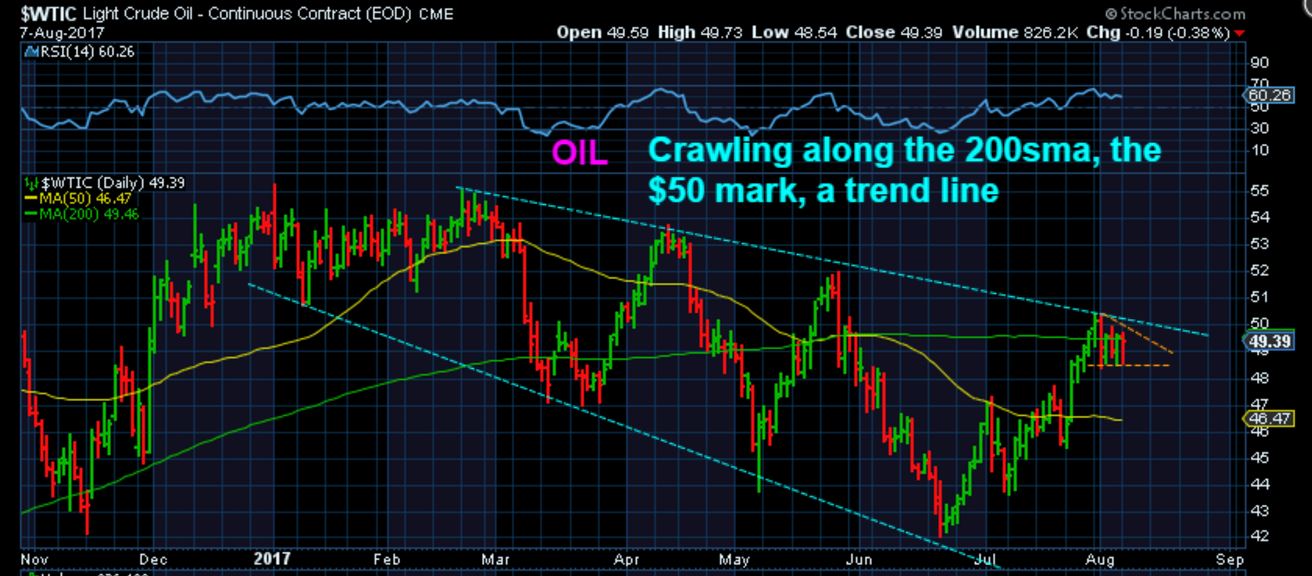
WTIC – Notice that the prior runs peaked around day 15 & 14 and were left translated with the entire daily cycle running around 33 days. We are almost on day 33 and the peak is on day 28, so this has a good chance of being r.t. ( And we expected this to be the ICL). A drop to the 50sma is not out of the question as Oil struggles at the 200sma.
XLE – I noticed that the XLE slightly lost the 50sma again, but with Oils count as shown above, I started to think that even a rop here should make a higher low…
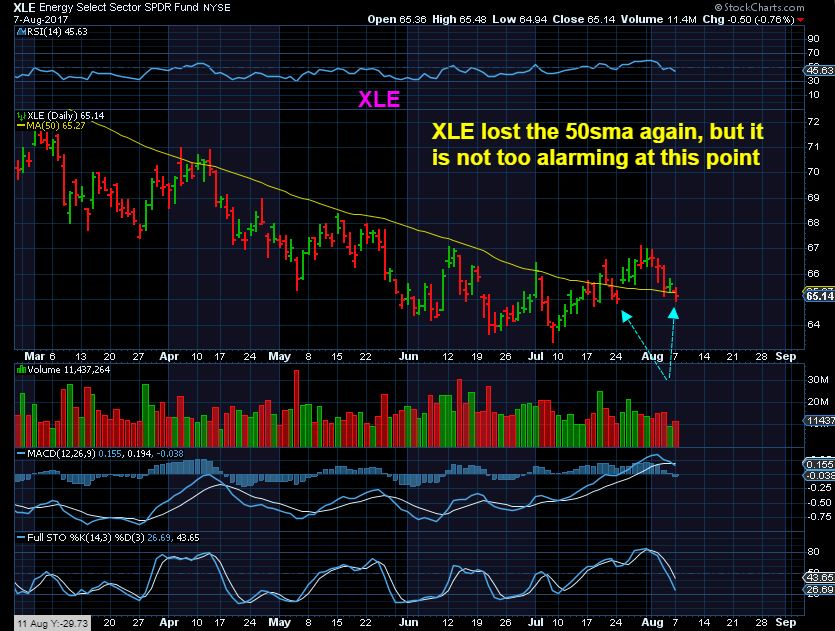
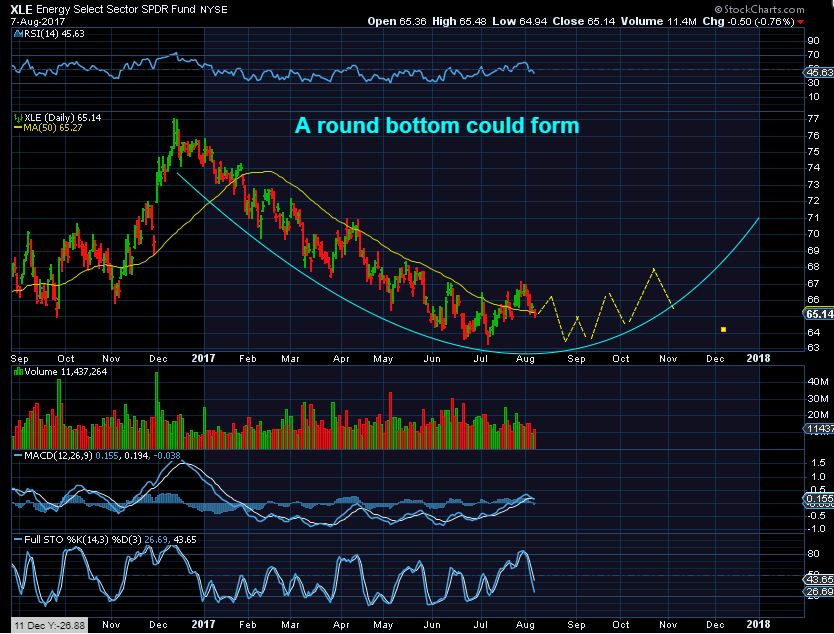
XLE- SO I would have to imagine that a higher low if Oil did sell down to the 50sma could still give us a round bottom. The reason for this may simply be that some Oil / Energy stocks are doing well after earnings, others are not ( see PACD, GST).
That said, I will remain fairly cautious in the Energy sector, but some nice trades have developed in individual stocks.
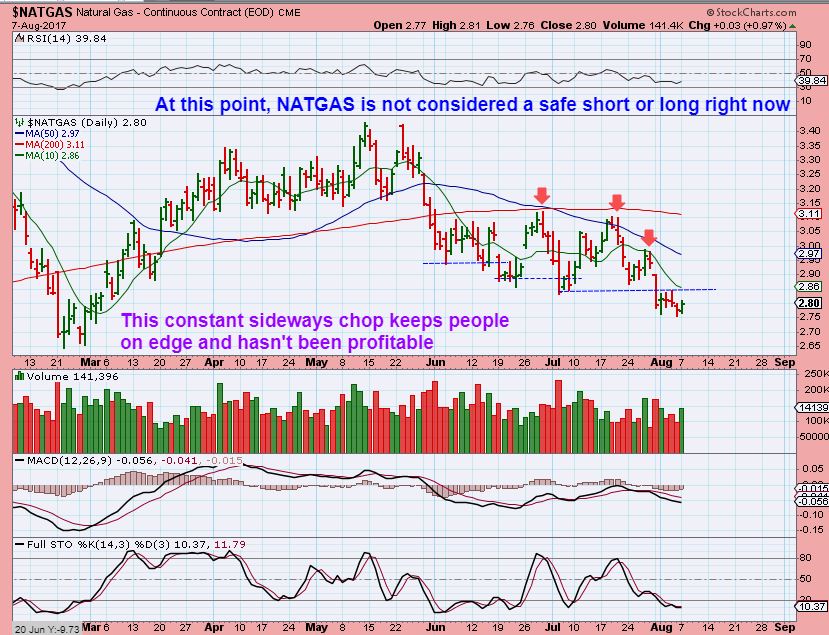
NATGAS – I do not see a good trade in Natgas. Read the chart please.
GOLD & MINERS
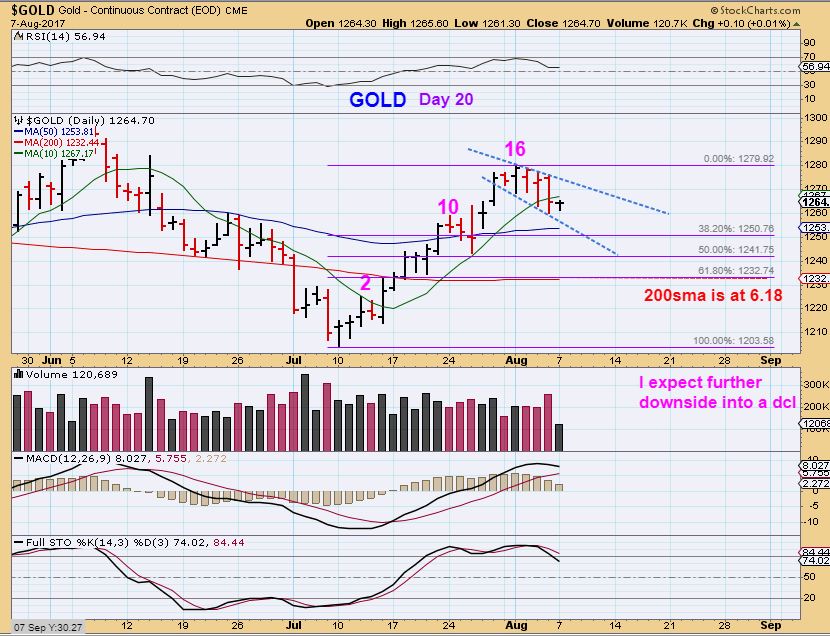
GOLD – Gold dropped below the 10sma, but it really didn’t break the trend line yet. It is only day 20 and Gold could have peaked on day 16 here.
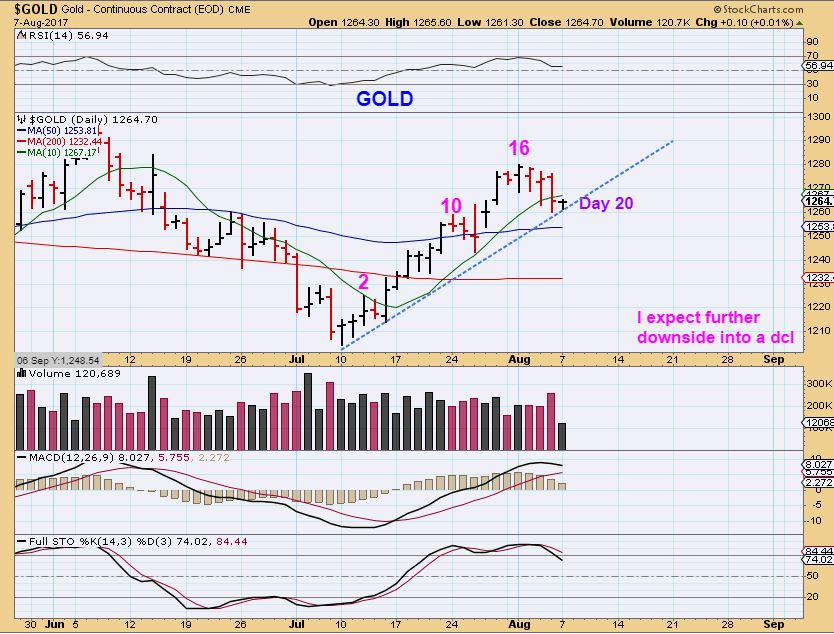
GOLD – I am expecting Gold to hold up and put in a DCL soon, but it is difficult to imagine how it will hold up if the USD just put in an ICL.
EDIT: As I proof read this report, Gold has Popped almost $7.00. I cannot chase this only to have it roll over on me, because I do not see this as a dcl in Gold and the USD also seems to have bottomed, so I am being patient. We didn’t even have a trend line break, so I will continue to hold the Miners that I have for now and watch how this plays out.
1. Gold could Pop today and roll over quickly, since we are on day 21.
2. Gold could pop & run for a couple of days and put in a peak on day 24 or so, and then drop into a dcl. Either way, I do not expect this to run away with the USD bottoming.
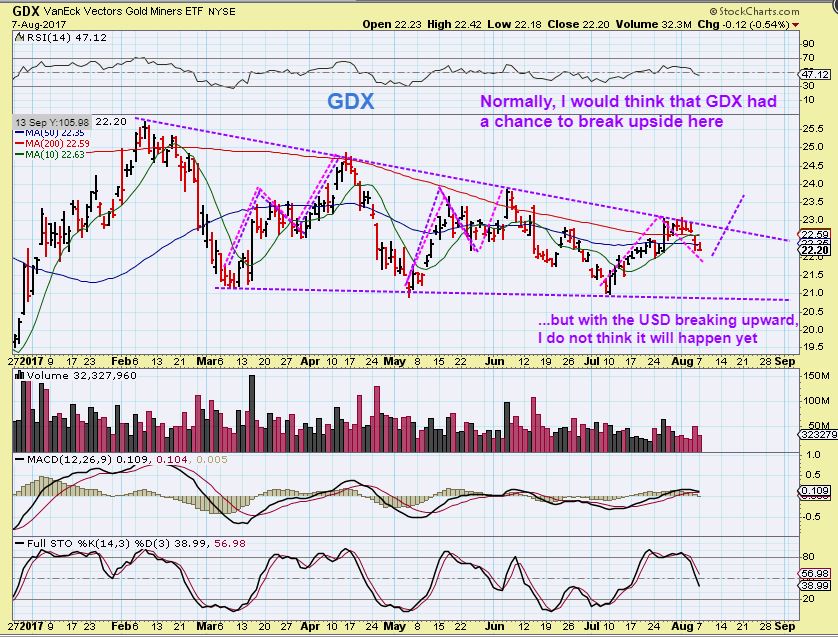
GDX – Please read this chart that I drew up last night. Time will tell.
SO this report was written on Monday night, and as I was proof reading, Gold Popped straight up $7. I do not jump into Gold in an emotional manner when it pops late in a daily cycle, but for traders, some Miners may be bullishly set up for a quick trade. That is up to you to decide. I will need to monitor this sector as the day goes on. Gold may have peaked on day 16, making it likely right translated, or it may pop, run and peak on day 23-25 and then roll over, but I do not see that any daily cycle low is in place here. I will be looking to buy the next dcl.
If Miners break out from that Triangle? That would be very bullish longer term, and triangles do mess up cycle counts, as I have said in the past. It would probably break out & back test, and we would discuss buying a back test, but for now we simply have a Pop in Gold premarket, and that may do absolutely nothing. Time will tell, enjoy your Tuesday trading.
~ALEX
TRADER TALK
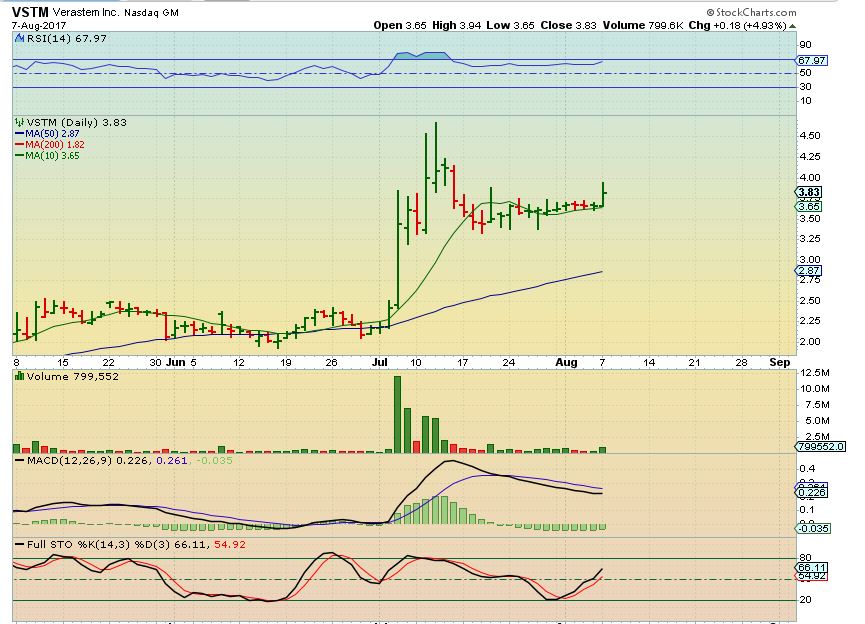
VSTM – I pointed out this tight pattern, and they can really break out bullishly. The problem was that VSTM is due to release earnings later this week and it is biotech, so I did not want to take a position, I wanted this on our watch list. Biotechs can get SLAMMED if something goes wrong, so again, I wanted this to go on the watch list until earnings….and then…
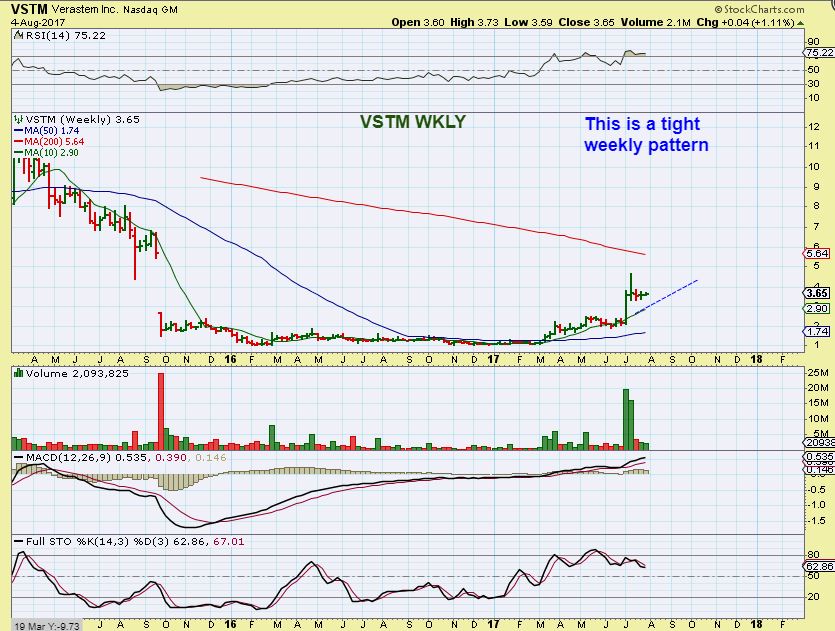
VSTM started moving higher on Monday . I am tempted to take a partial position until earnings and take my chances starting slow and adding if all is well, but I have been burned before, so patience may be the best trade here.
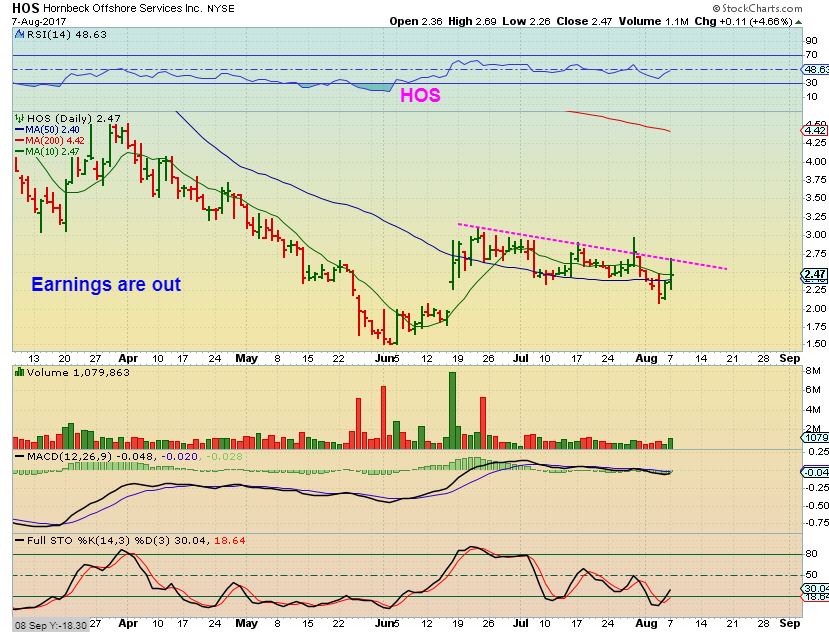
HOS – An Energy stock that looks ready to break out & earnings were released last week. Put it on your watch list & buy a break out or buy with a stop at recent lows.
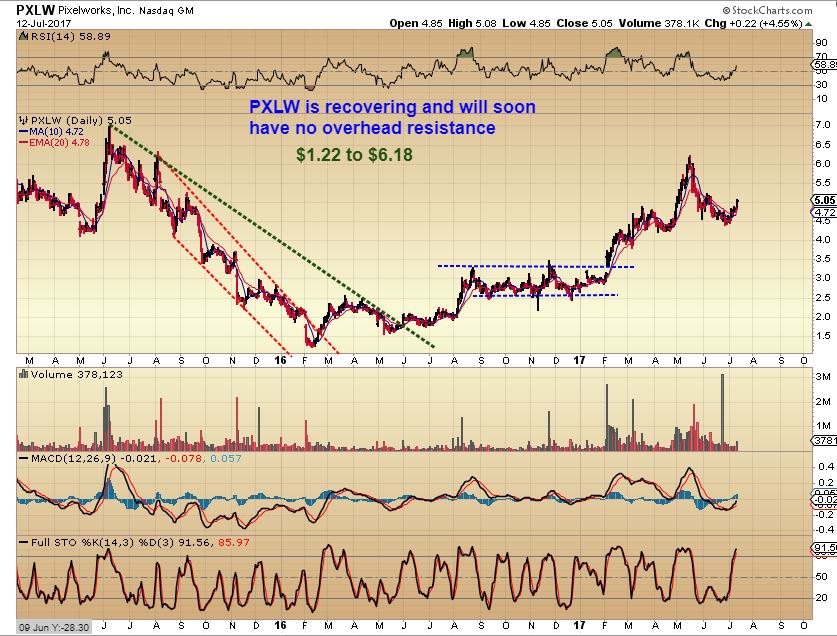
PXLW – I liked PXLW as a recovering tech stock in June & July & posted charts like this one. When the NASDAQ got slammed, I didn’t really want to own Tech stocks, and PXLW also looked like it could be forming an H&S pattern….
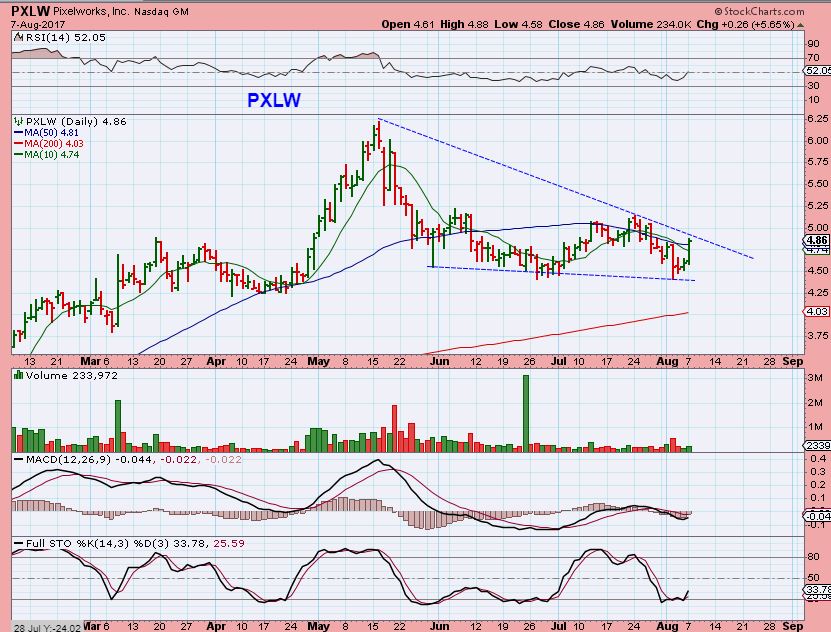
PXLW – It sold off with the NASDAQ & formed what did look like this H&S. As of Monday, it looks to be negating that H&S, and closed above the 50sma, so I am watching the trend line. This is back on my watchlist and I would buy it if it closed above $5.00.
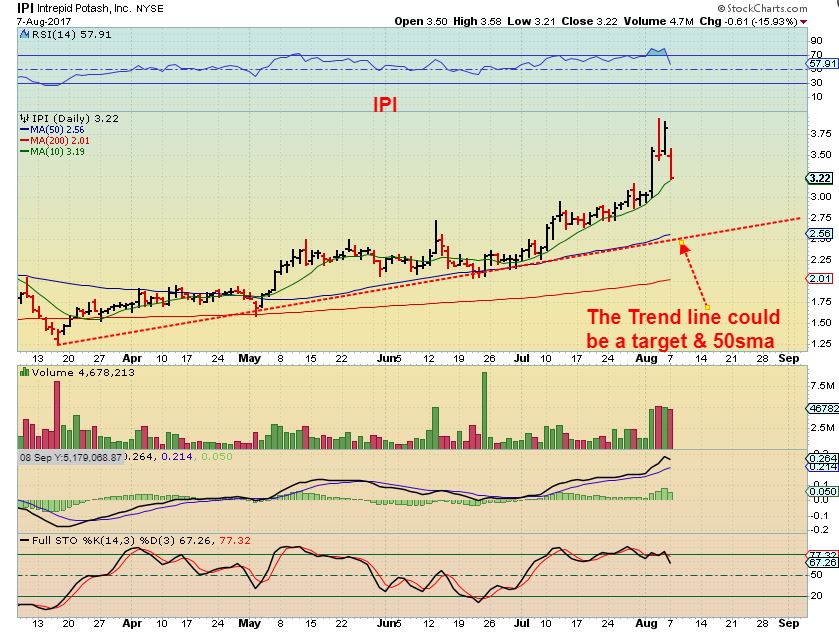
WHAT IS IPI LIKELY DOING?
IPI – IPI dropped to the 10sma on Monday, and sometimes that acts as support. It could form a big bull flag here, but IPI is still extended , so it could also continue lower. How deep? I would say that it could drop as deep as the 50sma (and an uptrend line). Picture an a-b-c down. I still own 1/2 of my position purchased in June and would consider adding or selling a break of the 10sma and re-entering down there.
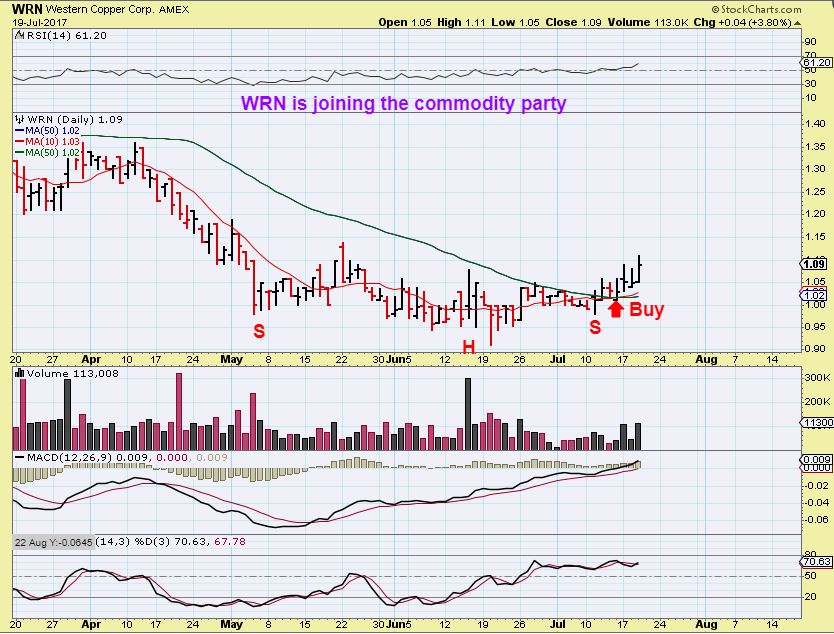
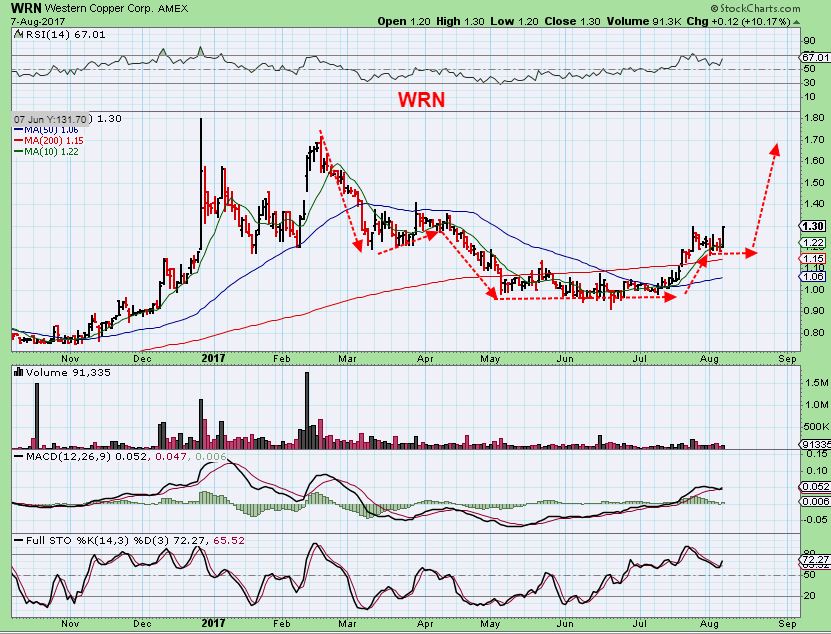
THE WRN TRADE
Do you remember this JULY 19th BUY? – Please notice this small inverse H&S BUY , it is important later 🙂
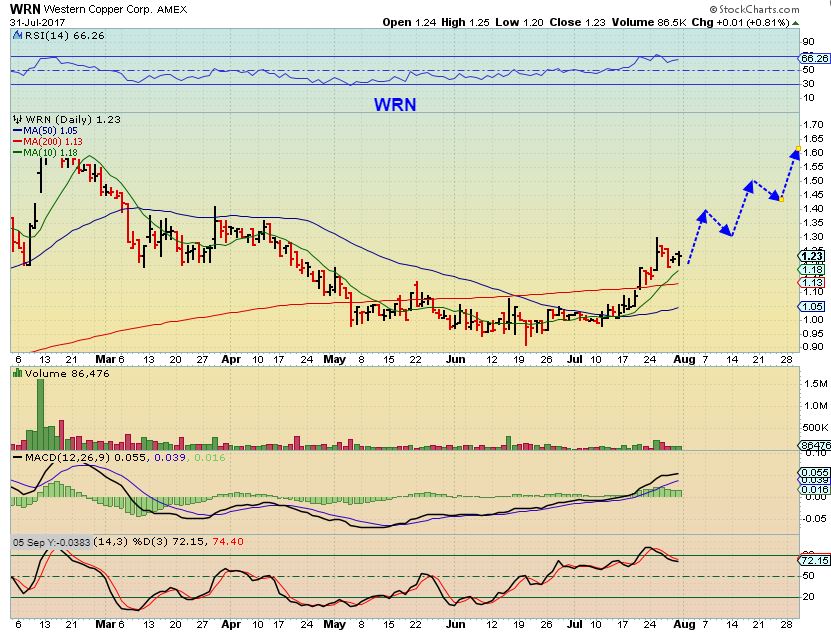
July 31 – Bull flag? On July 31, I drew this possible Stairway to heaven, because commodities are looking bullish.
AUG 2 – As of last week, this consolidation was still showing it to be acting correctly
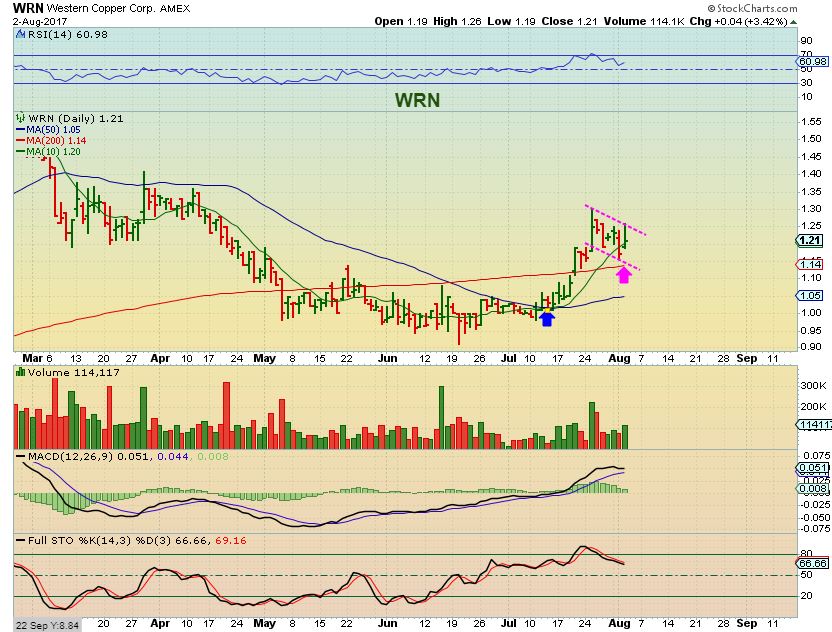
WRN RIGHT NOW– Look, a bigger inverse H&S. It was a good place to add near $1.20, but if this is running to $1.80 or so over time, and entry anywhere in here would be fine with me. 🙂
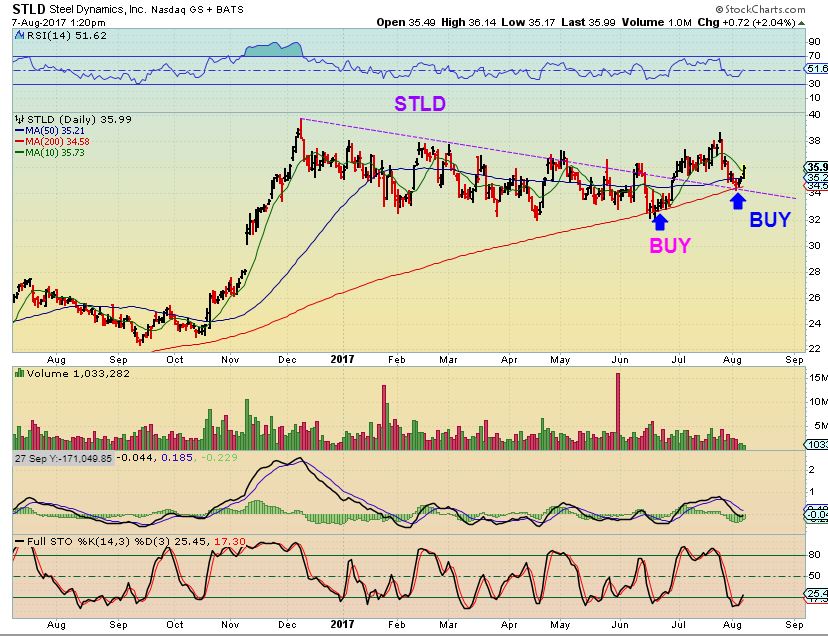
Steel stocks are doing well, and I have been asked by more than one subscriber, ” I didnt buy your SID call Monday, is it too late?” If you are wondering the same thing, I will discuss SID after these 2 steel stock set ups.
STLD – We have a break out & a back test of the 200sma and the 50sma. This is a buy with a a stop under that 200sma (red line).
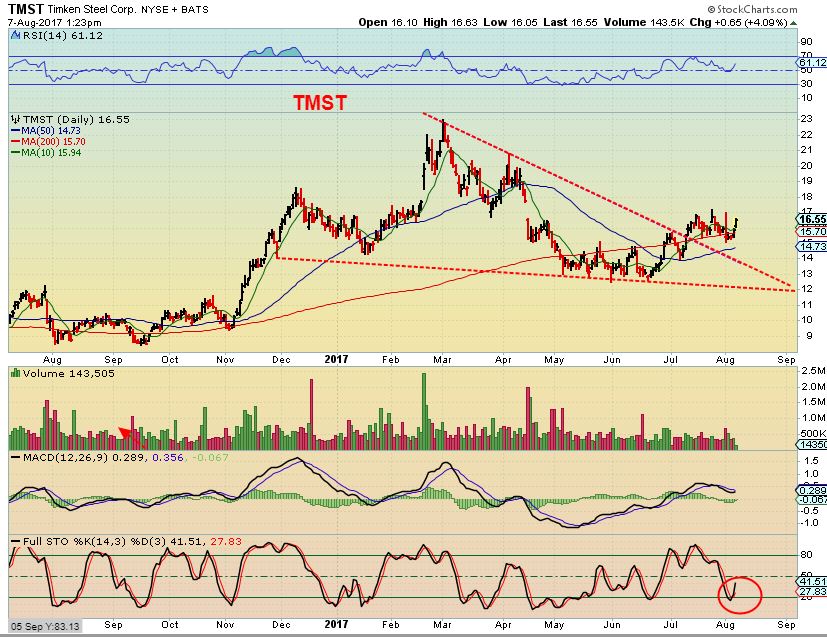
TMST – TMST broke above the 200sma and has been riding it for a while now. Both the 50 & 200sma are sloping upward, and this is bullish in the bigger picture too. TMST went from$12 + to $17+ since June and looks ready to move toward $20- $23 Soon. I did not check if their earnings are out, please do so before entering these trades.
SID – Sid was a nice set up, especially since STEEL itself is bullish. June saw SID breaking a downtrend at $1.75. JULY 11 saw SID breaking out near $2. 15 and a target of $3.00
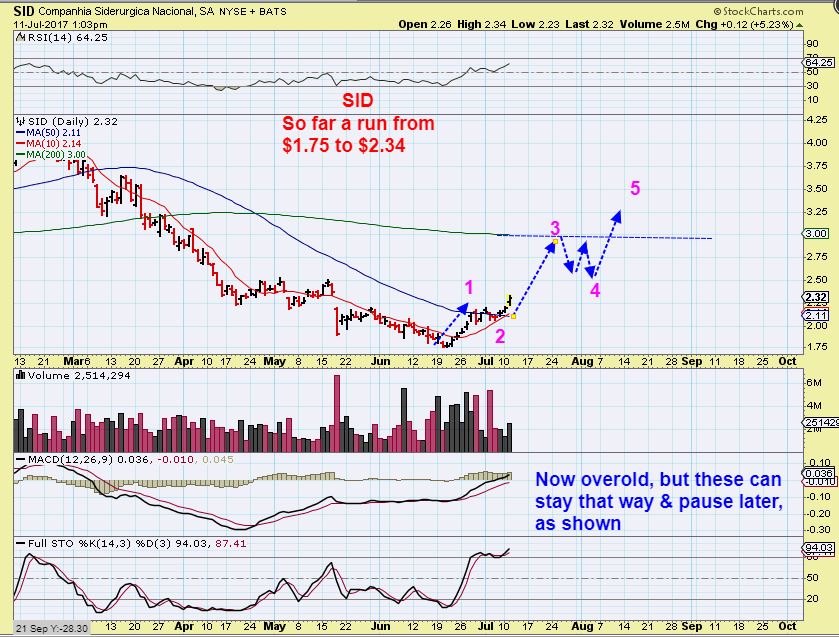
Yesterdays report pointed out that SID s RSI was bullish and this formed an inverse H&S and looked ready to go. $3.00 is still the target. This was a healthy consolidation and a good place to add to current positions.
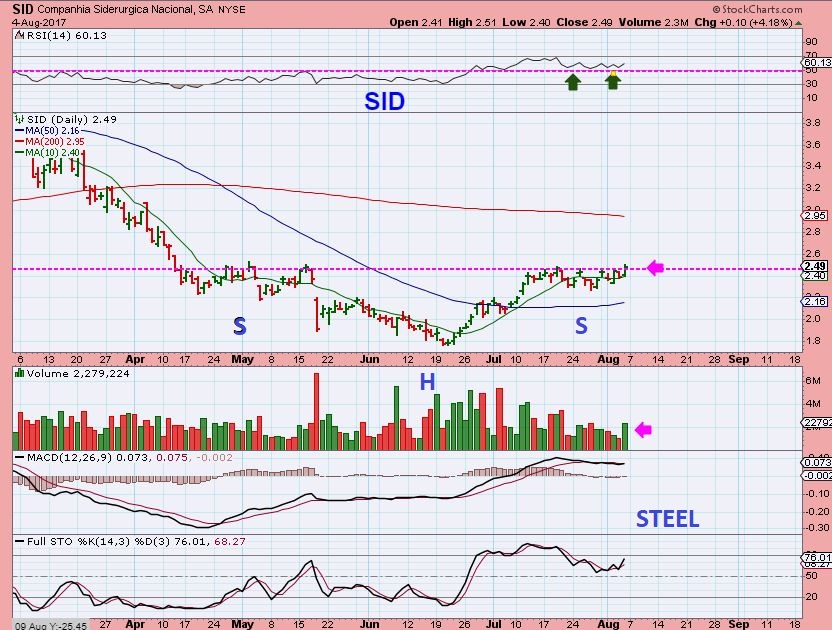
SID Broke out Yesterday, and this is the $3.00 target. I do expect this to tag the $3.00 mark, but there is a bit of risk just jumping in now. Let’s discuss…
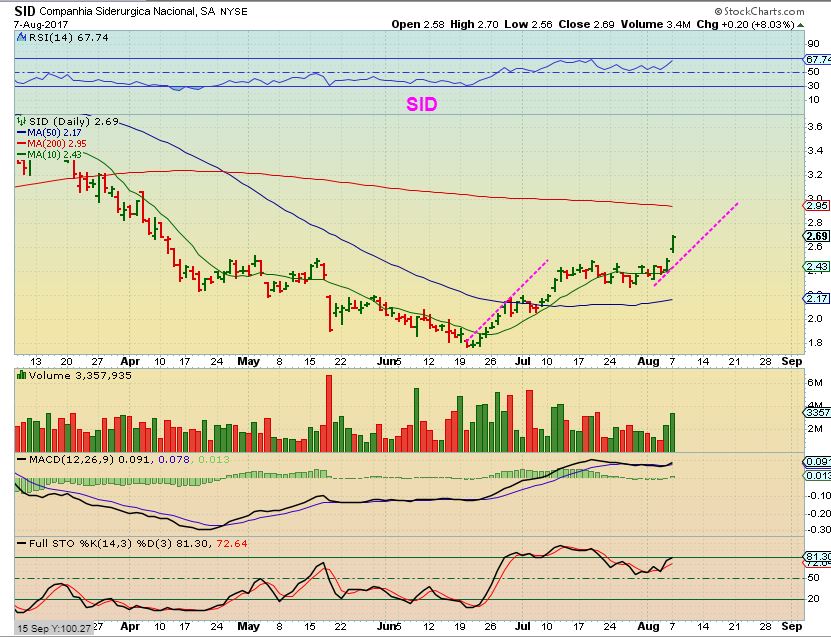
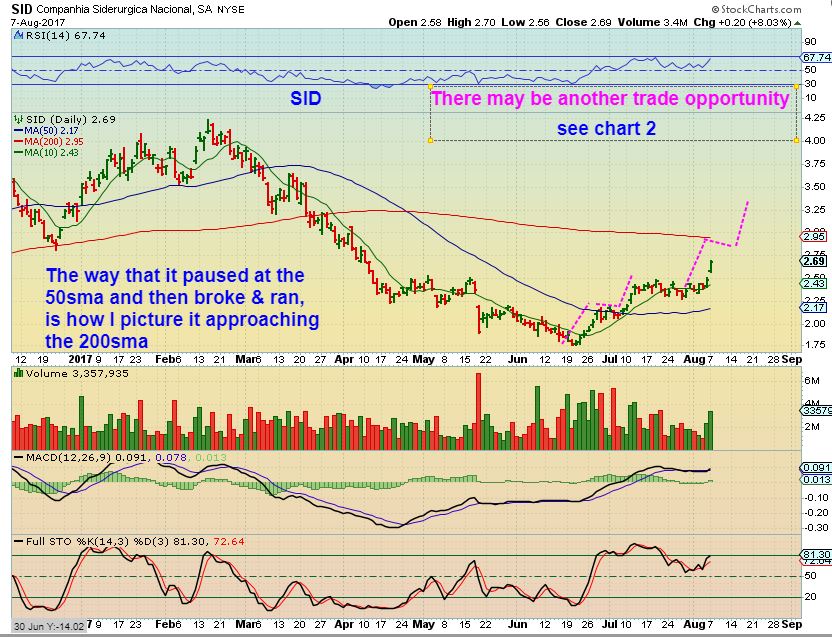
SID – Sid ran to the 50sma, went sideways and broke above. I thought that maybe it will run to the 200sma at $3.00 , slide sideways , and break higher too. SO DID YOU MISS THE MOVE? Maybe, maybe not. Read this chart and then see the next chart…
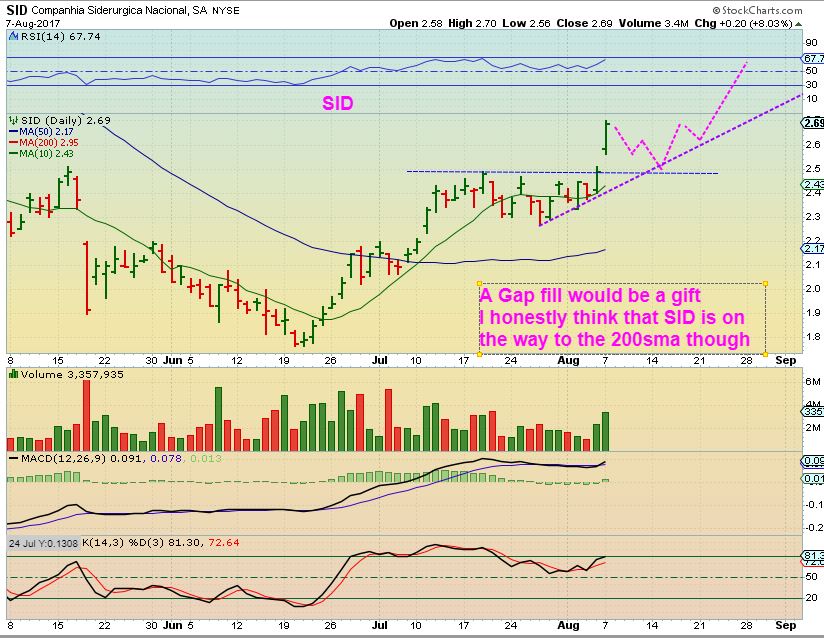
SID – You can just BUY & HOLD and eventually it should get to $3 and even higher over time, or you could wait & see if that GAP fills on a back test of Mondays break out. In other words, put it on a watch list and watch it everyday until it reaches the 200sma, or drops back to test the break out. Please read the chart.
NOG – Someone wrote to me Monday and mentioned that they owned NOG. They wondered if the slam down on Monday was rendering it hopeless.
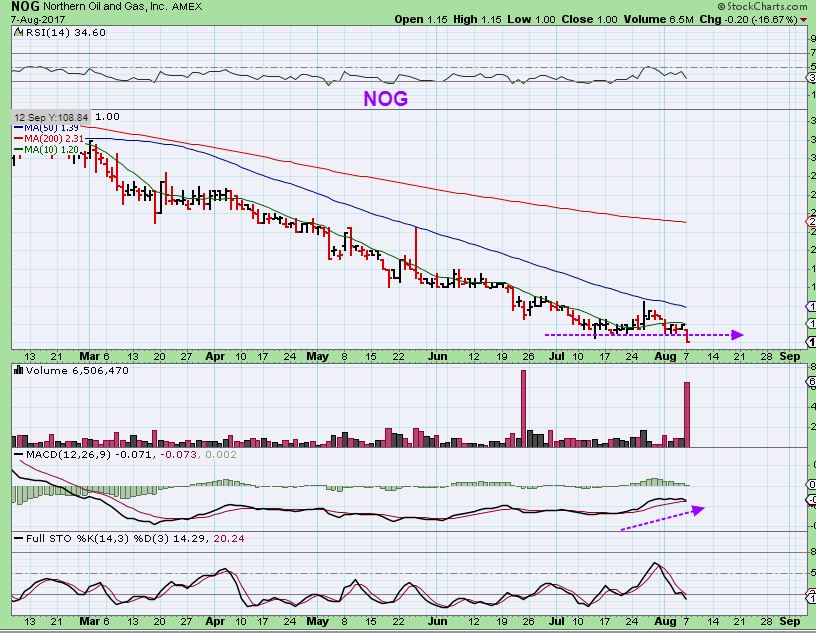
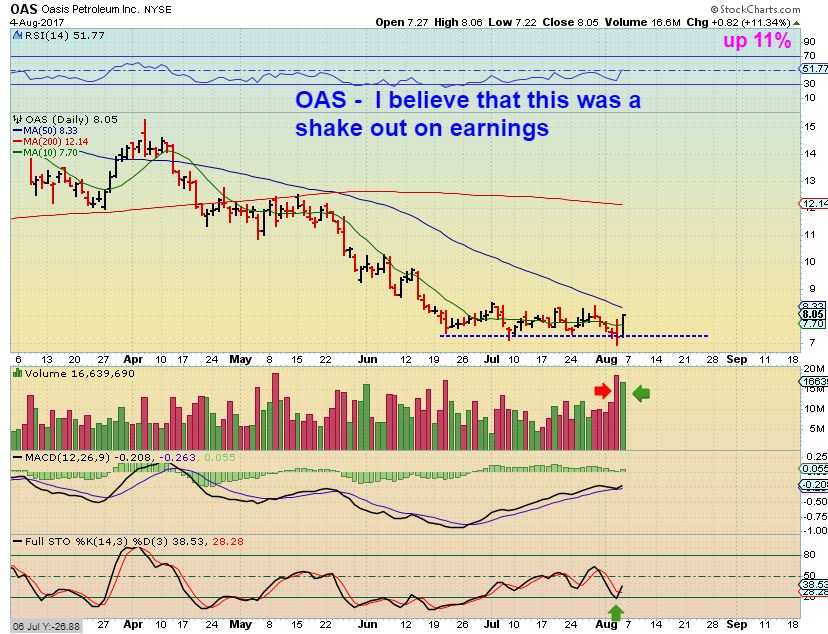
It definitely is a red flag, but I have seen a couple of these High Volume slams to new lows act as capitulation lows. A Capitulation low is where support breaks, EVERYONE bails out, and sellers are gone. Then shorts cover, price recovers, and eventually buyers can step in and push it higher. That is what I think we have with OAS. SO NOG MIGHT BE a capitulation low. It can go on your watchlist if you do not own it, but as for the ones that own it? It goes on a very short leash- cut it if it drops further.
AUG 7th WEEKEND REPORT 2 
 Aug 9th – Not A Whole Lot Of Change Here
Scroll to top

Sold half my position in $MTL just now in PM (entered at 4.98 per SOG pointing out the great chart) still holding half position. Thanks SOG
I didnt see what he posted, but my chart shows MTL going higher ( To the 200sma for starters, near $5.50), inless earnings or bad news comes into play. Was he showing it pulling back?
oh no, he alerted it and I liked the chart a lot. I just wanted some lunch money today so I sold half my position during PM, still got 1k shares for the ride
Oh, your post sounded like you sold thanks to Sogs chart. I see- you owned it because he mentioned it yesterday and sold 1/2 in premarket. Got it.
I think it is going higher and eventually a lot higher.
Many of these Commodity stocks have really good set ups
Thanks Alex. PXLW reports today after the close.
Thanks Ron, I did see that. Yesterdays pop almost looks like someone knows something, but I’ll wait 🙂
GREAT REPORT as ALWAYS and thanx for your view on oil – helps to look further than COT’s only : )
CF, any opinion on CAT?
I was looking at it yesterday. All I can say is that it seems to have bottomed when Miners and commodities did n 2016, and has benefited by trending higher since then.
3 year daily chart – Gaps open and then goes sideways, gaps open then goes sideways. Just gapped open recently.
RUN dropped in late trading yesterday – a lot
Wow, did you see what it did on the 50sma? Crazy ( SO far anyway).
there were a lot of short positions open so I’m guessing some of them took the opportunity to cover
My DUST is underwater in pre-market, but I’m going to try to hold it. Wish me luck!
Hard to get the entry right isn’t it? I think the US Dollar is flagging and should move higher soon causing GOLD and miners to drop. Fingers crossed.
https://www.tradingview.com/x/0ZEp3MJy/
Yes. Almost impossible. Thanks Bill!
DUST green 🙂
Thanks for the report, CF. I´m sitting tight on energy even though want to own it longer term, seems the OIH can´t escape those steep moving averages going lower. On miners, my favorite group longer term, I am still waiting for them to get to oversold on the weekly charts before doing any adding. Until then, the only daily setups (short term) I have done was buying XBI which is working decently, should trigger an exit in the next couple days if stays up or goes higher.
Been doing some daytrading which I haven´t done for years in the NQ futures, back involved bc of your bullish observations on the overall averages. My time frames are different, obviously being much shorter, bc I still cant fight the feeling markets need to get clobbered. In the meantime, they are strong as you repeatedly point out, and the day trades have been working very well so I will continue. Thanks for bringing the facts to our attention, not just the groups that capture our bias like miners, much appreciated.
PS. The same applies to the XBI trading I have done recently. I would have stayed away if you hadn´t kept highlighting the setups, as well as how they played out afterwards.
Thanks Ralph – I do think we have a little more selling on the Miners. It is hard to get them oversold on a wkly when they go sideways ( Takes longer ). I’m really looking forward to that BUY & HOLD for those Miners. I guess that is my bias too, but metals / commodities have been acting very well lately.
Wondering what % of members here are trading in what categories? Oil & gas, gold & silver miners, copper miners,
biotec, tech . . . . I am interested only in gold & silver mining trades and found your site in that market. Can you do a split off report for those only interested in gold & silver trades? or a click on to skip just that section of the report each day?
Thanks!
DUST, STLD, VLO, RCL, NAK, OLED, EDXC, EXC. A little bit of everything.
Precious Metals & Miners. Personally, I wouldn’t want Alex to do anything more for us – it’s not too hard to find the relevant sections of the report and posts – and Alex is already going above and beyond the service specification. This service and format is excellent as it is in my opinion.
Thank you Dialogueuser –
Thanks for understanding that and sharing that. I know many are Precious Metals traders mainly, but there are times when precious metals arent doing much and others ( as seen in the comments daily) Do trade NATGAS, OIL, ENERGY, BIOTECH. ETC. Just think how easy it would be for me to only cover precious metals
each day : ) I try to do a little work for everyone.
LOL – I put 4 hrs of work into each report, and you cant just scroll down for 5 seconds to reach it 🙂
I love the overview. I have selected sectors to try since being with you that I had not tried before… and have stayed away from some sectors [like biotech] because of your thorough reporting. Please don’t change. Everything is well labeled and we can just bypass what doesn’t interest us. Thanks again for all you do and the humor and generosity you do it with. [Maria will be after me for this complimentary post ! LOL]
Thanks Nancy, and yes, you have set yourself up for a Maria scolding. 🙂
China has orded steel manufacturing to be cut during the winter months to curb pollution. That was the news
Ok. That explains CLF.
That and the 200sma again
Rejected at the 200 eight of the last sixteen days. Not digging the declining volume.
Yeah, I hate choppy trading period, but todays volume isn’t nearly as bad as what it did 8 or so days ago. I still like CLF between that 50 & 200sma. I think it should find a way to break free sooner or later. I do like the 1 yr chart since it has higher lows coming out of the June lows,
Just looking at MUX .. looks like do or die on the 3 month and 1 yr (this chart is 3yr) https://uploads.disquscdn.com/images/ce81c16051efb33036d110b90caf5c5dcf7095b836bc41ef833f3314f06a0354.png … anyone know why the drop? https://uploads.disquscdn.com/images/db223f03907b613e2bb88d53c552286626e381e170c1cd0b38a78bb4aa46148b.jpg https://uploads.disquscdn.com/images/2e8de25485a740bd988e981f230c24384834df64d0dba7c7ebf24d99f4aca140.jpg
I hadn’t noticed that it broke the lows of its consolidation. It just kept trying to get above that 50sma and couldnt.
Crazy how some Miners look pretty good, and others are bogus ( AG & EXK).
I agree on the MUX observations, have a slug of it myself. I am not concerned longer term about that breakdown out of the consolidation, more often than not it seems support and resistance areas hold, so that breakdown is likely to be bought by pros, sold by the little guys like us. MUX in particular has a way of always coming back for me, so I will hold it. Going back far enough, we can see that MUX even got back the losses in the 2011-2016 in a period of just 8 months in 2016.
To be honest, I did trim some MUX the last couple weeks when I sold portions of all my miners, but to sell here seems like we already missed the boat and would be selling to stronger hands that are willing to hold several months.
I have a bunch to and it is really frustrating…but I trust McEwen because he has been so successful before, owns 1/4 so has skin in the game, and has a love for the mining game. Eventually, I think it will go up.
I agree
MUX has lower production and that’s why it is swooning. Do they have a realistic plan to turn it around? I read lots of these reports but have not looked into MUX in depth for a while, but I would sure see if they have a way to turn it around, because reality trumps great hair when it comes to stock prices. The trouble lots of these miners are having is they “high graded” their mining – taking the premium deposits and are now left with lower grades to deal with.
They reported on the 3rd I think and the report was in line with 2017 guidance and good progress on the 4 main mining areas they are moving along in. They are getting reports and permits going. Sounded like good progress.
Thanks for the update…. it’s very oversold …
Bought UEC for the daily charts. URA getting oversold on my charts, though I might be early.
UUUU sold off pretty strongly yesterday, breaking right down below that 50sma. Today it did a recovery ( so far) , so that could be saying something.
There goes the dollar, and that squashed that $7+ pop in Gold.
Thats a good example of why we dont just chase a strong looking pop when it is getting later in the daily cycle.
Nord’s long US$ entry yesterday is looking good
I stopped out of mine last week, but re-entered this a.m. — again using the ETF: EUO – which is double short the Euro (making it long US$)
Yeah, The USD looks to have put in a DCL, ICL, YCL
ouch to Canucks travelling in the US
Well, Longer term I think that the USD has topped and will end up dropping again. There are 15 yr cycles in the USD and it looks to have topped on Jan 3 of this year.
This is why I expect GOLD to really move higher in a wave 3 move . Gold bottomed in Dec 2015, and put in a higher low in Dec 2016. After the USD bounces and maybe goes sideways for a while, I expect it to resume its drop
Thanks for explaining the big picture, Alex == AND the reminder that this isn’t a “set it and forget it” trade. PLUS you did a great job covering this in this and the last reports!
Thx Cal
Hey, I am not long the dollar 😉 I don’t see any confirmation for going long, nor do I see it reach a significant support level at current price other that we are very oversold. But I know that a lot expect dollar to bounce hard, but it is conflicting my view as I think the sentiment in gold wasnt extreme enough to call it a top.
My chart was more to demonstrate that there is reasonable evidence to conclude, cyclewise, that the dollar put in a final top at 104 level and that we now have entered into a downtrend cycle.
I am long gold and goldminers after this correction that found place today and managed to get decent entries although I was hoping for a pure 38.2 retrace. However, we retraced to the 23 % fib lvl as of 2011 + backtested the “bearmarket” trendline, so as of now I see this as a breakout with backtest. I think we see a small HCL in gold then trend continuation.
Yes, it is risky, but with reasonable entries, it is all about the game of risk / reward.
Closing of 1hr-4hr candle below 1243 will probably alter my view regarding gold, but as long as it stays above that zone, I am comfortable long.
DXY seems still to be stuck in downchannel.
https://uploads.disquscdn.com/images/4e106e449c7ee57c22a9008dede5b585e162ab64960d8357b58e03a63495beb9.png
Sorry about that, Nord – I thought it was you that posted the buy, my memory is getting spotty!
CF – YRD
B.T. – OK?
lol I asked about your thots on it yesterday.. was hoping u might see it this time..
Oh,
My thoughts are that it was a great move and could keep running, but it isnt low risk, so I have no entry. It is quite extended over the 50sma, and as it breaks to new highs, I see divergence, which could mean that the break out today will fail for a while.
If it then formed a handle , it could be a good entry, but right now it is in the middle of a move, it just ran from $30 to $40. I dont usually start a position in the middle of a move, but I might add to a current position
I had YRD from the post earnings sell off but moved to take profits yesterday. Miniscule position for me unfortunately, wished I had gone bigger! Not chasing here.
SGY
BKX – Banking, and JPM & GS are breaking out. look very bullish.
DNR is doing well…think their earnings were today but I have not seen any news yet.
http://www.marketwatch.com/story/denbury-reports-second-quarter-2017-results-reduces-2017-capital-budget-increases-2017-production-guidance-2017-08-08?siteid=bigcharts&dist=bigcharts
Pretty good…thanks Alex.
Woohooo!!!
For those of us wondering what has happened to GMO the last two days, the dreaded private placement/offering was announced this morning. Turn out there was fire with that smoke we were seeing.
Hey Alex,
I posted a question to you over the weekend, but you might not have seen it.
In the event that the next daily cycle in gold fails, the miners’ charts are setting up to make some interesting moves down which will fulfill several chart requirements, satisfy a backtest to a solid 4-year support line, wipe out any remaining positive sentiment to set up for an awesome wave 3 up beginning in ~september, and accomplish all of this while not doing any technical damage to the charts.
So my question is this: Do you see these as viable targets in price and time? (I’m just thinking that this set-up is almost too good to be true, so I am looking for cycle confirmation).
Thanks in advance!
(And sorry for the links instead of the charts, but I am posting from my iPad instead of my computer).
GDX weekly:
http://stockcharts.com/h-sc/ui?s=GDX&p=W&yr=3&mn=6&dy=0&id=p73197703551&a=461661368
GDX daily:
http://stockcharts.com/h-sc/ui?s=GDX&p=D&yr=0&mn=9&dy=0&id=p35827845924&a=363051472
GDXJ Weekly:
http://stockcharts.com/h-sc/ui?s=GDXJ&p=W&yr=3&mn=3&dy=0&id=p67621837895&a=410247662
GDXJ Daily:
http://stockcharts.com/h-sc/ui?s=GDXJ&p=D&yr=0&mn=10&dy=0&id=p82364519349&a=366110084
Thanks again for all you do!
They are possible, but they dont exactly match my expectations.
Your question started with , “In the event that the next daily cycle in gold fails…”
If it fails ( And you are saying if the July lows fail) , pretty much anything can happen, because normal expected targets can get overdone in a drop to the icl.
thanks!
NAK moving up to the 50sma again…
Looks promising
https://www.tradingview.com/x/5GFIoc5a/
Not. Excited. Yet.
I really really like that chart of GV in yesterdays report ( attached here) , but earnings come out Thursday. Adds a little risk.
It actually hit oversold – in the chart it hadn’t yet.
https://uploads.disquscdn.com/images/c8037b300276ef7e411d17510bcdeddd0d92dfc51abd8c7b758131c8becd16bd.jpg
My CMCL, new symbol for Caledonia, is rocking today. Don’t know why. They recently got an AMEX listing.
I really liked Caledonia, and I like the AMEX listing.
I just hope the volume picks up with time.
And they have a dividend?
Yeah a pretty good dividend. They did a 5-for-1 reverse split to get the stock price over $5 to get the AMEX listing so number of shares are much lower which reduced their volume.
Hi Nord….. do you still own this stock?
Thanks a lot.
https://uploads.disquscdn.com/images/044967903bce06cb7a01cb518a56e54a46bffbce1b42bef322700037f920910d.png
Yes, call options on that stock that is 🙂
There is no confirmed breakout in this stock or anything like that. But it has held support and is in timing band for potential trend-alteration.
I take positions bearing that in back of my mind, so don’t overleverage in case it want to dive too deep.
I have marked support region on this chart. https://uploads.disquscdn.com/images/66f3b5462cc6ff00038d7f6c554364d1fa004db8d0598e4273d85c47616485d1.png
I am not much of a breakout-trader, I am more the type that takes positions before confirmation (aggressive trader). That requires a bit different kind of risk management than breakout trading does.
Thanks a lot NORD for your thoughts, it’s really appreciated what you do !!!
Dear Alex…..
What’s your thought about MUX?
Where do you see support?
Alex….. thank-you-very much for your great help and excellent work.
I’m not always able to react what I really want to do sometimes.
Again….. THANKS !!!!
Well, I dont like to encourage people to hold on to a losing position, and this is a bit tricky. Mux already lost support, and needed a stop at the recent base lows. So what now that it keeps falling?
MUX may be almost done with this move lower, but if GOLD sells off further into a DCL, might it get dragged down a bit more? I would think so.
I will attach 2 charts showing POSSIBLE support and a measured move down may be completing ( but they can extend).
https://uploads.disquscdn.com/images/4baddf589ca8ffebfb54232120fb88d52b6b37cd8fcf5eb79ca00715f380c875.jpg
https://uploads.disquscdn.com/images/b18338083618bacefce5305d3c4e722284fb7376b030c4f8d78d4dfd2e7c313e.jpg
Hi Alex. Funnily enough I had that support line around 209 plotted on my own long term charts. Interesting it is in the general area of a number of important support/consolidation zones stretching as far back as 2008. It will be very interesting to see if this area proves significant once again!
I’ve been looking at different miners and I wonder if the sell off into the next DCL will be quite mild, despite the fact that the USD seems to have put in a significant low. Like you said, Support seems to be close enough that a deep sell off in many of these may not happen.
It will be interesting to see how this plays out.
Even so is it a reasonable expectation of another 5 or 10 days before this DCL plays out?
Yes, it is – and it could be sideways or choppy rather than a deeper sell off. The USD at an ICL just has me more cautious
Interesting for sure!! I’m still very open to the idea of a final short but sharp cleansing move to the downside just to try and panic as many out as possible before starting another epic bull leg. I personally have lots and lots of dry powder to use once I feel convinced that is happening but will happily miss the bottom and turn as I’ll be buying for what I hope will be some long term trades/investments. I’ve been patiently waiting for months now since lightening up near the peak in April. But as always time will tell!! 🙂
Yes, that sounds really good to me too. I want to see the wave 3 of epic proportions please 🙂
🙂
Welcome, stranger.
GRGH .. weeeeee … long wait.. hopefully it continues…
Yes, you probably mean GRNH, and I have been hearing you say that you were waiting for that.
lol.. yes
I’m 100% with you on that one!! 🙂
I’ve been waiting since Feb. Let’s do this!
Alex, please do not renew my subscription. Thanks.
Please send an email to support ( Under the support tab) …I provide content, they should be able to help you.
Alex, please renew my subscription. 🙂
🙂 Please stay tuned
Alex – thinking of cutting LODE loose if it drops below .18 …. it’s acting weird ….thoughts?
Using a 50sma, it could be heading to 17 cents, and would be a bit more oversold by then- however we do still have a dcl ahead of us somewhere and I cant say that it wont break the 50sma at that drop & recover later. Notice how it rode along that 50sma in July – kind of sloppy.
Hope that helps.
Yup! As much as I liked the ER and outlook – if it’s headed for a repeat of July, then no bueno for now….
Yeah, I was looking at this as another one that is riding between the 200sma and the 50sma, and it did break through that 200intraday and closed back below. I think eventually it will move higher, but as you said, right now? Probably no bueno 🙂
The 1 year daily chart has nice divergence though.
here’s PXLW earnings. It doesn’t look exceptional but it is popping now. Thoughts??
https://finance.yahoo.com/news/pixelworks-reports-second-quarter-2017-200500916.html?.tsrc=rss
I cant give any thoughts other than I like the chart. After hour moves can be pushed around if volume is light
but I did like the chart recently.
Maybe someone else has something to share regarding the earnings?
NVDA, making highs, but in reality not getting anywhere. P/E is now 60 and ppl buy in the story of GPU processing for cryptos, future AI etc. If I frequent a bar, I am sure I will hear about ppl making profits in techstocks 😀
https://uploads.disquscdn.com/images/d3f8388f9719635616df71300d81e8f6724d807273310c0a6720f3076b74ec8a.png
MTL did not manage to hold above 5.13 level which I regard as breakout level in this cycle, let’s hope it will soon, I see a potential for it to go to the next major resistance level of 9.9-10.
Betting on trend-change in GDXJ Thursday / Friday when price was 31.9. Entered into December Calls, K = 38. Miners have a lot of catching up to do in terms of getting above 200 MA.
https://uploads.disquscdn.com/images/e1e03020e9bcc0af320dc9a91a8cb55538d1b7f72ba6ec6173fdfd1d8e74cbb6.png
Swing high in the Dow with a reversal candlestick might prove interesting. Reporting season over yet?
In hindsight the majority of us would have been much better off had we adopted the adage of selling in may until end of August
The majority of stocks mentioned have dropped off the rugged cliff edge and reduced our capital, especially as many commodities etc this year are bottoming after many years of decline.
Preservation of capital would have been the best policy
I see strong support for both TRX AND MUX just below at $0.00! Almost there!
I have been to that support level several times in the past..I prefer MUX does not give me the experience again!
HA! We either. Actually, that’s not a great chart pattern either!
While I think the DCL is ahead of us for PMs, some of these price levels really look tasty to start accummulating? AG, EXK, BTG, maybe AUY, SAND? Anything but MUX, NAK, and superlame TRX!!
The new report was released