In the weekend report…
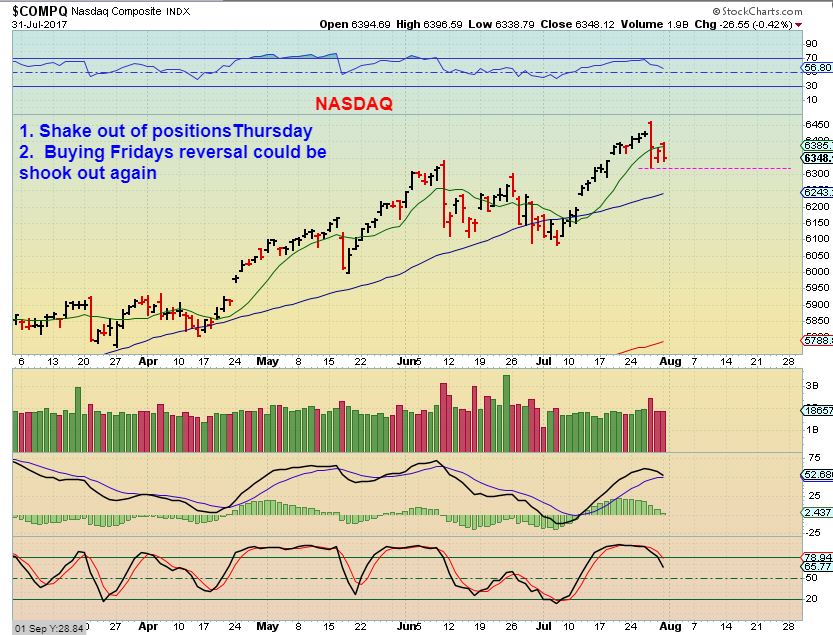
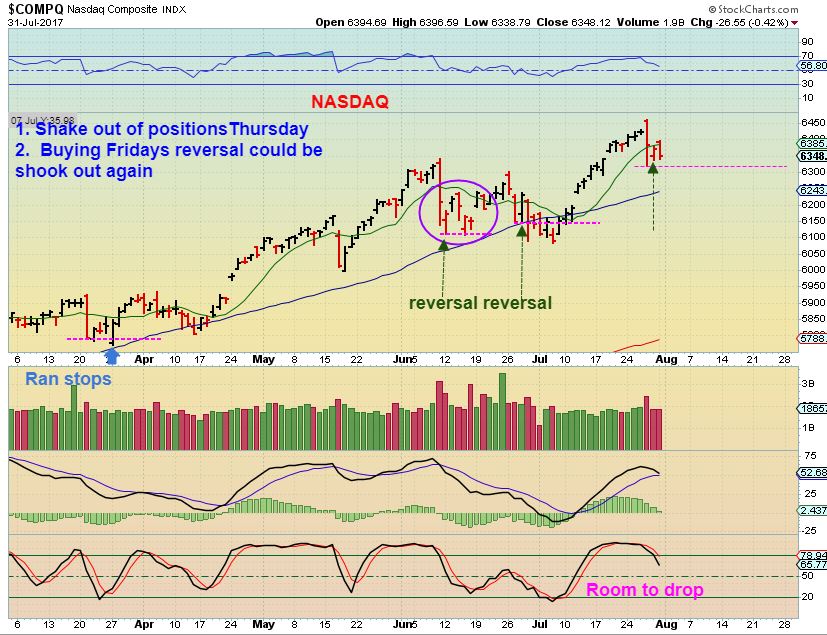
NASDAQ – I was pointing out that the reversal on Friday after Thursdays slam down could be a false reversal. This would draw in the eager ‘buy the dip’ crowd, but they may get stopped out shortly after. I pointed out a similar slam & reversal in June, and it did not just take off higher…
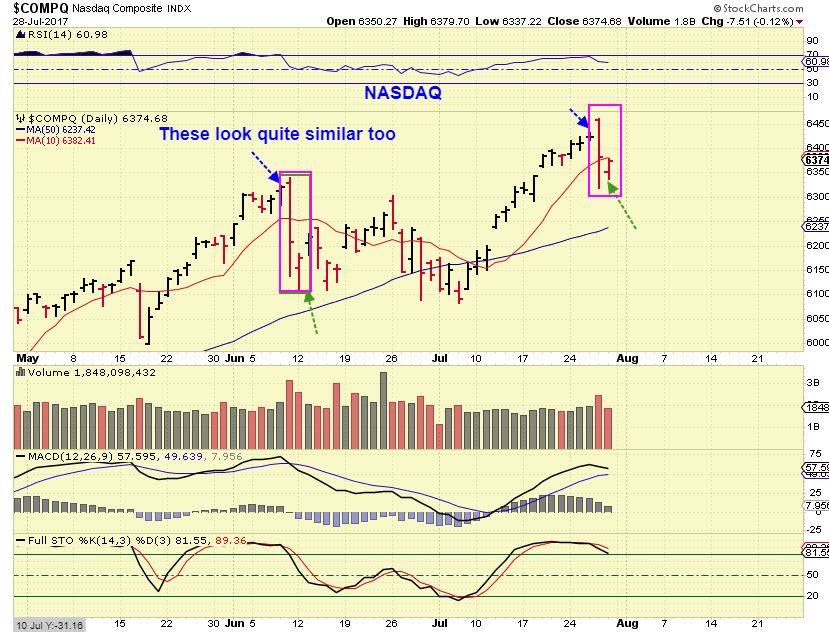
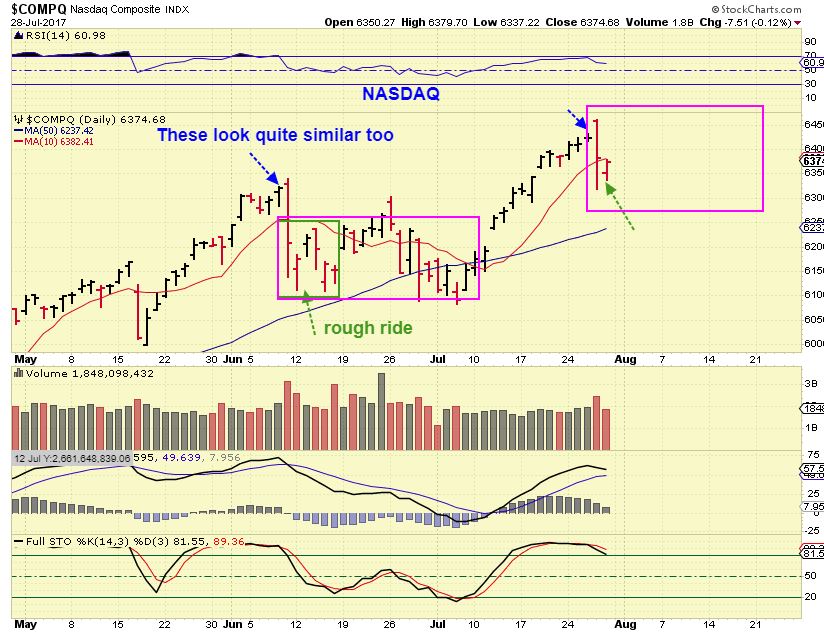
I have often mentioned in my reports when discussing Bull Market runs, that they are NOT as easy to ride as most think. These long rectangles show that contrary to popular belief, bull markets do not just go up day after day.
NASDAQ on Monday– Many buyers would put their stops under Thursdays low to minimize losses. You can see that if the markets start selling down on Tuesday, stops may get run, and that could also cause even more selling, possibly back to the 50sma. That might be a good buy.
NASDAQ – I wanted to point out again that in both June & July, sharp drops followed by a reversal day bounced around for weeks.
That said, …
Conclusion: So I liked AMD, CY, GRPN, and a few other tech stocks and their uptrends. During this consolidation & choppy period in the general markets, I am much more interested in the commodities and precious metals area (and maybe energy has turned the corner too).
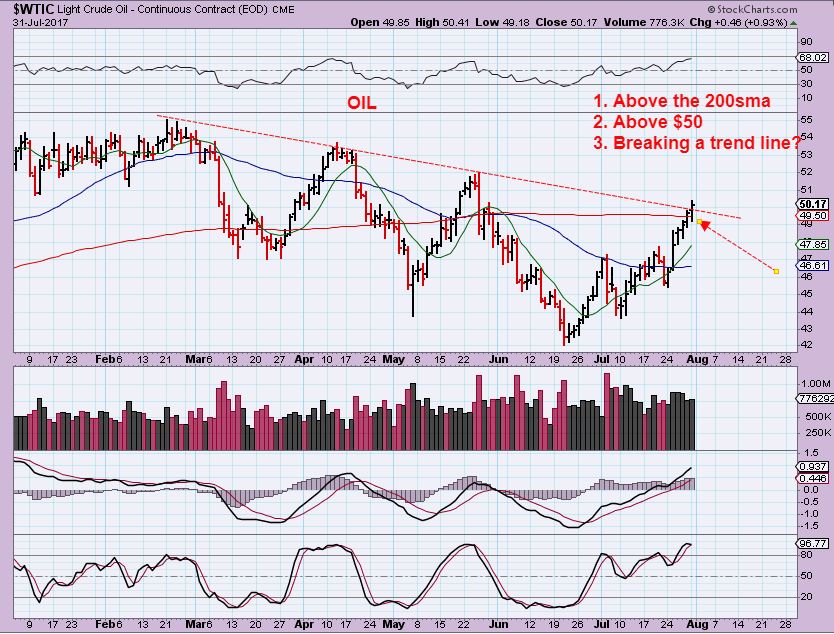
WTIC – Oil continued higher, and the XLE remains above the 50sma and above the break out of the down trend line, so Energy is looking more & more bullish. Well, Except for…
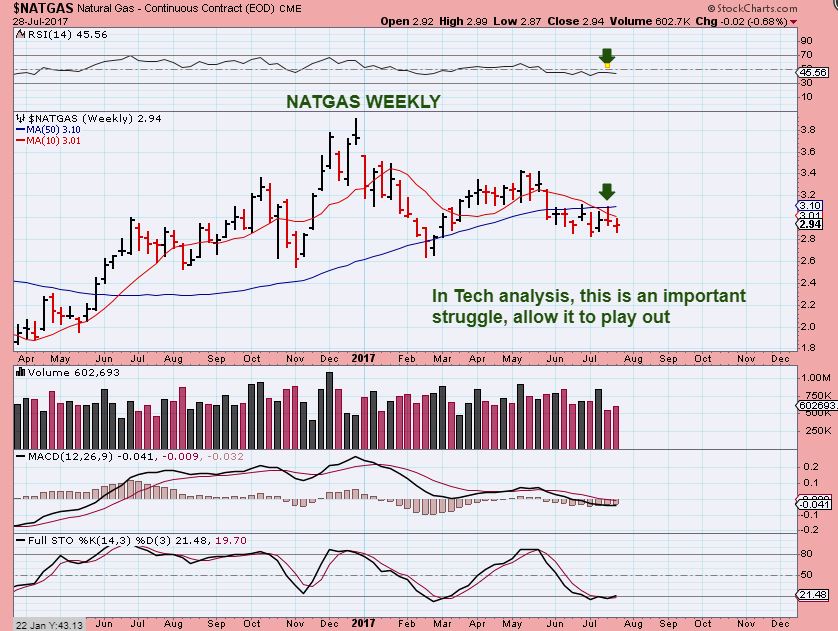
NATGAS – This was a weekly chart in the weekend report. An important struggle…
And so far the Bull lost on Monday. NATGAS dropped 5% ! In fact…
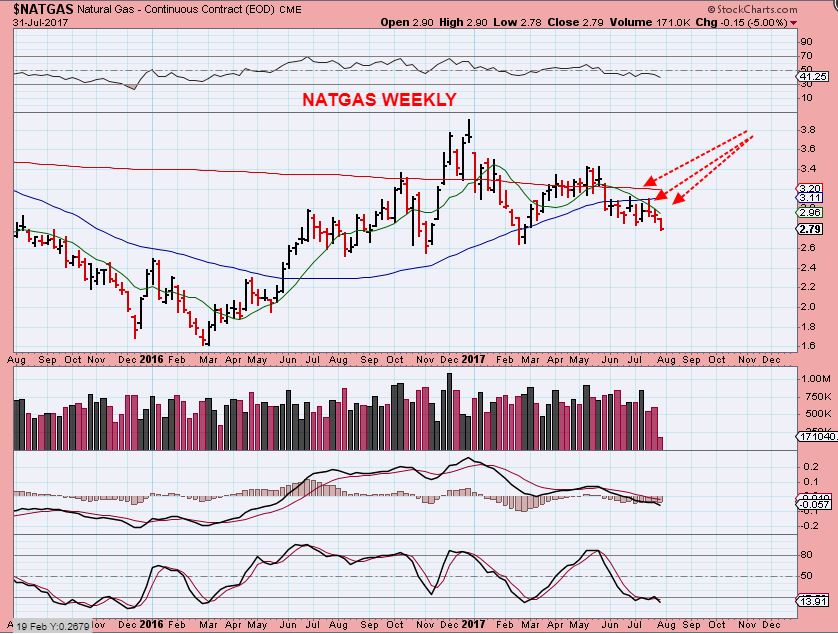
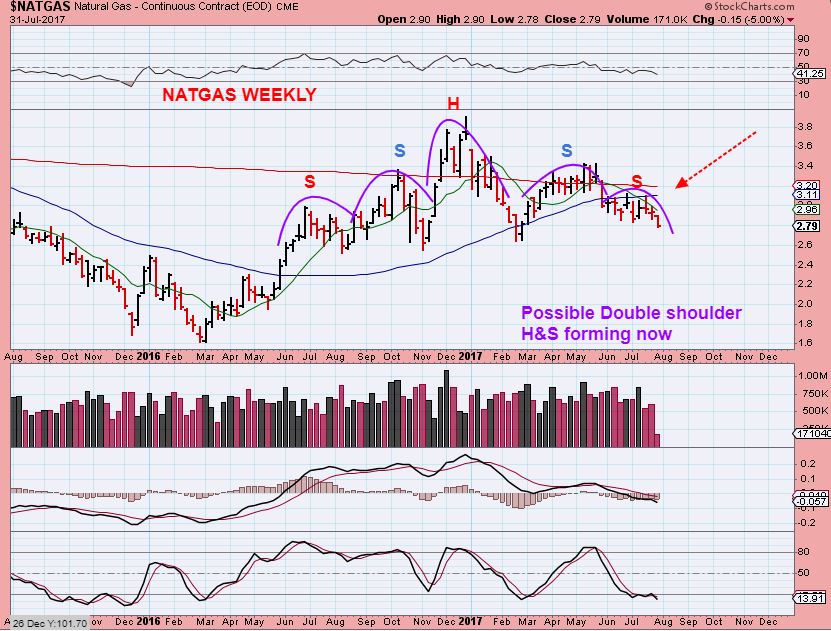
In Fact a rather bearish pattern looks to be redeveloping.
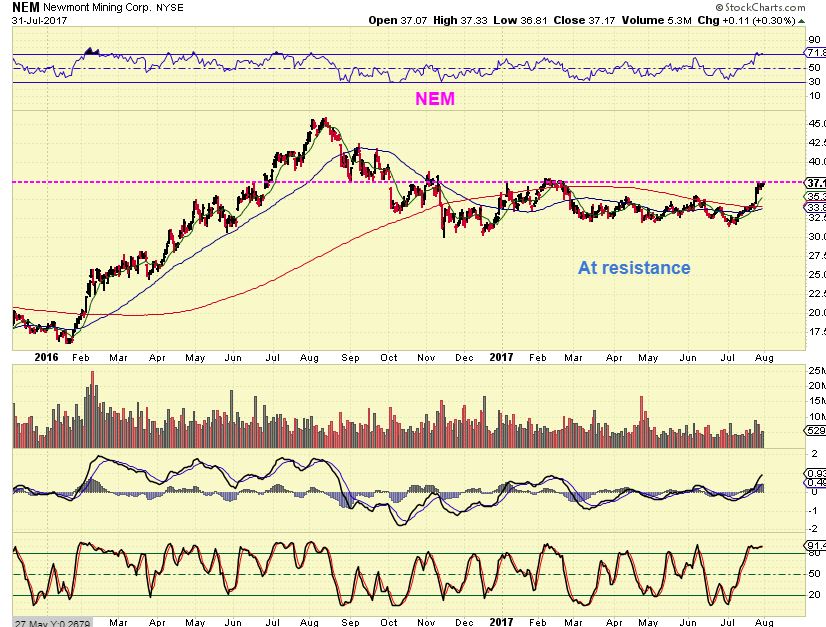
GOLD, SILVER , & MINERS basically did not change from the weekend report, so let’s just look at something else. GDX is made up of a good percentage of NEM, ABX, and GG, so let’s take a look at their charts.
NEM #1 – NEM is at resistance. It could just break out if Gold moves higher, or realistically, it also may pause before breaking out.
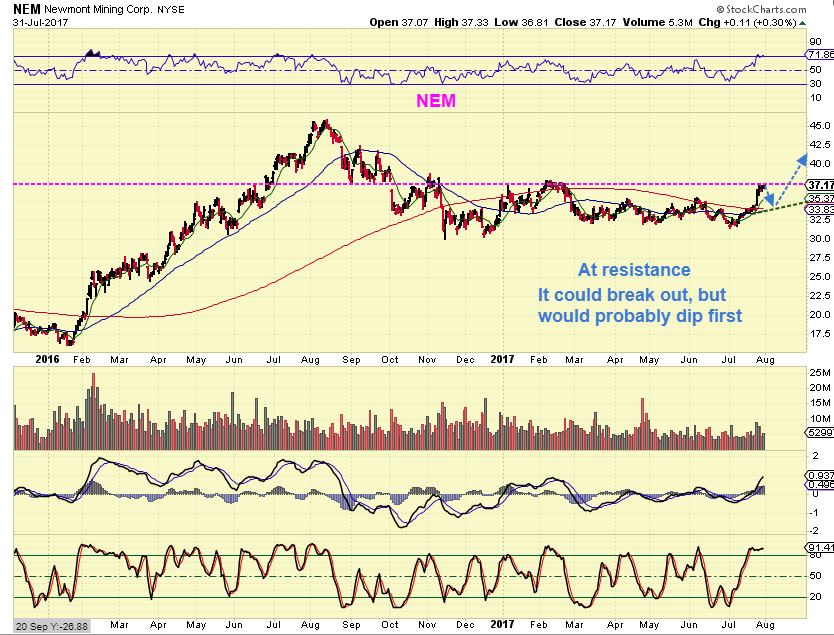
NEM #2 – Please read the chart
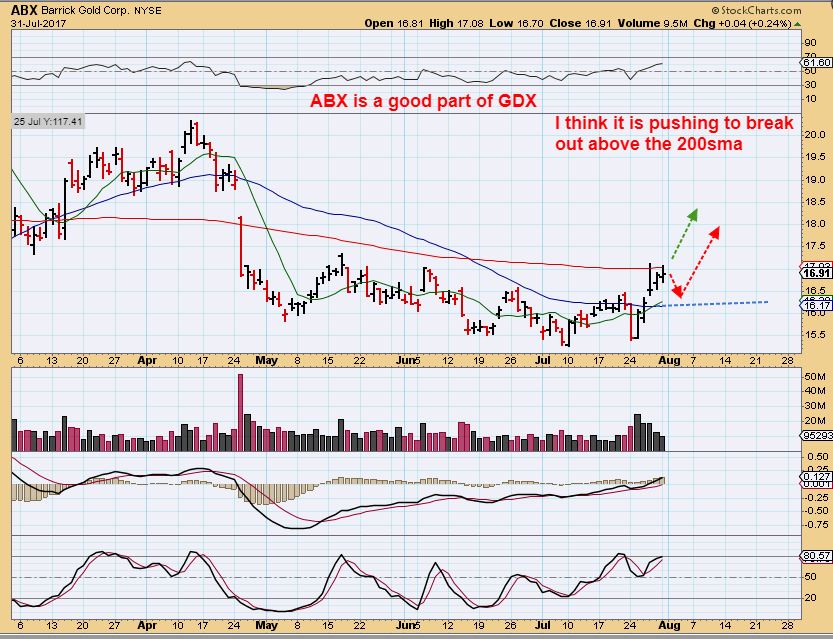
ABX – After earnings were released, ABX moved higher from a 1 day slam last week, and is trying to break out above the 200sma now. It has the same story as NEM, it could break out if Gold moves higher, or pause and build energy to break out.
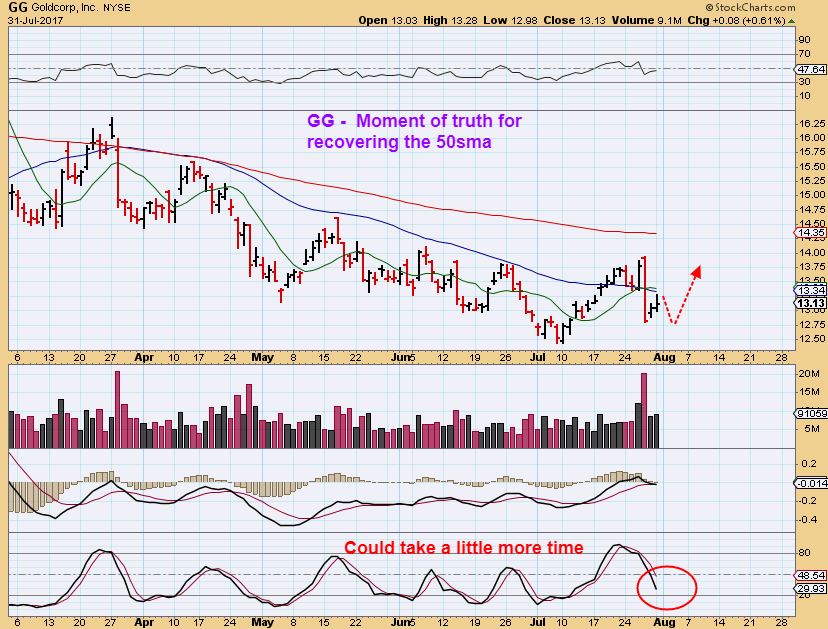
GG – GG also slammed down last week and is starting to move higher, but this could be a weak bear flag and stall at the 50sma if Gold doesn’t burst higher too.
Conclusion: NEM, ABX, and GG all look ready to break out or pause for a bit to build up energy. I would conclude from that that GDX could do the same. Many Miners still look bullish, and may be waiting on Gold to move higher. Be aware of the earnings release dates on any that you buy or hold.
COMMODITY STOCKS ARE STILL LOOKING GREAT
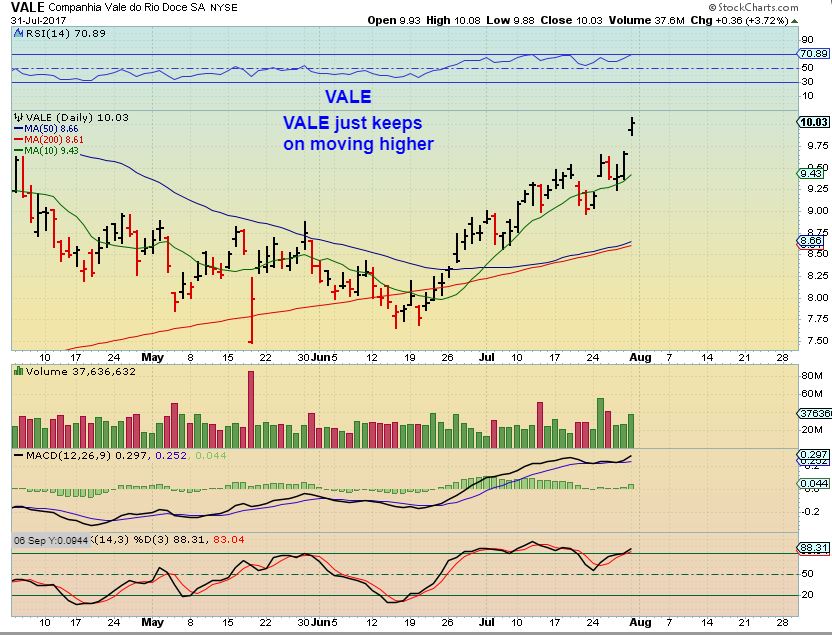
VALE #1 – Vale gapped higher and continues to perform well.
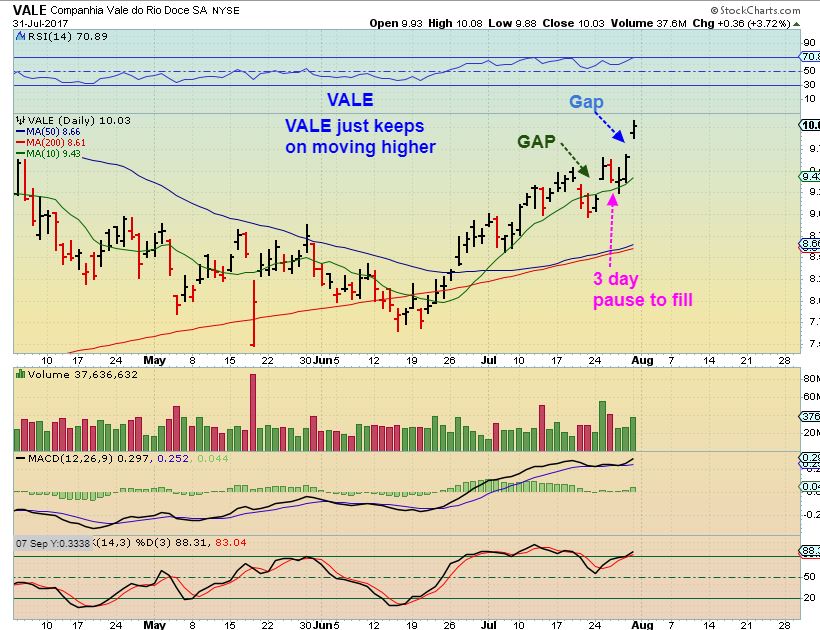
VALE #2 – Vale gapped last week too, and played out like this filling the gap. If VALE does a gap fill again, that may be a nice place to buy or add to current positions.
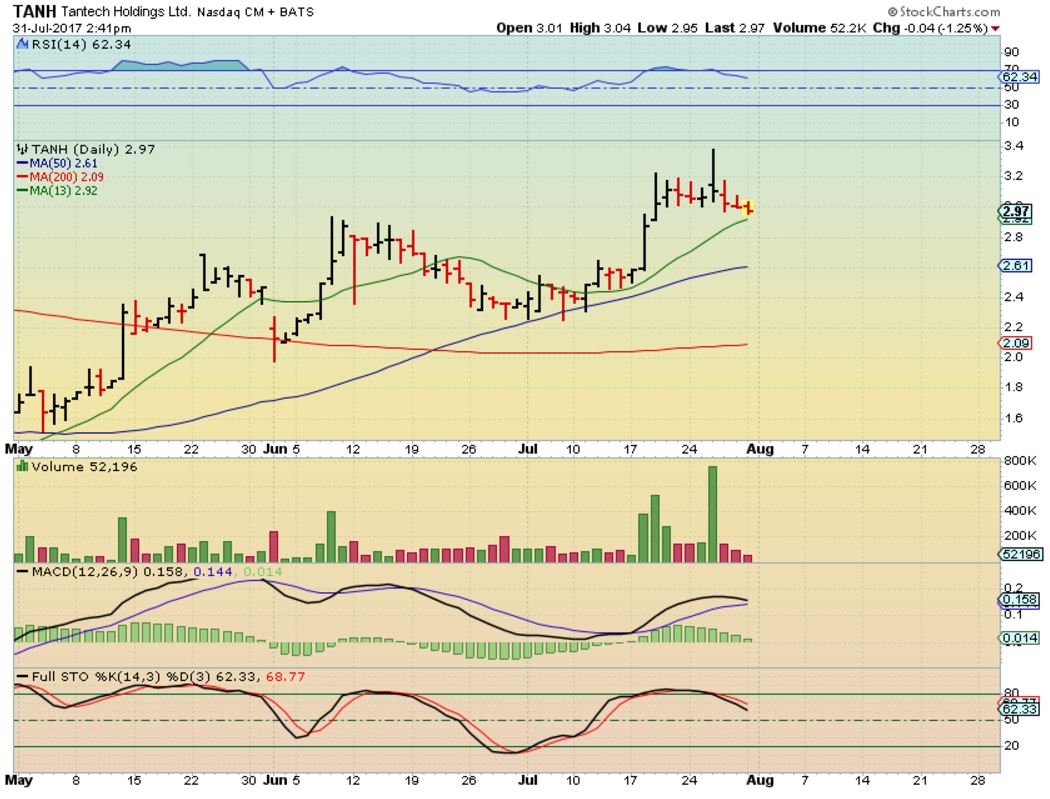
TANH – TANH is up 100% since May, 200% since April. This has formed a bit of a cup & handle. It might drop & tag the 50sma again as a buy, but a partial position could be bought here & then add to that if it does go there.
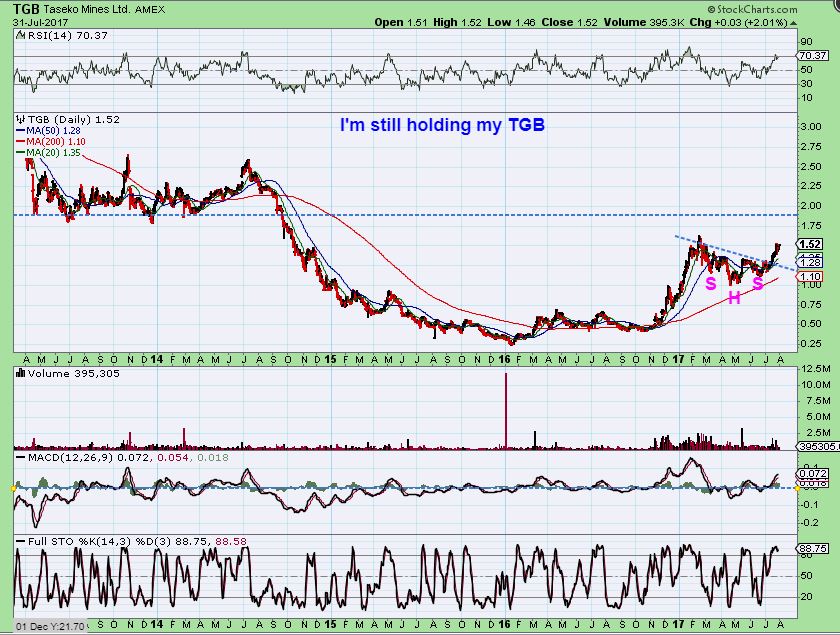
I still own TGB and I think it will continue higher over time too. Earnings are due out on Wednesday.
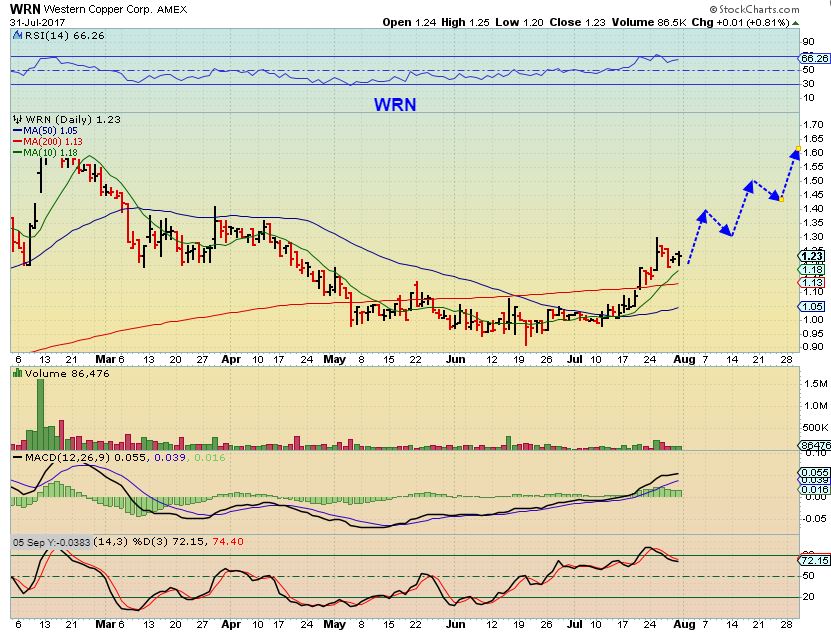
WRN – This was a buy in early July near $1.00 when it was at the 50sma…
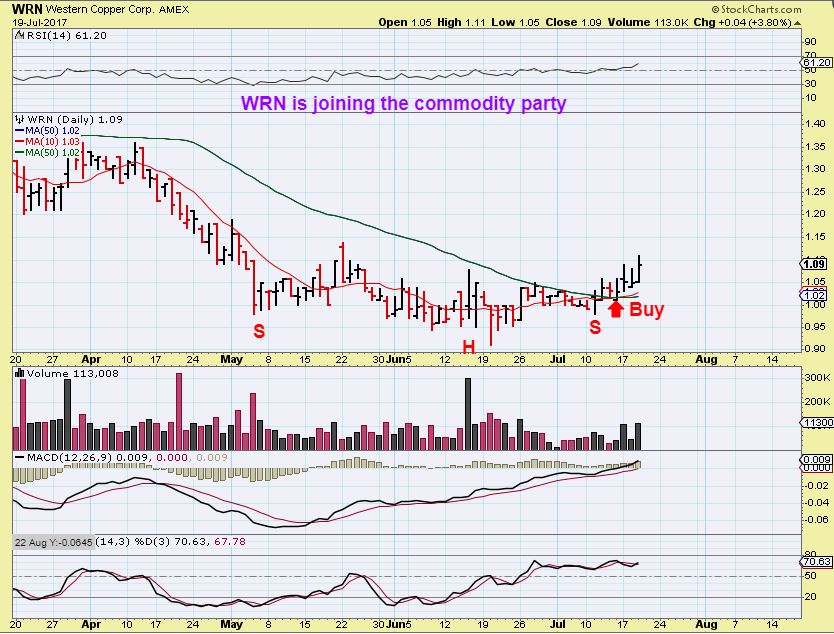
WRN – A nice move 30% higher so far and then a consolidation to the 10sma. I would add here, and the 200sma is added support.
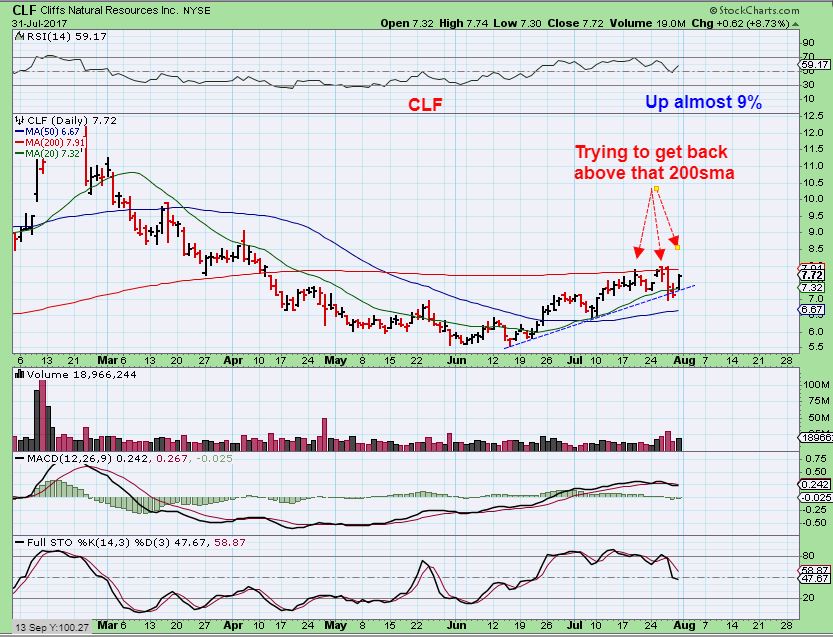
CLF – CLF is pushing against the 200sma, and moved higher by almost 9% Monday. This is also a place of support if someone wanted to add to their position. It MIGHT drop to the 50sma too however.
ENERGY
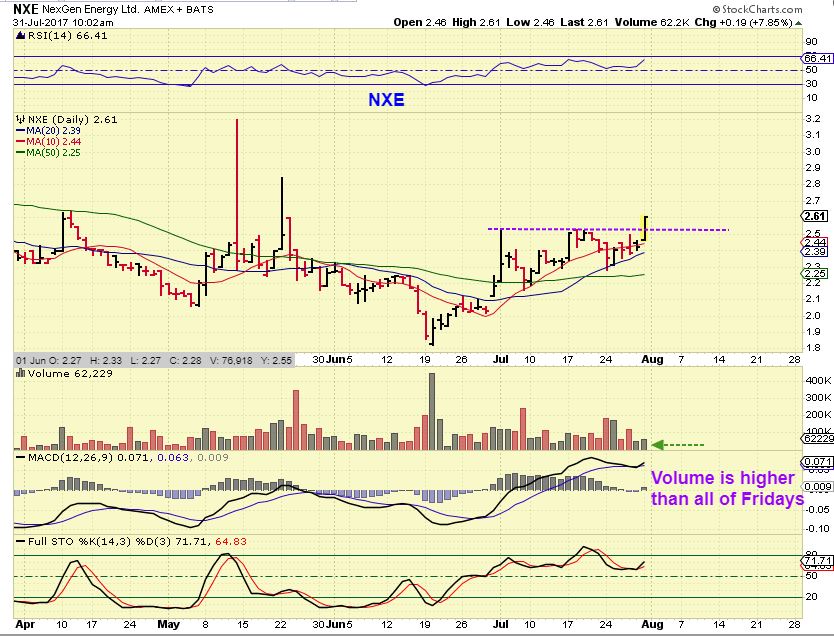
URANIUM STOCK NXE
This stock took off Monday morning and I captured this chart. The good news is that it pulled back later, and closed at $2.53 – right at the break out line. I believe that this will continue higher and still offers a low risk entry with a stop under the 50sma or tighter at the 20sma ( Blue line).
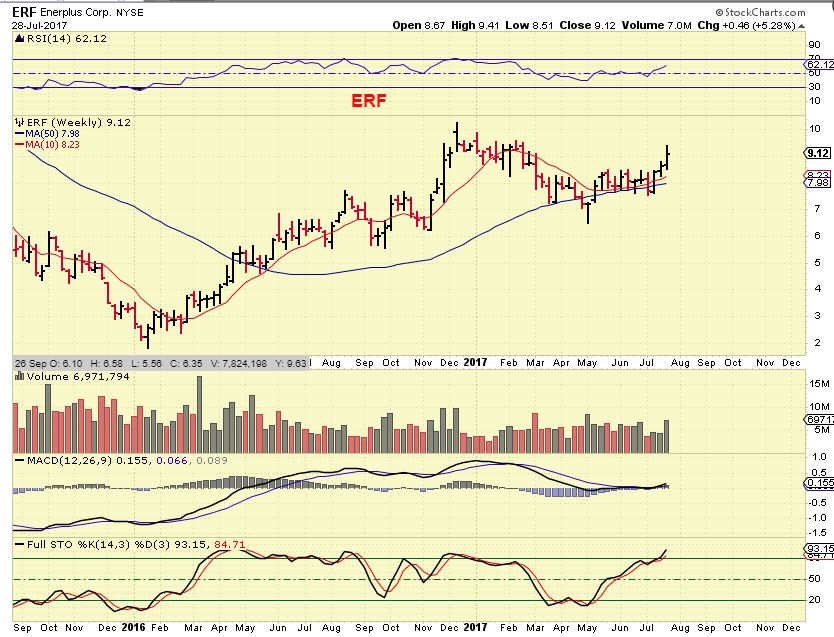
ERF WEEKLY – Energy from the weekend report. It dropped to the 10sma today and bounced back up. Look how it steadily rode along the 50 ma weekly, while energy was being sold off. To me that means that this stock is a leader & bullish.
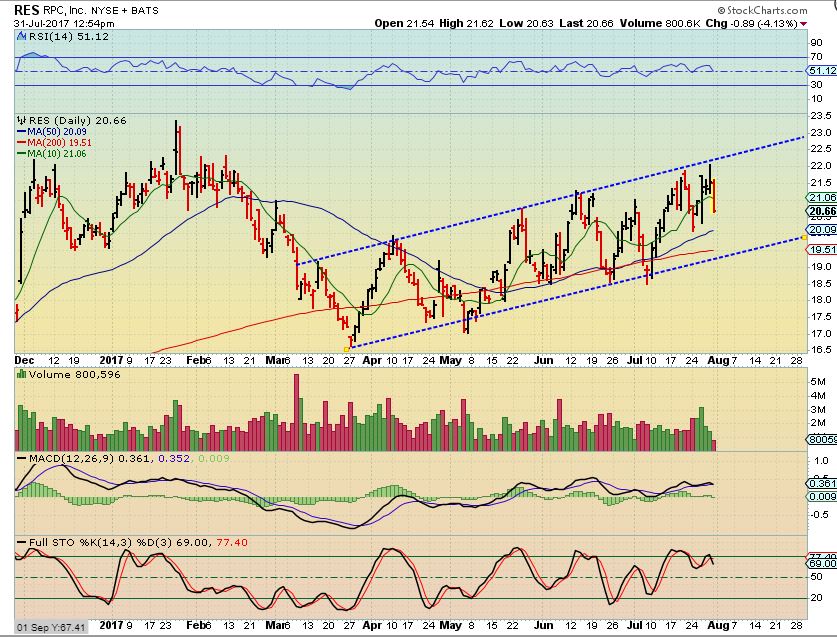
RES – This was leading too, but you can see that it is in a rising channel, and may drop to the 50sma or even the bottom of the channel & 200sma. When it gets there, it may be a good entry point.
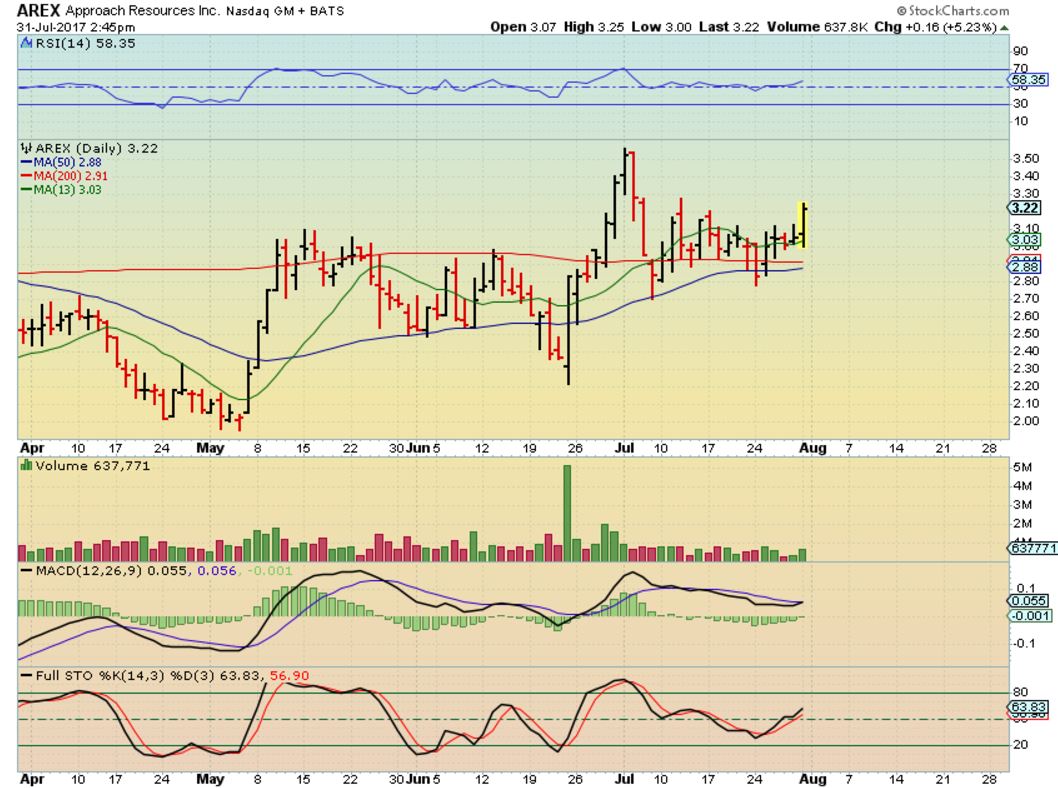
AREX – I love the chart, but earnings are out Wednesday, so some may want to wait.
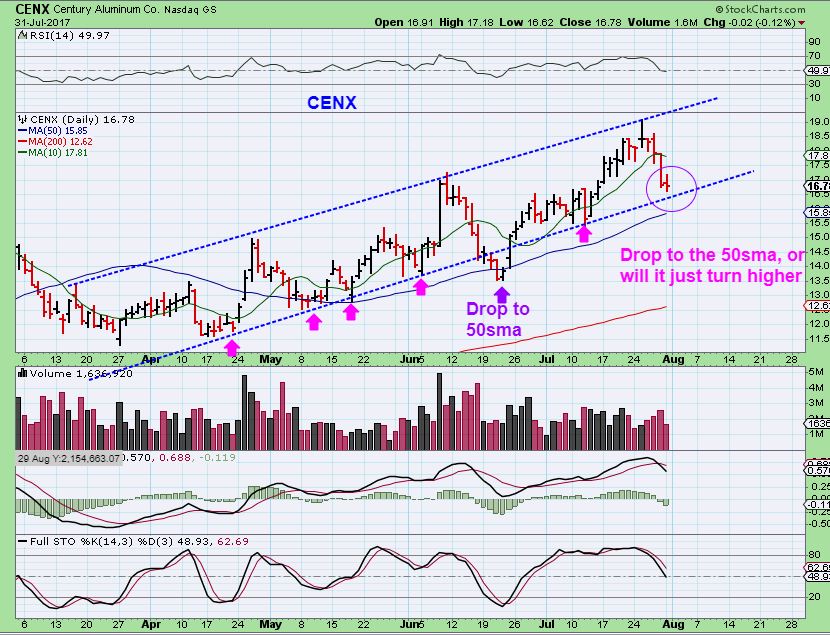
I was asked about CENX. It is a bullish chart, climbing, consolidating, climbing and consolidating.
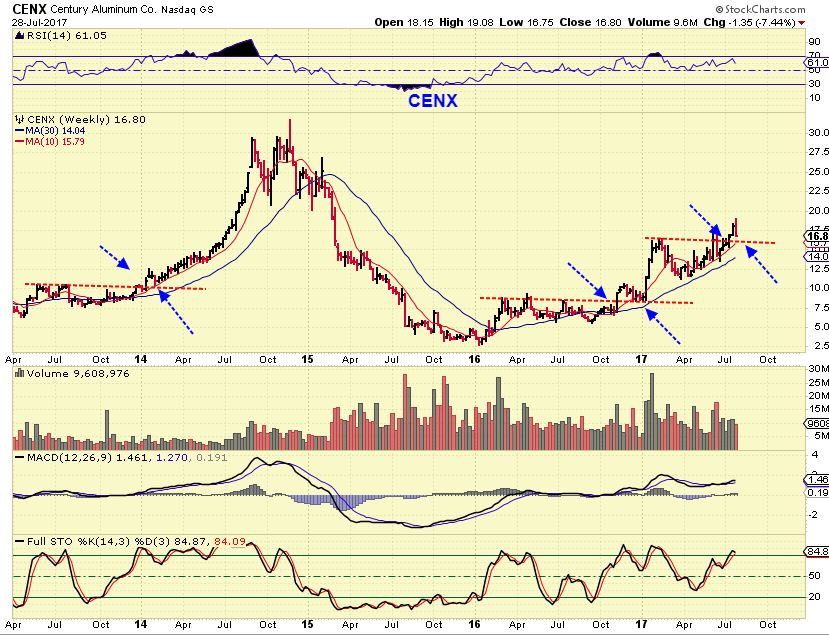
CENX DAILY – Notice that CENX drops toward the 50sma and then takes off higher to new highs again. CENX may drop to the 50sma, or just hold on that lower channel line. It is almost a buy right here.
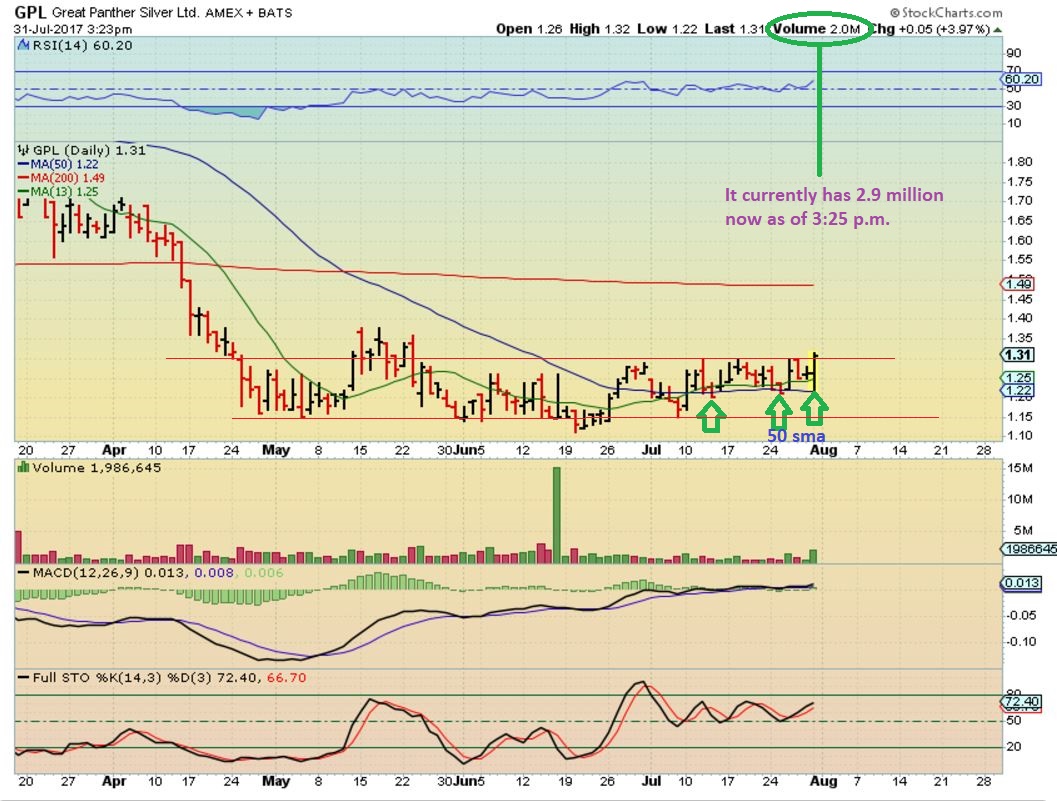
GPL – I own GPL inside of this base, and so far it has been holding up on the 50sma. It looks like it wants to break out and this chart was taken at 3:23 p.m. It ended up having 3.4 million in volume. Earning come out on Wednesday, so there is risk in holding it , but I am holding it. The chart looks good to me.
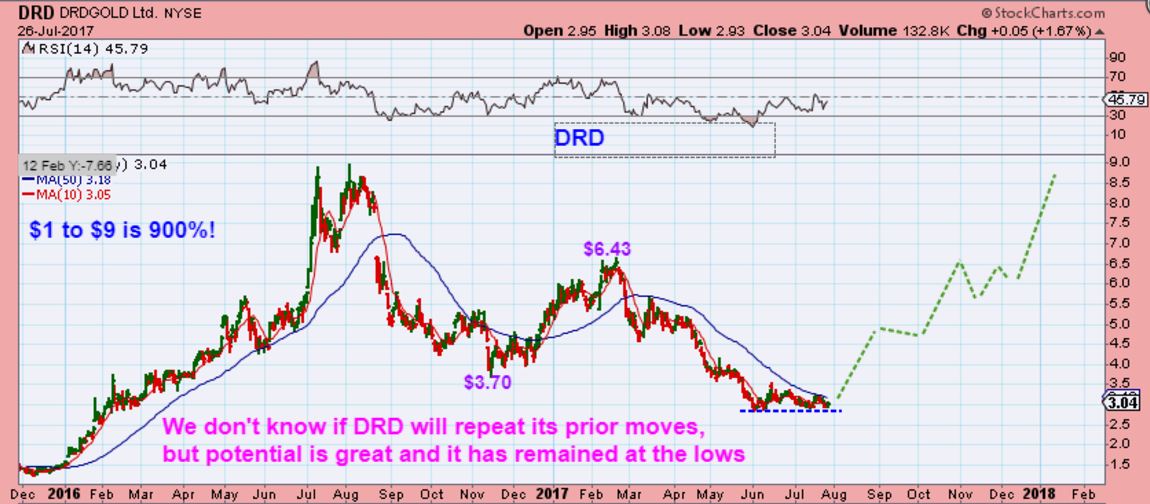
DRD – I pointed this out DRD was still at the lows last week. CAN DRD BREAK OUT ABOVE THAT 50SMA?
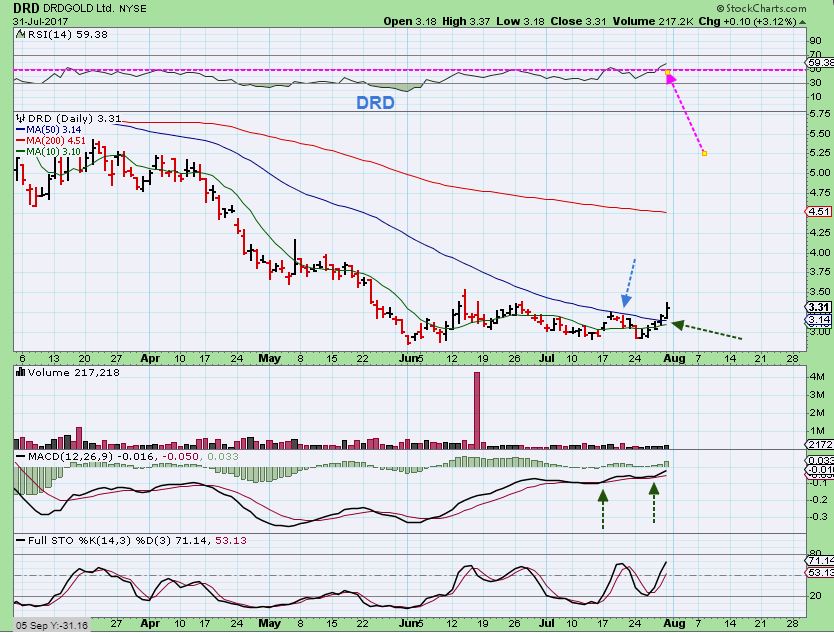
DRD – DRD did break out above that 50sma. If you dont own it you can watch it and see if it back tests that 50sma for a buy, or just go ahead and buy a partial position here and add if it drops later. This is still in a base, but should break out if Gold moves higher.
Along with these bullish sectors, take a look at some of the shippers and you’ll see that many are bullish too. Oil & Energy stocks also seem to be lining up now too, so I’ll be cover some of those in future reports if things remain the same. As I have mentioned in the past, sell offs and consolidations like we experienced in April and May are difficult to trade, they are choppy and frustrating. Eventually, they may form bullish bases and begin to trend higher, and that is what we are seeing in some of these sectors now. Commodities bottomed a while ago and charts of the ones that we have traded ( X, CENX, FCX, HBM, TGB, WRN, etc etc ) have now been trending higher. I am hoping that more of the Precious Metals stocks follow this pattern too. Enjoy your Tuesday trading!
~ALEX
See NMM, SB, TNK, SALT for a few examples of shippers that are bullishly aligned.
WEEKEND REPORT JULY 29 
 AUGUST 2 – A Dull Gold Market?
Scroll to top

VLO, another energy stock, had earnings last week and surprised to the upside. Volume picking up, could be getting ready to move higher.
https://www.tradingview.com/x/9AC57eh7/
I can see VLO as a very nice bullish pattern looking at it in a couple of different ways. Looks good bill, thanks.
I am in Parr – similar refinery business but with earnings due on the 7th. Was hoping for more of a cushion so may have to rethink this one
Could someone recommend a low cost simple chart to use
Doesn’t your broker have charts available? Both my Options Express and Merrill Lynch accounts have charting capabilities. I am not a master like many here, but I managed to have a basic chart with the moving averages Alex likes so I can follow along. Some people use Stockcharts I think.
I use “Missing Step’ Stock signals. Check your App Store. Check it out. Been using it for years. Inexpensive but very accurate and continuous update on prices, etc.
TOS – very powerful and free
Great idea. I’ve been using it for years.
Dont you have to be a TD client?
Hi EJ- I’m late to the comments section, and I see good advice belo.
You mentioned low cost and simple charts, but there are free charts to use out there
as mentioned below, and they are good. You can make them simple or complex.
Stockcharts is a good one. Look at the very top right hand corner of every one of my charts in todays report. 🙂
Stockcharts.com has some simple free charts and low fee for the monthly charts.
Just hourly and weekly charts, unless you pay. Not sure what their fees are.
funny action in RGLD at the bell. a 2.7% drop on volume in the 1st minute and then recovery. What is that??
Yeah… I see n news either.
BTE came out with good report today – I have some but would like to get more…just watching it for now – was up a bit but now falling some….
And BTE held above the 50 sma. Thats a good sign that the worst on many of these is over.
Earnings coming up this week …please correct if my info is incorrect. I researched this over a week ago.
Aug 1: BBG, BTE, GSS Aug 2: KGC, TGB [after] , GPL Aug. 3 AG, HBM Aug.4: SWN Aug.4 [est.] UUUU
Thank You for this info
SHOP reported today. Up 11% and xbig volume
Go gold!
Look at LODE!
Wish I had bought a lode
Well – I wish that too lol but because of you – i bot a bunch of IAG – so thanks 5-O
Great! I think I sold mine about a day too soon.
IAG looks very good BT- I like that set up for a break out sooner or later
I wasnt paying it much attention and then Hawaii mentioned it. I grabbed a really nice bunch of shares after hours (someone gave them away at 5.20) Next day we hit 510 so I was like, great…. and then.. well the next 3 days have been great lol
I have been posting IAG with RGLD as the leaders in this sector.
Neither one got hurt in the sell off.
Look at a long term chart
I did – and I havet really been too excited with miners lately – jus tleaving sour tastes in my mouth so every time I saw IAG or something, I sorta skimmed it. Shoulda paid more attention to that break and backtest of that wedge at 5.00ish..
Honestly I dont know why it did so well on that entire sell off period, but someone must be accumulating and knowing something? This one MIGHT be one that you dont want to sell, but then again, earnings are always the wild card ( Next Wed Aug 8th , by the way).
I saw that , since you mentioned the volume yesterday.
Isn’t it funny how, more often than not, the volume signals something before a big pop or drop.
I suspect insiders or inside info…I am cynical.
I suspect Crystal loading up and then announcing it here- lol
Resistance is resistance until it’s broken – the suspense is killing me
GDXJ daily chart https://uploads.disquscdn.com/images/dd2b351f2ac7859f2911662e38189d9e2c319268f0d976dfbe9257079023c8bb.png
Considering the big run in oil, OIH didn´t do so well. I will have to wait before getting involved in energy, though it´s an area I like longer term. Perhaps if the market corrects, these energy stocks will get smashed one more time?
Regarding my miners, I actually trimmed a few. I want to be heavy, but again the miners didn´t show a whole lot of spunk coming out of oversold, and now my technicals show them approaching overbought. I don´t think these will get smashed like energy might, but no need to sit on profits when they are going nowhere fast, and I might be able to get them cheaper in the near future I am still long, but only 30% invested now. I will be loading up at some point, just don´t feel they are ready to launch, especially considering how many newsletters have now turned quite bullish without even a sharp move higher. I don´t include Alex in that group, as he was bullish before the recent drift higher. Good going, CF.
That was a good “thinking out loud post”.
I dont disagree with lightening up a bit if one went in fairly good and has gains to collect. We will be entering a drift or drop into a DCL at some point , and that will be the next good buying opportunity.
As for OIH – I agree. It really didn’t break out like XLE did ( down trend), so I am cautious on the OIL / ENERGY stocks, unless they really show me some proof that they are bullish and not just bouncy.
Good point on the XLE, I shouldn´t only focus on OIH (drillers).
Alex, thanks for the analysis of NASDAQ. I am watching the same thing with TQQQ. I stopped out of about 2/3rds of my position yesterday at $109.74. The reason I didn’t sell sooner is I thought there might be a fast recovery like the one after the slam down on May 17-18. Unlike May, there have been 3 sideways days since the dip so the odds favor a continued DOWN trend. I have set a stop for my remaining shares at $108.80 which is slightly below the lows of the past 3 days. TQQQ is a “sell” on my daily chart but it can also trick you and whipsaw you out of of position and take off higher so I set stops to hang in there in case it keeps going up. As I posted previously, this is why trading TQQQ is harder than it looks on a long-term chart. TQQQ is up 73% YTD. It would be awesome to “set it and forget it” … but the gut-wrenching dips are hard to handle in real time. The problem with being a “trend follower” is I never catch the bottom or get out at the top, I just try to get the bulk of the middle of the move. I had hoped that TQQQ was on a 1-2 month rally similar to the beginning of this year, but the rally from the July bottom lasted only 3 weeks. I will make a profit of about 9-10%, but less than I had hoped. I’m still very bullish on stocks longer term, and I’m planning/hoping to buy back in lower, preferably on a tag of the 50 day SMA or close to it.
Meanwhile, I have a good chunk of JNUG to ride the miners. JNUG is still a “buy” on my daily charts despite struggling a bit to break out higher over the past couple days.
Good trading to all!
Hey Steve- yes, I am looking at QQQ and asking myself, “Is that a Bear Flag?” I think we will know in a day or two,
but it does look to me like it wants to at least drop to the 50sma. Then we either have a 1/2 cycle low possibility, or we drop further to a dcl, and that could take more time. So at this point I am staying away fro TECH until I get a clearer picture.
Its funny, Look at IYT ( And that it kind oif what I think QQQ wants to do), but then look at the DJIA ( new highs) , and SPX – near highs. We have a very mixed market.
RDFN killing it
Is that an IPO? Or is my chart messed up.
NUGT has been outperforming JNUG lately, the JNUG re-balance has apparently eliminated the advantage of the “junior” miner ETF so I may change horses moving forward if this trend continues. I like the 3X ETF’s becuase I can have a good position in miners without tying up a huge percentage of the cash in my portfolio. For example, if I want to have 50% of my portfolio in miners (GDX/GDXJ) I can invest only 16.6% of my portfolio in JNUG/NUGT for the same exposure. Yes there is decay in 3X ETF’s vs the regular ETF’s but I never hold long enough for that to make much difference. Miners are always a relatively short-term trade for me (weeks to months) .
tx chotfreak… :o)
danggg NGD looking niceeee …..
https://www.tradingview.com/x/iwIO82Jq/
and SBGL … #RoseColoredGlasses
https://www.tradingview.com/x/jJFzLuva/
Do you own all those stocks #HB?
No date for earnings?
Yep, another one that showed signs of breaking from a nice long base, and I didnt jump on.
C’Mon GPL – Take a lesson here 🙂
im stalking that and MCOA, TRTC, GRNH, GRCU, etc.. what ya think of those mjs … time better spent elsewhere….?
Actually, MCOA looks pretty good, and GRNH is riding right along that 50sma. Easy to take as a low risk entry & easy to know where to sell if it drops.
I liked CNAB & CNBX too
The hard prt with these is knowing when they are ready to go. They can consolidate for a week, a month , or forever it seems.
hmmmm .. .. well.. i set alerts and have them on watchlist…. those things can movvvveee…
tx daddddy …
https://uploads.disquscdn.com/images/1108b3acdb27f3156f0ae9199137a6ae7f9b7425a422fec8cf95d77e84525e06.png
Move like a 9x Etf 🙂
Holy DNR following that pattern… sheeesh .. here it is on the 15s — if anyone gives a … hoooooot 😉
https://www.tradingview.com/x/SweevzIB/
DNR not a buy on my charts, but SBGL sure is
well.. ive owned dnr …look back when i posted it
picked up SBGL added NGD
anything else….no im not giving u my measurements….
MEOW … Tshhhhhh
LMFAO
Don’t encourage her!
https://uploads.disquscdn.com/images/02ccf2903a8664b8a58716f3326a48fda5dd3a83041df2ec17993de39e7a2e75.png
whered u grab NGD? I didnt get an entire fill but tried adding at 3.40
oops… sorry.. i lied… no fill
I have a lil’ bit in RVP… look at the 1 yr chart.. https://uploads.disquscdn.com/images/73dcec5072e10ab6a165fa4c516da69a1310e13d3304d1845135e50bb8875f8b.png
Beware the bear flag!
I’ve been away since 10 a.m.- Just got bac and scrolled through a few things….doesnt really look like I missed very much.
I’m going to run through the comments ( only 33 , so it is a slow day), and look at some more stuff.
CRAZY move in RGLD today.
IAG looks like it wants to break out & run. It is a nice set up.
GPL broke, but couldnt get run away traction : (
Right now, IAG is my only Miner thats kicking butt. The others are waving at me saying not today bro, not today
NXE did have the follow through that I expected, so I took a look at UUUU.
It has been Pushing on the 200sma for a couple of weeks and looks like it wants to break through too 🙂
Yes please….so boring waiting.
CF – what u think about YRD?
It depends on how it closes today. AT times those drops can recover , but it is quite overbought and if it has any intentions of back testing that 50sma, it has a long drop ahead of it .
I added back some of the CLF that I sold prior to earnings after a big day yesterday and settling back to 10 SMA today.
MTBC looking spicy
Testing the 50sma now….
Through it 🙂
Earnings Aug 3 though
nice…..i Like spicy
how sweet would that be if it repeats that prior leg…. woooooooooosh …
Anyone have a good method for having both a limit and a stop set? Often I want to sell a stock if it gets to my upper target. For example, something in a rising channel or with significant overhead resistance. So, I’ll set a limit so if it just just quickly touches, it will sell auto. But that leaves you vulnerable to unexpected downside due to no stop. When I was on east coast I could watch during day so could exit with a mental stop. Now that the markets are running while I’m still wrestling with my pillow, this makes the decision a bit more difficult. Maybe it’s a trailing stop loss? Anyway, I’m open to techniques, thanks in advance!!
My OptionsXpress account had it so you could set a trailing stop and then set a trigger price that set it all into action. It was good when I had to be out on a jobsite painting. But Merrill doesn’t offer that option. Maybe your broker does
I don’t think so but I’ll definitely look. I may consolidate brokers so that I can get the features I need.
At Schwab I can place a “bracket order” where I can set limit sell price to lock in profit and stop loss sell price to limit downside risk. Whichever one executes first closes out the trade. So check with your broker to see if bracket orders are available.
Thats exactly what I need! Ill do the research. May even need to change brokers, but with the time difference it’s becoming necessary quickly. Thanks, Steve. You and TQQQ rock!
ASNA looking good as well
I like your humor – just went from 23 to 2 : )
Ray – Not sure if thats a joke back. Honestly most of the picks we have in here with nice bases are from massive drops. Im not here to invest in these companies, I want some trades and ASNA is above many of my indicators, MACD above 0 again, RSI pointing up. I like it for at least a few days or so.
was just a joke – first thing I do when some one mention a ticker, is look at a longer term
so saw that drop and thought it was funny – on the other hand, if you can pick up something from the bottom – that’s great – looks like a big wedge down – so that might be a good one
For example I made a nice chunk with FIT from its massive drop when it broke above the 13ema and 50sma and I sold around 5.80… 40 cents on a few thousand shares – Ill take that any day.
were all on the same team brother.. I joined CF to try and get the quick trader outta me but I cant shake it – I am however learning to hold things longer as well.
You did see the LOL, correct? : )
That was “lot’s of love” , at least that’s what my mother used to think
SPWR – Ouch
yep , the dreaded earnings miss,
but it was a great run from $6 to $11.50 over the last quarter 🙂
AAPL is rocking in the AH on earnings report. Good thing a I held onto a chunk of my TQQQ. This is why it’s hard to trade. Lots of bearish signals on my daily chart right now, but one strong day can reverse quickly and whipsaw you out of position.
Up 7 % – nice. The apple chart didn’t look too bad. It dropped right to the 50sma and held on. This open will push it to new all time highs.
NVDA chart was even better. Never dropped below the 20sma. Strong .
Just when I thought NAZ was toppy and it was ready to get that ICL, AAPL saves the day. Should open at new highs tomorrow! Hope it drags some friends higher with it!
sold JNUG 18.59 for a 5.6% profit. makes up for my last losing trade
Whoo!! I’m still holding but starting to think if I make a couple do bucks might be best to assure profits and watch for next entry!
I plan on waiting for the next DCL