Time for what? The clue is in the picture, and we’ll discuss that after a brief review of the markets.
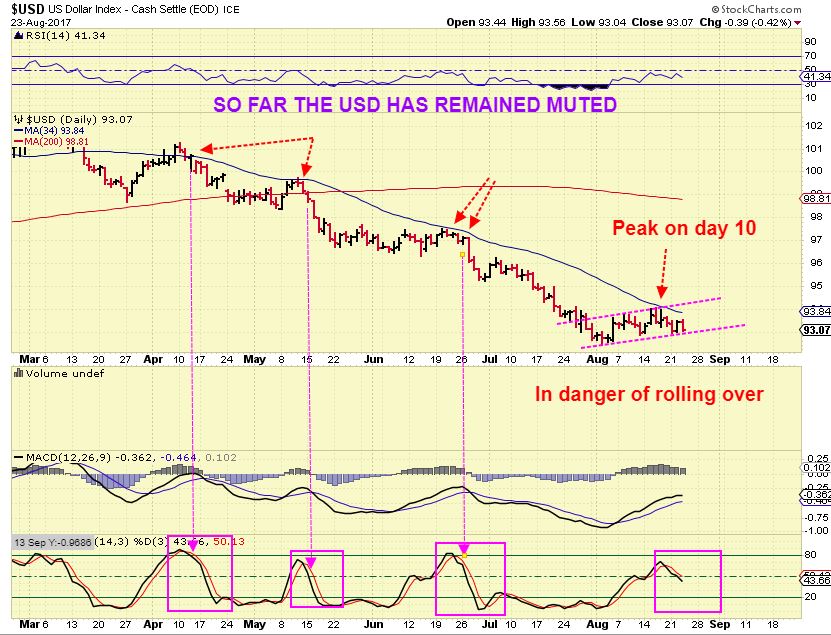
USD – We were due for an ICL and not just a dcl in August, but so far this low is acting just like the other dcls, and they rolled over after going sideways for a while. If this drops and rolls over, I feel that Gold will POP and RUN higher.
Yesterday did not change anything in my view of the General Markets ( SPX, NASDAQ, ETC).
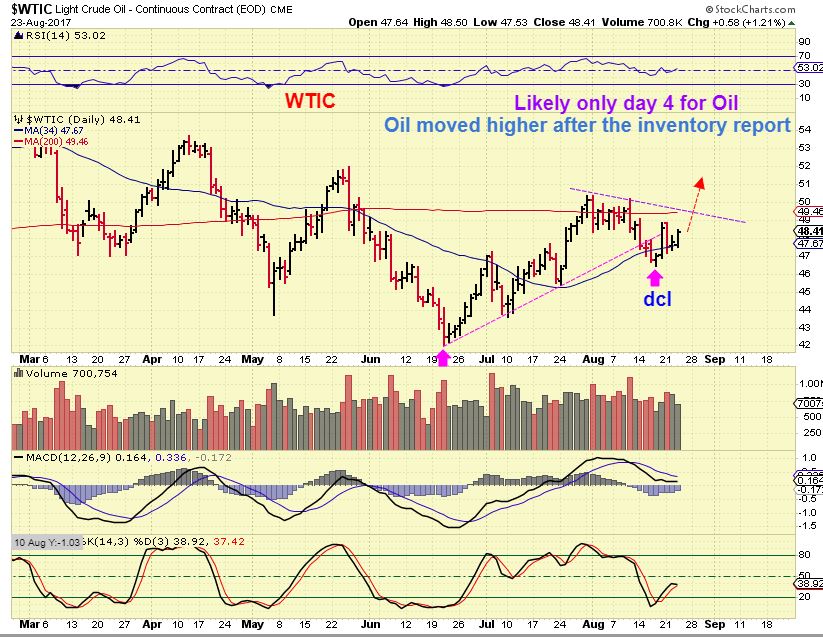
WTIC – I believe that OIL is set up bullishly. AT this point, going long OIL has worked since the June DCL, ICL, YCL. What about Oil / Energy stocks?
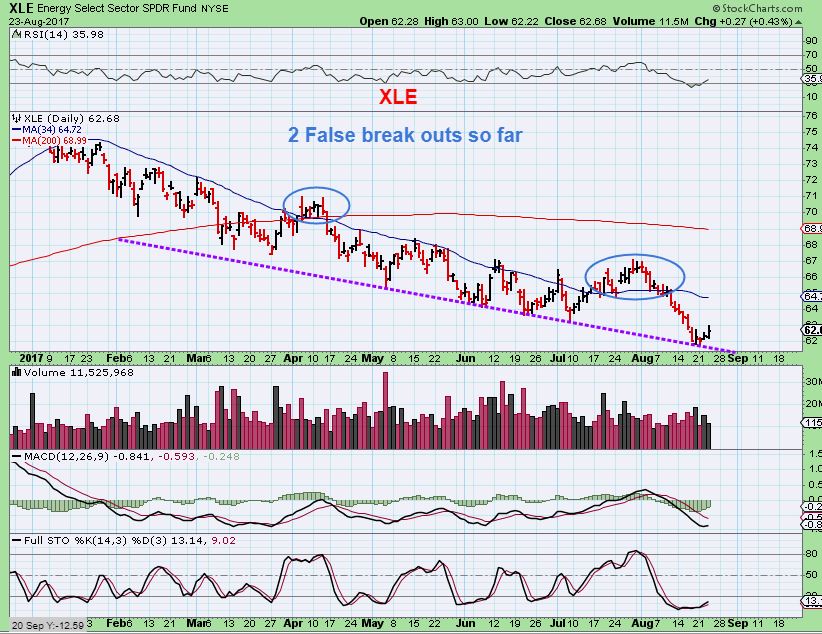
XLE – A couple of fake break outs so far. This is very oversold, some energy stocks look to be bottoming (Again), and I am not invested in this sector yet.
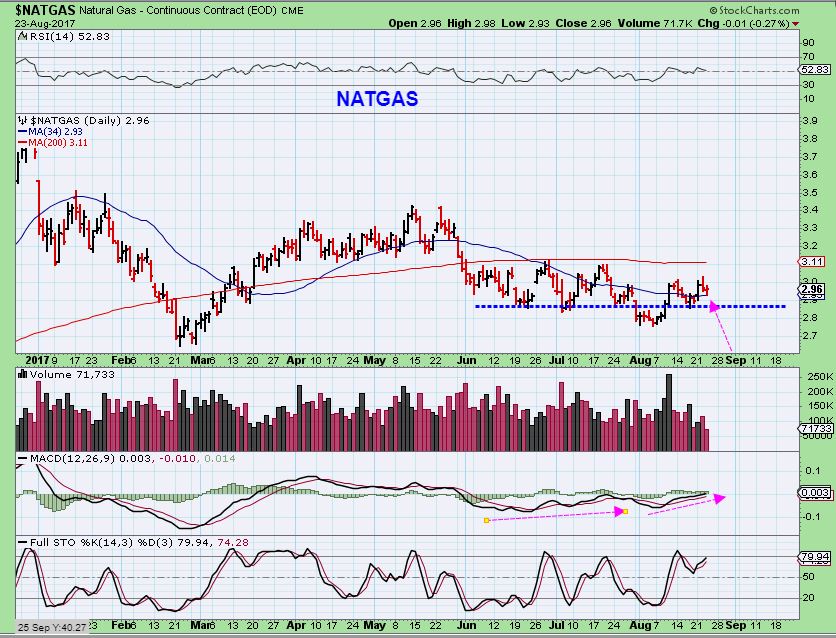
NATGAS – Inventory reports are today. Natgas has been choppy and pretty much an unprofitable trade for months.
GOLD – Gold is churning under resistance and I would expect a break out. I have explained my thoughts on Gold & the miners in all of the prior reports.
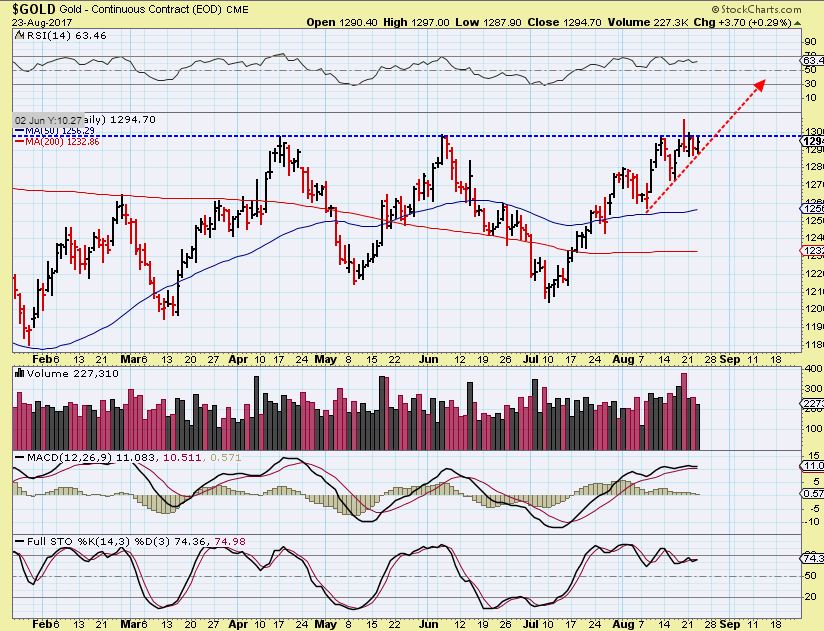
Repeat: If the USD drops from here like it has in the past, Gold could really POP.
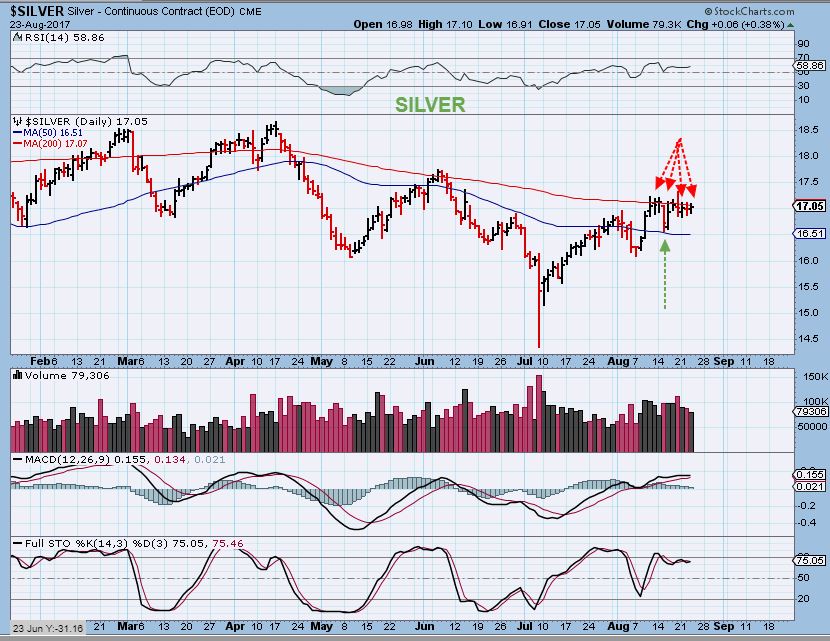
SILVER – There are other cycle guys not counting day 21 as a dcl, and they have been calling for a drop. This does not look like day 33 of one daily cycle to me, it looks like day 12 ready to break out, …
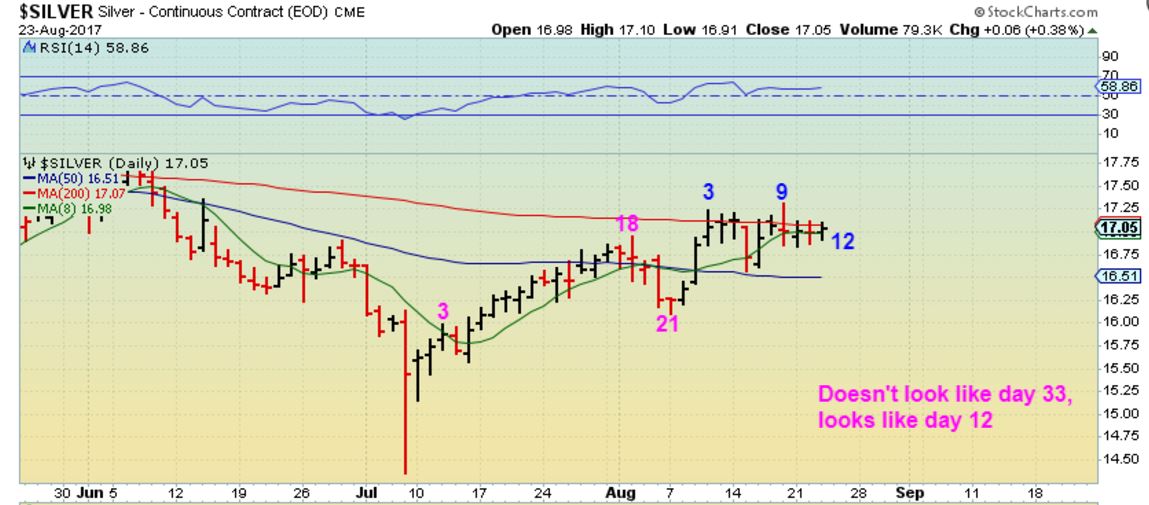
SILVER – Silver has been crawling along the 200sma, and often price does push against resistance before it breaks out.
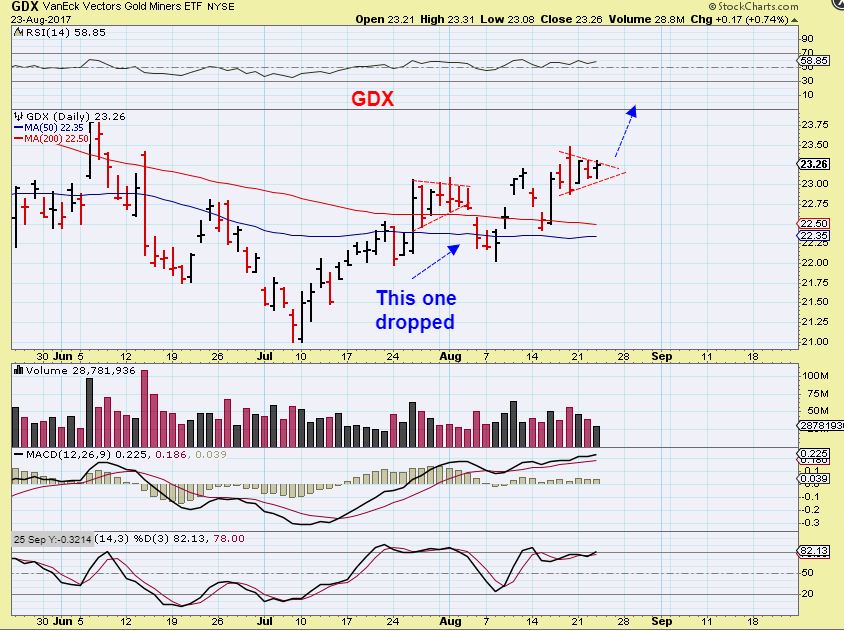
GDX – GDX dropped into day 22 after what looked like a bull flag failed. We seem to have another bull flag forming. I am long miners. I have stated, “If this is really 1 long daily cycle & now drops into a dcl on day 33, how far would it drop & stay down?” It would be a quick drop as seen on Aug 7th, but I am leaning toward a break out higher.
GDXJ – A large triangle, and I have repeatedly mentioned how difficult and boring these can be. Also they ignore cycle counts and they basically do their own thing, bullishly or bearishly. I would love to see a powerful break above that 200sma and a run higher.
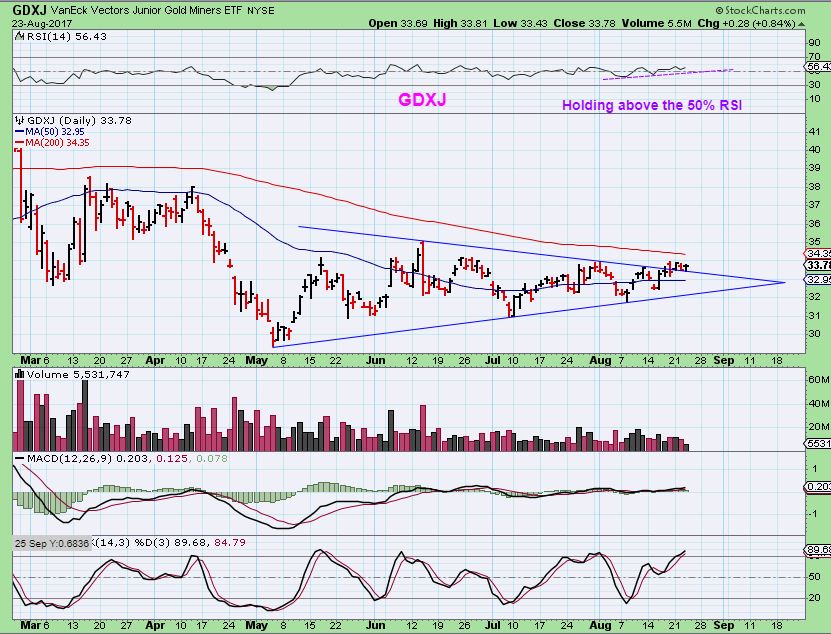
So individual Miners mentioned here are set up bullishly, and profit has been made in some like IAG, FNV, RGLD, etc, but this long consolidation phase in GDX & GDXJ has offered rather muted gains for now. Consolidations often lead to a prolonged run, and I am expecting a bullish resolve sooner or later.
SO IS IT TIME FOR STEEL AGAIN?
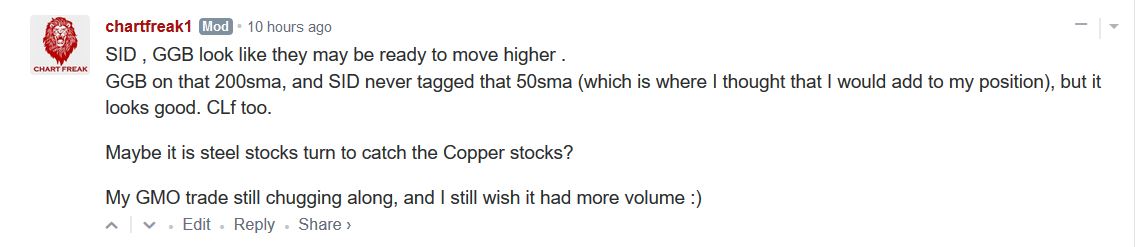
For a few days I have been watching Steel stocks to see if they would catch up to the beautiful run that copper stocks ( TGB, HBM, FCX, etc), are having. I wrote this in the comments section …
SO let’s look at a few of those stocks. I will say that they are set up bullishly, and look ready to break out higher soon or now.
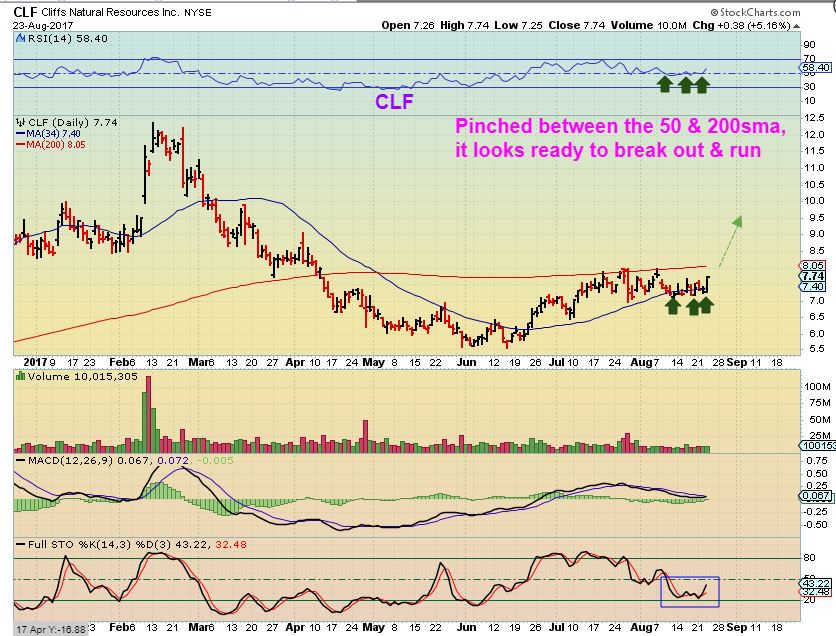
CLF – CLF is a BUY and a stop is an easy one – below recent price action. This is a bullish sideways consolidation.
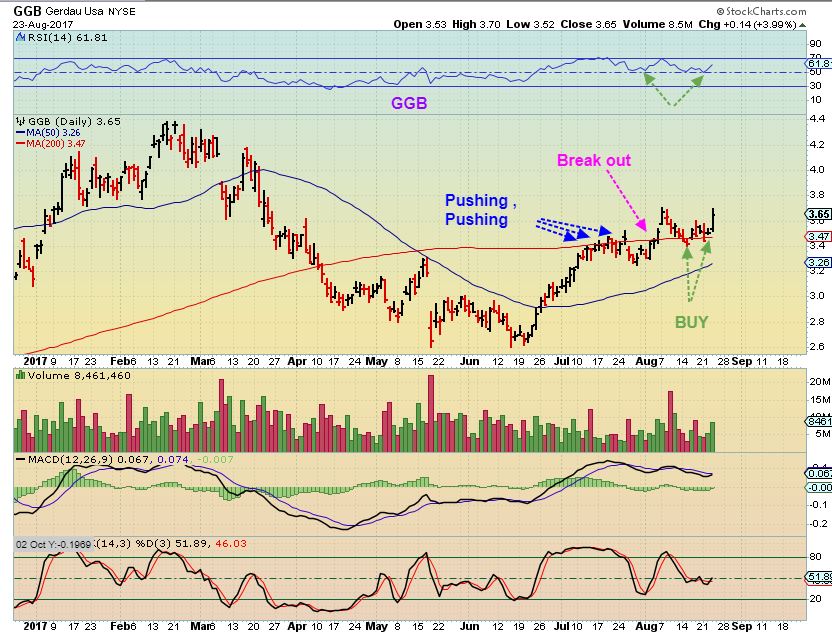
GGB – GGB is a buy as it broke out & back tested the 200sma.
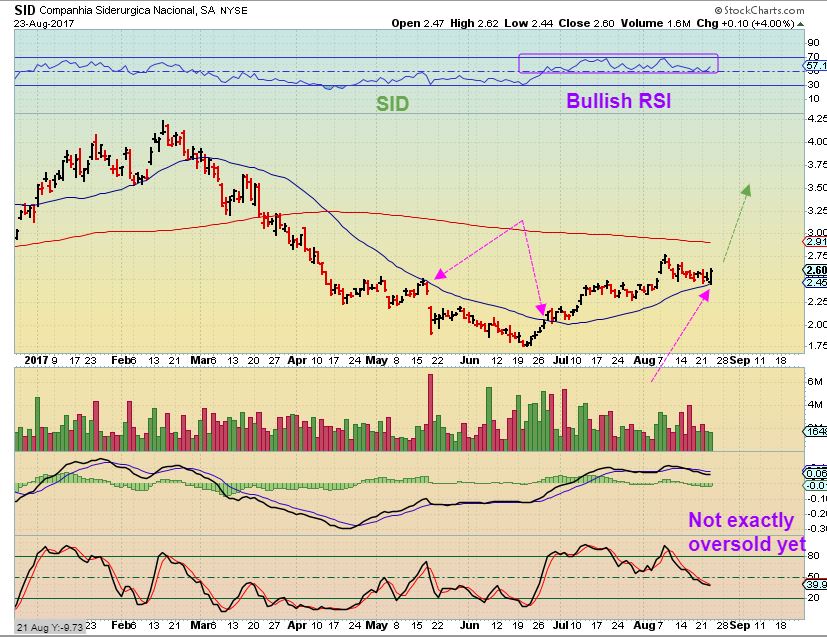
SID – SID turned higher and could be ready to go too, after this sideways consolidation has held up well. I still own it and added yesterday. It is not quite oversold, so I am wondering if it is ready right now? I still like the set up.
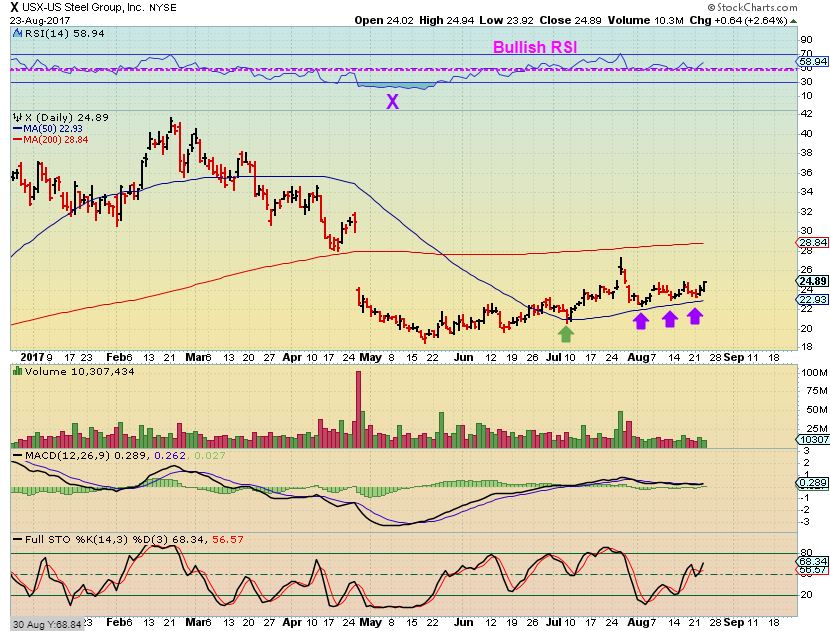
X– This steel stock has been boring if anyone was holding it, but it is not bearish at all. It is a series of higher lows and an attempt to get above the 200sma weakened, but the 50sma has held. Is it ready to try again? If the entire sector is ready to run, ‘X’ or US STEEL should join the race.
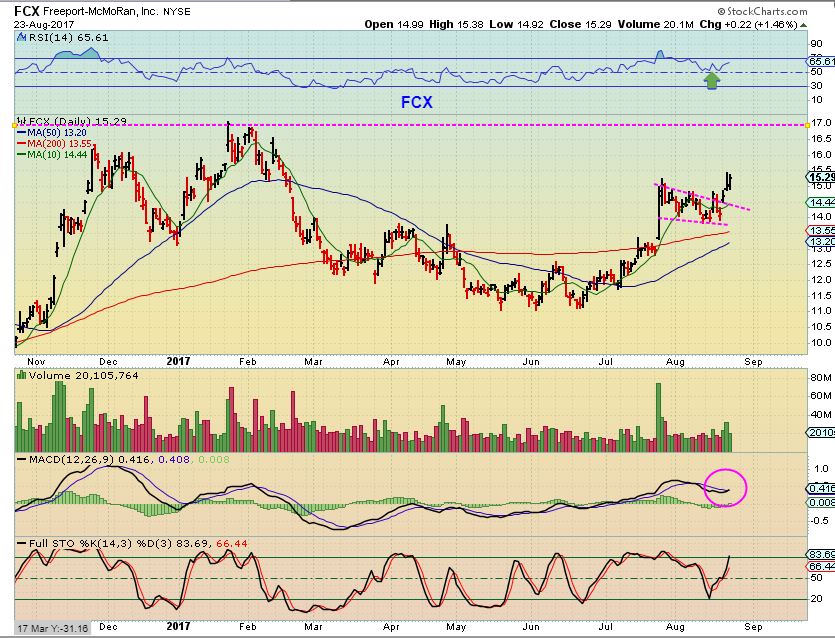
FCX – A copper stock that I mentioned days ago, I was asked by someone that owns it, ” IS there any more upside, or should I sell?”. This can run to the former highs fairly easily ( that would be $15 to $17 from here), but also the set up is bullish with that consolidation / pause possibly acting as a 1/2 way point.
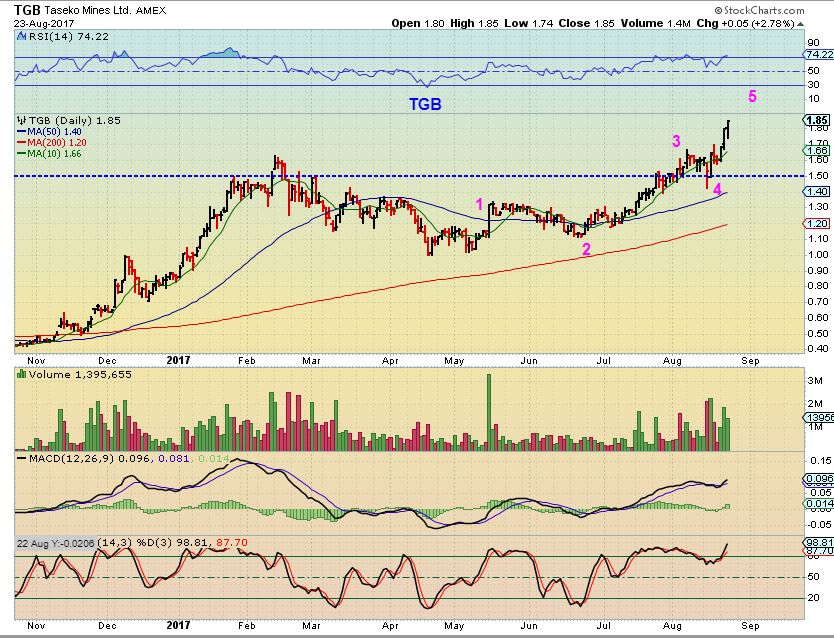
TGB #1 – TGB might have put in a 1/2 way pause too, meaning that it would try to push through the resistance on the left side ( green lines).
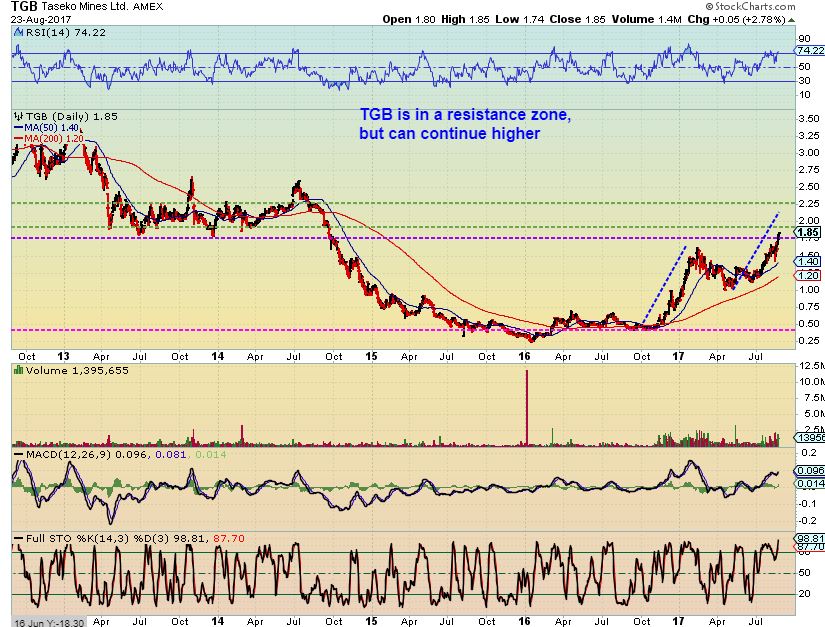
TGB #2 – I jumped out right before that 1 day dip, but ended up re-entering again at $1.70 with the big picture in view. If I look at this as a 1-2-3-4-5 type move and consider that resistance on the other chart, this COULD stall out at anytime, but with the copper stocks doing so well, I decided to hang on for now and just let it ride.
I am still invested in Miners, and the set ups remain bullish overall, but the triangle and consolidations are as boring as they get. Earnings for most of them are behind us, so I would expect some surprises to the upside as we move forward, but again, we need to get through the consolidation period. In the meantime, I have mentioned a few times that the commodities ( I’m in metals and still own IPI) look good, and some trades taken there are paying off. Enjoy your Thursday trading.
~ALEX
Wednesday Aug 23 
 August 25th – The Waiting Is The Hardest Part
Scroll to top
Thanks Alex, I was liking the GUSH chart Yesterday, almost bought. Maybe Today.
I agree Bill, it looks like it broke above the recent down trend line, and it is at the lows, so a stop would be easy to place.
I wonder why he didn’t cover the dollar…..:_D
Yes. Quite the oversight.
Wiseguys 🙂 I probably should have mentioned some steel stocks too
Thanks Alex. Speaking of GDX I noticed the 20 dma is now above the 200 dma just like it was last in February of 2016…that was a nice ride you caught back then and shared with us!
That was SO Much better than this one, but I’m hoping that we can get out of that triangle & make up for lost ground.
Damn! If MUX keeps going the way it is I might actually ride this all the way to ‘0’ with McEwen! Hope at some point he’ll feel the need to move price up to feed his kids and wife…
Nak looking good as it goes after that 200sma line.
It may just tag it and pause, we’ll see, but it has been a good move so far.
Nord – SOG – this is what drives me nuts with MTL. Opens up almost exactly were it opened yesterday giving it all back…
well theres always RTNB…. giggles
I missed it today lol
or JRJC
oh… darn .. i took RUN…
IAG… … nice
It certainly likes to retest whatever it passes thru.. maybe the 200sma this time?
Acted pretty well last year though.. sept-dec2016
Its not just testing it, its at opening for price action two days ago… More power to you if youre holding the long run, I just really do understand the moves on this particular one.. a 50 cent drop on a stock this small is rather large…
wouldnt surprise me if it backtested support at the previous peak of 5.19
I keep my eyes on the 5.15-5.20 level. As long as it closes above there I am comfortable with the stock. It may be a final “test” for those who bought yesterdays breakout. If we get a close below 5.15, I get out.
Im not in so i have no bias… I was stopped out for a loss a while ago, but the way it moves jsut confused me.. On such light vol as well.
Well Im gonna play with you and SOG here. Just added at 5.24 with a small position. Just crazy to se the backtest it made today..
nice timing.. seemed to pull away just as you posted
I was stalking it all day – I tend to stalk things CF mentions, and Nord and U taking positions (u also reminded me about it after I lost on it a few weeks back) So I took a stab at it.. Small position, noting fancy
im umming and ahhing whether to take a small bite of TRXC that i mentioned the other day.. its inching higher & higher, and now showing breakout on a 2day period indicator T/L going back to April2015
I thot u did!
it wasn’t a clear break of the indi the other day – sat right on the line.. was awaiting confirmation.. 0.78 seems to provide it.
but.. prolly buy some & then it drops back inside to unconfirm…
and it was looking waaaay oversold on the 15min chart stochs..
My guess is that the conference call scheduled for after hrs yesterday went well for MSRT ( Medical MJ)
IAG kabooom. makes me miss 5.20 entry… going to cry now
SING just had a large pop down…..good time to get more? good time to worry?
When a stock is in the middle of a move ( A sharp sell off) , it is hard to know what it is going to do next so I try to watch it on an intraday chart. 10 minute, 15, 30 60 minute charts , etc
10 day chart shows that it dropped like this before and then took a while to stabilize, so I would watch it and see if it is going to stabilize before I add anything. I would think that there is time for that in the coming days, unless it just flips back higher quickly.
no mentions for EGI today?… fairly flying along
That’s because of what it did yesterday- kind of strange
looks like it died yesterday, but seems to have recovered nearly all of it back
Yep, and I didn’t see any news. Just a quick sell and then bought back just as quickly.
And that was at the 50 & 200sma together. Hhhmmm. Shake out?
NAK pushing through the 200sma
I took Solar stock ENPH as it pushed above the 50sma after a shake out. I like what it did in July when he other Solars were running, and now I think it could head to the 200sma next
NAK pulled right back. Building energy for a nice rally, hopefully.
HTZ mentioned a few days back. Bouncing hard off the 200 again
ANF, DLTR, GES, BURL, PERY – Large gaps open ….retail being reborn??
RETL ( ETF)
JCP, SFS , TLRD, FOSL – Moving off of the lows
Sidenote: NSU – surging higher
man … HOS is that gonna take a run to the 200 ….?
It could, that is what I was thinking when I posted it in the report a while back, but since it is energy, it is now a part of “those that we do not speak of ” – lol
hahah … he who shall not be named……………..
ye who nipped me in the butt …
gold’s pullback on the 5 min. has the pattern of a pop coming soon…although I NEVER trade off a 5 min. chart..this is just an observation on my part.
Pullback to 1284 before moving higher.
RUN just made a new high for 2017 – sweet move
Hold on to that one, it has a $9+ target if it keeps running
😀
Here comes the gold ya’ll
I really like the 30 minute chart. It makes it look like that recent slam down this morning would draw in the shorts, just in time to reverse higher and break out ( please). 🙂
I hear ya. Feels like things are picking up steam! Gotta run to work now..grrr Cya, Alex.
Cya- Stay off the computers at work now, ya here?!! Dont be checking your stocks! 😉
lol .. yeahhhh
You’re a tough boss….and NAK is up over 5%…just guessing though…no computers at work. 😉
Refresh – Even GOLDs 1 hr chart has formed a triangle.
#SICKOFTRIANGLES
https://uploads.disquscdn.com/images/4554a6c0860c17cd144e6a7fd45f270779fb5cfed66c871cfc1ca0ba895f980a.jpg
ha ha
I’m watching to see if Miners start leading us out of the red. GDX just went green. Maybe leading the way
SPY getting roughed up.. I mentioned my TVIX lotto play last night in comments… up 1.20 a share
Nice
I’m seeing the upper trendline of the GDX triangle at about 23.26 today… It seems like we’ve been flirting with a breakout for most of the morning. Just need it to hit the gas and start pulling away now…
MINERS SEEM TO BE LEADING NOW
Really hitting the gas now…oh wait, I’m 11 hours late. On to trading in Shanghai!
must be soon if your patience is being tested…..
FNV looks really good on the daily
bye bye SDRL filing for chapter 11
Anyone bought uwt?
IAG kaboom, NUGT JNUG as well.
ooh ooh . oooo … PAAS wants out of that triangle….
*on the hourly…
EDXC had earnings for those interested:
CAVE CREEK, AZ — (Marketwired) — 08/22/17 — Endexx Corporation (OTC PINK: EDXC), a provider of innovative phyto-nutrient-based food and nutritional products, is pleased to report another record sales growth quarter for its third quarter of fiscal 2017. For the three months ended June 30, 2017, the Company generated $142K in sales, representing a 13% sequential quarterly increase and a year-over-year revenue growth of 237%.
Thanks Nancy!
MINERS LEADING THE WAY SO FAR 🙂
https://uploads.disquscdn.com/images/70ef30743868a2a42f0aa813b6ecafce0435f9831f9cde746e8a63a8645939b7.png
sheesh .. NSRPF
HBM IPI acting mighty fine chartfreak….
vale …beautiful …
VSLR …too
sorry I went so far back.. – My morning WL – my good buddy drafted this, and does so every night…
ABEO: In July the stock traded as high as $10.25. Then made an orderly retrace down to support at $7.00. Earlier this month it moved above the descending channel line and started its march up. Today, it popped through the previous high trading up to $11.60 before closing at $11.25. I would look to go long over today’s high with price targets of $12.75 and $15.00. Short ratio, 10.8 days to cover.
CORT: Stock has been in a nice rising channel since May. It recently traded as high as $15.60 and then formed a bull wedge. The last 3 days it has broken out of the wedge to the upside and today traded as high as $15.55, closing at $15.10. I would look for a trade over recent highs with a price target of $17.00 and then $19.00. Short ratio, 6.1 days to cover.
FATE: Stock broke through the neckline of a reverse head and shoulders pattern today. It traded as high a s$3.74 before closing at $3.67. It has resistance here at $3.85. If it can get through that then next resistance is $4.75. Short ratio, 9.1 days to cover.
FOLD: Stock had gapped up in July and traded as high as $14.05 before retracing and finding support at $11.50. From there it has been following up the lower trend line and today traded as high as $14.05 before closing at $13.86. I would look to go long over $14.05 with price targets of $15.00 and $17.00. Short ratio, 9.6 days to cover.
IMGN: Stock is in a nice up trending channel. It reached a high of $8.00 and then made a three wave corrective move back down to support at $5.25 area. Today, the stock broke out above resistance level today at $7.00 and traded as high as $7.91 before closing at $7.58. I would look to go long this stock over $8.05 with $9.50 and $12.00 as the price target. Short ratio, 5.8 days to cover.
KEM: What a swing trade. I have been writing about it since it broke out above $13.00. It is in a strong up trending channel. Today it broke into new high ground trading as high as $21.80 before pulling back to $21.73. Over today’s highs and the stock could head to mid channel at $25.00 and the upper channel at $30.00.
KTOS: Stock has made an inverse head and shoulders pattern and today broke through that neckline trading as high as $13.12 closing at $12.90. If it trades through today’s high it could head to the top of the channel at $14.50 and overhead resistance at $15.00. Short ratio, 5.9 days to cover.
SGMO: Another stock I have been following after it reached a high of $12.75. It then made an orderly retrace finding support at $9.50. Since then it has been marching its way back up and today it broke through lateral resistance trading as high as $12.90 before closing at $12.80. It needs to get through $13.00 but if it can then $15.00 and $17.00 are price targets. Short ratio, 6.6 days to cover.
VCEL: Former runner. Today it broke out of a basing pattern trading as high as $4.15 before closing at $4.10. It has resistance at $4.50 and then $6.50. Short ratio, 3.8 days to cover.
Posted in yesterdays comments all my current plays (last comment of the day)
Added another bit to BBG. Half size now 2.92 avg.
LOL- You said ( “last comment of the day”), meaning yesterday.
I thought that you mean that THIS WAS YOUR last comment of the day…and then you just kept going. haha
I got u CF… Ill shut up tomorrow.. 🙁
#misunderstoodme
hahaha naw I got u. I talk a lot here. I get lonely behind my desk at the office.. My employees walk by and I pretend Im staring at some project on the screen…
You are staring at a project. Project CF!
XCO
WMT, KR, SFM, CVS – Ouch – anyone down to catch the bounce lol
IPI doing its thing again!
GDX is up 9 cents, I’m making a killing today!!
NAK Attack!!
NAK closed above the 200sma. Nice.
Patience can pay off.
It was so hard for me to learn…
Not having as much time to trade has actually helped with the patience!!
you all shares or calls/puts?
Shares – AG, EXK, BTG, HEX, MUX SUX.
Calls – long GDX Sep calls
CF, TTWO – haven’t discussed as much recently but with NAZ “pulling back” TTWO is hitting a new 52-week high almost daily. :O (I own it)
Now thats a nice trade Cason
Yes, it broke out & has done well. I posted as a set up & break out. Once she runs, you just ride it with a trailing stop, sell where you want, look for topping action, etc.
I actually am surprised that it defied the NASDAQ Drop.
TSEM and JBL just went more or less sideways
CY & AMD ( other set ups that I liked for a tech bull ) dropped to the 200sma and may become a good buy there, if the general markets co operate 🙂
Yeah it was crazy b/c I wanted to sell 2 weeks ago when NAZ got toppy but held on, now it’s hitting new highs. The PE is pretty much unreal so I may need to take partial profits if we ever really pullback. But so far, defying gravity.
I only nibbled today as my by orders below the market were just filled here and there, but I am still looking to add heavy into a pullback. I´m up to 48% invested, want to get to 100% or even 125% if I get up enough on unrealized gains. I must admit, the GDX chart looks nice as each day we closer to the golden cross on the moving averages, and GDX dosen´t seem to want to get smashed. Bodes well for the upside when it finally kicks in. I will put the buy orders in again tomorrow, and every day that my miners stay on the recently triggered buy signals.
I am wondering if this bull move will differ from the first leg in 2016, and instead of a rocket ride straight higher it could be more of a stair step action like we have been seeing lately, and for a longer time period instead of just a 6 month rip like before?
As long as it keeps going up, I’ll take it! I do favor options at times in GDX, in which case a few tips higher are certainly apprecaited!
NAK early July false move across 200-day ended very, very badly. BUT it didn’t close over 200-day. Today it did! Will it be different this time?
https://uploads.disquscdn.com/images/a21b0557eb8d0a3ce39064879be7d8c207d762ebead083f1f42a7fcacddf4dc5.png
A new report has been released