I sure hope that it is break time! Let’s take a look at our markets after the Fed minutes were released…
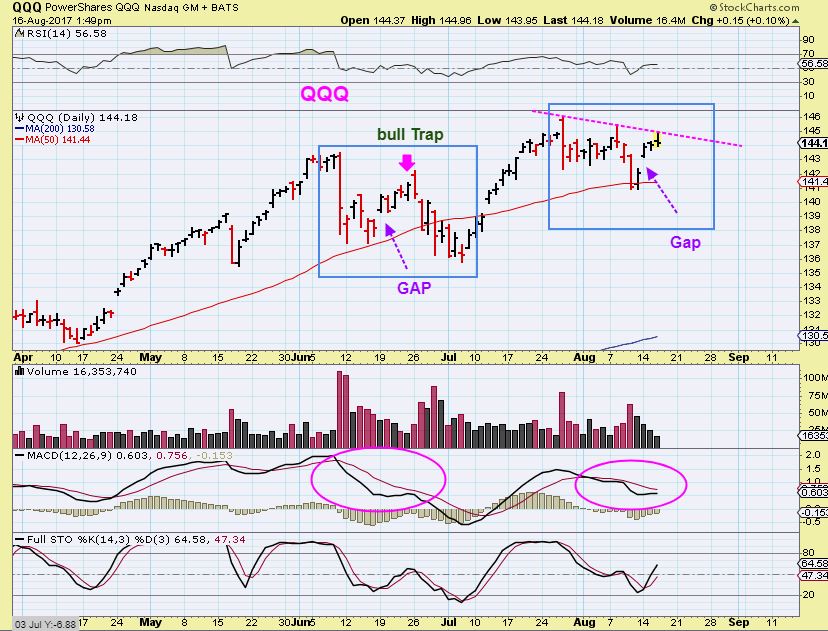
QQQ – I captured this chart at 1:49 p.m.- right before the Fed Minutes were released. Do you see similarities in the blue boxes that I have been pointing out? I don’t like that gap.
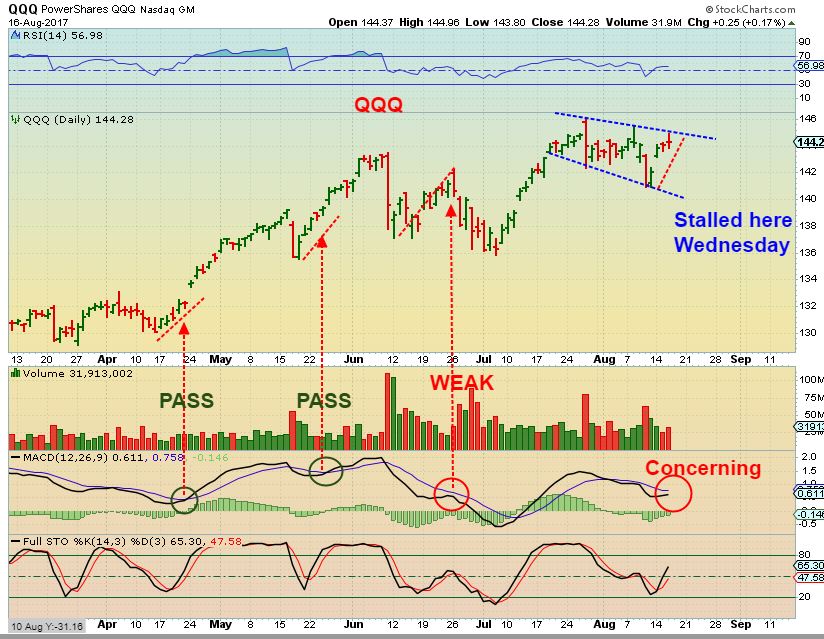
QQQ – Notice on this chart that the small rise in price in April & May crossed the MACD in bullish manner. The run higher in June was larger but it didn’t cross the MACD, and it failed. The recent run higher didn’t cross the MACD either yet. We also have the gap, and the trend line ended up rejecting price at the Fed Minutes. Personally, this needs more time / work for me to be interested.
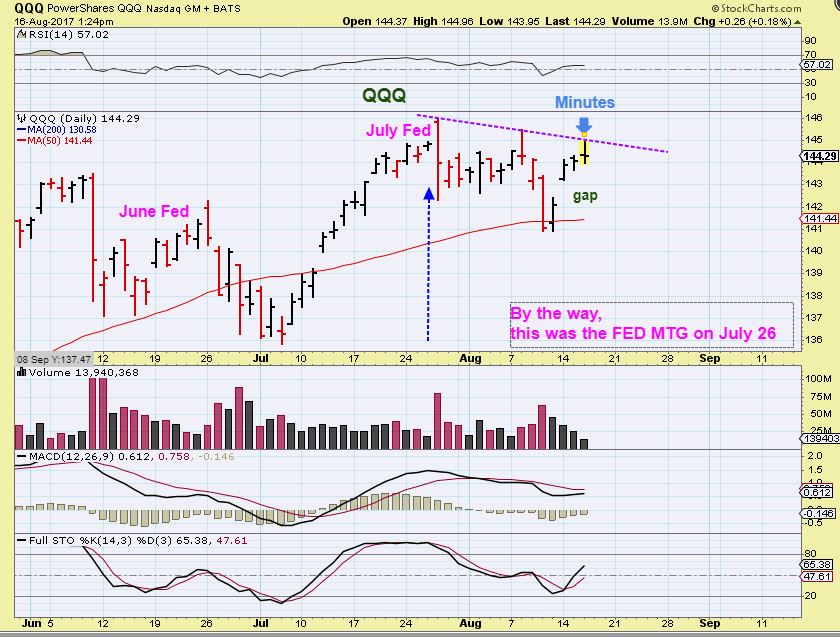
QQQ – I captured this chart at 1:24. I noticed that in July after the Fed MTG, we had that flash crash 1 day later. It actually gapped open much higher and just sold off quickly on July 27. Now we were facing the same MINUTES of that MTG, so I became cautious and it will be interesting to see how this plays out Thursday & Friday.
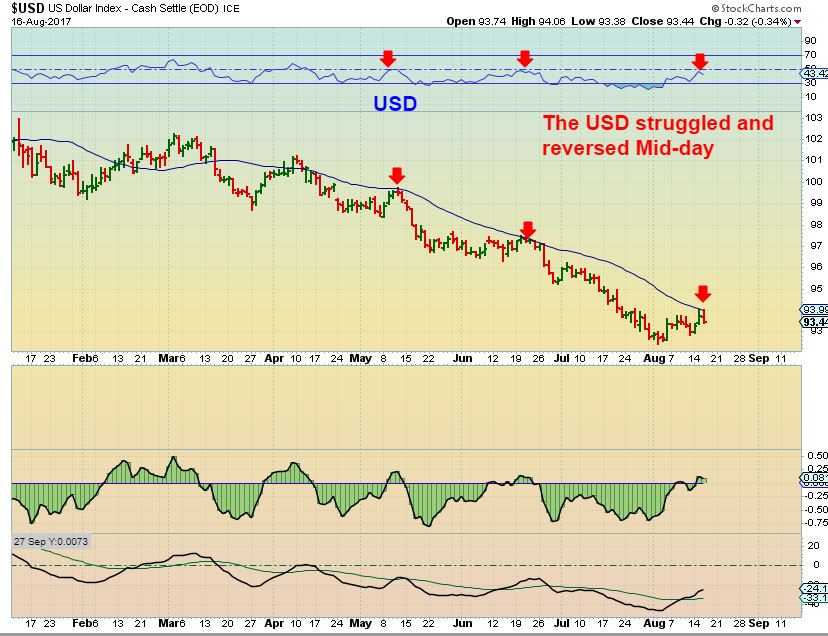
USD – Is the USD about to be rejected again? That could boost Gold. The USD dropped mid day on Wednesday, and Gold shot higher.
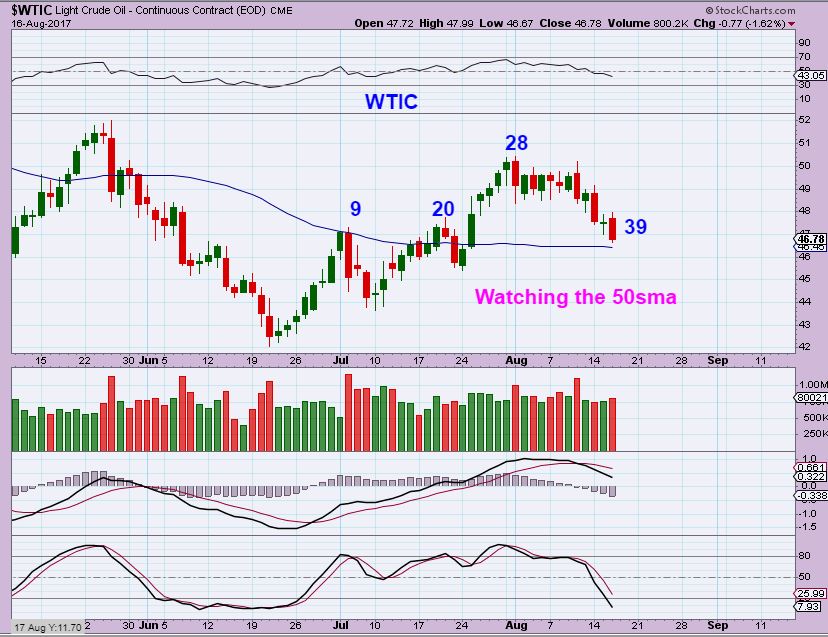
WTIC – OIL is moving along in the timing for a dcl. It did tag the 50 sma area. On day 21 & 22 Oil dipped below the 50sma and recovered, so we might want to expect that Oil could do that again seeking out the dcl.
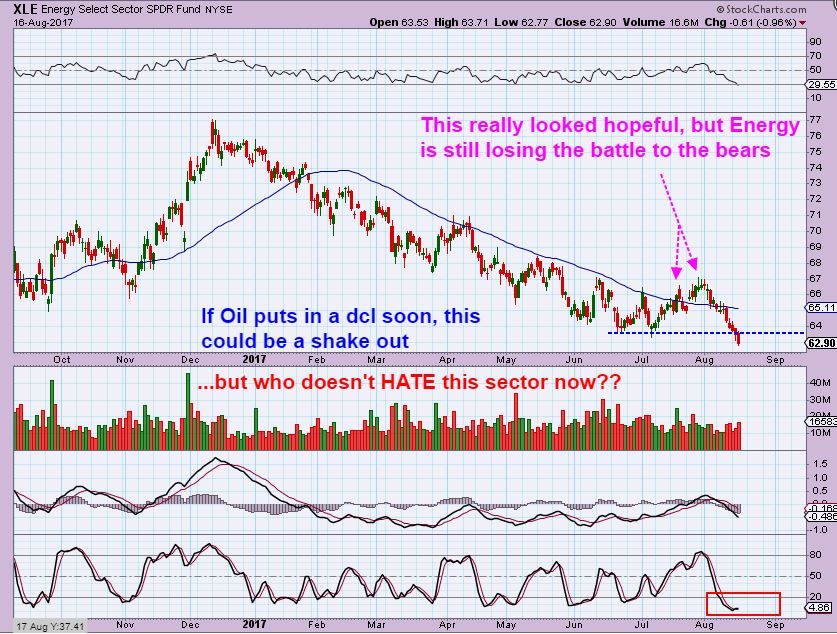
XLE- And this is a fine mess (again). I finally think that I hate Oil & Energy stocks, and I haven’t even been buying them!
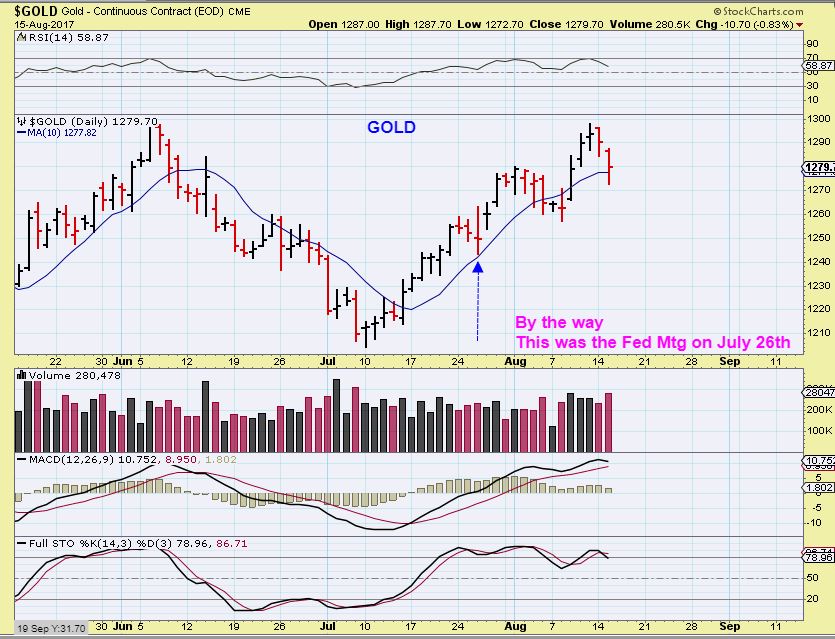
GOLD– This chart was simply captured to point out what Gold did when the Fed MTG took place on July 26. I used it in the comments section before those minutes were released to say that “Gold has been bullish after the Fed Mtg Date, so the ‘minutes’ could see bullish reaction too”.
GOLD – The ‘stockcharts’ chart for Gold was not correct, so I captured a live chart at midnight. You can see that Gold reversed and shot up higher after the Fed Minutes were released, and even had some follow through after hours into Midnight. Wednesday looks like day 6, and Thursday could be day 7 of a new daily cycle, and that is very early. I want to be on board for that reason. 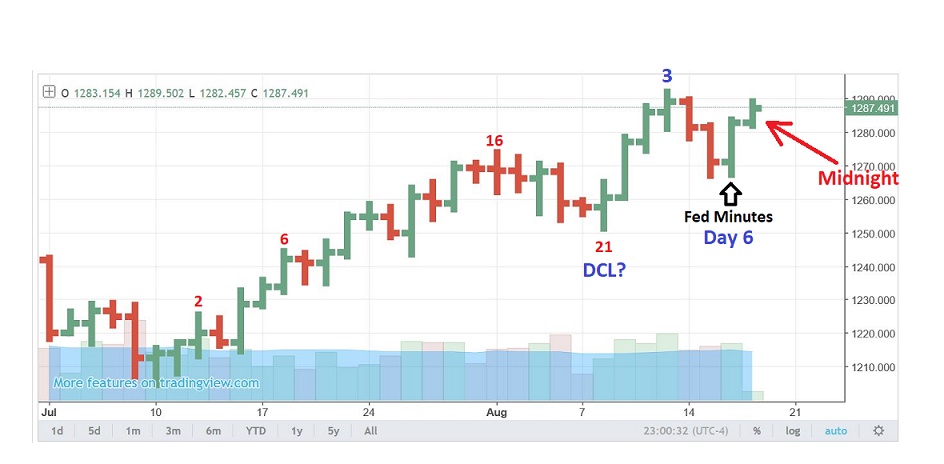
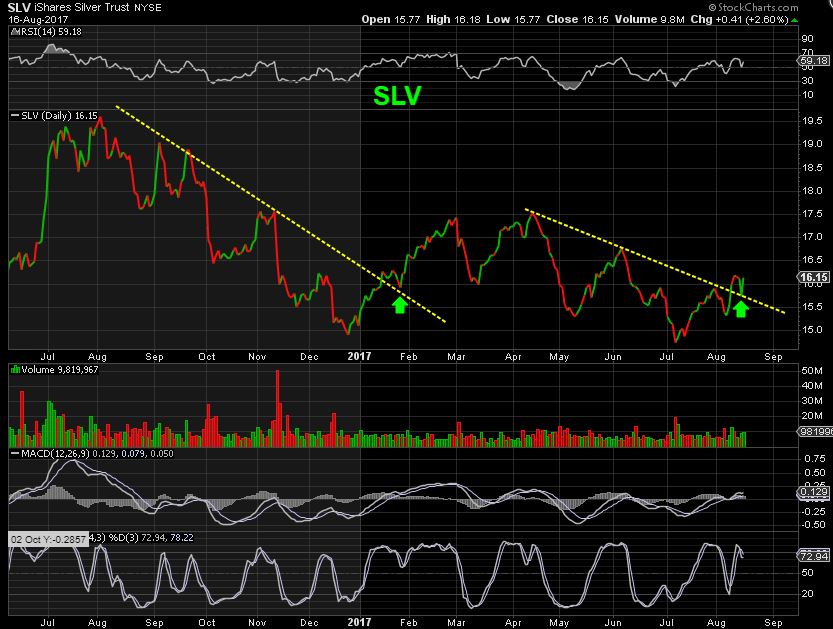
SLV– I noticed that the SLV broke the downtrend and did a baby back test on this move out of the July ICL, just like the one in January out of the ICL. That was about a 1/2 way move, so Silver MIGHT go test the April highs.
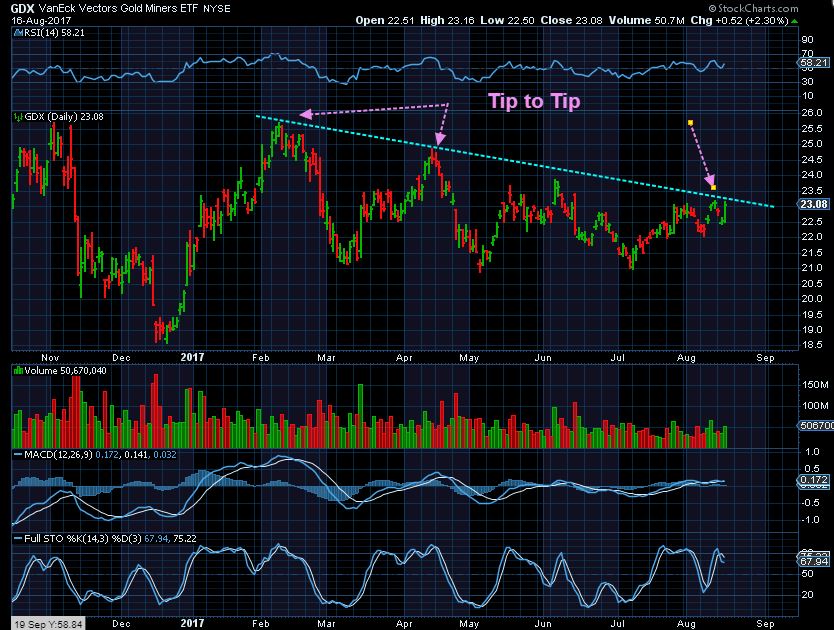
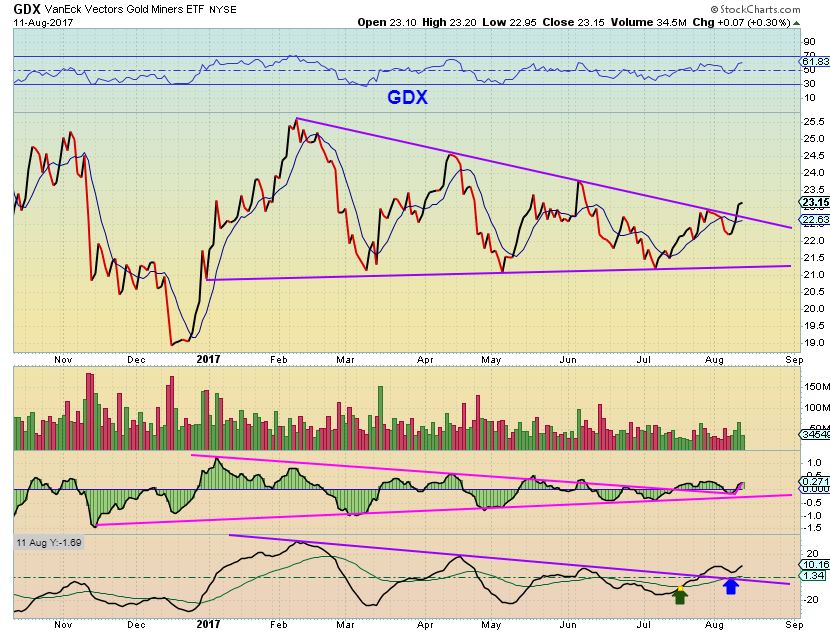
GDX– If I look at the GDX and draw a line from peak wick to peak wick as seen below, it looks like GDX is about to FINALLY break out. I have been pointing out bullish Miners ( RGLD, IAG, FNV, SSRM, PAAS, etc etc) To encourage some to take positions before the break out and to build confidence that things are lining up bullishly. Now a break out would be a strong buy, and you could use a return under the trend line as a stop.
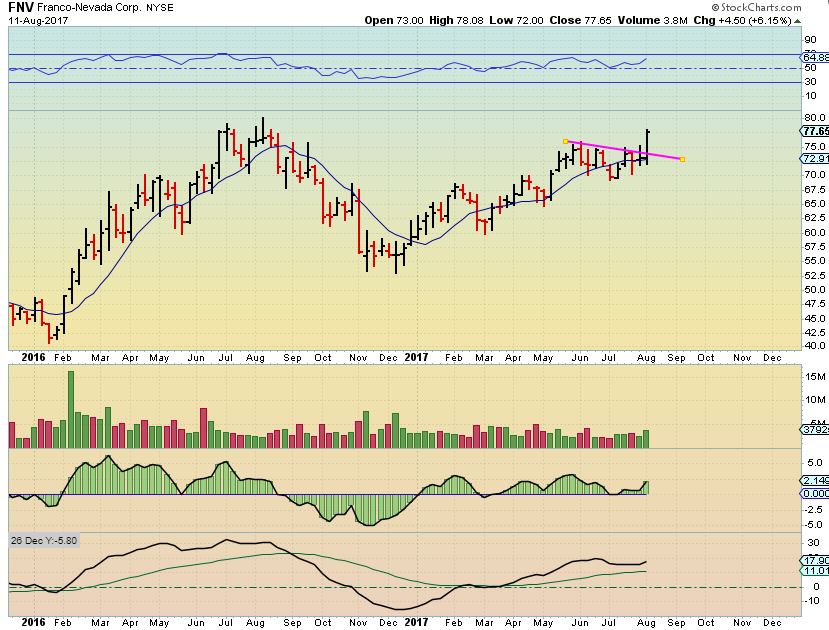
FNV WEEKLY – On August 8, FNV reported strong results, and with earnings behind them, this was a Bullish break out and the buy. I posted this along with RGLD and IAG charts. This is a cup & handle and is longer term bullish.
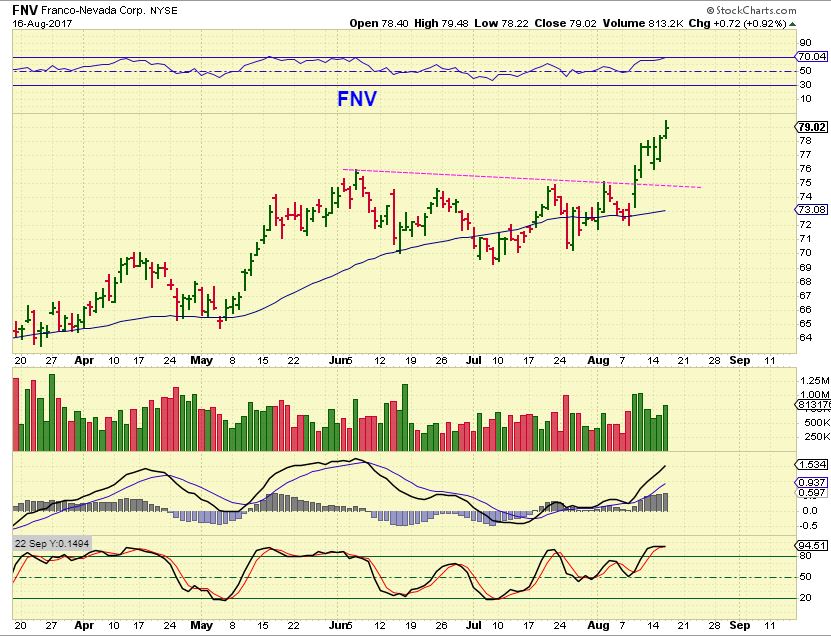
FNV – And we do see follow through now. I think that there are many bullish Miners to choose from, and the good news is that their earnings are now behind them 🙂
On Aug 11 I pointed out that using a line chart, it appears that GDX already broke out from the triangle. Imagine if it back tested this triangle on the Fed Minutes day?
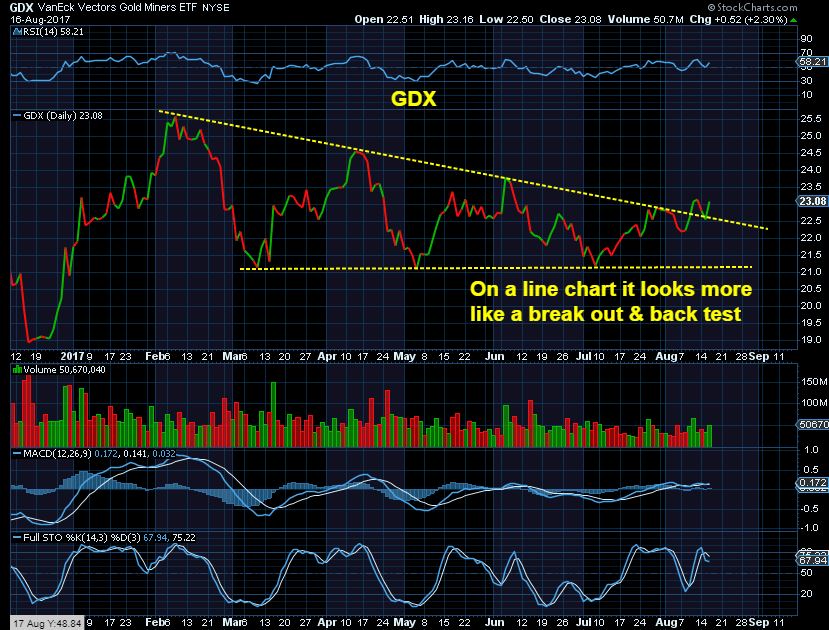
GDX– It did do a back test too. Now when I look at that GDX line chart, it actually shows a break out that already back test. That would make Yesterday the safer BUY.
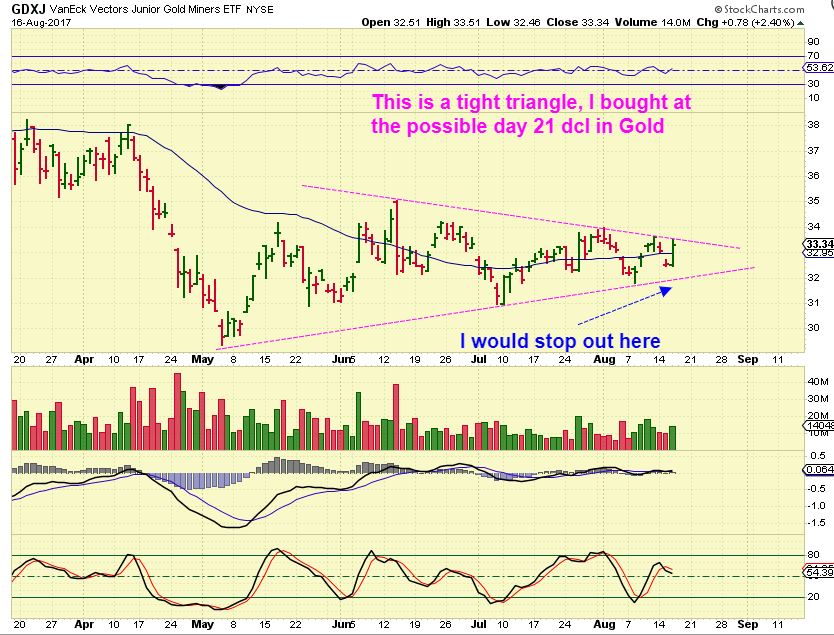
GDXJ TRIANGLE – If this breaks out, I would not wait for a back test…
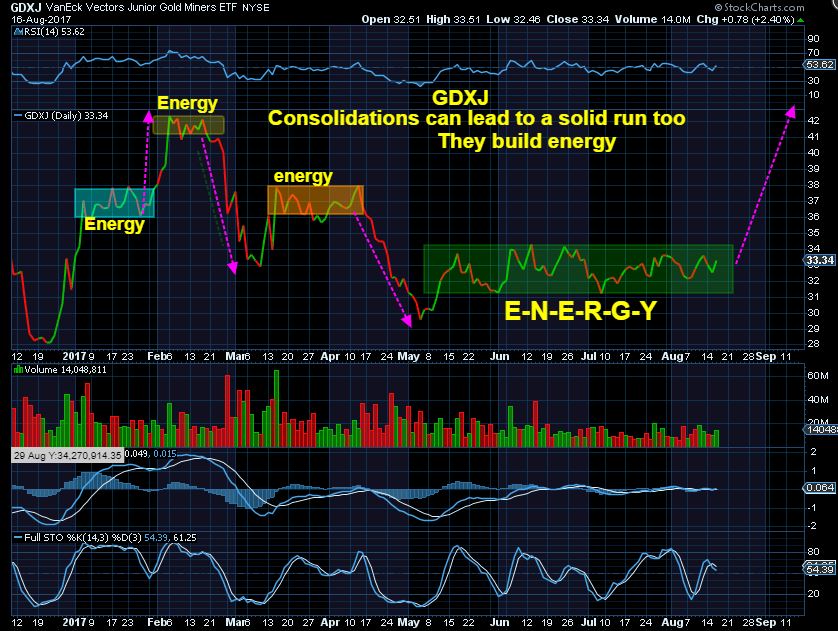
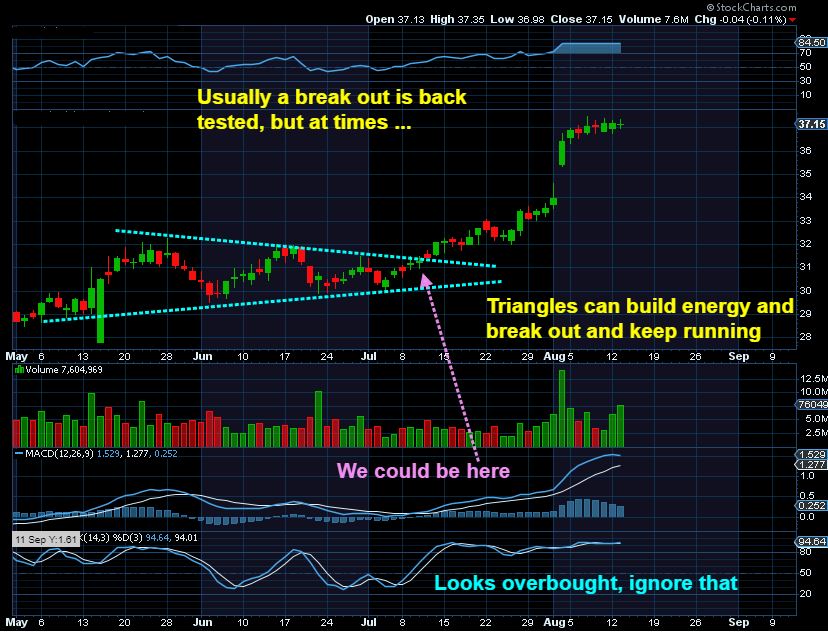
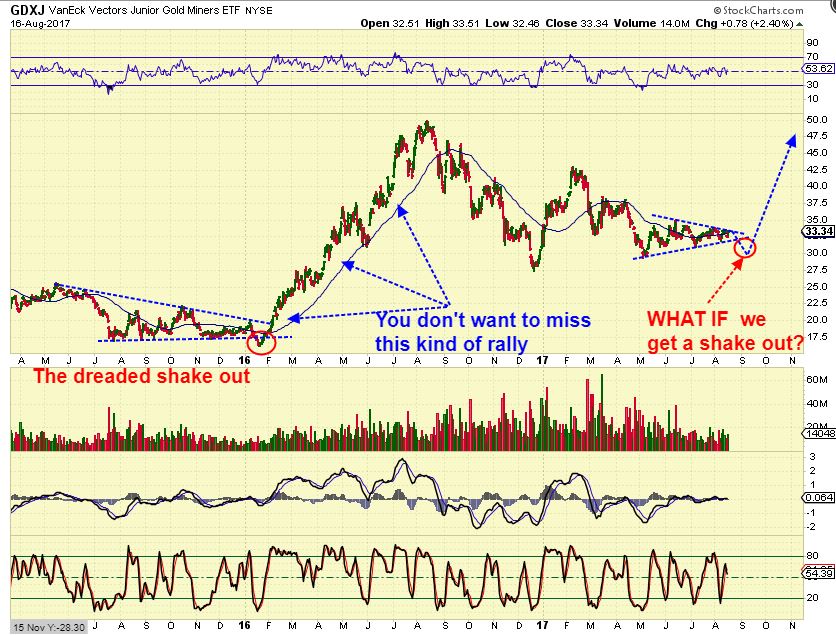
GDXJ– Consolidations build energy and can lead to a solid move after breaking free, see my examples on this chart. GDXJ could be ready to break from a LONG consolidation and I would expect a nice run from there.
I am showing you this actual triangle break out, because it did Not stop & back test the break. It hung around and looked weak for a few days, but then it took off. I am showing you this in case you are simply waiting for GDXJ to break out & then want to buy the back test. With this chart in mind, if that was my plan, I would buy the break out and add on a back test. ( I personally have been buying pre-break out) .
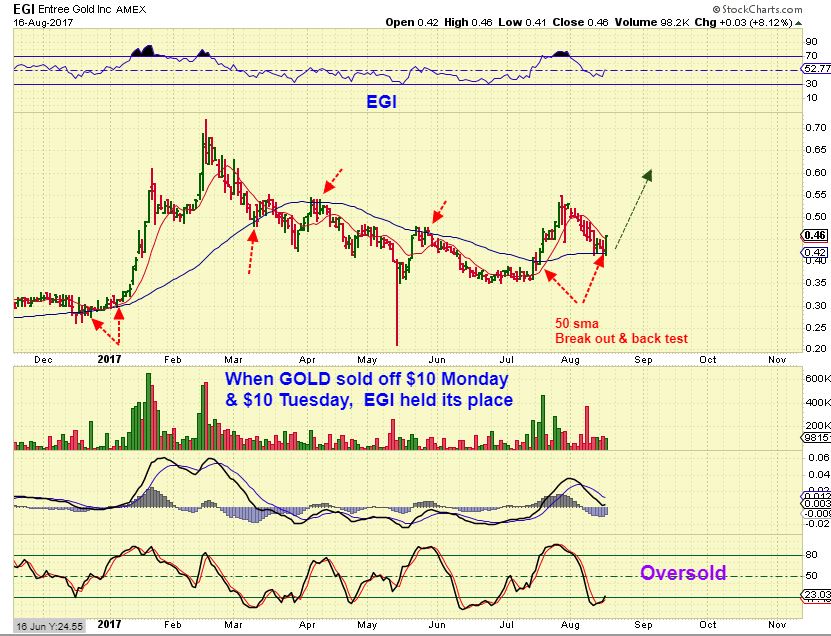
EGI– This chart showed EGI on the 50 & 200sma.
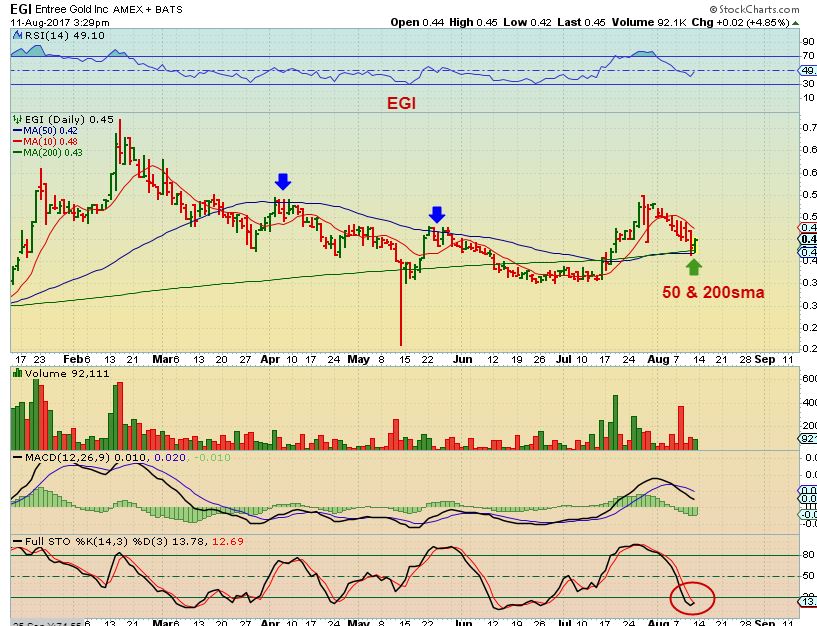
EGI – It is still there now and Yesterday it moved up to the 10sma, I think that it will break out soon. Showing that strength while Gold sold off $10 Monday & $10 Tuesday, I would say that this is at it’s lows. Use a stop below the 50 & 200sma.
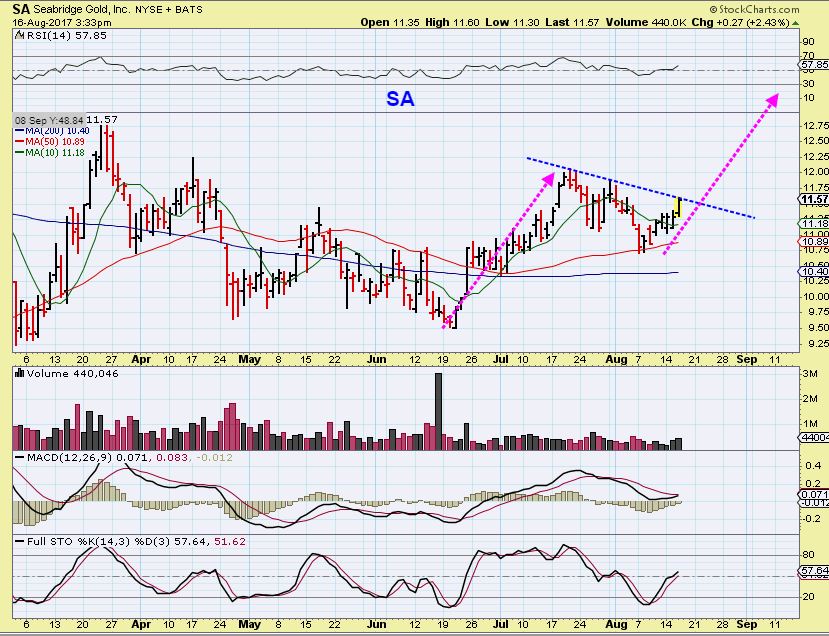
SA– I pointed out SA earlier in the week, because it was also climbing up on Monday & Tuesday when Gold was down $10 & $10. It moved higher again on Wednesday and looks set up to break out. This was the classic break above the 50sma, and back test it for the ‘buy’.
So I have posted many Miners over the past couple of weeks to show bullishness growing in this sector. Now that we have the earnings behind us, and the release of the minutes to the Fed Mtg, the picture looks more and more bullish. Now we are finally seeing the long awaited “break out’ possibility in GDX & GDXJ and that can lead to a nice profitable run higher. We’ll see what happens on Thursday, and Fridays report will probably be another small list of Miners that are set up to move higher or break out, as long as this sector remains bullish. Enjoy your Thursday Trading!
~ALEX
Things look very bullish, with many miners leading the way higher already. I was asked, ” What if we got a final slam down into a dcl and the triangle breaks down? Does that mean we flip Bearish?” I DO NOT EXPECT THAT AT THIS POINT, but nothing is impossible, so – It would probably be another shake out similar to Jan 2015, see the chart , and…
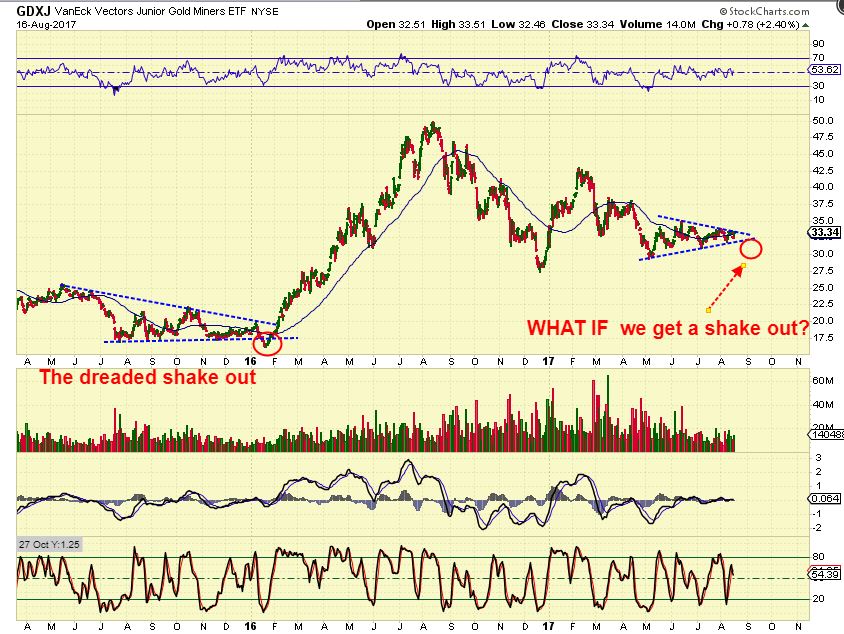
You would then can get stopped out, but just have the mind set right now that you will buy again when it reverses. MANY missed that 2016 run higher, because once it started it never looked back. We here at Chartfreak did NOT miss it from the lows higher. I immediately identified it as a shake out & we jumped in. Please see the chart, I view this as a less likely scenario, but it can prepare us for anything.
Wednesday Aug 16 – Progress 
 Aug 18th – Friday Again
Scroll to top

Clear and concise, thanks Alex. I have been adding to my miners last two days, will continue to do so today.
Thanks Ralph, I still have a bit of cash too, may add to some smaller miners ( Like EGI) and see if they get some %-Gains going. I’m not completely sure which ones I want though yet.
Gold holding up with strong dollar…. So far
nice… 🙂
… do let us know if u see something tasty…..
I am thinking this move higher in miners, if it starts sometime soon or now, could last 6 to 10 months, until we get overbought on the monthly stochastics? Any opinion on this, or expected time frame you are looking for this move to play out? I like that we have worked lower and sideways for a year now, after that big 2016 move. I am confident that even if the miners don´t rip higher immediately, I don´t think they are going a whole lot lower. The next 50% move will be to the upside, and possibly much more.
Also, would you expect a second leg matching the first, 2016 leg higher, or is that just dreaming? lol
Hey CF…could you reply to Ralph’s questions below please?
Thanks Alex. Very clear!
Hey Thx H50 – Are you all settled in your new location?
I hope the Internet is hooked up, and things area all looking good going forward.
Yes, we’re getting there. We couldn’t ship furniture because of the expense so we’re still buying some and waiting for what we’ve bought to be delivered, but we do have internet. And sleeping on a mattress on the floor reminds me of long ago college days.
https://uploads.disquscdn.com/images/abcb357b88f7a2d8858c7bdca4efa3825ab44c01e890007992f836d9c6a40ca3.jpg
Hi CF.
I distinctly recall 3 weeks in January 2015 when gold price didn’t stop going up and was surely heading back to $2000.
It stopped short at $1307.
Since then gold price has tested $1300 to $1307 a further 5 times including last Friday.
I’m starting to think that this may finally be the lasting break out.
With that many tests it should be a strong one. (Perhaps)
Cheers Phil
Good observation Phil. I hope it doesn’t bump its head again.
Hey Phil,
There is a stigma in the markets that revolves around ’round numbers’, like Gold 1200, 1300, 1400, etc. That is similar to why we were hearing Dow 10,000 and Dow 12,000, and Dow 15000. SPX 2000 , 2300 2500. Traders often sell around round numbers and cause them to be resistance areas more often than not. When they finally break out, buying can push it a good amount higher.
I remember that we did break that 1300 coming out of the may 2016 ICL and went to 1377 – then sideways for weeks. Once it broke back below it, it did become resistance again. SO yes, this 1300 area is resistance now. It may take time to get through it. Also, It is not the exact number, but the area around the round number that traders often start selling.
( See 2 attached charts).
https://uploads.disquscdn.com/images/6e47f635748cb16e8133eb21443129b205e36eadc62fdee330d88dc54432e910.jpg
https://uploads.disquscdn.com/images/2476c339ca8bf5579fb341e20d3c27d9188e506597e5c0b106515ca94d14cf95.jpg
Went long sugar.
Trade setup: https://www.tradingview.com/chart/SUGARUSD/mgGB3IC1-Sugar-long/
I see a nice descending wedge on Sugar, bullish if it breaks out. Looks good on SSG too.
well wouldya look at NAKy go
Nice break of the 50sma. I added yesterday near the open & this morning.
I added to NAK at the open, and my addition is going to be held looking for a tag of the 200sma, then I will sell only what I added today ( Unless it just breaks through that 200sma, then I hold it all)
Nak has very big volume with 700,000 in the first 15 minutes, and recently only trading 1million for the entire day
Finally!!! 🙂
PVG… nice.. so far
TQQQ update … I got stopped out of half of my remaining shares at break-even on the quick dip at the open, if I had not slept in this morning I would have moved the stop a little lower because TQQQ is currently a “buy” on my 15 min chart. I’m still in it, but much less than I had a couple days ago. Being cautious and watching it play out. I bot back the TQQQ in my trading account, but now I’m stuck in my retirement accounts for a couple days until funds settle. I knew it was risky to set my stop so tight but capital preservation is very important to me. Didn’t lose money but may miss out on a reversal today.
Miners are setting up for the drop that I expected today. JNUG/NUGT are currently a “sell” on my 15 min chart. I have limit buy orders in for NUGT at $32.12 and $31.57 Those are just “guesses” not TA price targets. Good trading to all!
Here is the pull back
Man – I was just about to post this chart with a possible buy in this area ( GDXJ Maybe $33.15- $33.25 )
And it slammed down and turned back up before I could even post it.
That was fast 🙂
https://uploads.disquscdn.com/images/566365ded728378b96468e9616e9820f3f9bcb0eb03ec59cda722c0dcfea28dd.jpg
I hoping for a dip to around $32 in NUGT which is about where the price was before the Fed minutes buying came in yesterday. We’ll see. The fact that dips are being bot quickly indicates this is indeed a bullish trend.
I was debating whether or not I wanted to add, and I thought that price would drop to that trend line and meander around, so I missed that buy anyway. I really thought that it would linger there, because the stochastics ( This is a 10 minute or 15 minute chart) was overbought.
great chart Alex! I think we may linger a little bit , but I am hoping for ignition soon
Well that was fast, TQQQ is now a “sell” and I stopped out of the remainder of my shares for a tiny loss and miners have flipped to a “buy” on my 15 min chart, so we may NOT get the big dip I was hoping for today. I bot more NUGT to add to my positions.
only 179 comments to go…..
???
to reach the magic ‘200-comments-mega-miners’ day
Oh…true…we all get chatty when it gets exciting!
LOL
UUUU back showing signs of life
I still have it….yes, life please…
Dead. To. Me.
Added back to IAG on the morning dip.. And now its right back to entry.. gotta love the fake out lol
I went into it too this morning with 1/4 position. It’s close to coming out of the cup.
I’m taking the opportunity here to manage my stops and make sure they are right and the alerts are in place.
I´ve got bid in on miners but not getting filled even into the weakness, I was hoping to see them pull in a little more. Maybe over the next few trading days, stocks like FFMGF don´t have much lower to go before I want to add.
Is AMZN really killing retail or is the consumer just weak. Take a look at LB, 5 year lows. Are women shopping for AMZN for that stuff https://uploads.disquscdn.com/images/561656300ae53e8217e491ee9a08a51c156e466e9e8763e6e85f3f42a3311b74.png
Yes, if my daughter is any indication. She got on Prime and has a steady stream of boxes coming! Also…the physical stores take returns so she buys things and tries them on at home and returns what she doesn’t like to the mall store! She is a paralegal so has to dress nicely for work, but also shops for her weekend clothes.
I’ve been trying to find a way of screening miners for comparing relative strength.
Came up with something very interesting, and for want of a better expression, I’ll call them my Magic MAs.
Cuz they ain’t no ordinary, MAs, but MAs of MAs, on a big 8day chart.. ffs!!
I show GDX as a baseline, coz it seems to sit right in the middle of the pile… but also when a stock fails my Magics™, they often drop like a stone.. see AG and EXK as examples…
if you wanna know where you miner sits relatively speaking, and how close to danger zone it is, lemmee know.
https://uploads.disquscdn.com/images/1d1d9d04134760c6a6185bca47fbe1a076c862a0f0c7d83ab6d55b6cbbbab38c.jpg
https://uploads.disquscdn.com/images/7d425145199bdb33d26c0dd3bc718cf30c2abf9af5db1a65c85b4f5885677223.jpg
https://uploads.disquscdn.com/images/6b6a0d848fa6d79a899571679090d98c0e8158c57aa843a15ebef913460b58dc.jpg
refreshF5 for charts!
If you are a subscriber to StockCharts they have something called SCTR ratings. If you check the box for full quote (under the chart) it will include this information on the chart upper table. Unfortunately a lot of the miners do not have SCTR ratings so it is hard to compare them all.
on the other side of the coin.. if they can clear the bundle with blue sky above, then can they take off like MAG in 2016…
https://uploads.disquscdn.com/images/c9f425d721c55495a35d3754b490505e8913fc80b3e6affd317c4f1b72108a0b.jpg
Looks very unlikely that miners will pull back more today IMO. They are still technically a “sell” on my 15 min chart, but the LOD is typically in by now. In NUGT I was hoping for a dip to at least $32.12 but the LOD (so far) is $32.34. I went ahead and bot some NUGT earlier today because I felt the dip would not be as deep as I had hoped and while I should have waited a little longer than I did, I still don’t think my $32.12 limit buy will hit today.
THM getting a nice move on
I just added a little more NUGT, I still have my $32.12 limit order in, but don’t think it will hit. Want to get more exposure because miners (JNUG/NUGT/GDX/GDXJ) look bullish on my daily, weekly and monthly charts. I said the same thing last week and should have stuck with my original NUGT positions but I tried to get “cute” and play the dip. Yesterday’s bounce was a day early for me, I had to wait until today for funds to settle in my retirement accounts to buy back into NUGT.
SPX just took out 50 DMA to the downside.If it breaks last week’s low I think it’s headed to 200 DMA and it may be quick.
Hope this time will not be BTFD!
qnd here is a nice big crack on NUGTa gain.. Got filled on this way down! ha. ha.
I found this tidbit interesting about tomorrow’s options expiration –
GDX has 67,000 outstanding option contracts (calls and puts combined) at the $23 strike price, which is at least three times as many options as any other strike price; therefore, the market makers have motivation to try to pin GDX to $23 into tomorrow’s close
I increased my GDX/J this morning, may have to wait until next week to see what happens next
I’m a little worried we’re all bullish
I agree. I’m drawn by the shake-out possibility in GDXJ, despite it not looking immediately likely.
Is that not because we are all following Alex though?
Indeed, but usually there are some that differ in opinion, time will tell.
a conundrum… are we the herd following the contrarian Alex.?
whats the general sentiment saying at the mo?
Here’s what I know about me, gold, or anything I buy, it hardly ever goes in the direction I’d like it to right away, there usually, almost always is a beating that I need to take before it ever goes my way. I’m more in the camp of what dialogueuser suggests. When gold wants to go up, it doesn’t wait for you, it just leaves you waiting for a pullback that never comes, right now it’s just lingering….allowing us all safely board the train…i think not.
gotta make it through 1300/oz for a believable b/o
I still see some possible bearish signs for miners, so I’m not going “all in” at this point. I had more NUGT last Friday than I do today. Waiting and watching, taking it day by day as Alex suggests.
It sure as he’ll didn’t wait for me in 2016! Yeah, this is really unusual, usually wants to take off quicker or you feel bearish.
Actually, if you look at a weekly chart of GDX/ NUGT from 2011 to now, it was the first half of 2016 that was “unusual” GDX/NUGT has been in s steady decline with brief oversold bounces along the way. January to August 2016 was a “fake bull” IMO … I”m still long-term bearish on PM’s but I’m willing to play the short-term bounces like we had the first month of this year because you can make good returns fast.
We’ll have to figure that out, won’t we? Either we re-entered the bull and this was the most protracted Wave 2 in the history of the universe or as you said the rug pulls out one more time.
I’m going to trade this but I won’t be holding a “core” again like I did 2nd half of last year.
well. I’m pretty worn out by gold after 6 years. I don’t feel bullish – just hopeful!
Oh my… 13 dead in barcelona…
Had some fun with TVIX and TZA today.. not loving the action on NUGT much..
Wow what a beat down for QQQ/TQQQ today. Good call Alex! I escaped with barely a scrape in TQQQ since I had been reducing my position size the past couple days and I knew this was a possibility so I had very tight stops to get out at break-even for all but my last few shares, on which I lost only a couple hundred dollars on a few hundred shares of TQQQ.
Tqqq 85?
Who knows how low it might go? It will be a great buying opp at some point. But the question is: When?
Stocks got whooped! It will be interesting to see how any further declines affect miners. I recall in 2008 the miners went down BEFORE the stock market did, but if stocks weaken now, perhaps miners will hold their own like today, or even work higher? I´m up to 42% invested and will bring that up to at least 50% tomorrow, and will see what next week brings to continue on the way up to fully invested.
Bort! Check out TANH on the weekly. Nicely riding the 12 week sma, backtest looks successful, and good volume today. The red cloud is a bit ominous, but so far, so good. https://uploads.disquscdn.com/images/80515c56877233b29eb50a58525a66cd8f94efe4af9a930274a3369e7c862d70.jpg
I don’t want to freak anybody out, but I don’t want to post this after the fact in case miners take a big dive tomorrow. Yesterday, I was getting uneasy holding my TQQQ overnight as I looked at the charts and saw a few bearish signals, so I decided to sell a big chunk in AH. I’m glad I did because TQQQ took a big dive today. Today, I’m getting the same feeling about my NUGT. I have bullish signals on my charts but I also see some bearish signs that make me wary and I think I may have gotten a little ahead of myself by being heavier in NUGT than I should at this time, so I just sold 1/3rd of my positions in the AH. I may screw myself over again like I did last week, but as I have posted before I’m willing to miss out on a potential big gain to avoid a big loss.
Don’t follow me! Check your own charts and make your own trades. Just thought I’d mention what I’m doing because if I come back tomorrow and say I sold a bunch of NUGT in the AH to avoid a drop I will sound like I’m trying to sound smart after the fact.
Good trading to all!
ahh whyd u have to come in and rain like that lmfao… jk, thanks for the post Steve. Always appreciated.
It may be a dumb move on my part, so don’t follow me! Check your charts and trade based on what you see and use Alex’s guidance. I hate it when a stock crashes and somebody posts “fortunately I sold all my shares YESTERDAY.” So I don’t want to be “that guy.” LOL
I hear ya.. Im never lucky enough to be the guy that sold before the crash lol.. Well see what tomorrow brings. Keeping NUGT on a very short leash. Im up on it right now with a few hundred shares, but you know how she can move and and kill hope just as fast… Have a good evening Steve
Well glad I held and glad u held on to 2/3. We got a nice little pop