IT’S FRIDAY, THE LAST TRADING DAY OF THE WEEK. LETS DISCUSS WHAT IS HAPPENING IN OUR MARKETS CURRENTLY, ESPECIALLY WITH THE PRECIOUS METALS, AND THEN I WILL DISCUSS THEM IN DEPTH IN THE WEEKEND REPORT …
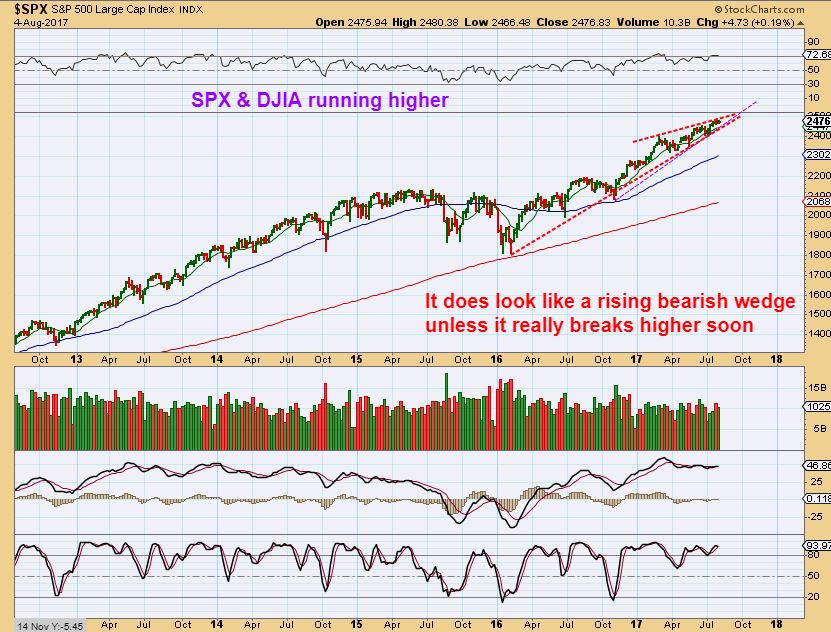
SPX– I pointed out this Bearish Rising Wedge a few times recently. We were overdue for a drop ‘timing’ wise ( DCL / ICL), but I mentioned that the markets could go a bit higher first. Be cautious.
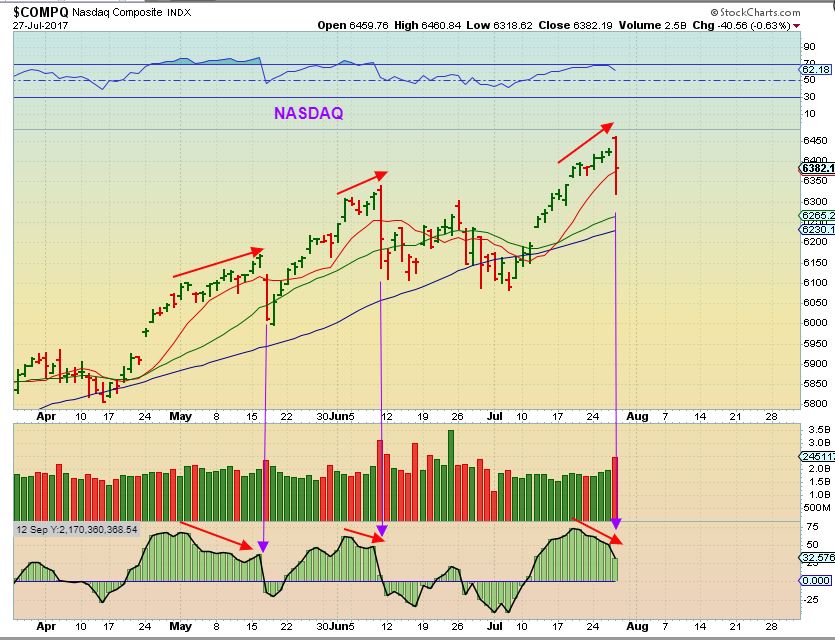
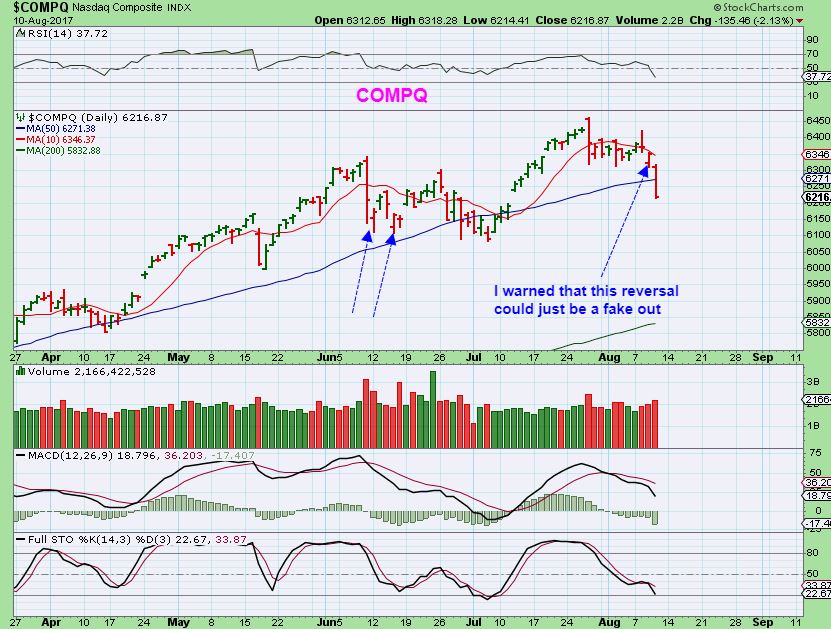
NASDAQ Weakness was evident on JULY 27th in that NASDAQ slam down.
JULY 28 – I saw people BUYING THE DIP ( this reversal) in the comments section, so I pointed out that this reversal is possibly just like prior reversals after a slam down, due to the cycle ‘timing’. It could be a fake reversal.. See the Magenta box – I mentioned that the NASDAQ may just trade weakly in there, choppy and unprofitable.
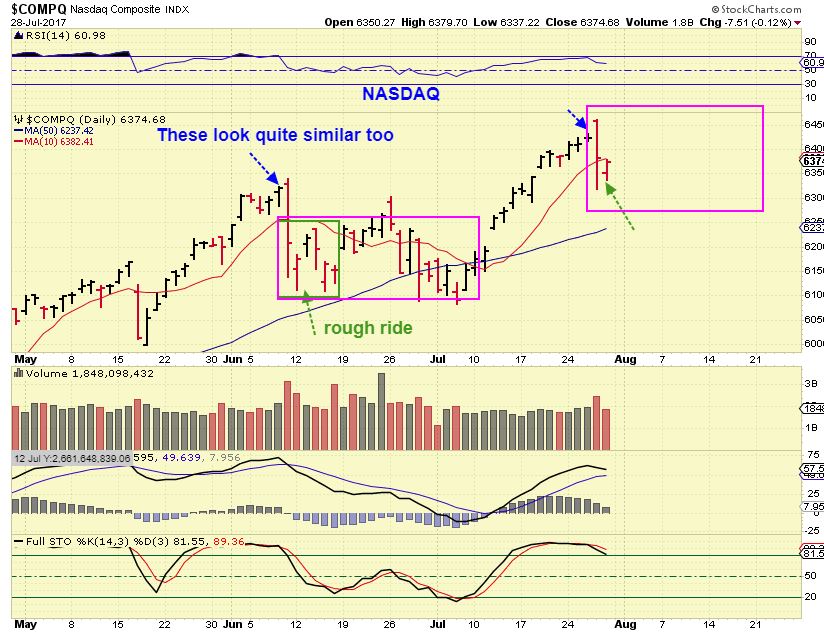
NASDAQ WEDNESDAY- We have gone sideways, yet some were buying this reversal too, so here I was trying to point out that prior sell offs and reversals constantly failed. The ‘Timing” was not right, and the timing for the NASDAQ & SPX was due to drop into a DCL.
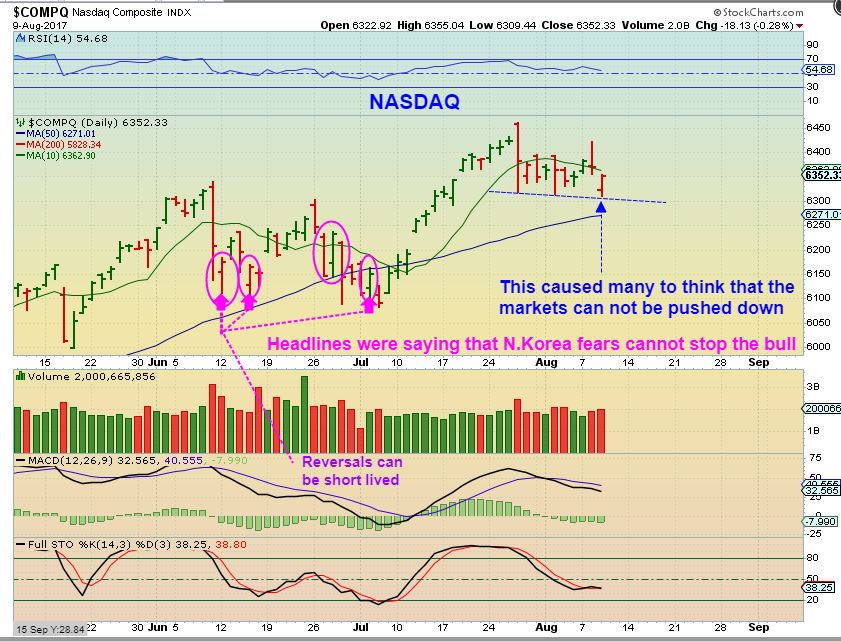
NASDAQ – And so we have our continuation drop, and we sliced through the 50sma. Searching for a dcl ( and possibly an ICL) , let this play out. Look at charts of GOOG, AMZN, NVDA. These were the leaders and they are breaking down too.
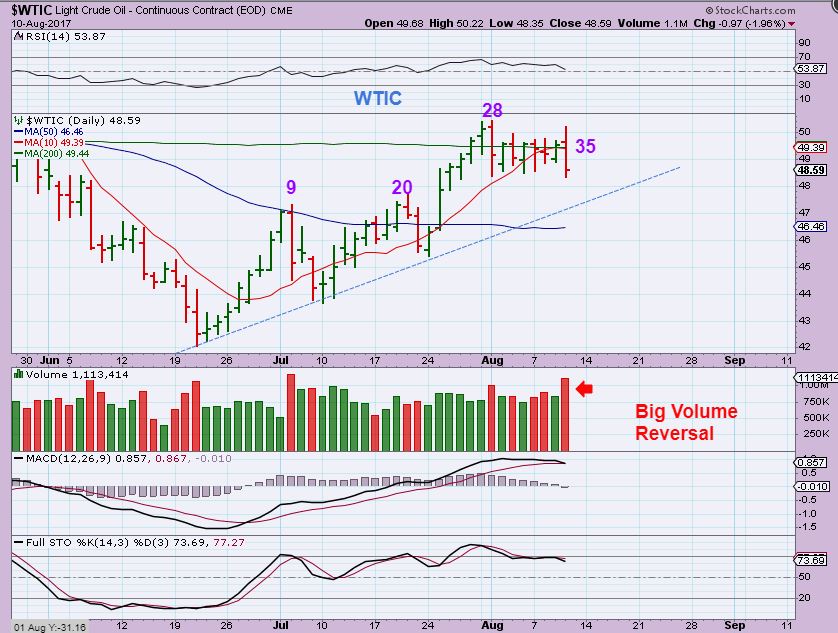
WTIC – DAY 35 , so Oil is within the timing for a dcl to be sought out. Thursdays reversal had some big volume too. We did see something similar on day 9 & day 28, but this time we are within the timing for a continuation drop into a dcl, so this may keep going. I’ll start by watching the 50sma and trend line area for support ( I am not short or long).
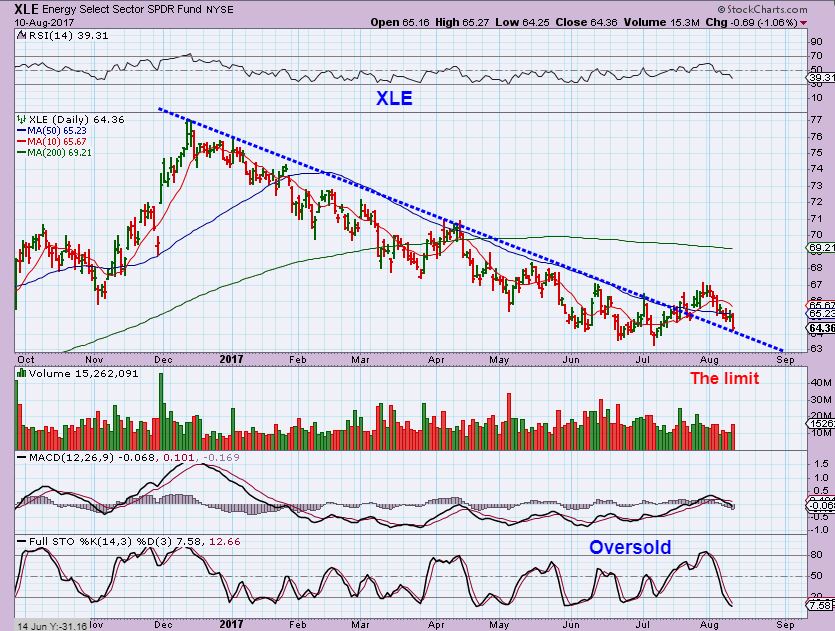
XLE – Well, The XLE finally broke out & now we have a back test, but many Energy stocks are still a mix of good and bad after earnings. The sector as a whole just does not look great yet, so I would be cautious since this might break down 🙁 IT also may just slowly climb down this trend line and form a ‘double bottom’.
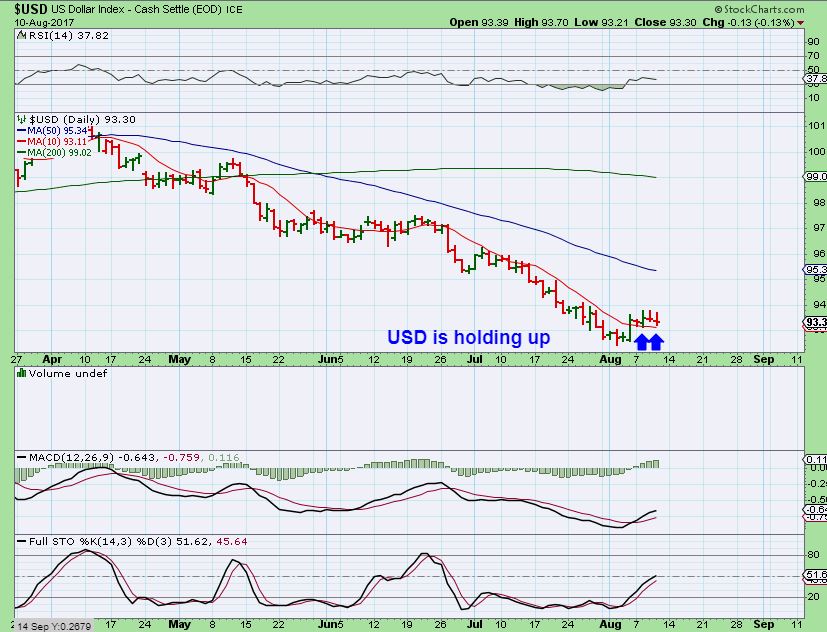
USD– As GOLD moves higher, the USD is holding up. I will discuss this more in the weekend report.
THE FOLLOWING 3 CHARTS AND COMMENTARY WERE IN YESTERDAYS REPORT. LET’S START THERE, THEY REMAIN VALID.
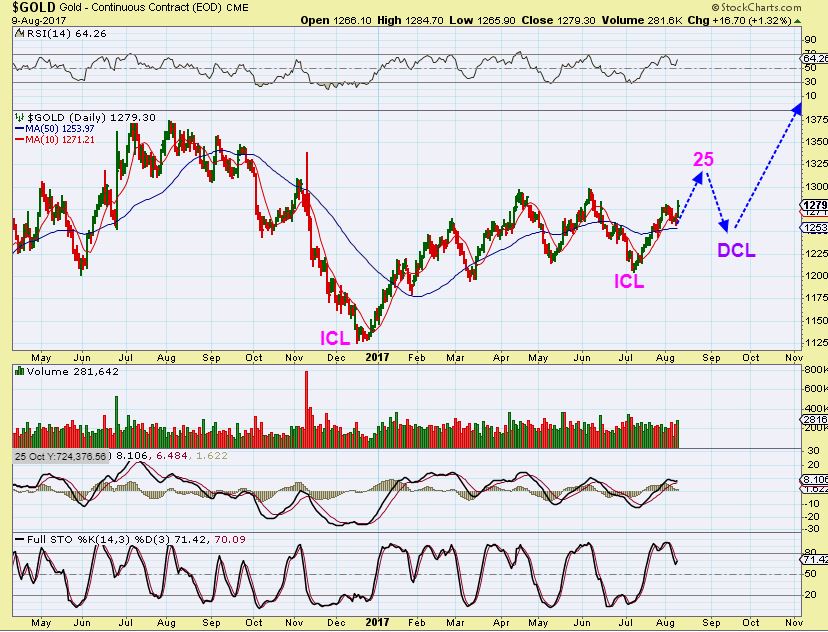
GOLD – This was my original thought. I did say that we could get a possible day 25 peak out of the ICL, then a drop to the dcl, back testing the 50sma. This still could be happening, and prior daily cycles have had 2 legs higher, but…
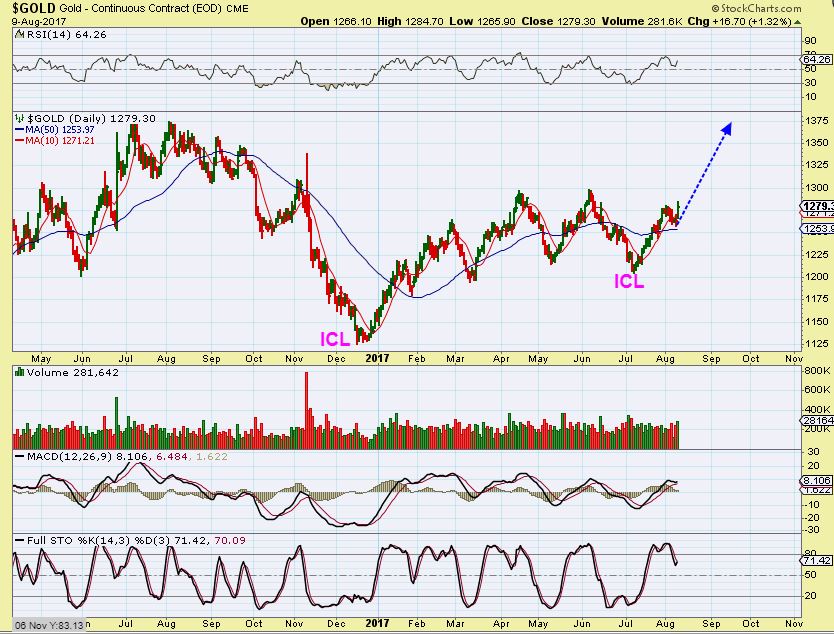
GOLD – If that was a mild day 21 dcl at the 50sma and Gold is moving strongly out of an ICL, it could just take off and pull miners out of that triangle into a Wave 3 move higher 🙂. Thursday would only be day 2, so it is hard to call it a dcl with conviction yet, we need further confirmation.
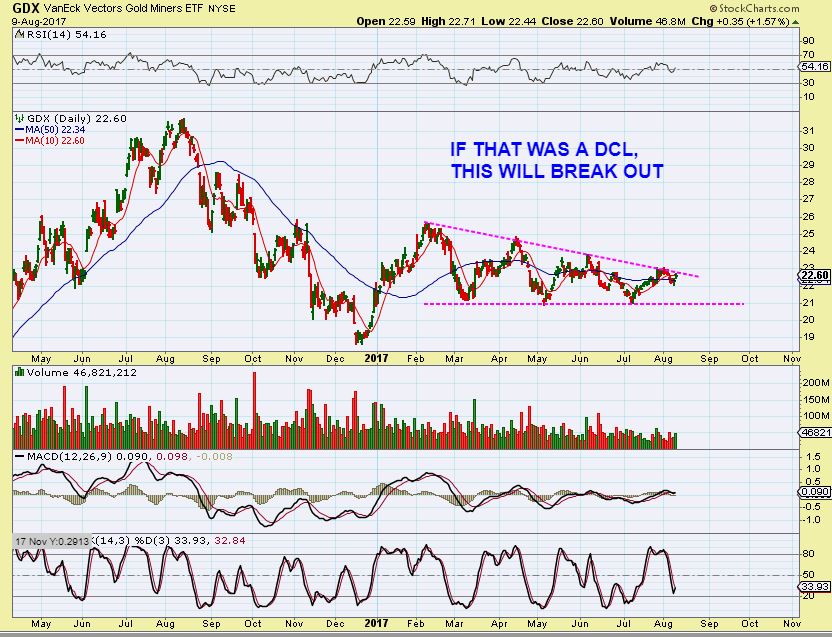
GDX – I wanted to point out that “IF THAT WAS A DCL, you have NOT missed the coming strong move, since this has not broken out yet, but it should sooner or later”.
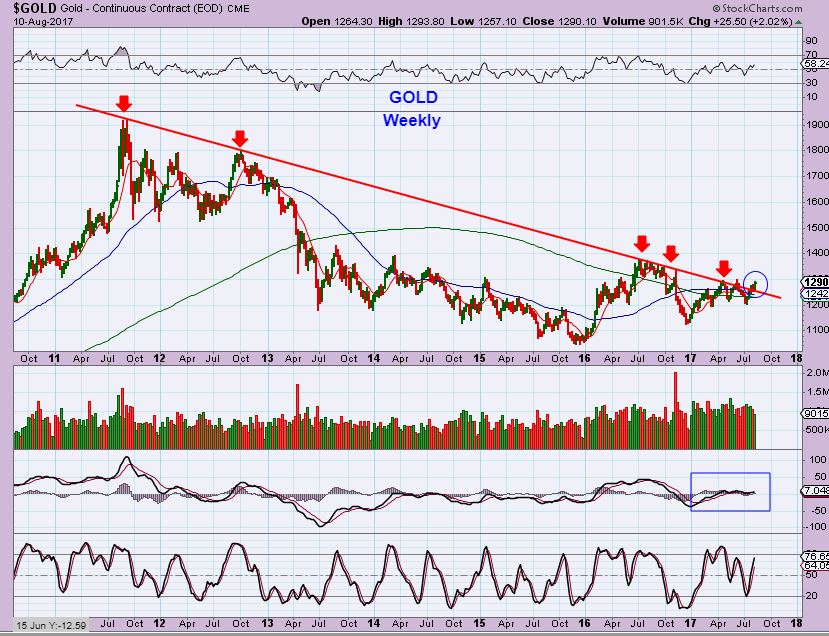
GOLD WEEKLY AUGUST 10th – Gold continued higher yesterday, and this is the weekly view. It looks like a very bullish chart, 4 of 5 weeks higher out of the ICL.
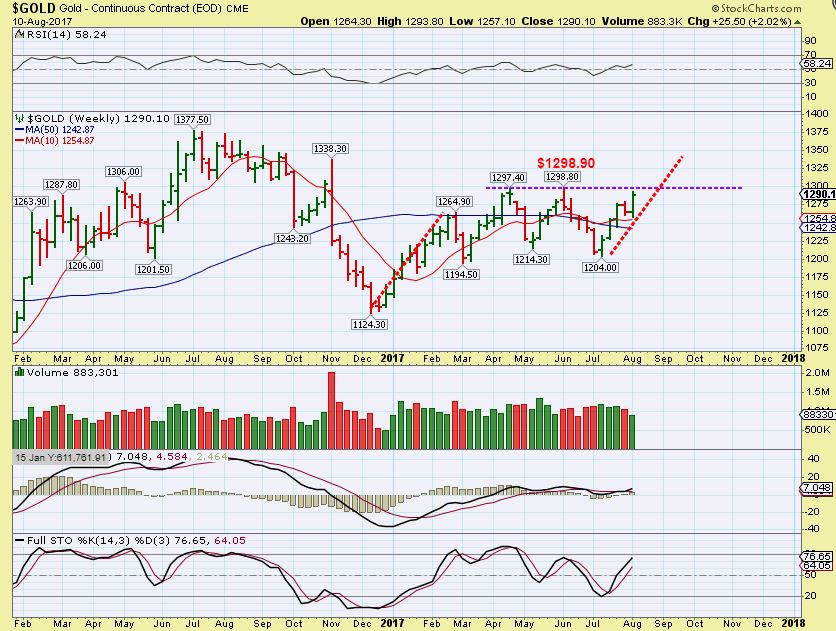
GOLD WEEKLY AUG 10 – We have 1 more trading day to the week and Gold has started to peak out from this downtrend. If Gold Moves higher or is green at the end of the day Friday, this weekly chart becomes more encouraging. IF Gold drops today and closes lower? This break out could be invalidated or weak and next week will reveal a lot. Step – by – Step.
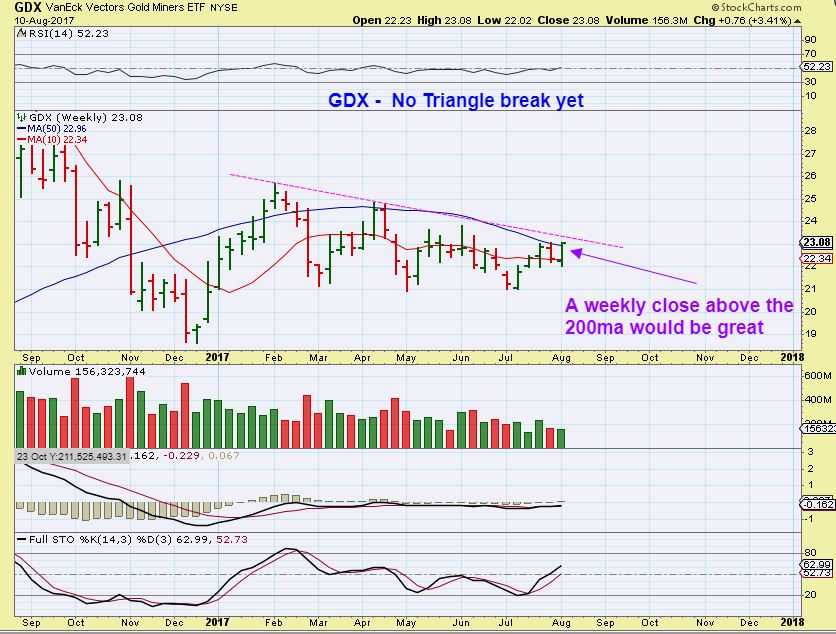
GDX broke above the 200 MA on a weekly basis Thursday. If GDX closes green on Friday, this looks to be breaking out ( The trend line should be next). If GDX drops on Friday, we could have what we had on the first week of April.
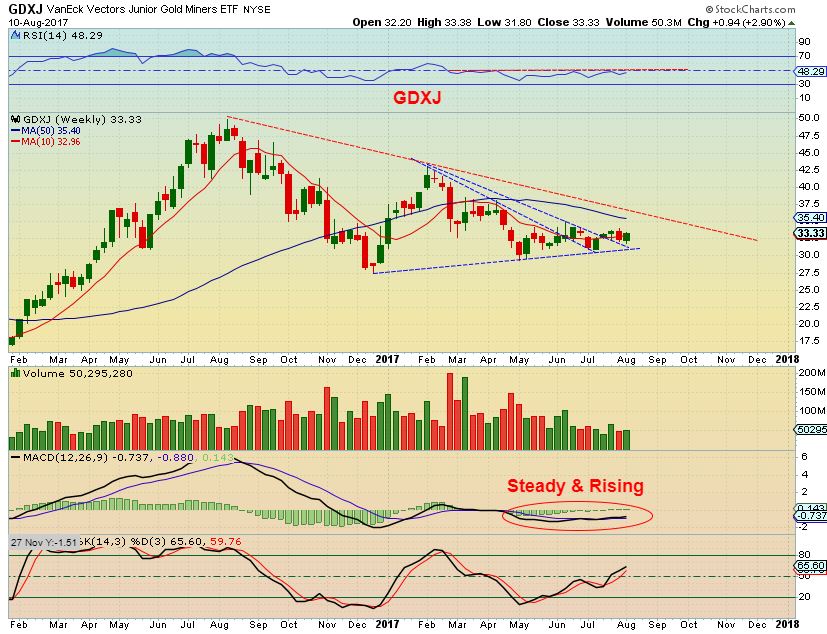
GDXJ WEEKLY – GDXJ has actually broken through a few downtrend lines, but it was not ‘time’ for it to run higher yet. Sideways consolidations can build up a lot of energy.
So some Miners during this earning season are looking very bullish ( see NEM, PAAS and SSRM) , but take a look at others and they are looking horrible ( see PPP & NSU yesterday). I have seen this in the past, and they may be capitulating into final lows, similar to the lows in 2016 when almost everyone gave up on Miners and said that they could NOT be profitable with high Oil prices, low Gold prices, etc etc . They then ran up 100s of %. I love the way things are shaping up, and in future reports, I am going to discuss the set ups further and give my expectations. For now, it is Friday and today will tell us quite a bit too. Enjoy your last day of trading and your weekend! Thanks for being here at Chartfreak, I believe that we are going to make some exceptional money in the 2nd half of 2017 🙂
~ALEX
EXAMPLES:
I want readers here to see what we have in front of us in the bigger picture. I have some readers that just cannot pull the trigger on a trade unless they are absolutely convinced that things are lining up bullishly. THAT IS NOT A BAD THING, PATIENCE IS REWARDING IN THE LONG RUN. When the precious metals sector begins moving upward with conviction, I will be convincing everybody here that they need to be in, and I will be pointing out set up after set up with lower risk entries. Right now it is bottoming and we are inside of a choppy triangle, so some Miners are good , some are bad, and we have a mixed signal. Let me quickly show you something encouraging here…
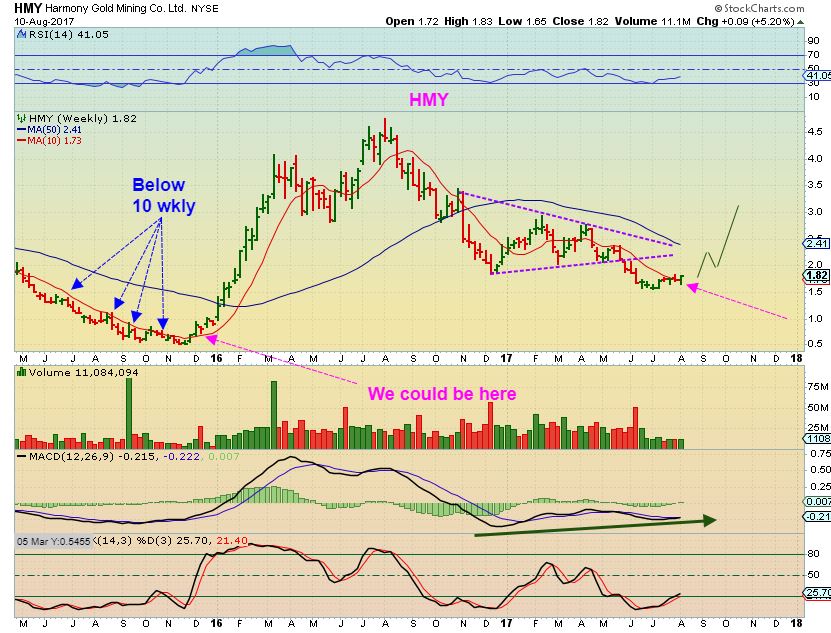
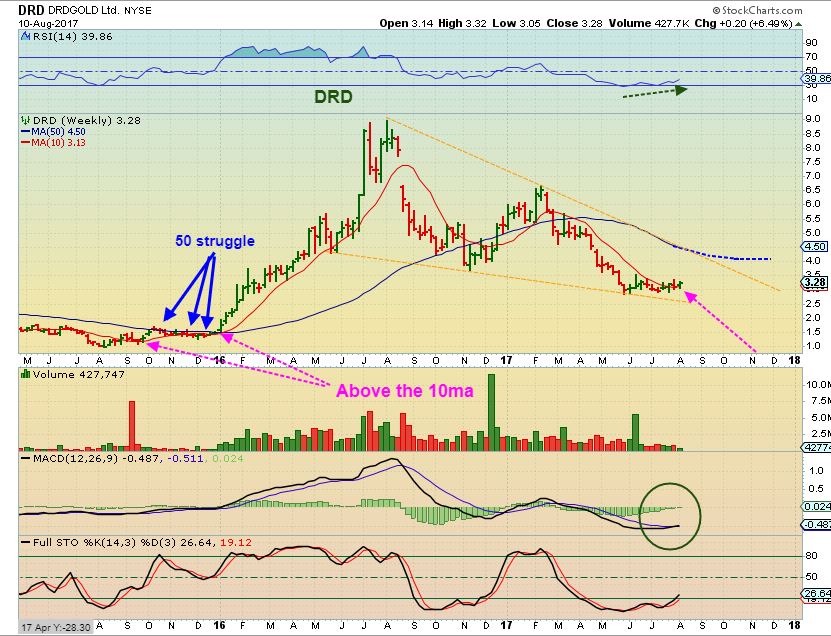
HMY – HMY sold off relentlessly in 2015, but once it broke above the 10 weekly MA, look at what it was able to do. That is 800% gains in 6 months. By the way, DRD is trying to break above the 10ma. My point is to the ones patiently waiting to pull the trigger. HMY Bottomed in November 2015, but even if you waited for a month or 2 before buying, you doubled and tripled your money.
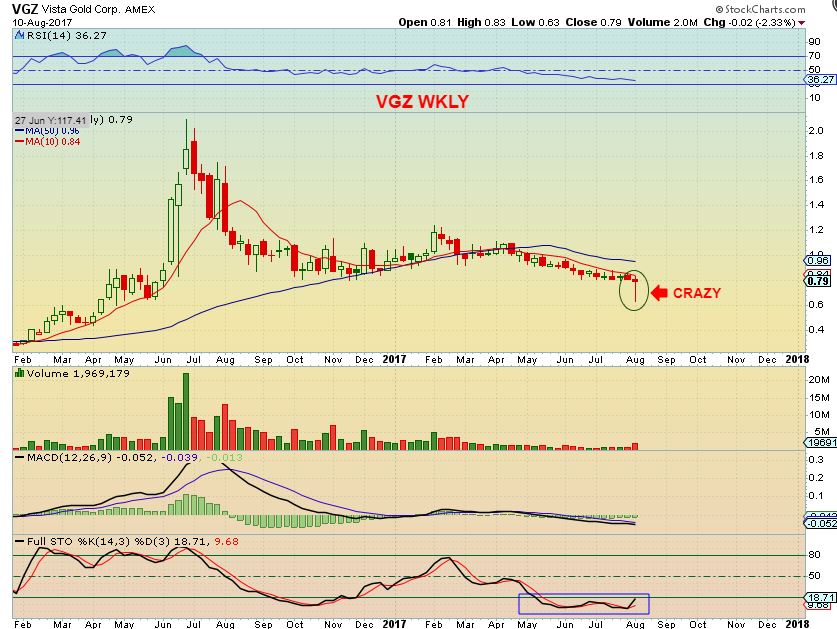
VGZ – VGZ sold off Sharply this week, from 83 cents to 63 cents! Did you notice what it did on Tuesday, Wednesday, and Thursday? If this runs to former highs and forms a cup, the gains are going to be excellent. My Point? Even ugly crashing Miners can recovery rapidly when the time is right .
DRD- I have been pointing out this pattern for a while. This time I want to focus on 2015 too. It bottomed and went sideways in a frustrating manner for 6 months! Once it broke key resistance, it also ran up 800% from the lows. You are not missing all of the action if you are not buying right at the lows. True, 800% was from buying at THE LOWS, and buying after it broke the 50ma comfortably ( let’s say $1.50 – $2.00) only gave you 400+% – but I would gladly take 400% in a strong bull move higher right now.
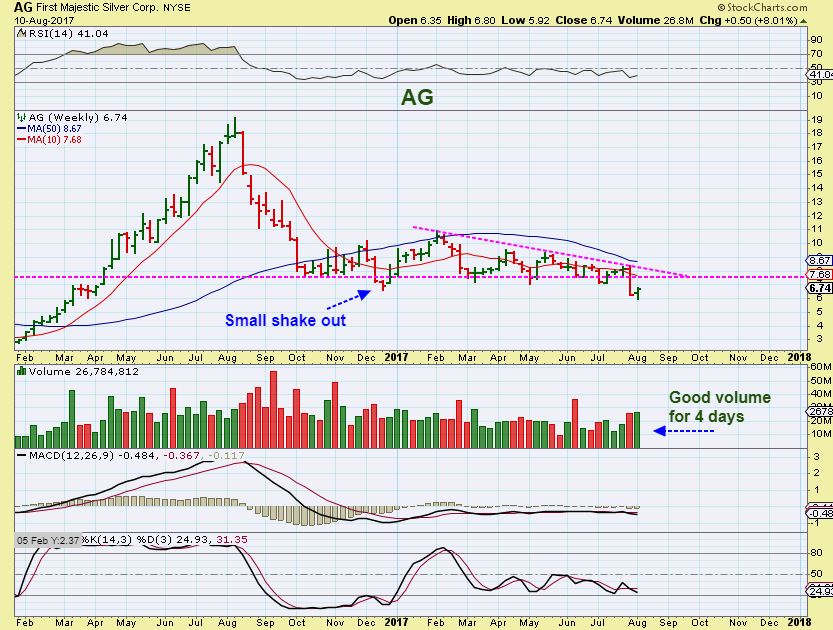
AG – Ag looks like it may be trying to recover now too. AG was a fan favorite in 2016. Many loved this Silver Miner, but with that sharp drop from the top, and then a recent break, people are saying, “Miners are too risky and even some of the good ones are being thrown out.” Well for the patient ones, a recovery of this break down would be a possible ‘shake out’. IF you wait and buy this at $8, will you be sad when it trades at $24? Sure, $6 to $24 is over 300%, but $8 – $24 and 200% plus in your account is a great feeling too, right?
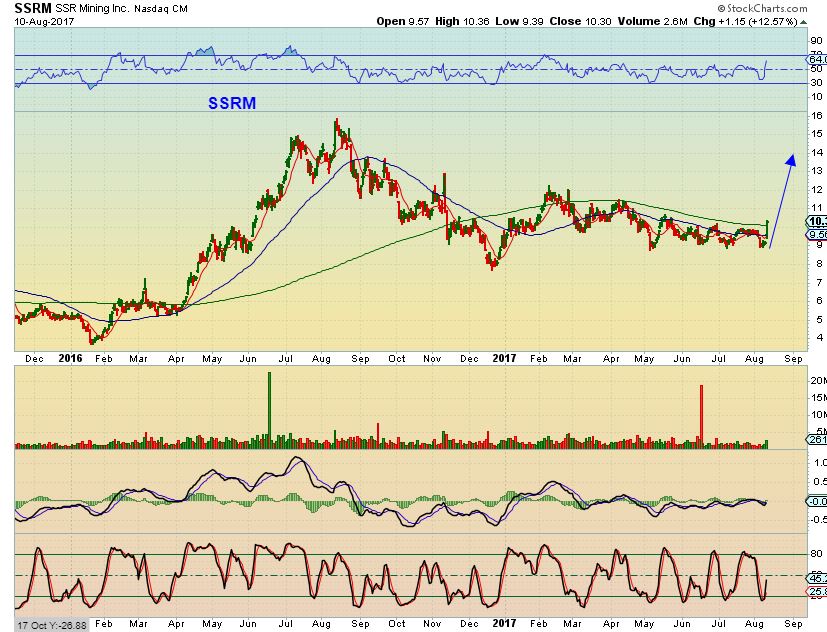
Bottoming processes are frustrating , tricky, yet they can be rewarding if they lead you into a bull market. Not all Miners run at the same time, and we are seeing NEM, RGLD, and a few others leading, SSRM and PAAS broke out sharply yesterday, and going forward I will be pointing out trade after trade that can lead to great profits.
SSRM broke out with earnings Thursday, and this is now a safer Miner in my opinion.
For now, I have been trying to avoid entering during the earnings season, so I have not been showing a whole host of ‘set ups’, but if things continue the way that I am seeing things line up in this sector, the 2nd half of 2017 will be excellent for our accounts.
Thursday August 9 
 AUGUST 12 WEEKEND REPORT
Scroll to top

thanks for keeping us straight …. chohtFreak…
wooo… look at gold … spikey spikey…
Happy Friday All
https://uploads.disquscdn.com/images/7d0433bde665426a16a7ed8c9782a2593cc18057782f1609430d87b571239d37.gif
Thanks Maria – Yes, nice little 8:30 spike there. As I mentioned in the report – for me, I really want to see Gold stay break even or higher today really. It could help the Miners to break above this triangle and it can keep GOLD above the down trend line.
Todays close is what I am watching and any follow through next week would be a bonus 🙂
hmmmm…… look at Gold on the 2 hr chart….. copying the move beginning 12-22….
https://www.tradingview.com/x/IW6XC2fF/
We got the POP & DROP : ) hopefully it begins to move higher again. It’s not a big deal if it doesnt, but I’d like the break out sooner than later.
lol.. yeahhhh… it’s been a LONNNNGGGG wait………..
…ooo… look at little muxie crawling back up into that channel….. getting tasty….
Looks like a pullback in miners this morning, I added some more NUGT in the pre-market but could see a bigger drop after the open. I’m bullish on miners unless there is a major collapse today.
So what is a ‘major collapse ‘ in your view? Thx Steve
Ah, good question. For me (being a PM chicken) a drop much below Wednesday’s low would negate the bullish case short-term. That’s where I have my stops. I realize that is NOT a “major collapse” for most traders, but I don’t like riding out draw downs. I would rather stop out quickly and look for a better buying opp later.
Thx Steve – I wasn’t sure of you were meaning major collapse on your 15 minute ( Which wouldn’t affect me at all)) or are you switching to daily.
Alex, I just use my 15 min chart for entries, of which I did a poor job of today. I broke my “rule” of never buying before 8:30 AM PT (11:30 AM ET) If I had waited longer I could have gotten a better entry price. I use daily and longer charts to decide whether to stay long. My stops (3 levels) are fairly tight, hopefully not TOO tight, because I’m always nervous being long miners.
Hi Steve,
I recall your saying that you use the 9EMA crossing the 10 SMA on shorter time frames (5min, 15min) to help time your entries when you want to go long.
Do you pay attention to MACD? I find that when it crosses below its average on the 15min and especially 15min AND 1hour, that it pays to be very caution if playing the long side.
If you care to see what I’m talking about, here’s a picture – 15min NUGT (forgive me if I don’t respond to any comment for awhile, I’m headed out for a bit)
https://uploads.disquscdn.com/images/0cba82afd7f566ee08a4595a53f8d5af3f2a9b21dcde04a21548661af993c980.png
after waiting so long, seems so anti-climatic, I have a hard time getting excited and modifying my positions. It is fascinating how human psychology is reflected in the market moves. put a few bids in, but eh, waiting to watch the rocket ship take off and I’ll get 1/2 the ride I should. 🙂
I totally agree. That is why I often look back at the 2016 move. The ICL before that one was August 2015 – and most things went sideways for 6 months- KILLED peoples desire to own miners. I remember how fearful most were that Gold was going to $800-$900 and Miners were choppy & stopping people out . THEN came the run that left many behind.
I think that the break from the triangle will be similar but different . Similar when it breaks many will jump in and may get stopped out on a back test & hate Miners. Different because once it gets going upside, most will recognize the triangle break out & EVERYONE will want Miners.
MAYBE that is how it will eventually play out, and right now – many still hate Miners action lately, and I dont blame them 🙂
TQQQ is a “buy” on my 15 min chart this morning for the gamblers. Maybe it bottoms today? I’m not a day trader, but I may take a small position in my trading account just for the heck of it, I can bail quickly if it doesn’t work out. I will wait for bullish signals on my daily chart before I go long TQQQ in my retirement accounts, which is where most of my money is.
Steve that seems to be very conflicting advice. CF laid out all the logic why this is headed for a dcl or icl, and the need to be protective.
Notice the difference between NUGT and JNUG. As of right now, JNUG is -1% while NUGT is +0.6% JNUG ain’t what it used to be.
omg…. if this happens in gold … it matches my post yesterday about NUGT pullback… cray cray
GOLD now … https://www.tradingview.com/x/u06uDvfv/
NUGT … https://www.tradingview.com/x/wNYuAUUV/
Friday, mid summer hmmmm, as I clean up my golf clubs, I wonder how much buying power is NOT going to be sitting at their desks today. hmmmmm, might as well join them later on
NIce 9 or 18 would be worth the trip. There is always Monday for the next trade 🙂
Alex An excellent balance report encouraging patience. Thank you
Thanks EJ – I almost missed this comment.
I am an active trader, but the patient ones often rack up good gains and less losses, so how can you argue with that 🙂
Started small position in XIV in pre-market. Should get nice bounce. It took a beating this week. Have a great weekend everyone. Thanks Alex for your hard work you do for us. 🙂
Thanks Kenny, Have a great weekend too.
I enjoyed seeing other opinions here. I am doing well on my own since trading
since 1998 in metal. I am leaving this site. Be sure to include more of the “real news”
in your trading analysis and not just charting . . . Good luck to everyone.
Seer, some friendly advice from a former hardcore stacker to another, there is more to investing/trading than the metals. Broaden your horizons and you will make more money. It took me a few years to realize that. Good luck with your trading.
You are aware this is a charting/TA site ? Thats what we come here for is Alex’s charting and technical analysis. If I wanted the “real news” I’d subscribe to Market watch. Keep in mind though, by the time you hear the “real news”. the market and the big boys have known about for awhile and acted accordingly already. Best of luck to you as well.
So true Miller! I have seen the charts move in a direction that is explainable 6 months ahead of real news…. explainable until later when the news was released.
At times It could be Insider buying, because they know the company is doing well, it could be insiders selling, because they do not feel that the ‘books’ are looking good. And in precious metals, it could even just be smart money accumulating foreseeing Inflation 6 months ahead or something else.
Someone always knows something before the ‘real news’ comes out.
TrueDat
I wish you well in your future
Good luck and enjoy Florida.
… yes .. i saw your post the other day… sure hope you aren’t being hasty because of the ‘Link” comment … this is a pretty good group here… and CF .. he’s ok too… 😉
to each his own …Good luck in your journey
Alex’s site is called Chartfreak so that should have given you come clues as to what his style is 🙂 Good Luck in your trading
https://uploads.disquscdn.com/images/641ec9f6eb68de57265b6a4aa1ca28b1d123e68edd7f5066e011a6fa4d43dd99.gif
Bot more NUGT, didn’t get close to my gap fill but it looks like LOD may be in. But plenty dry powder left to buy more. I keep chipping away.
I got to add at 32.50 on the nose (thanks for the heads up Steve)
NUGT is still a “sell” on my 15 min chart so it may drop more. I probably should have waited until 8:30 AM PT but it’s hard to catch the LOD because it’s not obvious until after it has happened.
Steve, my avg is in the 31s so it wont hurt that bad if it dips.
Nice going … my avg is a little higher because I’ve been adding today, but I’m very bullish on the miners right now. BTW NUGT is back to a “buy” on my 15 min chart so buying at $32.50 was a great entry.
thanks – Im sure Ive got a lot fewer shares than u lol but Im here for some base hits.
I gotta admit I’m swinging for a double or triple here because my charts are very bullish … but I have stops in place and will get out with a tolerable loss if I’m wrong.
MTBC…. giggle
OK sorry for my ignorance but I need to know what “MTBC” means …
… you NEEEED to know… or u WANT to know…………………. 😉
it’s a ticker we played last week or so…..; https://uploads.disquscdn.com/images/9312c095e56f58bc5664dfc9796428cd2fab506390f2f8e52279e1ebd2936035.jpg
Ive been watching it for a while as well mama, just waiting for that sweet spot
DNR STB
*ShitTheBed
yea.. and i feel that its my fault lol
lol … better make it up to me w/ another high flyer..
You know I got u – post earnings season
MEOW…. ;o)
D’oh! I was confused because you posted in the NUGT thread, so I assumed it was some kind of shorthand comment like “BTFD” LOL
Hahaha steve.
Charts look promising for GDX, etc. I am always cautious though when a technical pattern forms based on headlines and the news cycle. I tend to see those reverse often. Anyone else concerned that once N. Korea calms, gold reverses and catches all the recent converts in a false breakout? Buying DUST here.
Hey MM
I am not disagreeing, and I’m not saying that DUST won’t work out, because it is still possible that this is all part of the first daily cycle out of an ICL, and if so, we are on day 26 or so, so a drop into a dcl could come, IF that wasn’t a DCL on the 50sma recently.
But what I did want to mention was the N.Korea stuff really had nothing to do with the big picture triangle pattern forming since the February highs. So really , I agree that anything could happen with N.Korea now in the mix. A calming down of tensions could trigger a dip, escalated activity could foster a flight to safe haven. The Big Picture Triangle pattern, however, is a good consolidation period all by itself 🙂
Thanks CF. I agree.
Thx, and I was hoping to be clear that I wasn’t disagreeing with you too. If N.Korea tensions cool down, it could directly have an affect , bringing prices down to a dcl or a 1/2 cycle low, depending on where we are. So I agree. Just the big Picture remains overall bullish to me .
https://uploads.disquscdn.com/images/cb25222715e38cd886bd9ab2f2617b8af7e6ee6e952bcfed41a691ba7b955b49.png
MM, I use my own TA system and I have been loading up on NUGT because my daily, weekly and even monthly charts are bullish right now. Trade your own charts and system, you may be right. I have found that doing my own thing works best for me. Good trading to all.
Thank you Steve. I enjoy your posts.
How’s that for a classy reply, nice MM
heads up – a big move in TAHO
VERY NICE heads up Ron, Thanks! That is a nice little base there that it is popping out of.
They have two issues in Guatemala – one where the courts moved against the Mining Minister that granted a license with the result that a mine was temporarily shuttered and another where there is a road block. Both of these will be resolved and that could be what the chart is saying as there is no news I can find.
The news may come out later- this could be “ownership” or ‘insider’ buying, knowing that what you are saying is becoming more likely.
awesome alert Ron
Thank goodness he didnt hit the Greens yet : )
AUY breaking out,,AKS breaking down. https://uploads.disquscdn.com/images/a70aa78e6d785e05dd96603aa6d6c1fab72cf593c823c1f0e4451138a2ffb555.png https://uploads.disquscdn.com/images/d76308944921c7e8e47a1c78ce0401c8a0ff70edd7d280d06a708ac2d0789954.png
Good stuff, thanks!
Gold back to overbought here. https://uploads.disquscdn.com/images/3af41629666545096b891175f90e2b4ad98fa006c7c4628320240848986b2f9f.png
Dear Crystal,
LODE landed on that 50sma as expected and held up pretty good. So far , so good : )
Just saw that ….Visiting Colorado for the week and my service is so spotty!
I still really like the longer term 3 yr weekly chart too. Above that 10 weekly ma. Good potential.
Enjoy your visit to Colorado and have a great weekend.
Thanks! I only sold a portion under 18….
wow… talk about the train leaving w/o you… HOLY NSRPF
That stock has been absolutely incredible
Looking at all my comment posts over the past couple of days I realize I have been posting WAY too much on this site. Sorry about that! I’m going to maintain “radio silence” for a few days to give you all a break from my ramblings. Good trading to all! https://uploads.disquscdn.com/images/62f10070b31660f63d249310492226b42085af9bcb4c1e4e03e35a12e1b2c849.gif
Actually like the updates and posts, Steve.
All thoughts are appreciated here – keep posting
Noooo, STEVE go ahead I really like it, please go the way you did.
Me…. personally, I’m very happy with what you wrote this week.
THANKS A LOT Steve.
VJET – 6 month chart using the 50sma. HHHHMMMM.
Looks real good on a weekly chart as well.
Yes, thanks , you’re right…. it does, but on the weekly it may not be oversold enough, so that could mean some sideways chop for a bit.
Same may be true for QQQ
HLX looking nice on the daily at the 50
Yeah, the one that got away came back.
Check out SID too…nice gap fill reversal
we have 147 new lows on NYSE. the last time we had this many was in Nov last year
Yes, welcome to Major 4 (wave, down)
Maria – DNR – maybe shes not broken
looks like today is Dday for URRE … Viking……..
https://www.tradingview.com/x/99WICTUW/
Funny,
Ken just emailed me an hr ago and said he was looking at URA 62% retrace to go long.
Says he has been a bit too busy to post, and I told him that you said he was floating on a lake studying Cryptos….and he said … Yes, I think to floating on the lake 🙂
Ken who ….. ?
*snicker
She’s dead to me.
CNBX…..
ERF… whoa
yea. right?
to bad we dont have bounce scanners set for this stuff lol
IAG off of the 50sma bruthah
I actaully took IAG again this moring when I added NUGT.. Im a little more hes. to go in full size right now.. Ive been scalping TVIX today, FRTA scalp, and CAR. Fridays arent so bad
When I look at IAG on a weekly ( maybe a 3 year ) I see a beautiful Cup & Handle.
It certainly has been a leader.
KLDX moving up out o a double bottom low
Earnings out, strong 2nd quarter, improved guidance
EGI – Oversold and sitting on the 50 & 200sma….things that make ya go Hhhhhmmmm
Wouldn’t that be like Mr. Market, Alex – GDX not giving you a close in the green, but not in the red either?
I don’t have a favorable entry price like you, so I’m keeping a very small position in GDX/J with no leverage just in case next week starts with a pop – and if it gives us a drop, it won’t hurt too much
Have a great weekend!
I’m Ok with either Cal…
Take a look at the chart ( weekly ) from the report here. I want ti to close above the 50 MA on a weekly, and it was there yesterday, so even a break even is good. However, even if it closed below, it doesn’t mean that it can’ push above it next week. ( Just realized that I wrote 200sma??)
Have a good weekend too !
https://uploads.disquscdn.com/images/c9434f96f4abc60f2833abfe6bcf2c6eafd50aa68bfe2a04abf1a877a185f6dd.jpg
GDX up .30% , GDXJ up .90% 🙂
CF – have you taken any positions in the ETF miners?
BT – Yes, personally I take a position when it looks like an ICL is in place and a 2nd dcl. I do not make a recommendation of it for my readers of my reports though, if you mean leveraged. It is higher risk when the dcl is not clear
Happy Friday, let the party start!
https://www.tradingview.com/chart/GDXJ/TxyY1mu9-Market-momentum-change/
My projected bullish pricepath in gold. Topping out at 1592 the 2nd of December.
https://uploads.disquscdn.com/images/6bd38b5e163f8f8046e0cb804ff8a2609f79618ec4766d93538411c3258cac8d.png
Way to stick your neck out Nord…I love it! Thanks.
I prefer when people to have bal** to make time and level calls of their perceptions. Or else their projections are not worth much in my eyes.
https://www.youtube.com/watch?v=FzCsDVfPQqk
Make sure you are out by 3 Dec cause that’s a heck of a crash next!
That’s my birthday. Easy for me to remember when to get out!
BTW: For non-lazy people: Look on how the 2 and 4 year cycles are interacting in gold. Look then at where we are relative to the 252-ish point. Look how trends are changing at course of 2 and 4 year cycles. Look at how resistance and support levels are set.
Hint: The DCL I believe will be between lower zone 1257 and 1263 with upper zone to 1280. However, I do not think we will hit the top before Aug 21 ish at a level of 133X.
Hello Nord- I do not understand. Your chart above does not show price dropping below $1285 or so, but here you are saying that you think it will drop to 1257 after late August? That does not match your chart, correct? Thanks
Hi Alex. My main scenario is first up to 133X, then down to the interval range between 1257 up to 1280 with my “mean” price expectation of 1263. In chart I have just painted it to upper range, so its not exact each interval section. I am not Nostradamus 🙂
Gotacha , thanks for the reply. Thats what I saw, the chart showing it hanging in the upper range, so I was curious about your 1257 pullback.
What??? Non lazy??? Not Fair!! Grrr… Howz about u say umm “time challenged” … Mr. Viking…………some of us work full time and have large family responsibilites, etc…
*Speaking for myself of course… 😀
LOL – touched a nerve there, aye? 🙂
Hahaha…
Omg..I just said aye…lol
Haha lol Maria 🙂 Don’t forget that I work also as an auditor – not exactly non-busy profession 😀
…auditor ..aye… Nice
I better behave then… Giggle
THE WEEKEND REPORT WAS POSTED NEAR NOON EASTERN TIME