This week was a week of solid activity, and I have quite a few charts concerning the Gold & Silver race, so let’s take a look at the action…
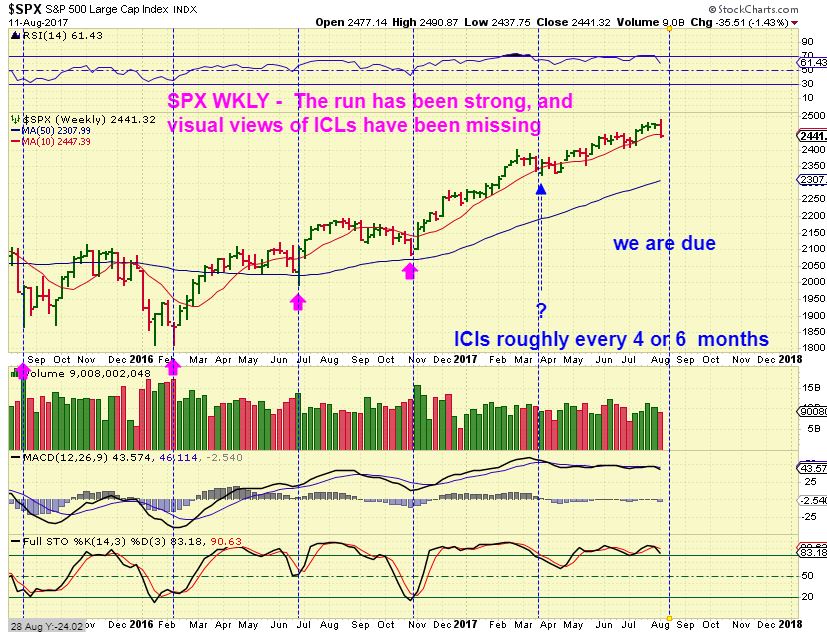
SPX – The markets dropped this week, and since we have not had a truly visible ICL type drop, I would be very cautious ‘buying the dip’ until we see a real reversal, a DCL or an ICL. If we do not get a deeper ICL drop this time, a parabolic type move higher could be taking place ( They run steeper).
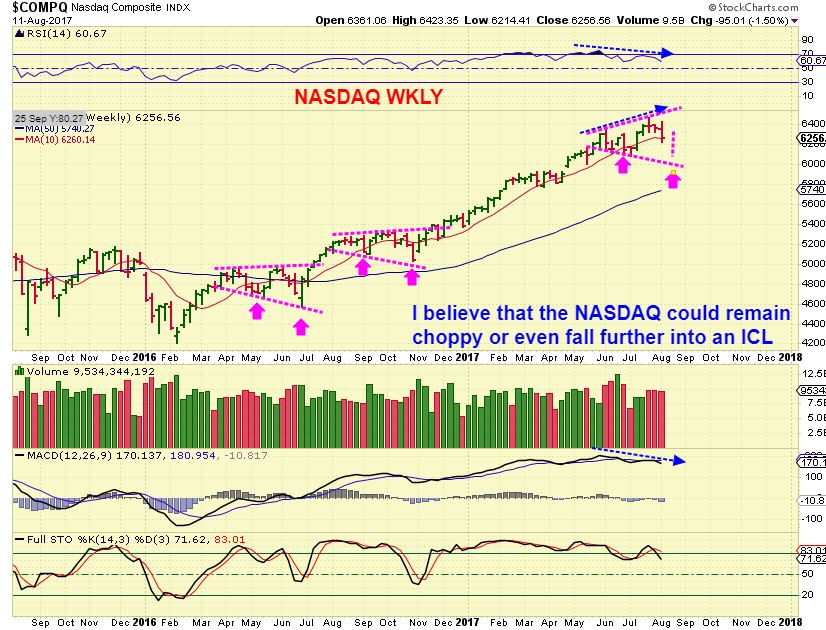
NASDAQ – Prior ICLs dropped into megaphone type patterns, with a low & then a lower low. For an ICL now, the NASDAQ WEEKLY chart may experience more downside. I see divergence.
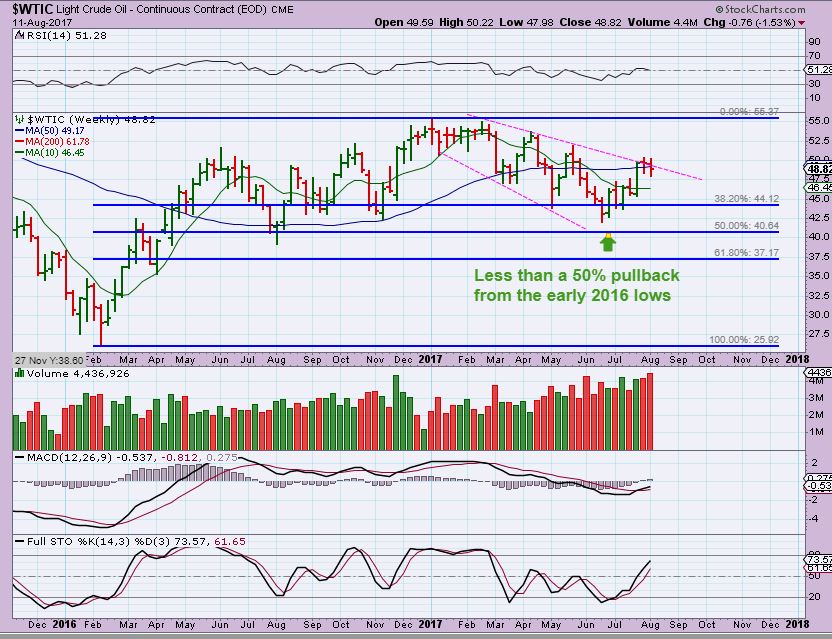
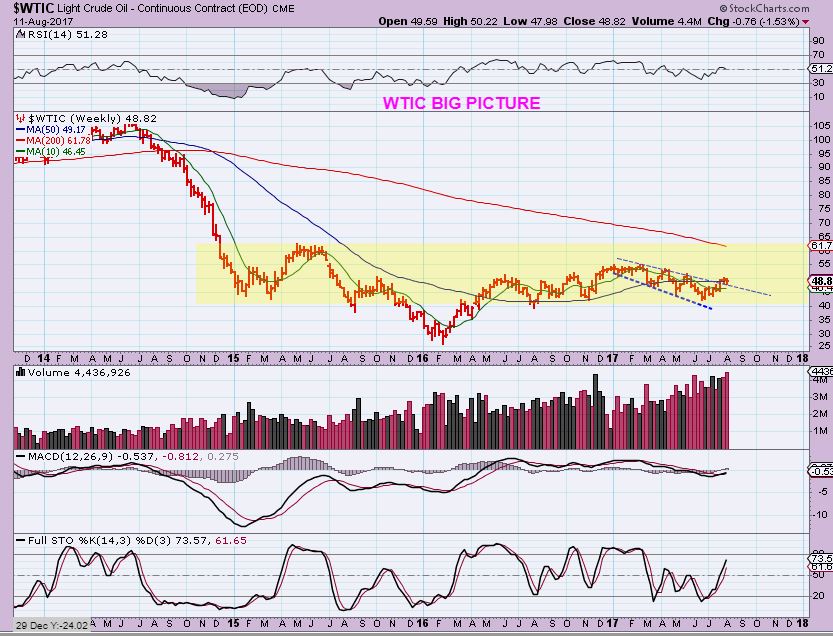
WTIC WEEKLY – OIL is at resistance and has struggled around the 50ma, but this is a bullish looking chart. The Big Picture shows us that Oil never even dropped 50% from the pullback of the move out of the 2016 lows.
WTIC- Big picture Oil is a Bullish consolidation, not as bearish as many believe that Oil has been.
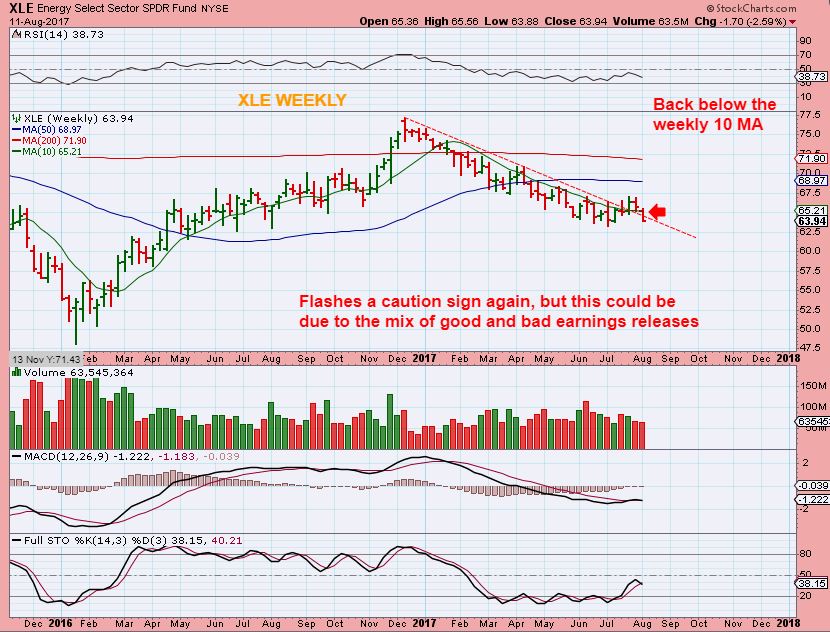
XLE – THIS is not as pretty as Oil. Oil & Energy stocks have had a mix of Good and bad earnings release. This is a sector that I am not trading in yet, and caution is recommended if you are. Please be sure that earnings in any stock you own are behind us.
So let me point this out…
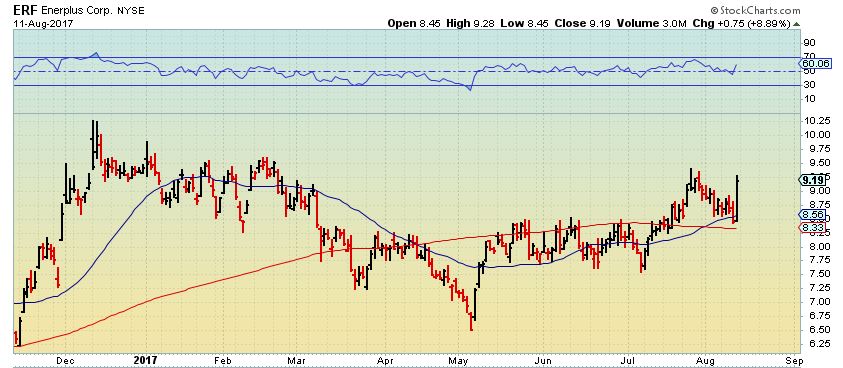
This is the Energy stock ERF– It Popped on Friday and remains above the 50 & 200sma. This one looks like a buy, even though the sector is choppy.
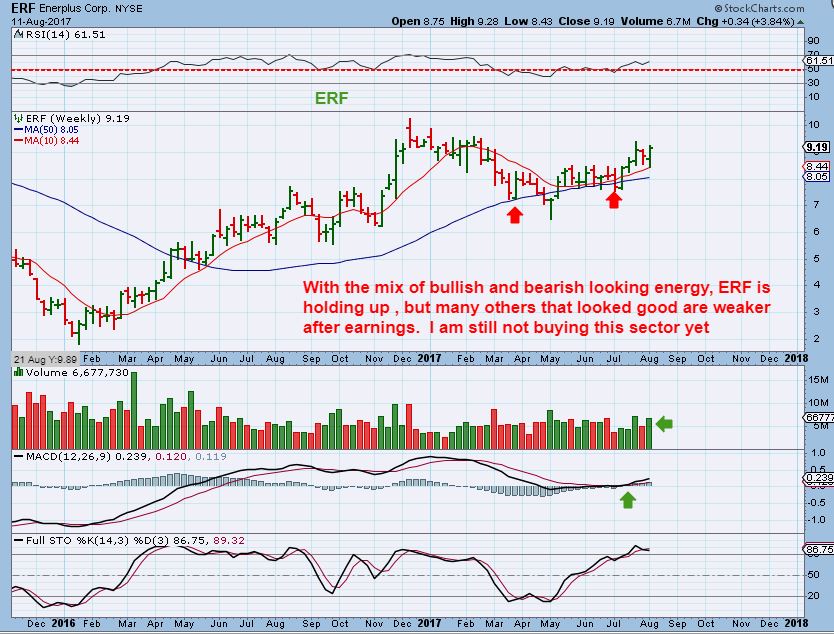
ERF WEEKLY – I am just pointing out that some energy stocks are at the very lows, and others ( like ERF) do remain healthy looking. That was a long consolidation for many weeks, but it held up above key support.
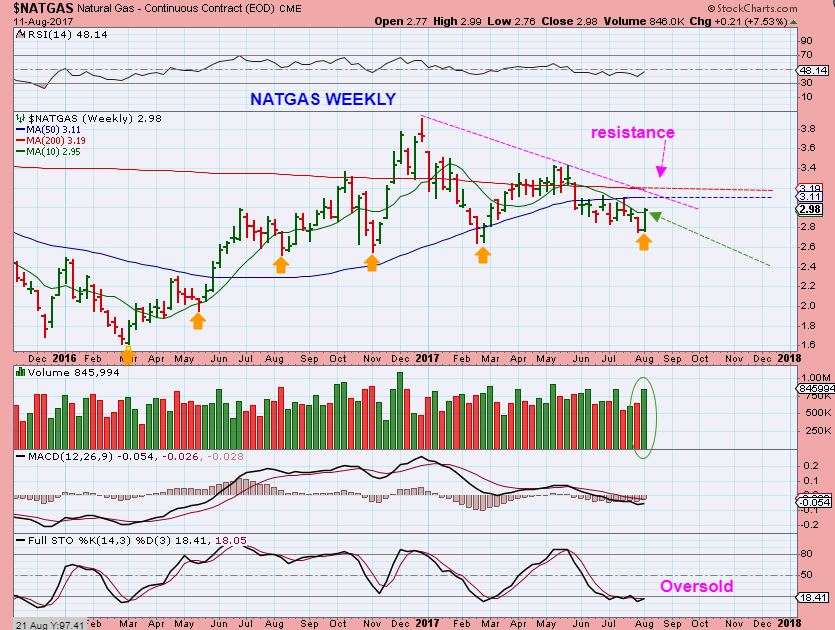
NATGAS – NATGAS has been choppy and difficult to trade long or short, but it has put in a daily & weekly swing low. That was a nice strong looking reversal last week, so that could be the start of a nice move higher. It still has strong overhead resistance.
GOLD, SILVER, & MINERS
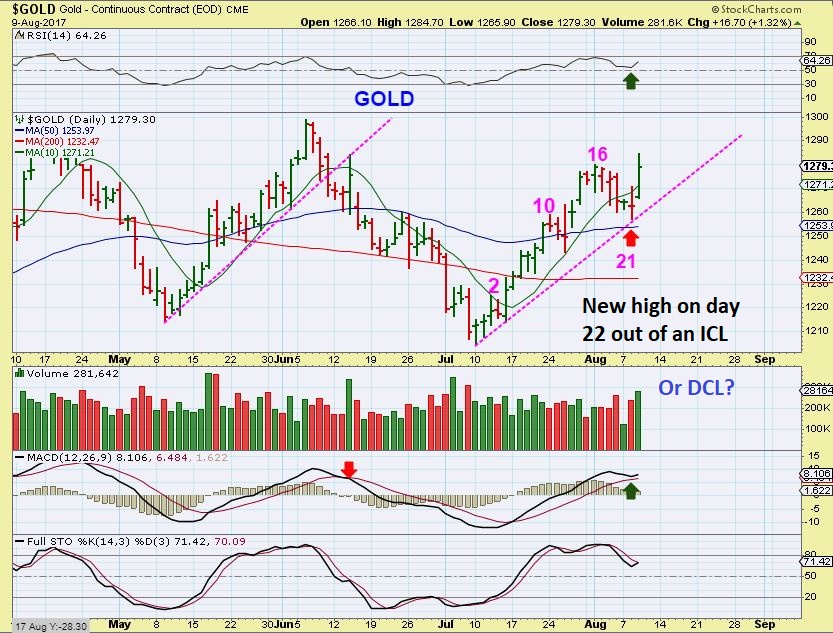
START WITH A REVIEW – The question on August 9th (and this was only 2 trading days ago) : Was that dip a DCL on the 50sma? Or would this roll over further? It was a VERY shallow dip compared to the dip into a dcl at the 50sma from the Dec 2016 ICL. It could easily be bought with a tighter stop below the 50sma.
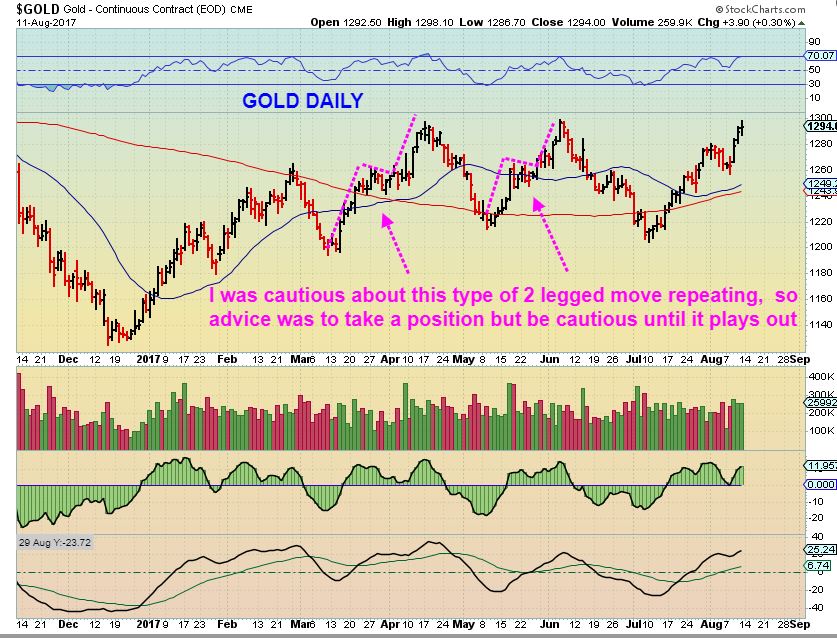
So we had sort of a remain cautious ‘buy’, and I posted this chart. The other 2nd leg higher rolled over, so it remained a cautious position as long as you use a stop under the 50sma as it unfolds.
GOLD – So AUG 9 was day 22 or a dcl on day 21? It looked good, so it could be bought with a stop.
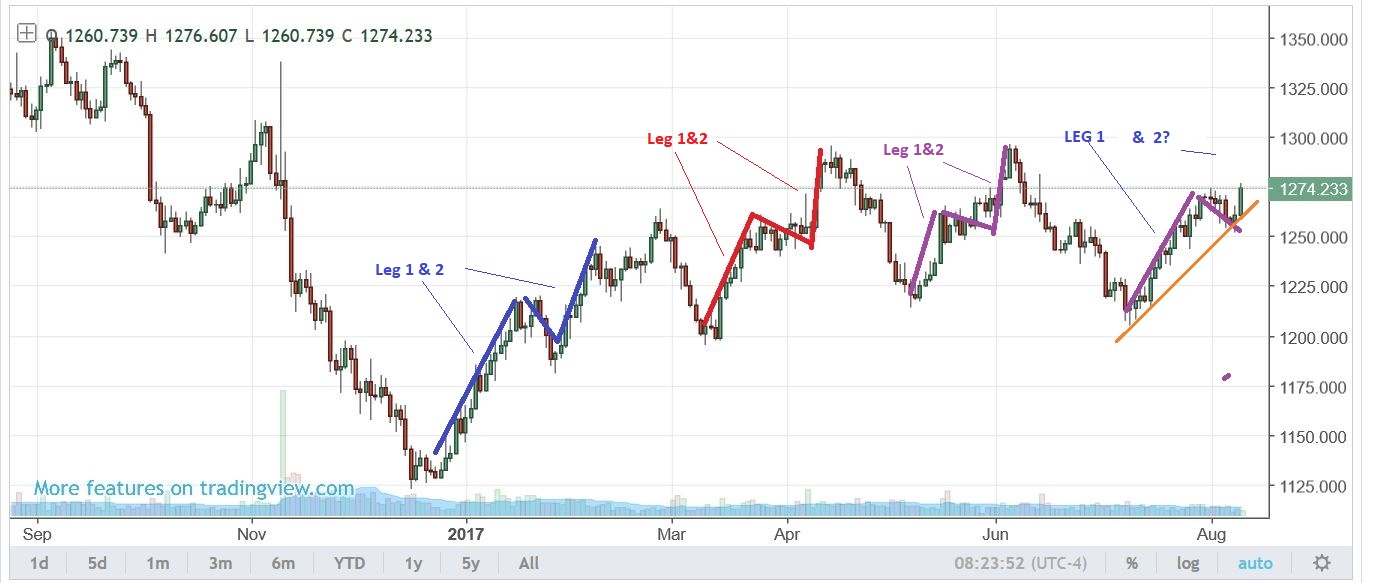
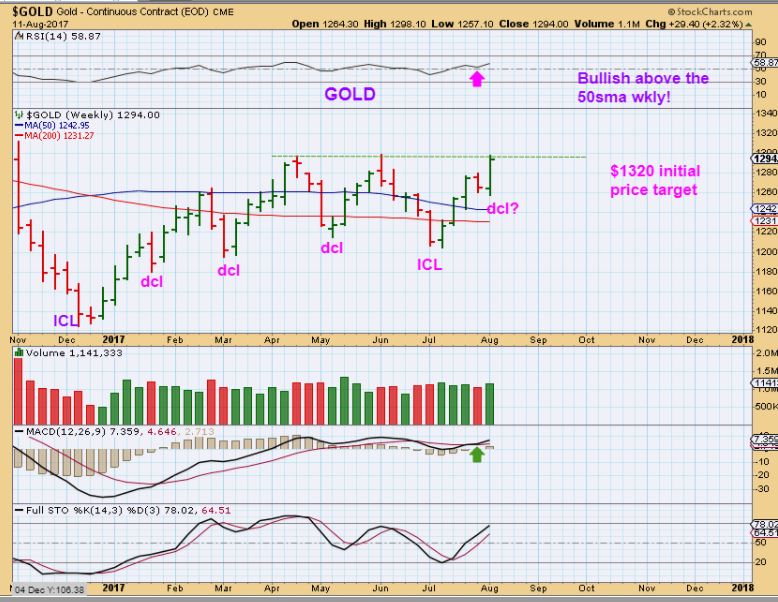
This GOLD DAILY Chart friday 8-11 is the current view – I’ve pointed out that we have seen 2 legs higher that topped and rolled over. Friday was considered a ‘doji’ and that can be a top, but I did not sell what I am holding for miners. I actually think that this could push higher. Let;s get tot he weekly chart…
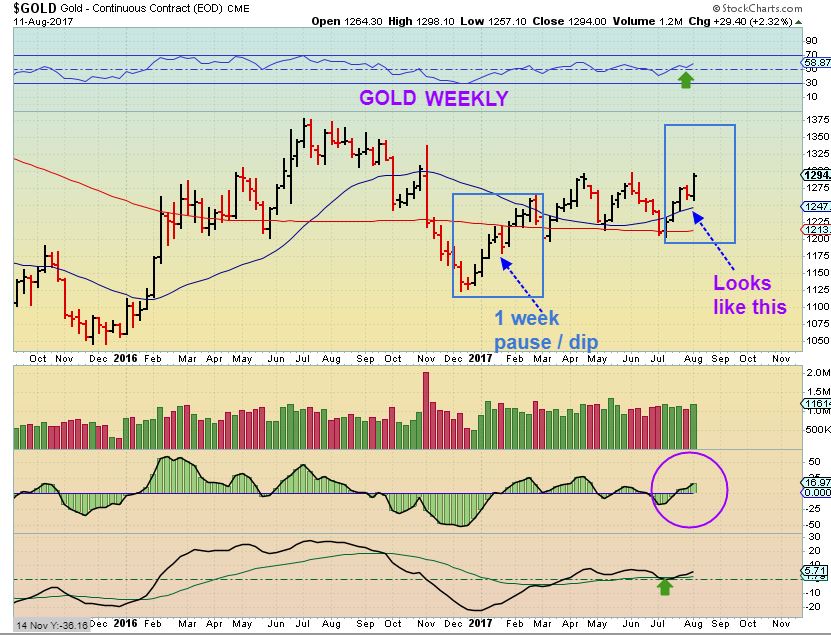
** IMPORTANT WKLY GOLD CHART – As you can see on this weekly chart, price dropped to new lows this week and reversed higher. This could be week 1 of a DCL. It looks like a dcl, and if so, this dip on this first daily cycle out of the ICL was tiny. That small dip helped Gold to already get back near the June highs and it also looks ready to break out. This certainly isnt a DOJI or reversal at the top on the weekly chart, like the last 2 runs higher, and the RSI is bullish. Next week is key.
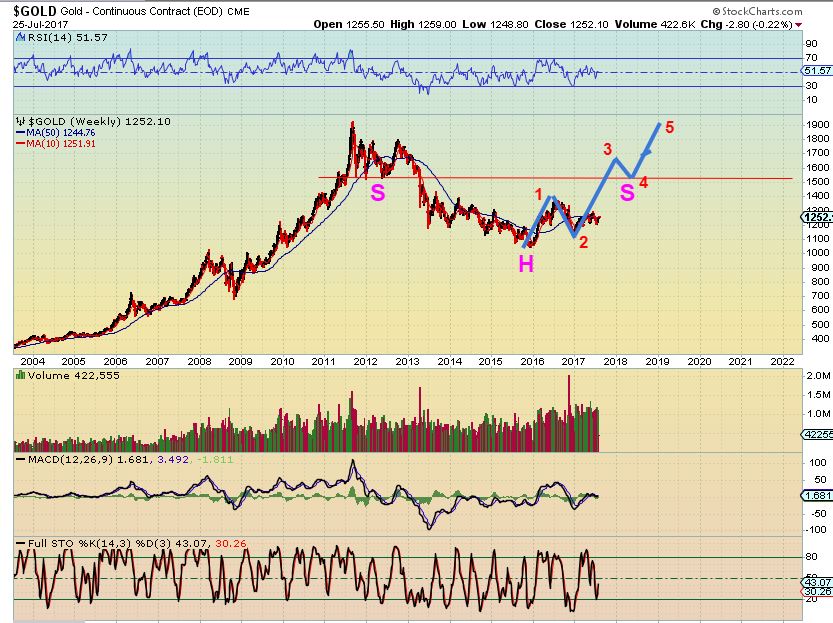
GOLD WEEKLY – Notice the first run out of Decembers 2016 ICL had a 1 week dip too, and then continued higher for 4-5 weeks. This looks similar to the first run out of the ICL in Dec- Feb. I believe that it is more likely that the dip into a dcl is behind us, and this is due to the Miners action too.
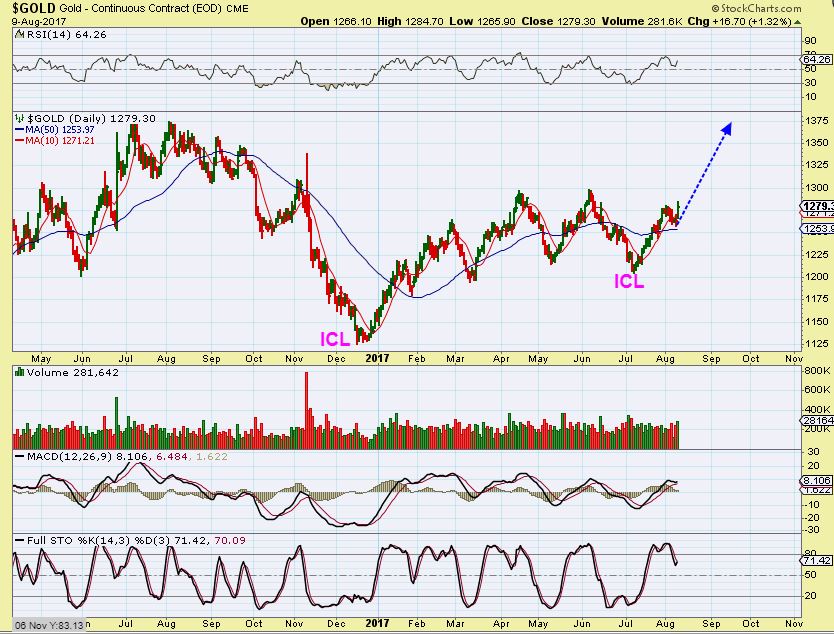
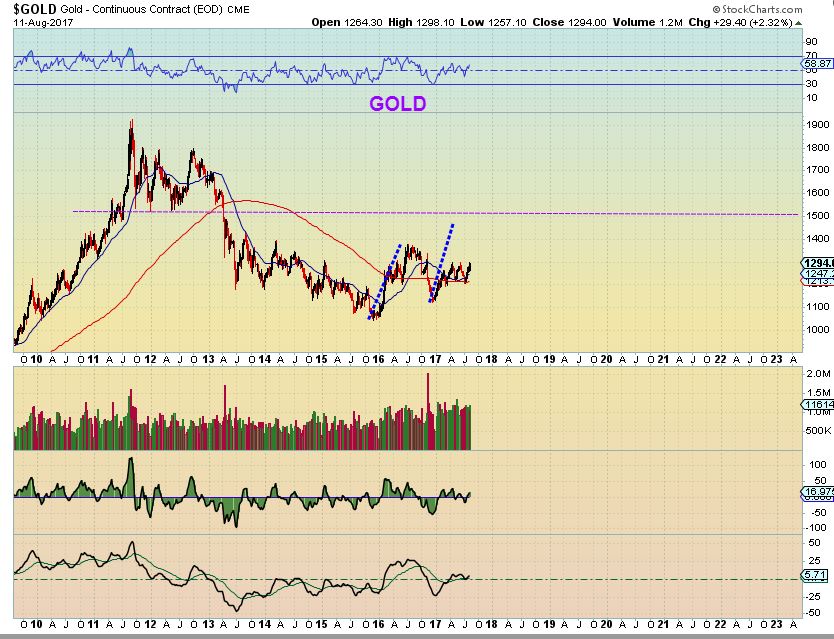
GOLD – Weekly Bigger Picture basic price projections look like this, but they can extend, especially once the buying frenzy takes place in precious metals. A run tot he 2012 lows is possible over time (months).
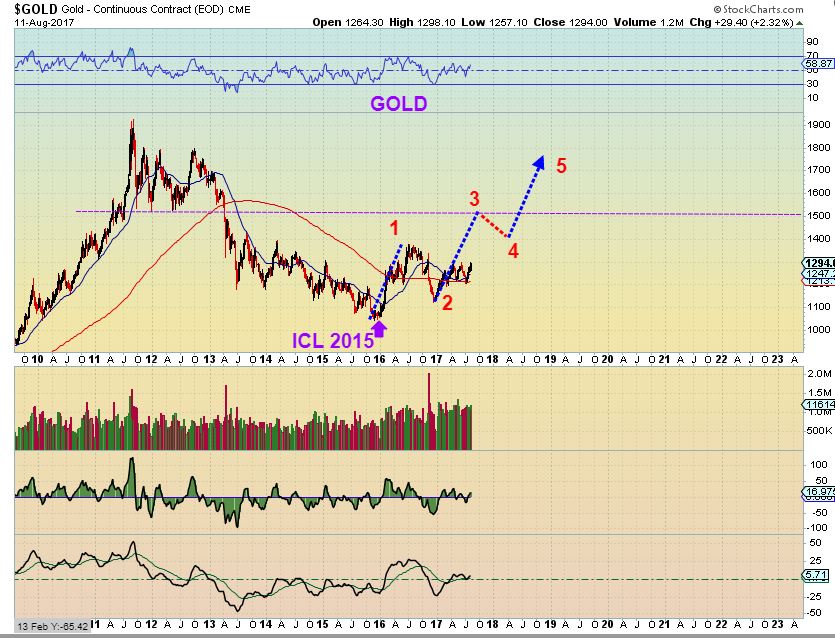
GOLD – From the ICL of Dec 2015, I have been expecting something like this to unfold, it just takes a lot longer on the daily charts 🙂
Someone emailed me and asked why I haven’t given my long term big picture of GOLD, Bullish or Bearish, like I just did above.
That’s an odd question to me, because I have done so repeatedly in the past…
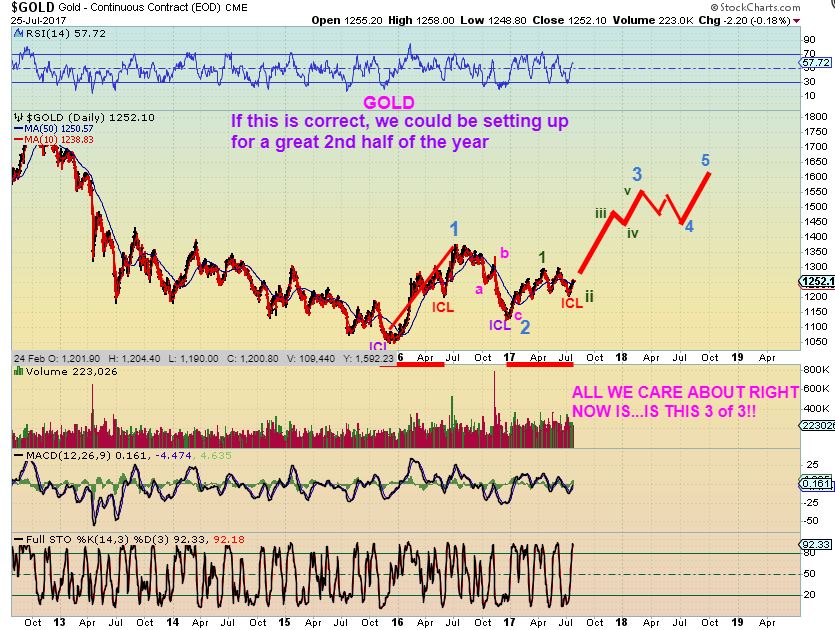
I DID post these 2 charts in JULY only 2 weeks ago to point out my longer term expectations, and I have posted others along the way too. These chart were in my July reports.
July 25 – I called for an ICL in July, and posted this one for the long term too, eventually into the 1500s.
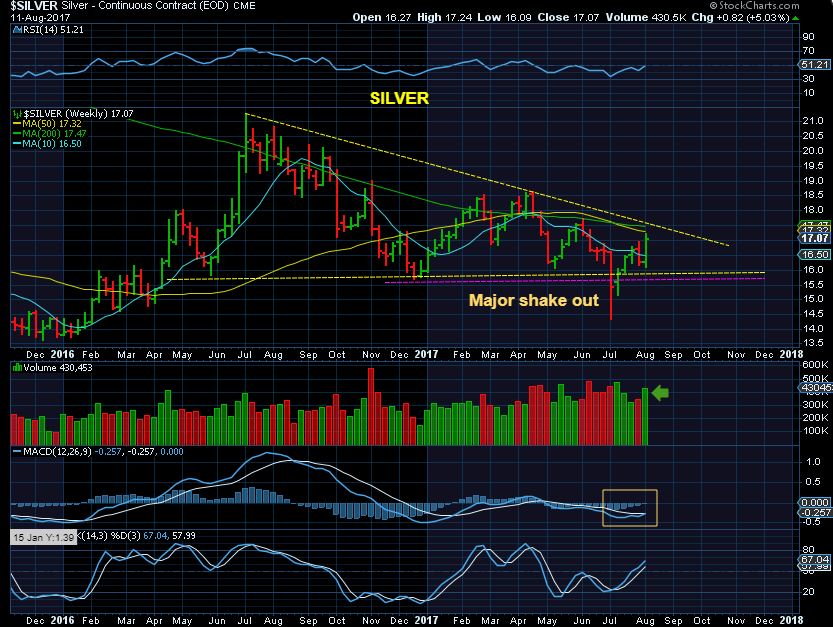
SILVER – SILVER reversed strongly this week and we also see a major shake out in July. There is solid resistance overhead, but it looks just about to break out and when Silver pops, nothing usually stops Silver.
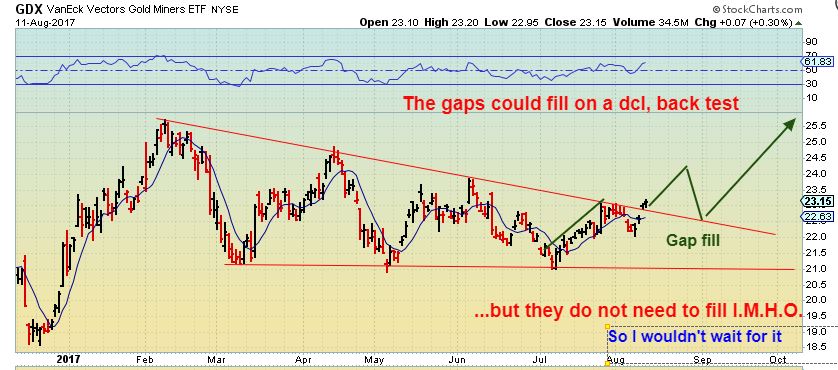
GDX – It looks like a DCL here too, with a swing low forming on Wednesday. Some wonder whether the gaps will fill. My answer is that They Might and often do, but they do not have to. In 2008 we had gaps that didnt fill for years in this sector, However…
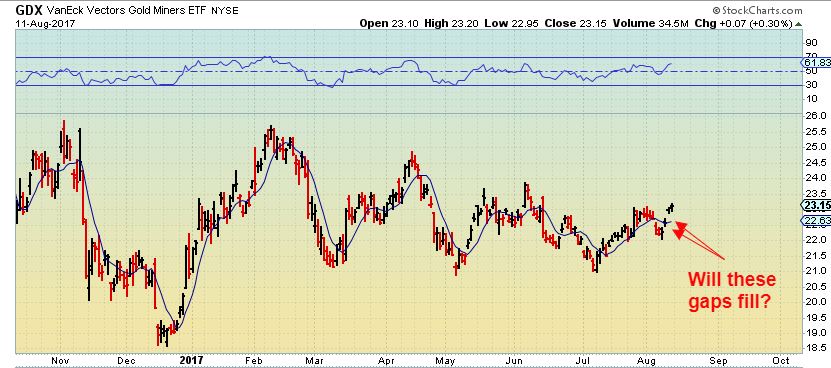
GDX GAP FILL – They do not have to fill now, this can run and fill on a back test too. This would be an excellent buying opportunity, but right now I would want to hold some Miners just in case it does not fill. I will have a chart for that too, in a minute.
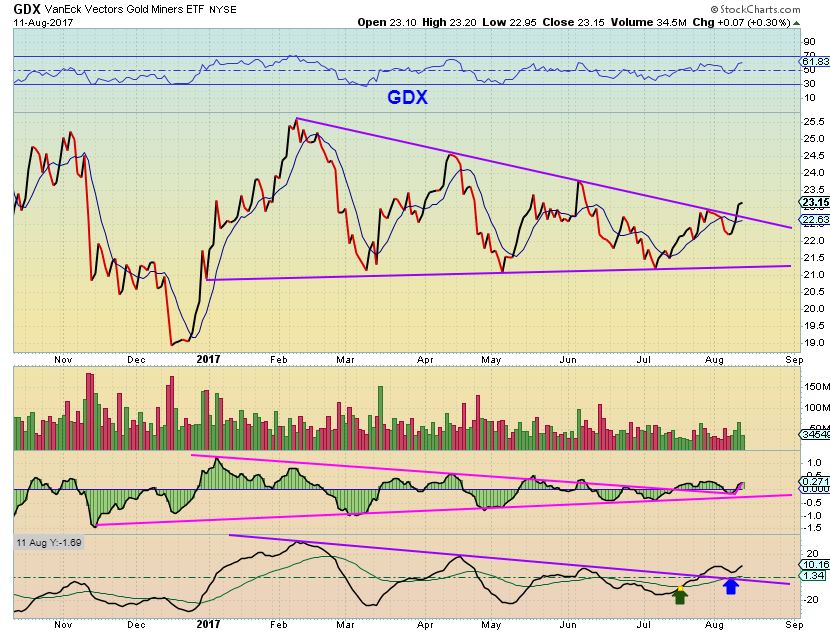
* IMPORTANT CHART OF GDX- When you erase the wicks, we have a solid break out & that would be a buy. If that was a DCL last week, this would be the next leg higher, the 2nd leg out of an ICL. If it falls back inside, you would ‘stop out’ until price puts in a dcl. Friday looked more like a BUY than a SELL, even though GOLD looked like a Doji.
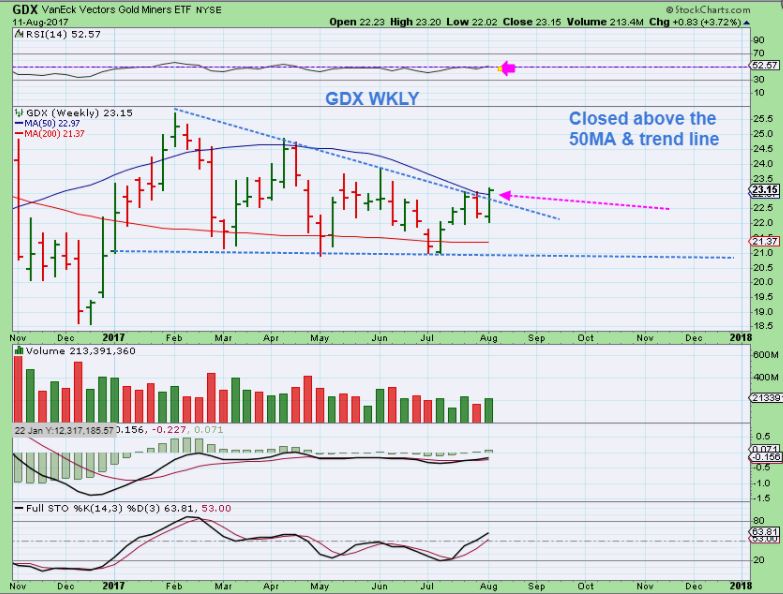
GDX – I pointed out what I was looking for in Thursdays & Fridays report. GDX did close on Friday above the weekly 50ma and a 2017 downtrend line. THAT looks Bullish and also seems to indicate that a dcl occurred last week.
GDXJ #1 – A break out and ‘back test’ could happen at the next DCL, and that would be a strong buy too.
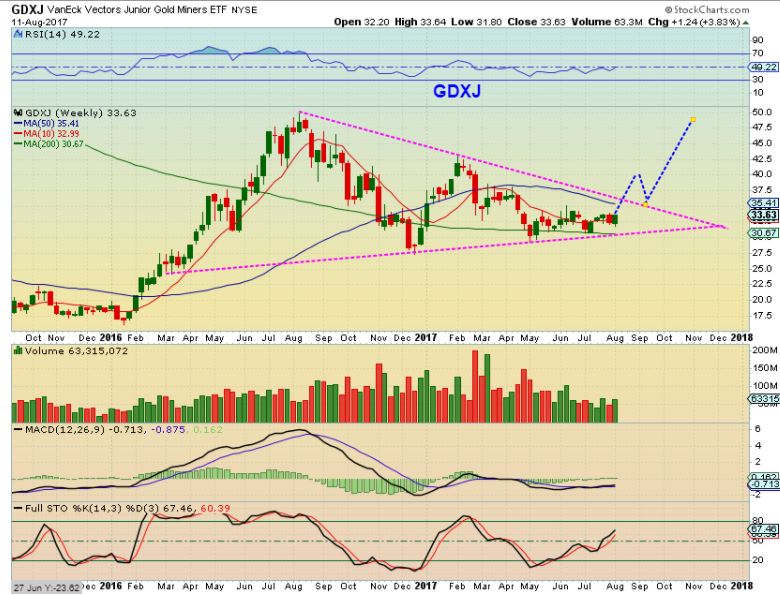
GDXJ #2 – Or this could happen, but as you can see, GDXJ has been going sideways for weeks. To answer others’ question: I do believe that junior Miners will be explosive, despite what others say about the GDXJ ‘rebalancing’.
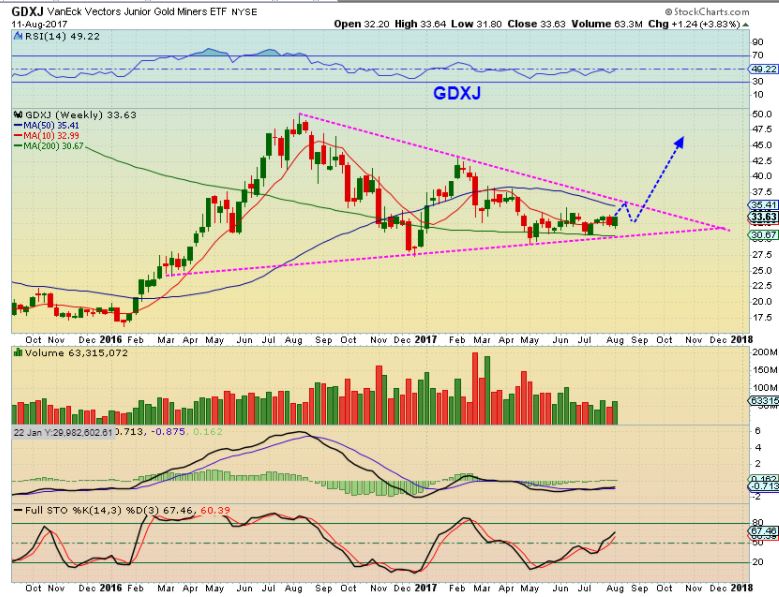
I have been asked if I think that the re-balance has ended its ability to make great gains. No I do not think that to be true. Based on what I am seeing? GDXJ is in a long sideways consolidation and will make explosive gains once the Juniors start moving higher.
Precious Metals put in an ICL in July and pulled back just a little bit last week to a new low. Now they reversed out of that low and look like a DCL was left behind. WE DO HAVE Gaps that could fill o Monday & Tuesday and then run higher, but they do not have to. GDX may leave them behind and continue higher next week. I think that it is a good idea to hold Miners and some of the leaders. I want to release this Sunday afternoon, and may again have a very short report on Monday pre-market morning just to discuss Miners again. Next week could add a lot to these charts, so I look forward to watching things unfold. Enjoy the rest of your weekend 🙂
~ALEX
Additional stuff
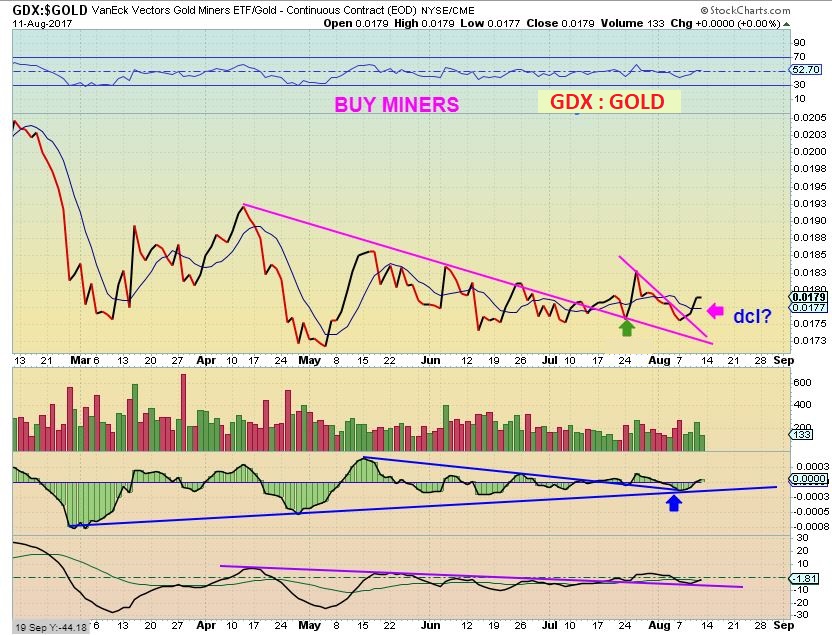
GDX:GOLD is a buy for Miners.
THURSDAY MORNING I wrote this in my report at the end. ( SO THIS WAS AS OF WEDNESDAY). I would say that the Miners closed the weekly charts in a bullish manner and it now seems that a DCL is in place. Gaps may or may not fill. I will monitor this day by day.
As of right now it looks like …
1. Choppy General Markets seeking a DCL, maybe an ICL
2. USD Bottoming?
3. OIL bull flag pushing on the 200sma
4. NATGAS needs watching with the inventory report. It had a good bounce Wednesday, but it has been very choppy and difficult to trade long or short.
5. Gold & Silver are late enough in their timing for a dcl. Gold just made new highs on this run out of the ICL, either on day 2 of a new Daily Cycle, or day 22. This means that yesterday MIGHT Have been a 2nd daily cycle starting . I dont want to go “All in”and get caught in a serious sell off to a deeper dcl, but I am still holding a couple of Miners as I watch this unfold and will likely add to my precious metals position ( and I see some other Miners setting up nicely as well as some at their recent lowest lows). I think that going long with a stop under that dip this week is safe.
No worries if this is a new daily cycle starting, IT IS ONLY DAY 2.
Friday August 10 
 Monday Morning Coffee
Scroll to top

Thx for weekend report. The resistance zone in Natgas is gonna be interesting now. If we havent completed the downtrend yet, my next trend-change interval is end Sept.
Yeah, Natgas has been rather directionless and needs to really push higher in a strong manner to get through that resistance. So far, it has been more of a choppy mess – no fun to trade at this point. 🙂
I took a short here with SL right above the red line. Risk of 2-3 % of upside move. If it close on weekly above the red line, NG is bullish.
https://uploads.disquscdn.com/images/c19767b68dba9f0f4ad62f76862d19614f2197accb0390ba9cb48d482d3e89bc.png
Very clear report, Alex – Thanks!
Is your GDX stop-loss of falling back into its triangle be a drop back below 22.63-ish? If so, that’s risking 2% from Friday’s close, which is very conservative.
With that in mind, would you consider going in heavy with miners (or even going all in) tomorrow/Monday?
Refresh for a chart
Well, here is how one could view it. Tuesday looked like a bottom for Gold near the 50sma, and then the bounce put a swing in place, making Friday only day 3 and last week week 1 of a new daily cycle. If that is the case, I would like to be heavily invested, as long as we understand the risk of
#1 – A Possible gap fill short term in Miners
#2 A possibility that this is really still a continuation of the first daily cycle out of an ICL , and so this would be day 22 or 23 or something.
As a sidenote : It is hard to recommend a more risky trade here ( leverage) for my readers , as opposed to recommending leverage when we have a slam dunk – “This is absolutely a DCL” type of set up. I have a variety of readers here, and some cannot watch positions all day long. They need a solid set up to feel comfortable, but a stop under GOLDS 50sma is solid. A stop on GDX swing low should be lower risk too, but higher risk for those in leveraged positions, right? That would be a big drop for JNUG or NUGT- so that said …
In my personal trading account, I trade higher risk and went in risky when we turned back above the 50sma in Gold on Wednesday & miners. I added on Thursday, and watched for a higher close Friday for the weekly charts. WITH that higher close on the weekly chart, it seems very likely that a dcl ( Shallow) was put in place and we are only on day 4 Monday. I will do a short report on Miners Monday pre-market
https://uploads.disquscdn.com/images/a910d2d1733f704a00cfe6407c5c3e76ed39aec78de274f9b8a9e2eb608bdc30.jpg
Thanks, Alex – I believe I understand.
Since I was waiting for a breakout of the triangle (was tired of getting stopped out), I don’t have your more favorable entry. As a result, I’ll likely go all in, with only a very small leverage AND only if I know I can watch it. Normally I can, but not this week.
Enjoy the rest of your Sunday!
And the reason that I want to be able to watch it is that as convincing as things may look, if you look at the GDX chart above, look at June 21 area. It gapped higher convincingly 2 days in a row too, but then continued lower into the ICL.
Leverage ( NUGT) on that day 3 dropped from $34 to $25. It has recovered since then, but not a fun ride.
Other leading miners, on the other hand, have held up well, Like RGLD, IAG, etc – so they could probably be purchased a bit heavier and suffer small losses, not tripping stops if we get a GDX GDXJ dip. They posted earnings already too. That will be mentioned in Mondays report.
Enjoy your weekend 🙂
… Hey shout, summertime blues………….. Jump up and down in my blue suede shoes
……………………………….Hey kid, rock and roll, rock on
I AM CURRENTLY WORKING ON A SHORT REPORT ON MINERS – IT SHOULD BE RELEASED WITHIN A 1/2 HOUR
Mondays report has been released.