With all of the detailed daily reports pointing out just about everything there is to look for, I like the weekend report to usually just be more of a big picture look at what happened over the past week and what we can expect going forward. Well, there is just too much that stands out to me at this time, so I will cover the bigger picture and some of the smaller details too.
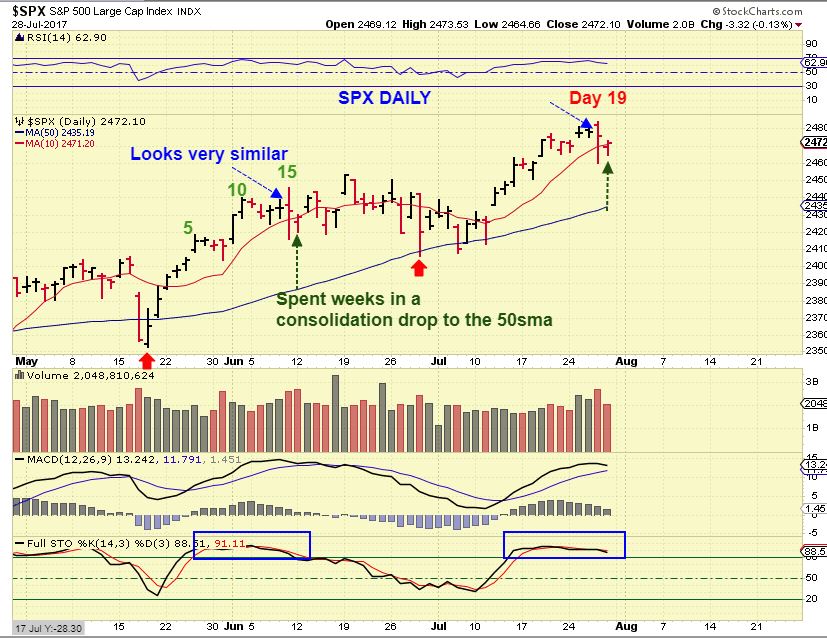
SPX – I understand the “buy the dips’ Theme in a bull market, but is every dip being bought profitable or easy to buy & hold? This week we saw a market slam down on Thursday, and Friday had a small reversal. Was that ‘Buy the dip” on Friday? Notice June 12th.
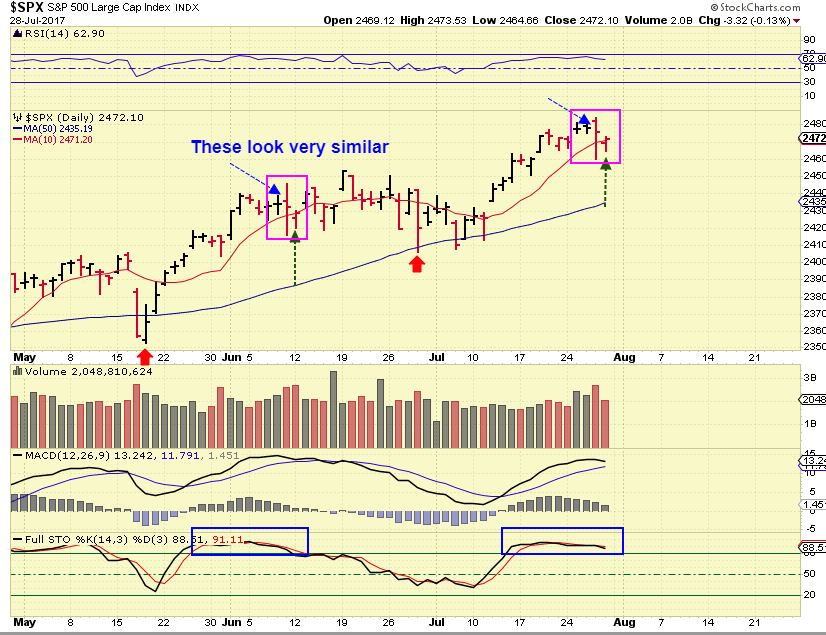
The timing on June 12th for that slam was also similar to this past weeks slam, and price went sideways to lower for 4 weeks into a dcl. ( Each 5 candles is a week of trading). Buying that dip made no money for weeks actually.
SO NOW LET’S CHECK OUT THE NASDAQ …
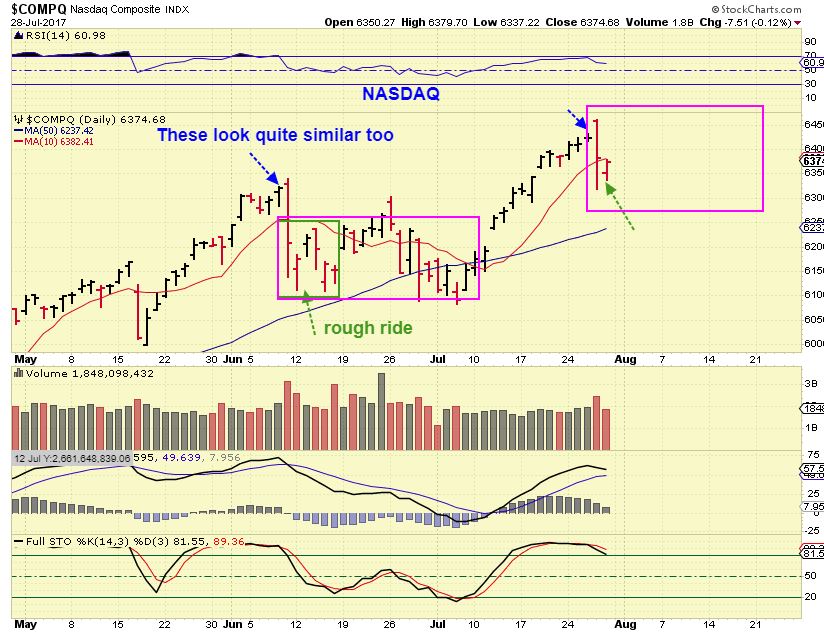
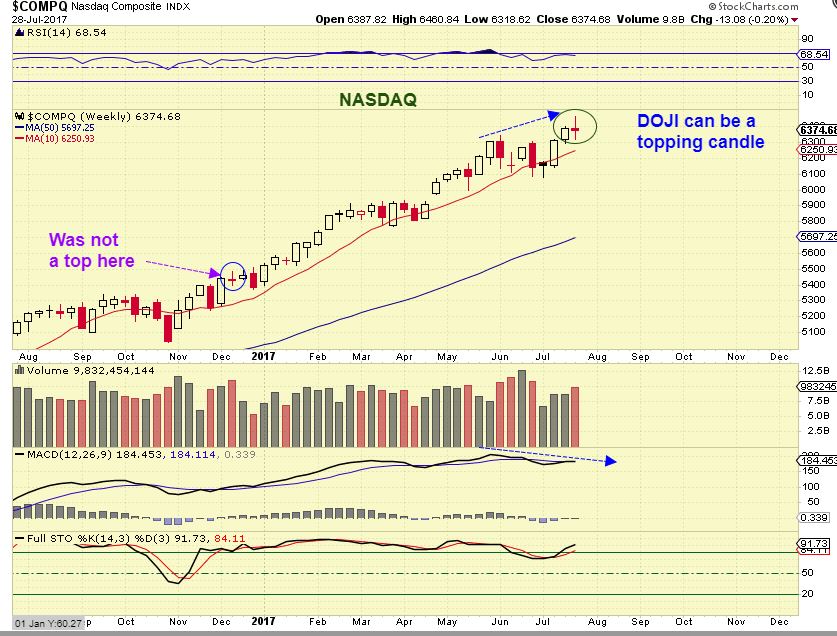
NASDAQ #1– This slam down was a lot less gentle wasn’t it, erasing 9 days of a move higher, before bouncing Friday? Anyone that sold the sell off Thursday or got stopped out now has to wonder where to get back in, or should they get back in. This looks similar to June 12 too, and buying that reversal saw it hit a lower low the next week.
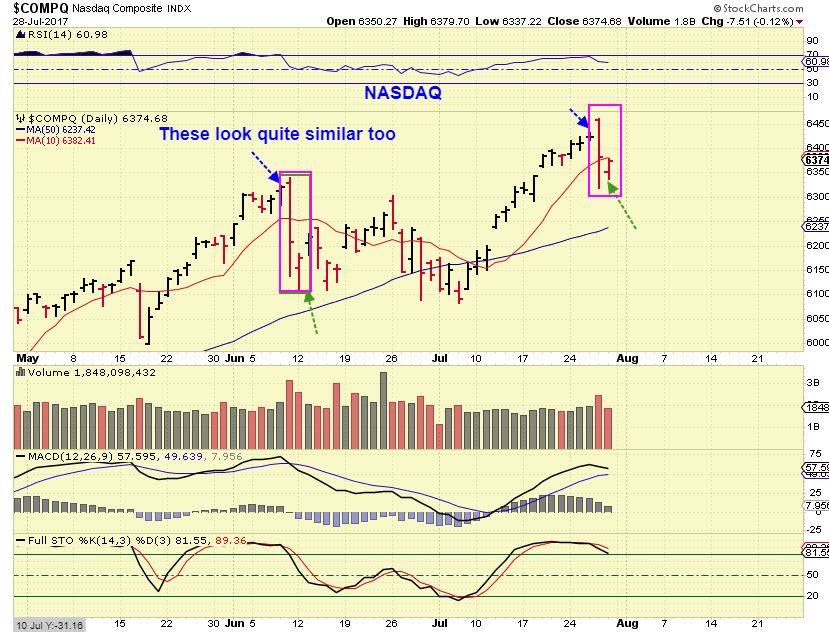
NASDAQ #2 – In June price bounced and then dropped, bounced again and then dropped once more below the 50sma. Look at the 50sma now and we have a gap open down there now from June 11. That gap could fill if this is not a reversal that just takes off higher. That said…
NASDAQ #3 – The weekly chart shows a possible topping doji candle and negative divergence on the MACD& RSI. Anyone who re-buys the reversal may see lower prices again next week. Looking at the past moves, The Nasdaq may just go sideways to the 10MA or drop in the coming weeks.
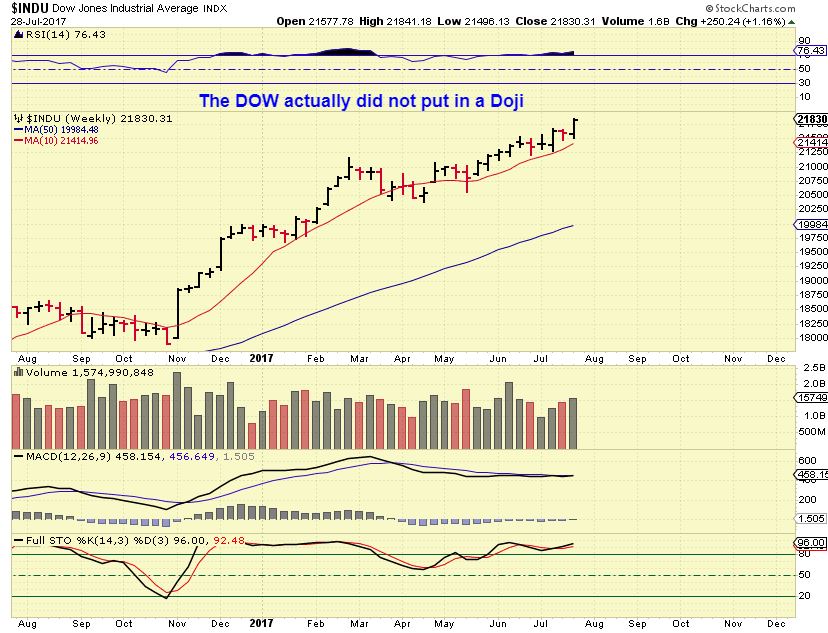
DOW JONES – Oddly, the Dow looks like it is fine, closing near the highs ( Thank you Boeing). 🙂
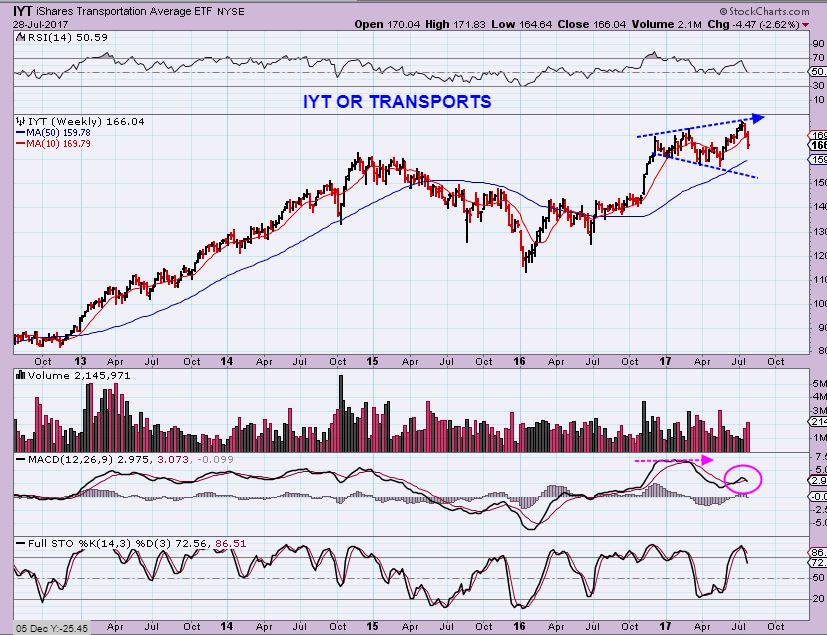
The transports never recovered last week, giving us a reason to be cautious going forward. They definitely look like they are topping here.
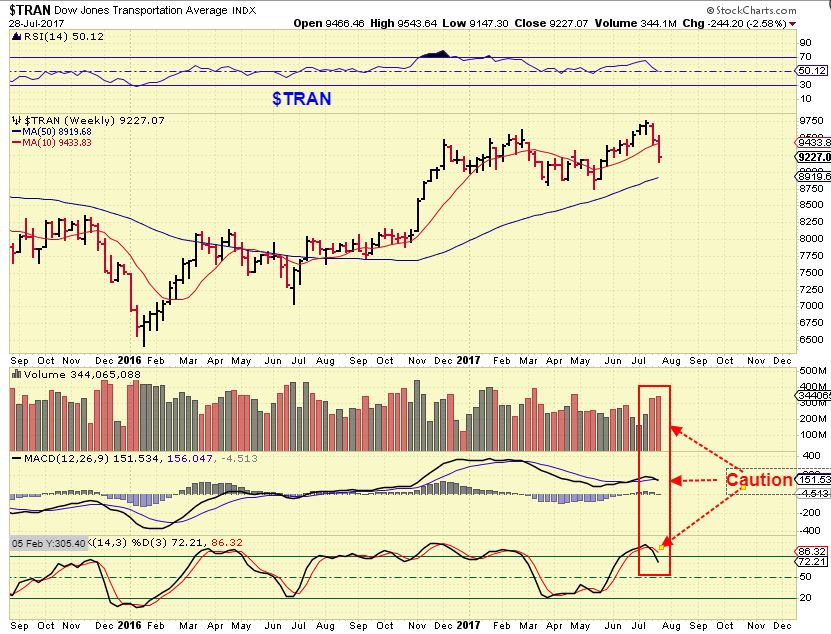
$TRAN WKLY – This actually has a bearish look and the MACD & STOCHASTICS can drop a lot further, so it bears watching if you are long the general markets.
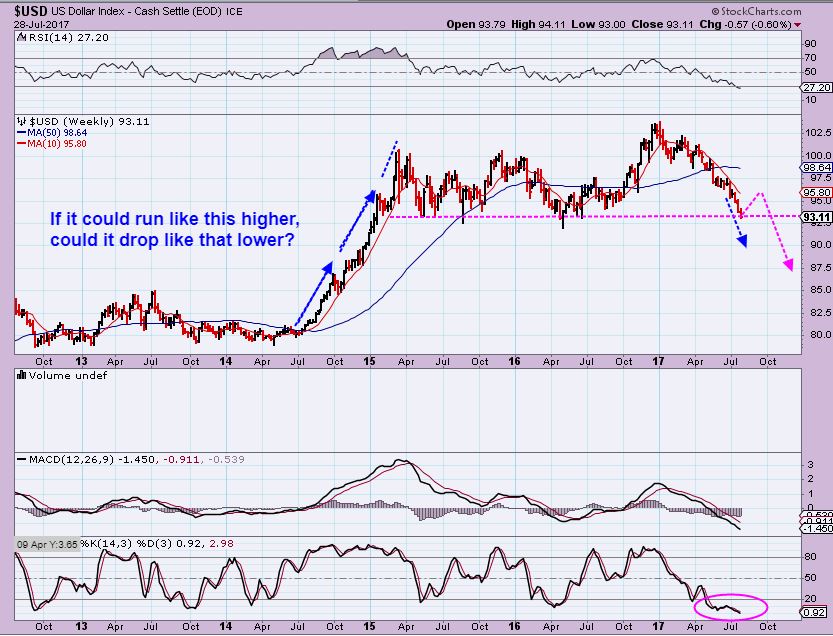
USD – The USD has seriously been in a bit of free fall since May. It is due ( Overdue) for an ICL, and this complicates what will happen with Gold if the USD puts in a strong bounce, but the USD / GOLD inverse relationship has not been strongly in affect lately. I will touch on this a bit more later. Notice how this could drop if it breaks down here.
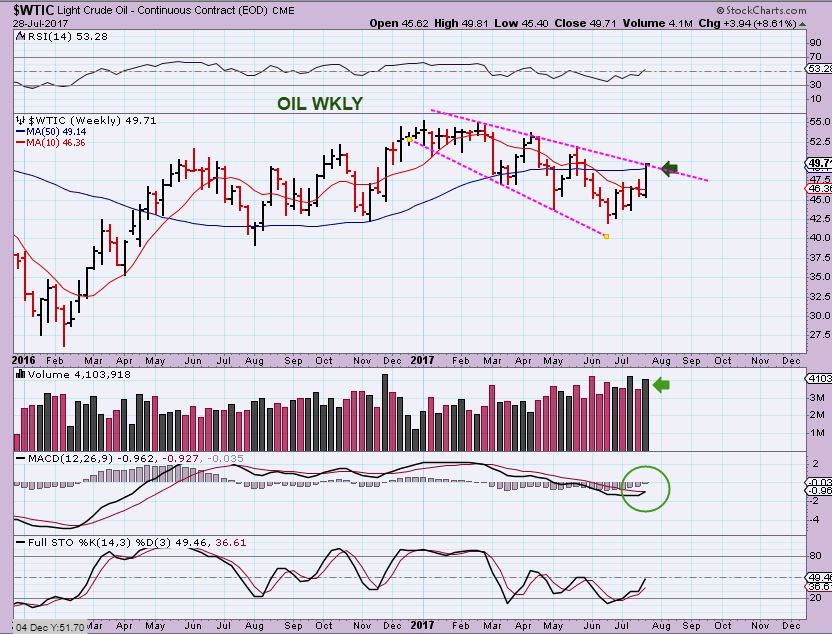
WTIC – Oil looks good here on a weekly chart. It is at resistance, but it did break above the weekly 50sma.
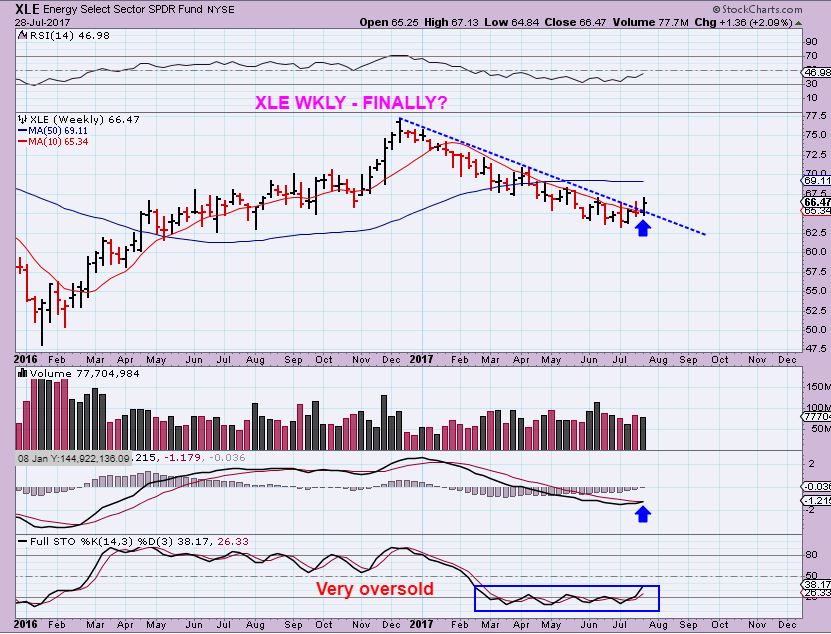
XLE WEEKLY – FINALLY some follow through with these beaten down energy stocks. Not just a break & close above the 10ma, but a close above the down trend line. This is bullish action, and we should start seeing it in the energy stocks.
XLE – And in the big picture, it was only a 50% retrace? That even surprised me, since the selling seemed so prolonged. We can now look for buying opportunities in Energy with a bit more confidence.
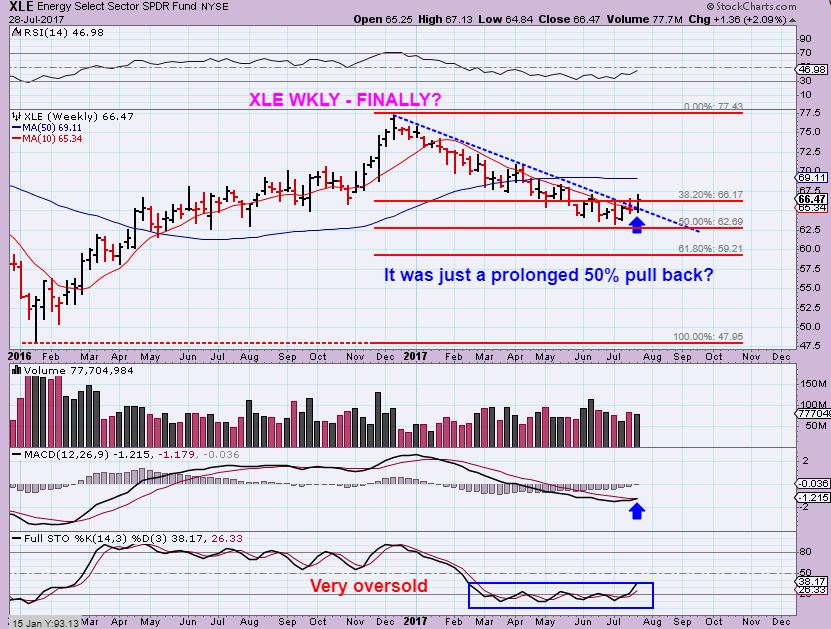
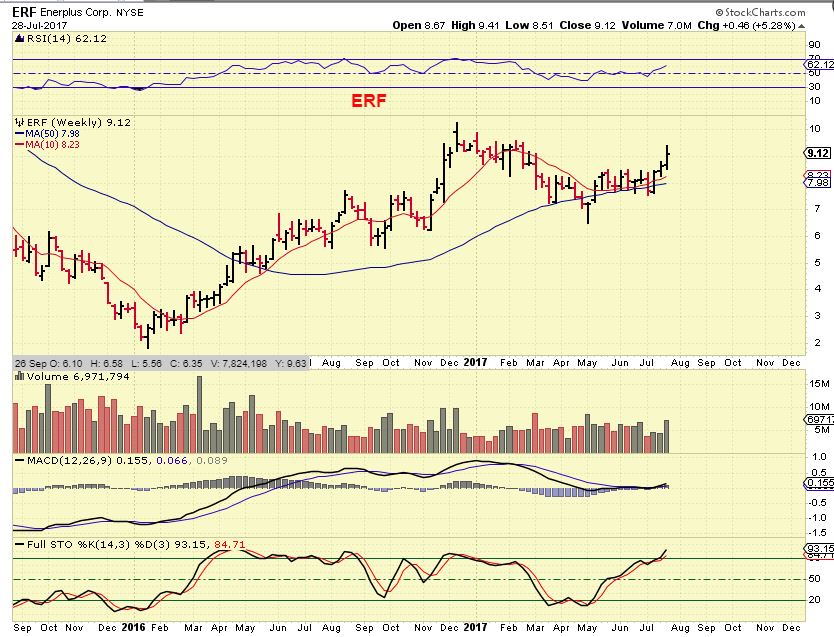
I have nave been pointing out ERF, RES, AREX, SPN, etc as leaders that were already bullish weeks ago. How do you like ERF now after last week? Very nice! Energy stocks may be coming into favor again.
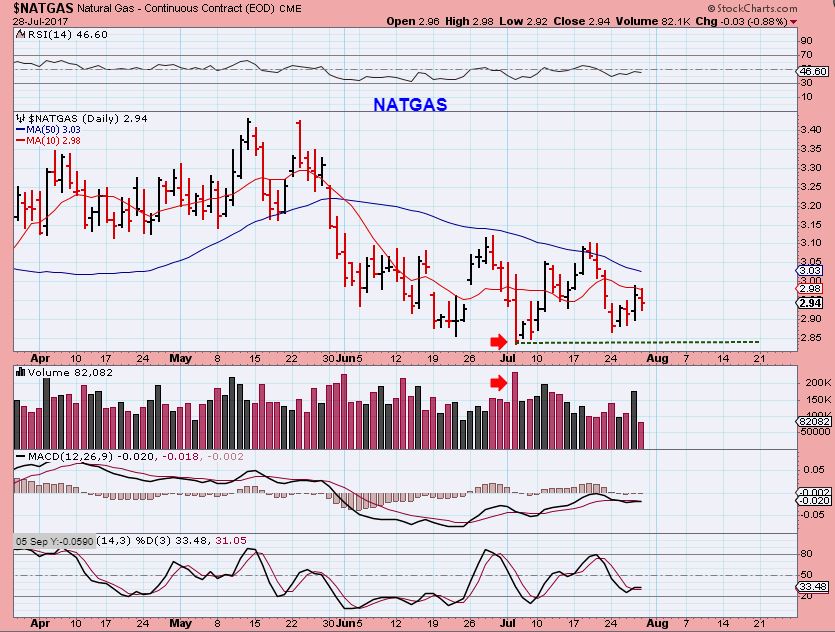
NATGAS -I discussed the high volume capitulation low as THE POSSIBLE LOW using the daily chart.
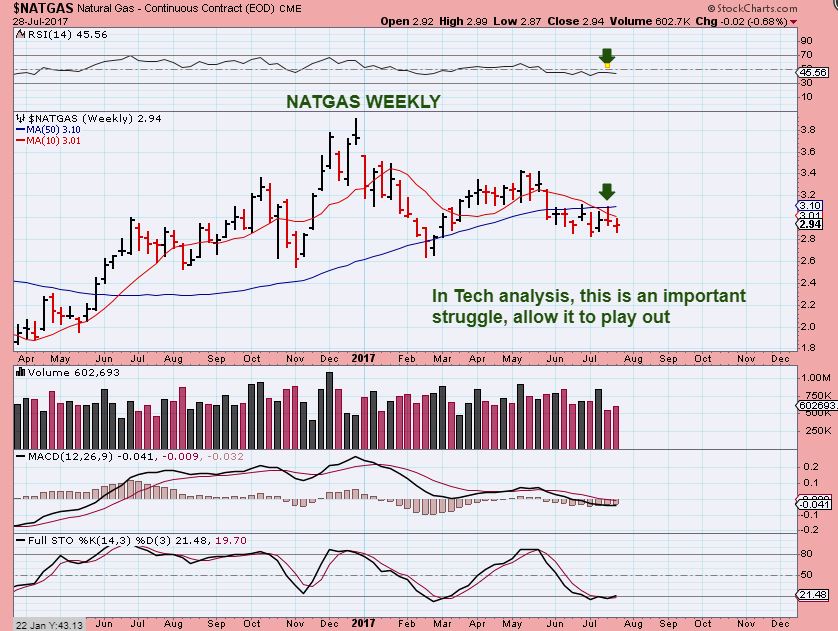
NATGAS WEEKLY – However, this is an important area on the weekly chart, so Natty does still have a little more work to do before we get very bullish. Buying NATGAS here , one MUST have a stop under recent lows for safety sake. It is bullish to see that NATGAS is oversold on a weekly.
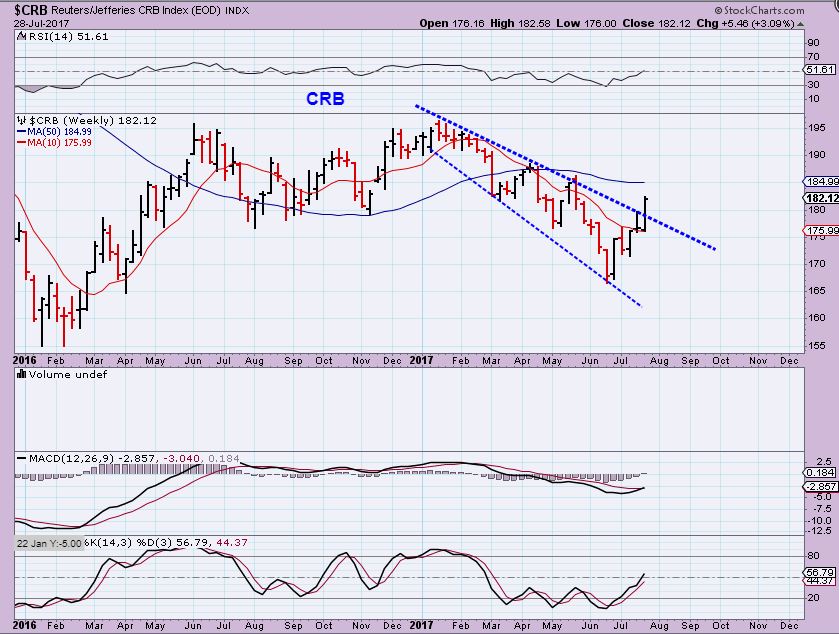
CRB WEEKLY – Another Bullish break out last week.
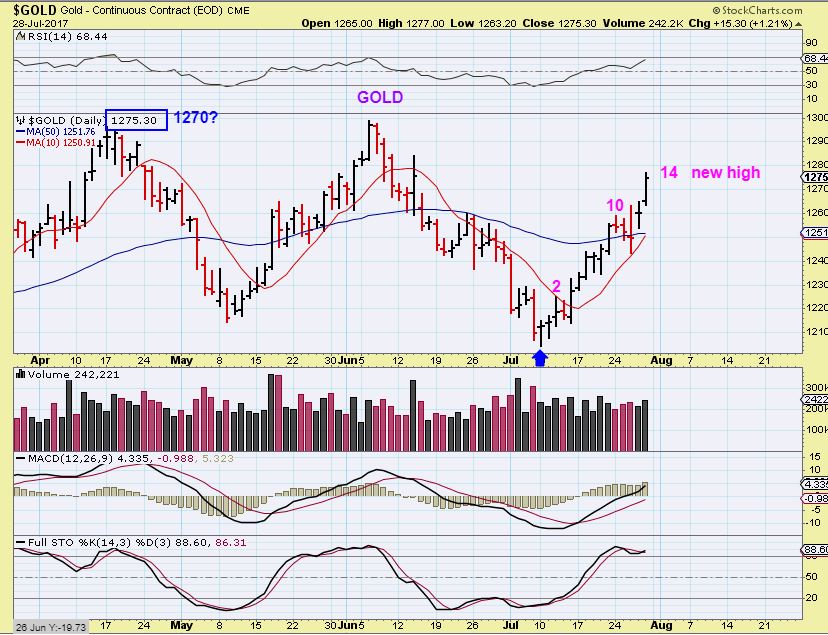
GOLD – Gold has gone almost straight up over the past 3 weeks. Day 14 saw a new high ( Stock charts says $1275.30, but I never saw it touch that price. It is closer to $1270, but still a new high on day 14).
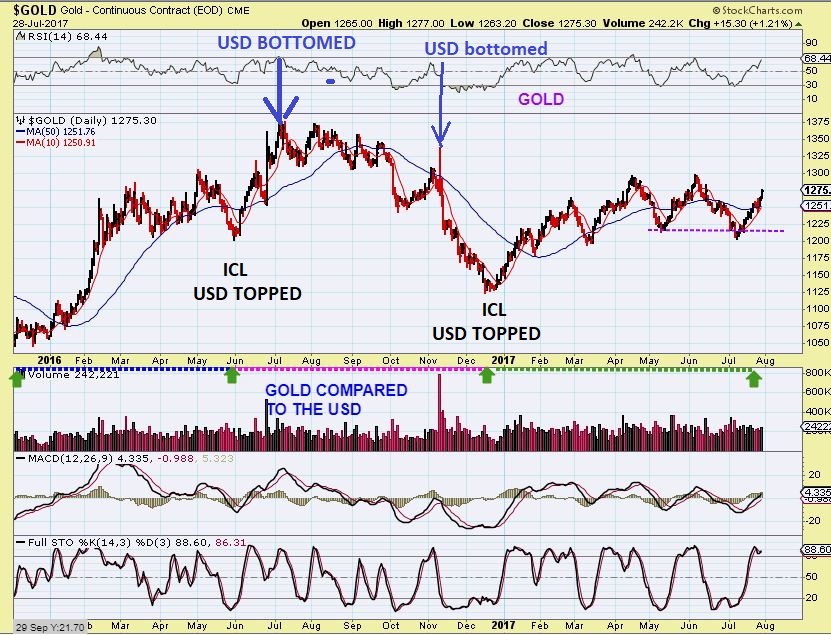
2 charts : On this USD chart & the $GOLD chart below it , you can see that the inverse relationship with the USD & GOLD was strong. Compare the top chart to the one below it. GOLDS ICL ( Low) was a TOP for the USD. A LOW in the USD was a top for Golds cycles. I point out that the ICL in MAY 2016 & DEC 2016 for Gold on this chart, is the Highs for the USD. This is what bothers me if the USD puts in an ICL and runs sharply higher for a bit, so it has to be mentioned as something that we will monitor and follow as we move forward.
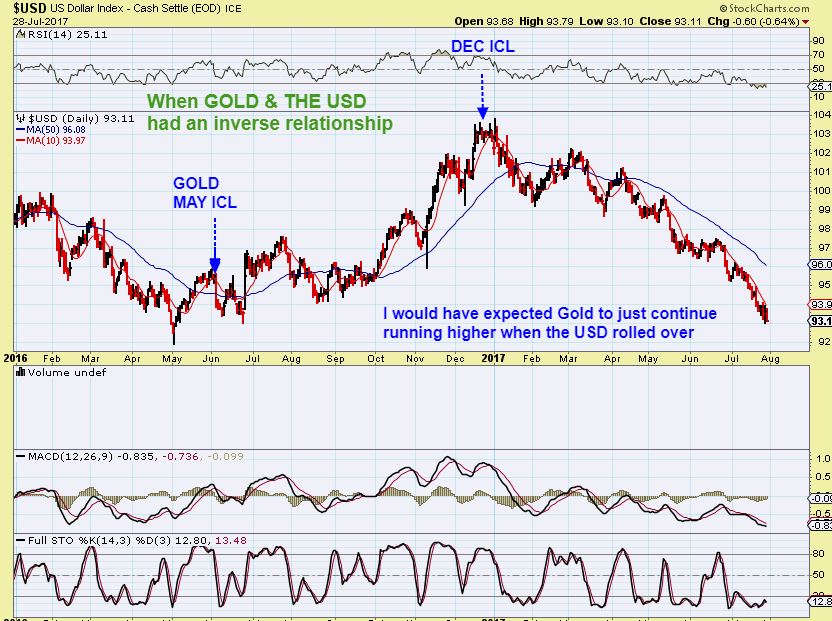
GOLD topped when the USD bottomed ( USD is due for an ICL).
SO this is something that we will have to keep close in mind.
As a reminder: The USD could also go into free fall the same way that it climbed relentlessly week after week after week in 2014. IF the USD falls the way it ran higher in 2014, Gold could run swiftly upside.
MINERS– I am skipping ‘cycles’ for right now, and switching to technical analysis. When I look at GDX this way, I see more bullishness. In past reports, I have pointed out Bullish factors, like Some Miners seemed to have bottomed in May and continue to climb higher, well ahead of Gold. The C.O.T. was bullish, $BPGDM is moving higher, etc etc. So let’s just look at charts and see what they are telling us at this point.
I want to start with a story, the story of NEM
NEM – This was my June 22 chart and I was pointing out this bullish looking base forming.
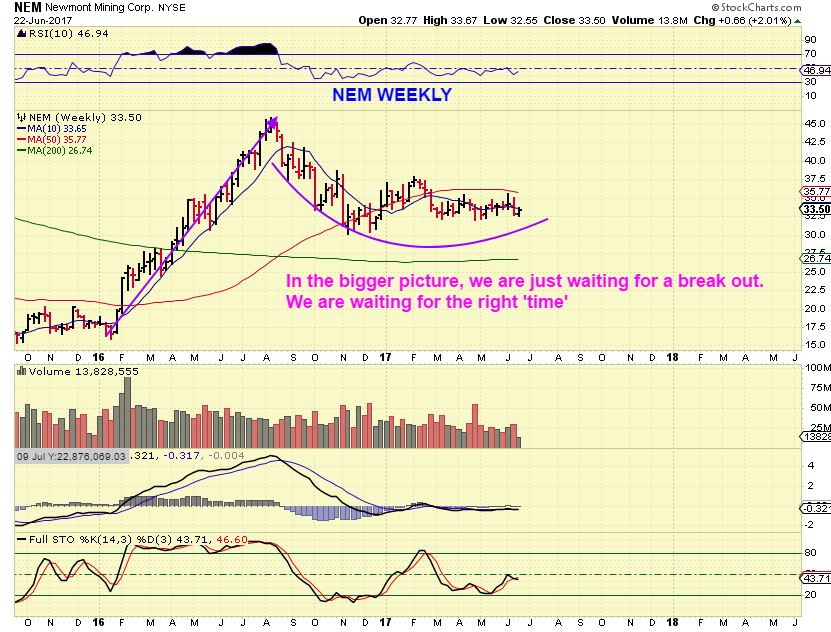
NEM #2- Notice that I drew a possible slam down into the start of July ( Blue arrow) and then a break higher? I drew this is because…
1. We were due for a dcl and
2. We usually get shake outs like that.
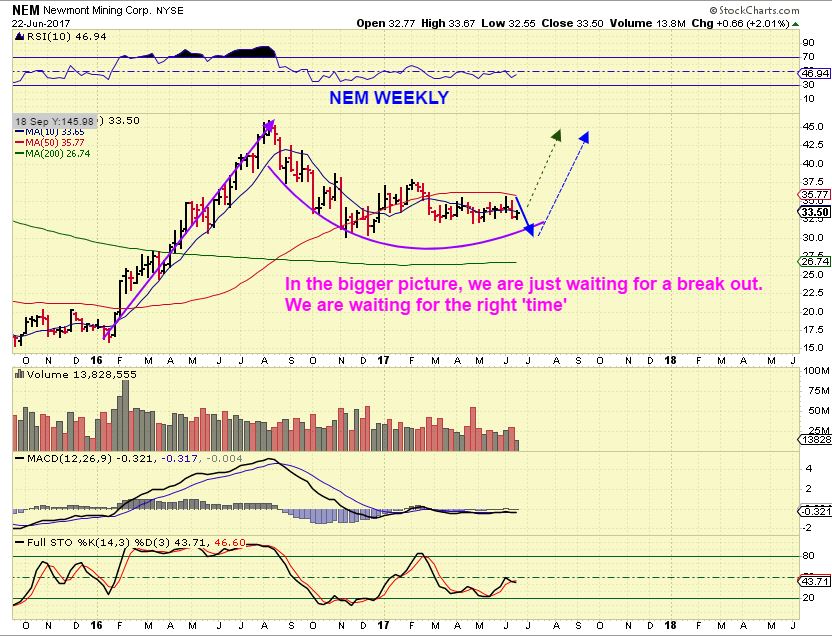
NEM did a shake out slam into July, and then took off. NEM climbed the 10sma and 50sma inside of that blue box , so now stare at the blue box for 10 seconds and then move on…
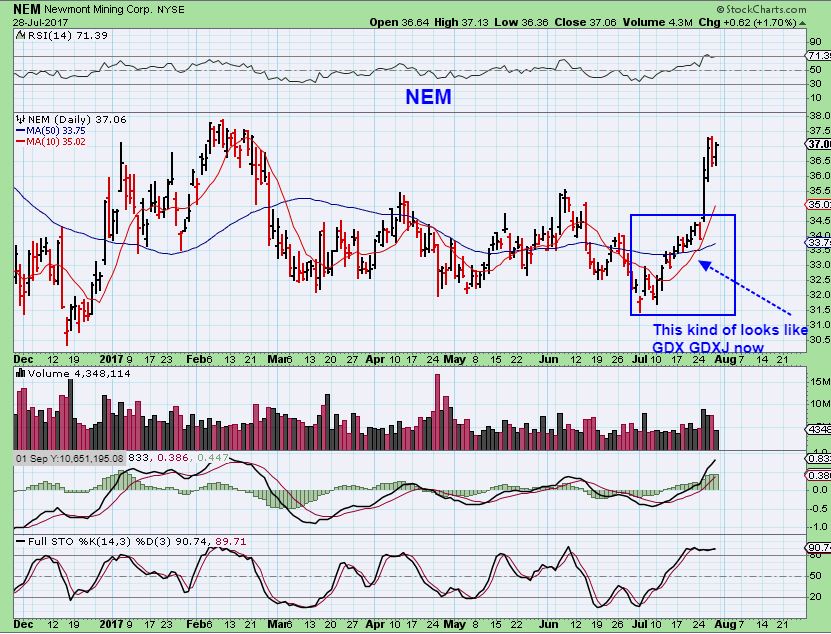
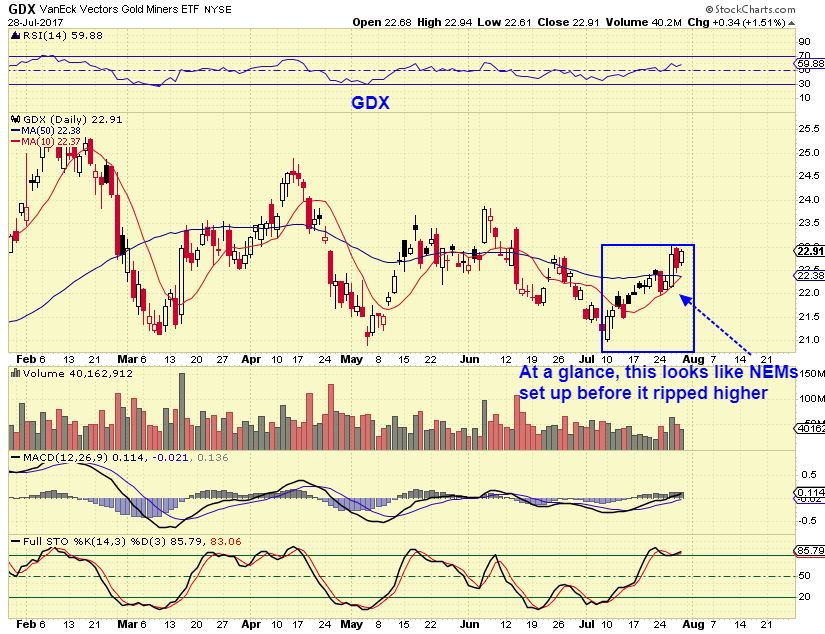
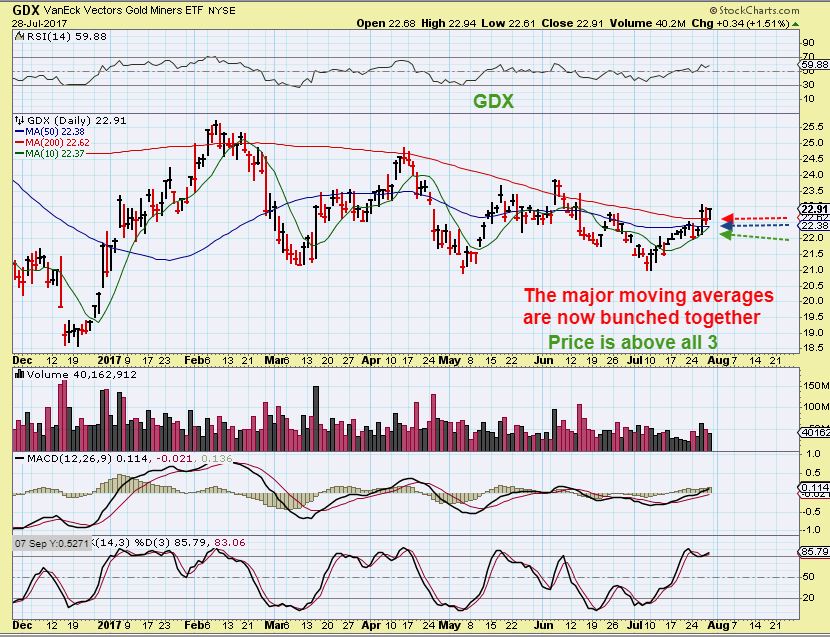
GDX – This blue box looks much like the one on NEM. GDX climbs the 10 & the 50sma in that blue box too, similar to NEM a week ago. So that is encouraging. It tells us that this type of a set up Can break out higher.
Again, I’m skipping cycles because GDX & GDXJ have formed triangle patterns, so I want to just look at the charts and see what they are showing me.
BULLISH SIGNS FOR GDX SO FAR…
#1 GDX – The moving averages were all over the place the last 2 months, often sloping negatively downward. With this triangle consolidation, they are lined up nicely, moving higher or flattened out.
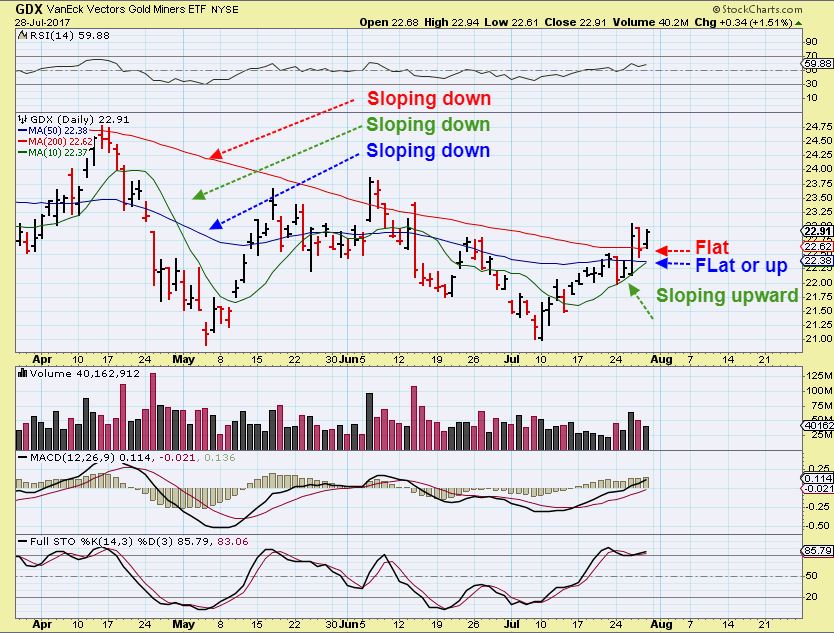
#2 GDX – We have a converging set of moving averages. Moving averages bunched together can lead to strong directional moves, and currently GDX has moved above all of those moving averages, and they are bunched together.
#3 GDX – This one is a weekly chart. Often before an explosive move, we get a tight winding consolidation. On a day to day basis, this tight price action seems choppy & frustrating, and can lull traders to sleep. They get bored and sell out of their positions, because they view this as ‘weak sideways action’. Please take note of the ‘weak sideways action’ of Nov -Dec 2016. That is similar to today.
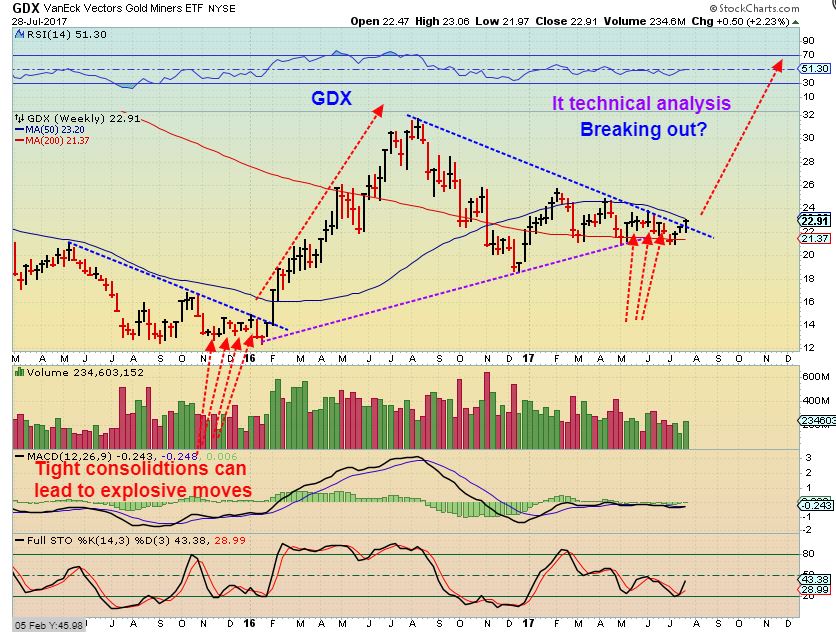
In the above chart, a close above the 50weekly MA would certainly be bullish.
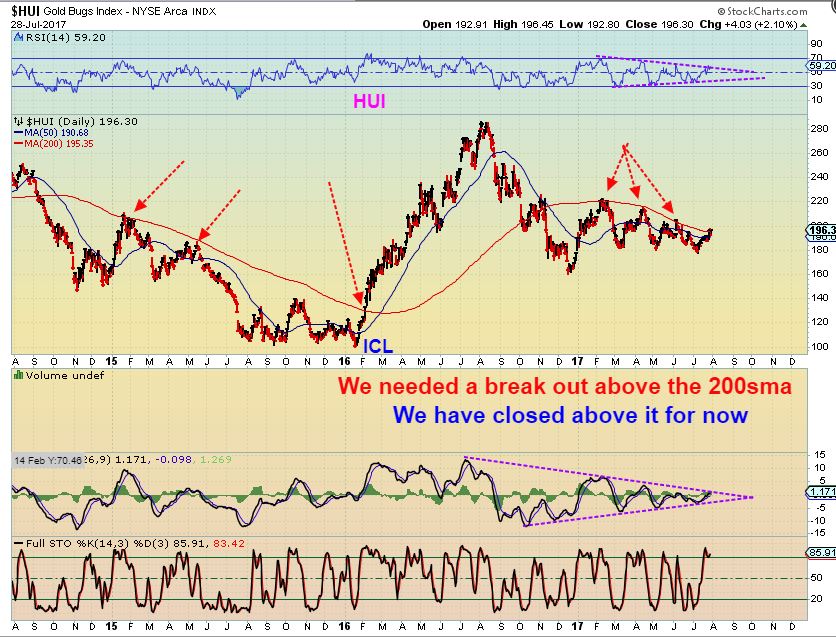
Check out the HUI- It has closed above the 200 sma. The MACD & RSI ARE SO CLOSE TO A BREAK OUT TOO.
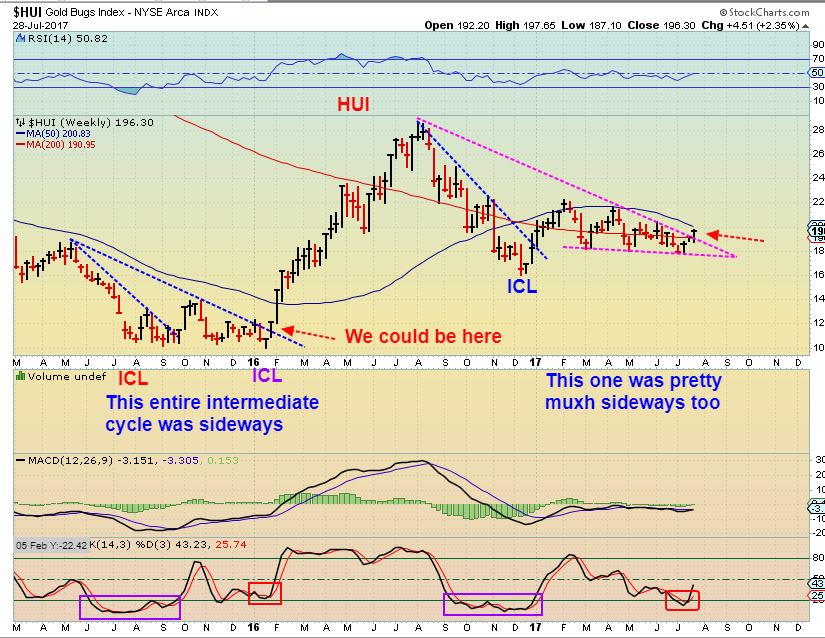
HUI WEEKLY – In Jan 2016 we broke out from a down trend from a tight consolidation for 1 week, and then took off higher. We look like we just broke out of one here too. By the way, when you read this chart, you will likely be reminded that the ‘c’ and the ‘x’ are close to one another on the keyboard – lol 🙂
So that is our weekend wrap up. General Markets saw a Thursday slam down day, which wiped out about 2 weeks of gains. This makes the General markets tricky. This is not the first large slam down, and in June when this happened, people that bought it back watched it drop again the next week and stopped them out again. When sellers decided to head for the exits on Thursday, Selling picked up pretty quickly. Especially since there was no news worthy of that drop.
The USD is due for a low, will this affect Gold? Or will the USD just relentlessly sell off?
OIL and the XLE look Bullish, the weekly charts finally show it on a closing basis.
Natgas looks to have the lows in place, but the weekly chart is in an important area – a battle for the bull & the Bear.
Gold , Silver, and Miners … I have mentioned several reasons that this looks like an ICL is in place in all of my prior reports. I have been long for a couple of weeks, and I have also pointed out that many Miners look to be steadily rising, some with their lows in place in May. Others are still bottoming & within bases. When we get the next daily cycle low, that will be a buy ( A higher low). Of course, I will continue to watch the day by day action in the weekday reports, but so far it has been a nice run up out of the lows. A first daily cycle can peak at day 18, day 20, day 22, etc, so I am taking things a day at a time. The charts in todays weekend report remain encouraging. Enjoy your weekend!
~ALEX
UBER-BULL in GOLD & MINERS?
Not so fast with the name calling 🙂
What if the USD bottoms and moves higher before rolling over into another continuous steady drop?
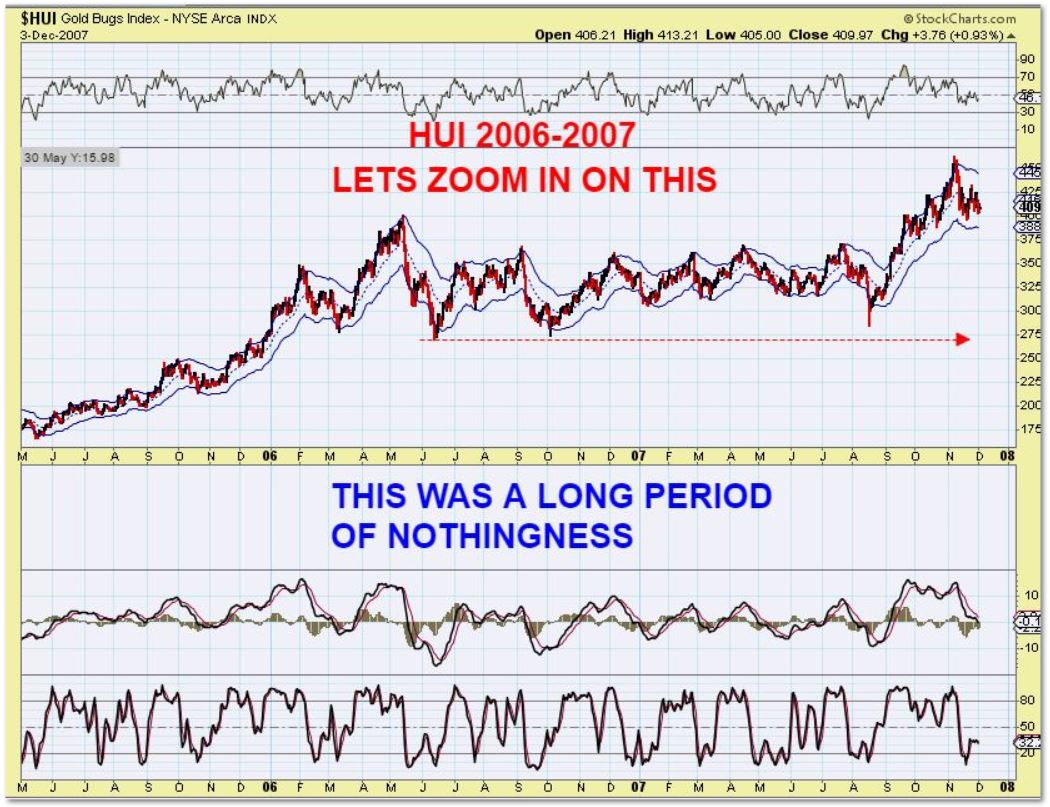
I also remember trading the Miners during the year 2006 to 2007, and unfortunately, I need to show you this time period too. It was also a period of ‘consolidation’ during a nice bull run. I just wanted to show you that no one was really able to predict this type of continuous sideways movement. E.W. didn’t help, Cycle counts were not helpful, and so on. Daily cycle after daily cycle drove us all crazy. Money was made & given back on a regular basis for the buy & hold crowd, and even traders scalped little month after month, because we expected it to just continue higher. The reason that I post this chart? Consolidations end when ‘time is up’, and sometimes these things take time. This consolidation lasted over a year!! The good news is that currently, we do look to be in a triangle consolidation, and that triangle consolidation does look like it wants to break out higher now, not later.
July 28th – Bungee Markets 
 Tuesday August 1st
Scroll to top
Have a good Sunday,alex. Love.the chart with the three moving averages all bunched. Nice catch.
Thanks Rob, I like that too, it often leads to a nice strong move, let’s hope that it is a strong move higher 😉
Alex, thanks for the report. Really enjoy when you put a few tidbits of learnings in there like….ma and strong directional moves. helps when I look at other stuff as well. Thx!
It’s crazy how he catches all that stuff, right? I knew all of those facts but I can’t remember them all when looking at a chart and cull them out and get the right analysis. I don’t have that “vision” that he does – which is why I have remained a loyal member! 🙂
Thx Cason- that’s kind of you. I need things to add up like that for confidence in a trade too .
Thanks Deshy- it’s definitely encouraging when things line up
You are a wonderful sleuth, Alex! Your long experience is such a bonus
Btw, regarding your Friday Stockcharts gold chart —
It appears that your 1270 high was for the August Contract
Stockcharts’ shows the December contract – with a daily high of 1277 (It closed at 1275.60)
Thanks Cal,
As for Gold price-
I just never saw it trade there real time on Friday , and I didn’t think that it showed up on kitco charts either or any of the other charts that I use.
Great report interlaced with educational information. Thanks!
Batten down the hatches H50 – I thought of you guys down there in Florida when I saw that
A tropical depression just formed over your area .
Hopefully you dont lose power.
are oil stocks looking good to buy soon? thank you
Hi Todd,
Some are. As I have pointed out , even in this report, ERF looking good ( A chart is in this report), I have liked AREX, RES, SPN, etc
that was pretty muxh an excellent report CF!
How about CENX? I wish I had bailed when you dumped UEC, and now I gave back that gain.
I looked at Kitco Aluminum and they show warehouse stocks dropping and the price of aluminum rising or staying stable, but I guess none of this matters when a stock decides to swoon.
My Monday morning question is should I bail and save a break even or ride it? How’s your crystal ball on this one?
Or maybe, just maybe, this is the time to add that you talked about a week or two ago????
hahahah….I was pretty muxh thinking the same …oh .. and I’m just wondering why he didn’t use cycles…;)
Yeah, the report was pretty good but there was no cycle update on miners, not really sure why… 😛
Something to do with triangle patterns in miners messing up cycle counts?
Maybe? If only be would repeat this enough for me to get it (Sarcasm Maria-style!!).
CENX hit 2 year highs last week, so the stock is doing excellent, but it reversed and now the weekly chart looks like it wants to possibly pull back. I’m going to post a chart here, and from this chart you should be able to see what I think it is doing, and you can decide if you want to long term hold this for $30 , or of you want to trade out & re-enter later 🙂
It is not an easy ride, but take a look at this chart. It has been a bull run.
https://uploads.disquscdn.com/images/4039888e2c39cd084f000dbe40301bf7435e2f954ac21aaf9fb06263bbbbdbd8.jpg
nice
yep, mucho appreciado
Maria, Im trying to remember, who is it who has been telling us about retesting the breakout is where to BUY? #HFT
lol…. turd
Hi Alex. Are we missing out on LABU up 50 percent in 12 months, is it tome to join the success?
Bill and I are in LABU. With the possible topping action in NAZ, I’ll look to book profits on next pop. CF has mentioned some lower priced (though potentially higher risk) bios recently.
Hi EJ,
Not sure how long you have been here, but did you miss a biotech etf trade? I didnt.
I have been posting entries into XBI & IBB ( That translated to LABU for those that like to trade 3x ETFS).
I put in my reports even last week a target of $90 on XBI.
I also traded LABU .
And also riding a 3x ETF for 12 months to gain 50% would have been impossible in my opinion. They are meant for shorter term trades and the swings always scare traders into thinking that they should sell, because the drops can be quite large.
REFRESH
Riding a 3x etf for longer periods of time is not fun , but the underlying sector ( Biotech ) has been bullish, and trading it at the right times has been rewarding. Some of these drops on the chart are $10 drops, and many would be very concerned
https://uploads.disquscdn.com/images/db719d0c10d9045771e27088c05b3a1d1b01cd07c55b9434aaee6f6300070b97.jpg
Wow, NATGAS down 3.5% and is testing that high volume capitulation low from early July.
great call….
Amazing, as always, Alex. Thanks for tempering our unbridled optimism with large dose of historical reality,.
Alex, do you still have a position in CRMD?
I was stopped out but basically it is still basing out ( Kind of looks the same on a 3 month chart). Rather neutral
THM.. holy stop run…
*giddyUp… 😀
**please….
haha
Wow- And only 6,000 shares traded? Thats crazy
i’ll never see those spikes on low vol the same again, after reading Bob Moriarty’s article at weekend.
Never put in market orders, esp. on juniors, cuz your broker might just rob you blind
I’ve read those articles for many years, but I still use a market order most of the time.
Dunno if you’ve already read the one i’m referring to, but for those who ain’t, the killer quote was… “Someone put in an order to sell 5,000 shares at the market to insure he
would get an execution. And he did. From a close of $0.48 the day
before, the shares went to $0.09. I don’t have any clue as to who the
hopeless seller was but finding the culprit who stole $1,950 US from the
investor was easy. All you had to do is go down to the slimiest gin
joint around Wall Street and look for the broker with the giant grin
buying free drinks for everyone.”
BA keeps leading this market. Internals are weak but BA is the next INTC, GOOG, FB. That is funny
CYTR going again.
🙂
EDXC .. niceeee
I didnt look at this when you mentioned it, but I just looked at it and saw that it recovered the 50sma, and a 2 year chart weekly actually shows that it fell to an uptrend line & turned higher, so the overall chart looks pretty good
Here is a buy set up ( Uranium stock) , It has the same volume after 1/2 hr that it had all of Friday
https://uploads.disquscdn.com/images/bf9fec81de9f1f4fccdf61d903ca923134e7b22b8baf73cb0b6a2e6fe1062170.jpg
beautiful….
gosh i luv ur charts…. sigh….:)
Yeah, this is a nice looking break, could run to $3.00 as a target
#HFT
https://uploads.disquscdn.com/images/cfbdf04e4b0a204dd8c88400eb038b5edb775e5aa390cf0ad7e1efe5b5a9a460.png
Make URRE Not Suck Again!!!
it seems they had good drilling results – btw it’s the second biggest position in URA
First PT hit on IAG – Still holding 1/2 postion
any thoughts on catching a falling knife with EGO? We’re down around 1/2016 levels
Dave – this is not a comment on whether it is a good buy or not because I have no idea, but…..
This is another one that pre-reported an earnings miss weeks in advance and it was ignored and then on earnings day – bam – as if it was some kind of a big surprise. Geez for 3 clicks of a mouse button this stuff is so readily available
Since you said , “Catch a falling knife”, at least I know that you know it is high risk.
I dont like it when a Miner is crashing to new lows and Gold has been moving higher, so personally I wait for it to prove itself to at least have some kind of buying.
THAT SAID, It will probably see some short covering soon, and if I tell you to avoid it, this will be the lows and it will shoot up 20%, right ? LOL
SO here is the chart, I guess you can use this as a guide
https://uploads.disquscdn.com/images/3e912796675dbc329e67aa4ed73d644fd3735580586ee332fa0cb1b9ee1893a8.jpg
Thanks! It just seems to be a stock that has had many rather large slam downs in the past, all with decent recoveries soon after. If we’re entering a positive environment for miners, and seeing that we are pretty close to some solid support levels, then this could possibly be a “buy when others are fearful” situation…
Alternatively, the building could legit be on fire, and any attempt to rush in might be suicide… probably best to just watch at this point.
One thing is sure, it’s low risk with that triangle. You are basically right at where your stop will be. Of course with my luck, I get stopped out just before it takes off.
Hi Dave,
Over the weekend I read an update from a very successful fundamentals guy (he doesn’t follow technicals at all) who removed EGO from his portfolio & listed out what seemed to be good reasons Having said that – this morning’s drop may be partially due to his subscribers’ selling.
Don’t know if that helps!
APHB – VERY TRICKY, probably should be considered risky, but it is a possible buy too.
Broke the 50sma in a small uptrend, now landed back on it. I love the 3 month chart, but the last few days has been painful selling, simply because this moves in BIG SWINGS. It just dropped $1.20 to $0.85…that is not an easy ride.
Proceed with caution or just ignore it all together.
about time…. zzzzzzzzzzzzzzzz
The last three days have been even more painful if you own it like me. LOL
I own it in two accts… lol… i think it will be fine & will rip sooner than later in either a “C” or 3rd wave ……..
….its gonnnnnna Ripppp …..
#KeepingItSmall #KeepingItReal
FYI … TQQQ is a “sell” on my daily charts so I have tightened my stops to $109.74 to lock in profits, will likely be stopped out very soon. Will hold a small position longer just in case.
CYTR going bye bye? 🙂
She cant breach 1.00
oh shhh…
RES already reported a few days ago and is taking a whack down.
As is SPN!
SPN is a bit more of a concern here- I didnt want to see it drop below the 50sma again, we’ll have to see how it closes (I do not own it).
Manipulated heavily the morning of the 26th, very similarly. earnings had already been out. Just broke 3 min trend-line now looking for a retest?
Closed $0.12 above the 50 SMA.
It is a good chart.
It’s down 3% as I look, and that move today is nothing for RES. It is all part of the uptrend
My stops are well out of harms way to let this one do the work it needs to do. It doesn’t have too far to go to be in the blue-sky no more overhead territory. I would like to add.
I would not add yet, I think she can drop a bit more, but it would still not be violating the uptrend.
I would look at it this way … Refresh – And notice that stops under the 50 sma were run a couple of times 🙁 Frustrating. It may dip below the 50 & return.
Personally – if it were me – I’d add on a reversal off of the 50, or a dip below & recovery, but not before
https://uploads.disquscdn.com/images/5b6b78bce40490d10b49d3fd4fd962a4e8d8f50458c515de0b437abba1e778e9.jpg
GDXJ = new high for July
… keep onn …keep on .. keep on ….dancin all thru the nite…
DRD .. nice
Thats what I’ve been waiting for 🙂
https://uploads.disquscdn.com/images/4f1cc4f9b922f2db378e40777a02beee024c91ef2f1269eb121b12e2585c9f4d.jpg
I also think TRX wants to rip to a buck … sooner than later??? 😉
Yes, please, Momma!
NSU is poking above the 200 day ma. A close there should be constructive and will validate a 4 month H&S pattern https://uploads.disquscdn.com/images/0ea2277870016e50a7ca6630e4e5f73cfd71fb5718523e8803465a6d44a6b923.png
I like it too 🙂
IVPAF Congo copper mine continues to impress—large volume.
IPI : significant resistance @2.95, time to sell?
I think that IPI is going to work through that resistance ( I think it is rather minor resistance actually), and then pull up a 3 year weekly chart and take a look at what happens if it can break free 🙂
I tried to find the weekly from my past report, but couldnt find it quick enough
I found one , from JULY 15 weekend report
refresh
https://uploads.disquscdn.com/images/778856305c22bb174e697d4ec8f968bee5e722705d34cb7f2f0b2010e67f1523.jpg
Time to add?
It could be for some. Others like to wait for the break out to confirm that it is strong, but I look at a 6 month chart with the 10sma, and it looks like this would be a decent place to add.
You could always hold what you are holding for the long term with a stop under the 50sma for current holdings, and just stop out on a break below the 13 sma on whatever one adds today.
Thanks much Alex. Sorry just received your response. I like the 13 sma. It’s been mentioned before and I’ve been playing with it. Why 13 though? Why not 12 or 14?
Thanks Alex, great information. That three year chart is very compelling.
AND IPI now moving higher
Utilities Anyone. XLU looks good here
CENX might be rising from the ashes
CNAB up 8.6%
Yes, CNAB & CNBX both looking pretty good 🙂
Any thoughts on XRA
That’s a hard one to get a solid read on. It had that huge gap up 5 months ago and has consolidated since then basically.
It was an interesting move so far today, but only 28,000 shares.
That could be a good thing, because it gapped down big, and that means it gapped down on tiny volume and then was bought back, trying to regain the 50sma. Overall it still looks like a sideways consolidation until it breaks out higher.
Thanks for that CF
Sure, and by the way, a 2 year weekly chart looks great, it is just in that consolidation phase for now.
HBM making mommy proud….
#CF
Alex, I recall your saying recently that you had a small amount of leverage in place. Do you still? I am in front of my screens during the day, so I can monitor the small amount that I have in place – just wondering if you still do since Gold is on day 15 (we’re not counting the cycle in miners /;^)
I do still own it , and I’m watching for GDXJ to maybe tag that 200sma , or break above it and back test it? So I am holding it with the thought that this could top on day 20+.
Be safe : )
Thanks!
Does anyone remember me making this comment last week? Refresh
I was seeing unusual activity in this stock pre market and also intraday for a few days ( Big Swings) , and decided to comment o
on it.
Check it out today
https://uploads.disquscdn.com/images/0d1d07120c9c0dc02f358fd2654860d6c9791a55fc8639a84c33db53356d40e1.jpg
Somebody knew something was coming
wow…
Yeah, refresh and check this out….
Heres the weird thing to me, the day that it was $2 higher in premarket, and then sold off $ 2 down during regular trading, it dropped to the $8 area – that was a shake out running all of the stops, and then bounced right off of the 50sma and went higher.
Thats just weird and looks just about as ‘manipulated’ as I have ever seen in real time. Then today it was up about 100% at one point.
https://uploads.disquscdn.com/images/6c8b121b96404e8da7f7ad416da5fec3914b8b4939a3f7d582a9ced8d9c74b9b.jpg
grrrr …
IMDZ … hmmmmm
Earnings 8-4? Pump and Dump……..
“Dynavax Technologies Corp. (DVAX) shares surged 88% in
premarket trade Monday after a Food and Drug Administration advisory
committee said the safety data for its hepatitis B vaccination supported its
approval. The advisory committee voted 12 to 1 on the safety data, with three
members abstaining from the vote.Hepatitis B vaccines already exist, but current ones consist of three doses over
six months, while Dynavax’s(DVAX) HEPLISAV-B vaccine is two doses
over a month, the company said. An FDA decision about approval of the
vaccine is expected by August 10, and the company said that if
its vaccine is approved it will seek a recommendation from the CDC’s
immunization practices advisory committee. Dynavax(DVAX) said it plans a commercial launch of
the vaccine in early 2018 “on its own or through a commercial partner.” Dynavax(DVAX) shares have
surged 66.7% to $9.25 over the last three months, compared with a
3.7% rise in the S&P 500.”……… Incredible market for this vaccine!!
AREX looks like a BUY to me
Even with earnings on Aug 2?
That is a personal choice – It may be best to wait
Natural Gas heading into ICL . Its a buy at 2.413 into mid August.
US dollar taking a hit…..Scaramucci fired…gold up slightly.
omg really?
Really!
Kelly said there was only going to be one sheriff in town.
https://uploads.disquscdn.com/images/b0314b4eb802cc1c87820254496390522dbf45bf36ecb2c760b8ff51651363c9.gif
Might be shooting himself in the foot!
CYTR…. get thru………………………………………
GPL?
1.30 break
That was quite the volume spike, so I added to my position
as we were just talking about her being stuck in the mud lol
I like the base, but it’s time for her to leave home base, dontcha think 🙂
It dropped to the 50sma and then reversed this am.
Refresh = need a break out now
https://uploads.disquscdn.com/images/614ff420ca5b2a1dab0e2ceb55070692d27fae7bfccff9824df165afe7a3fb76.jpg
i cant get over ugaz … woooosh…
And that volume
GPL earnings in two days.
Thanks –
Just had large volume trade! But what about BTG?
STLD breakout and backtest? What do you think?
https://www.tradingview.com/x/p3yBDltH/
Looks good so far
TGB…lookn good
thats another i nearly sold.. but this time, to take profits
Gold rocking out – Miners down. Whats new lol
wow, i nearly stopped out of sexy SXE… now up +25% since the earlier low
Wow, I can see why you almost stopped out, that was quite a slam today below the 200sma.
Glad it missed you with that recovery : )
I remember the way it dumped me late last year, and figured it might repeat the pattern with a big spike down and V bottom.
This time i toughed it out!
Hi CF,
Can you comment on NAK? Tx.
Hi 747,
I am still holding some, and with commodities really doing well, and Miners starting to also move higher, I would expect that it will too. Right now it is doing a sideways consolidation, and I am hoping that it is building up energy to break higher and get back above that 200sma.
It is an odd chart pattern at this point.
SOXX breached and then closed right on the 50
Action and volume in LODE ! 🙂
Good catch Crystal, thanks for sharing
The morning report was released a bit later this morning, but has now been released.