
Wednesday July 19
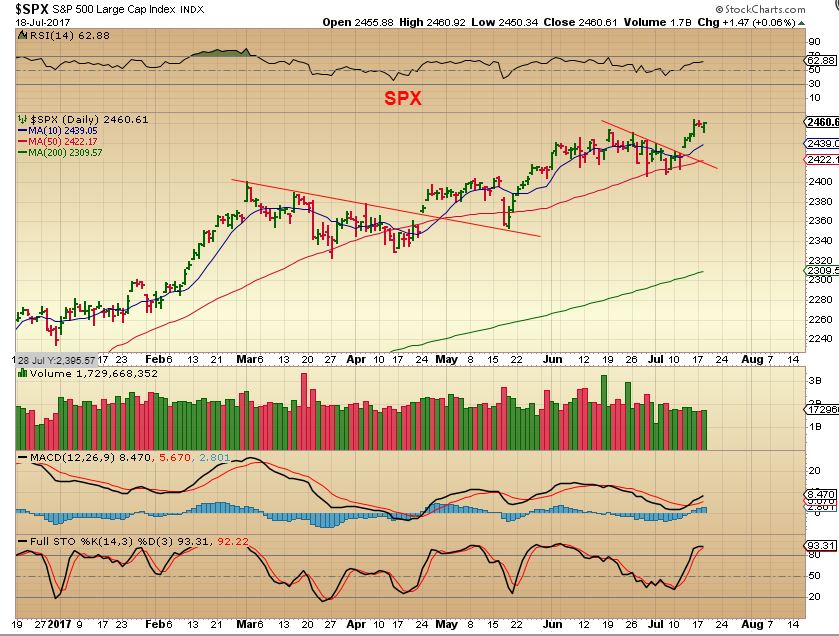
SPX – Going long the break out is still working with a loose trailing stop, after this long sideways consolidation. The SPX held the 50sma in the recent drop.
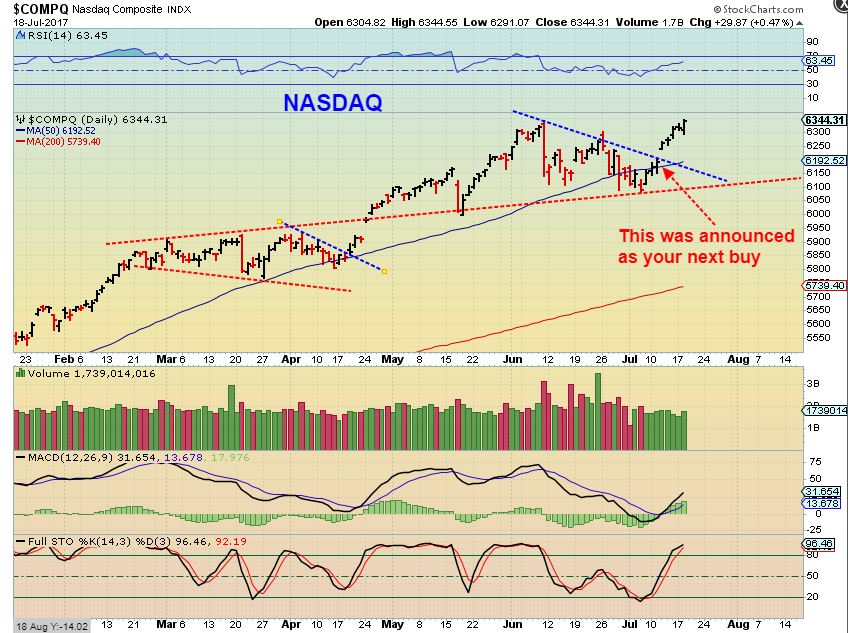
NASDAQ – Twice this year we have seen the NASDAQ go sideways and sell off for weeks giving buyers an easy opportunity to enter. After another 2 month sideways consolidation and sell off, a buy was issued here as it recovered the 50sma. Notice that on occasion, a Sharp 1 day drop occured out of nowhere ( We had them in March, May, & 2 in June). A back test to a trend line. Well…
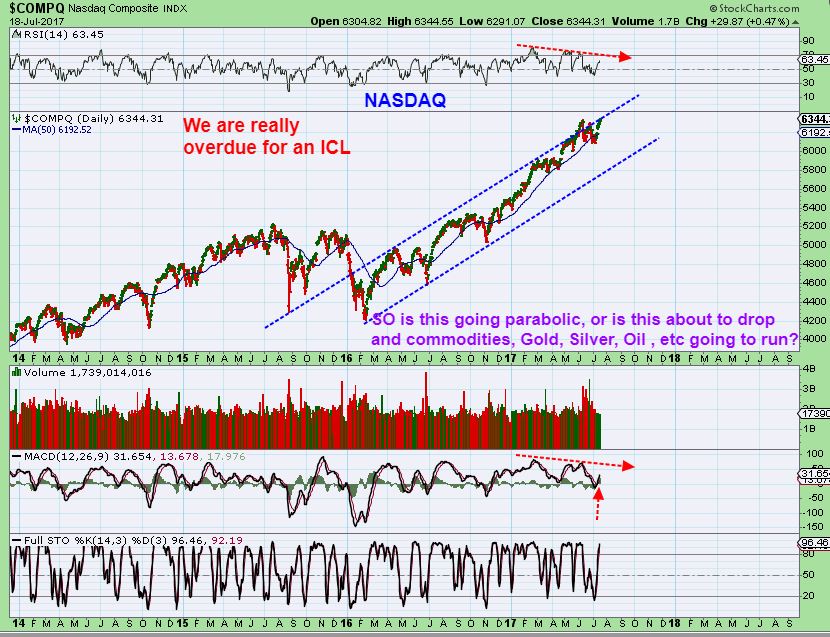
NASDAQ– The NASDAQ Bigger Picture really is due for a deeper pullback into an ICL, and has returned to the top trendline area, but never really dropped into what is a noticeable ICL. Will it? It may, but it doesn’t have to…
1. It could break out from here & run at an even steeper pace (Parabolic).
2. Or continue sideways, higher, sideways, higher like it did in Feb, March, & April, just riding that 50sma.
3. This sideways action could continue in a topping manner & drop into that ICL like the summer of 2016 & Nov of 2016, the last 2 really noticeable ICLs on this chart. I’m wondering if a pause would allow the Commodities, Gold, Miners , etc to run while the general markets continue to rest. Time will tell, but indications of a top that I use are neutral right now after the recent sell off.
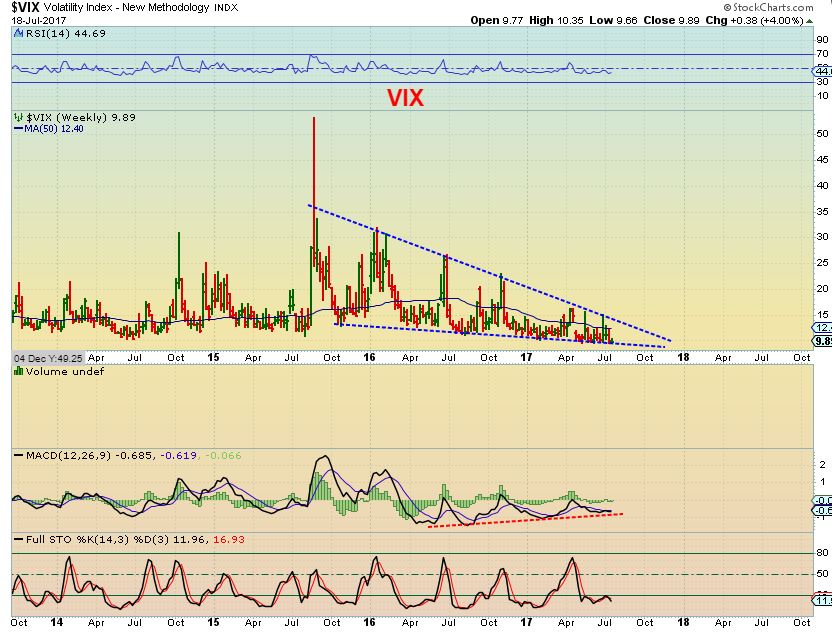
VIX – If the vix does another spike, we could get a market pull back, but so far the vix has been giving milder spikes contained in a wedge. A break of this wedge could give that ICL.
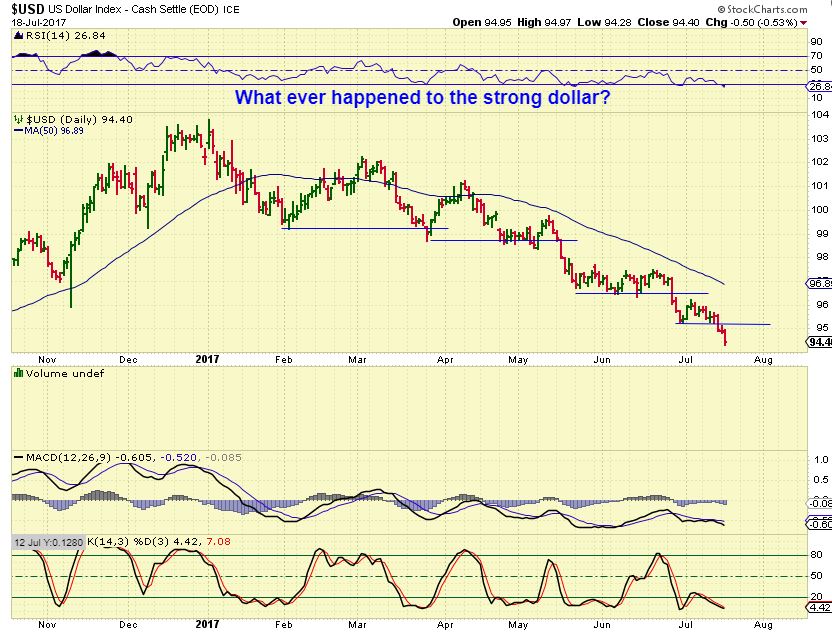
USD – The USD continues to be attacked by bears, breaking it down month after month.
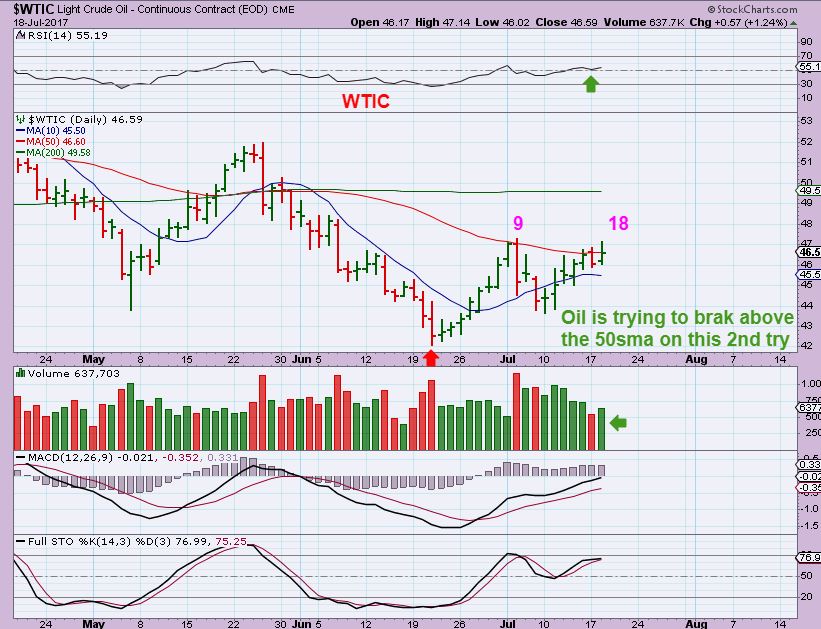
WTIC – Oil is attempting to break out above the 50sma, and it actually still looks good. The Oil inventory report on Wednesday may push this right through it.
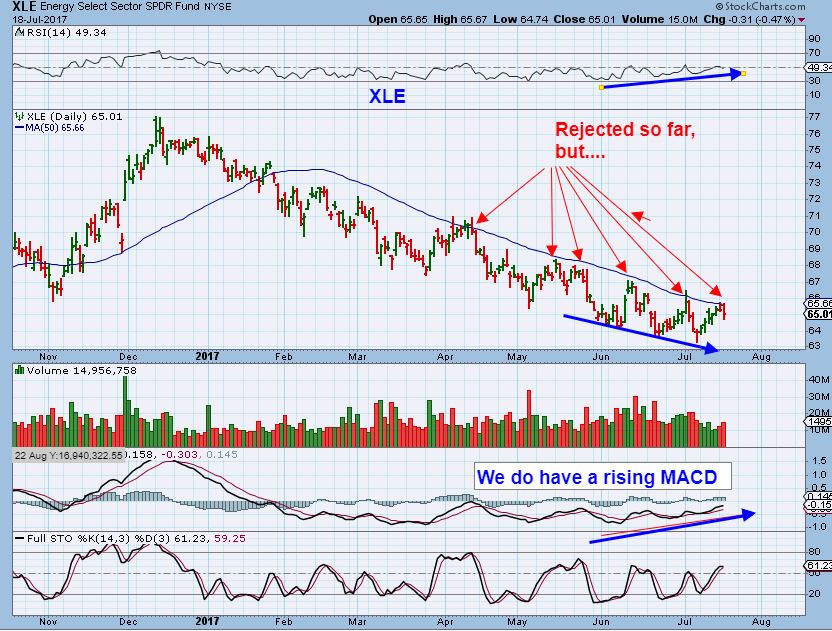
XLE – The XLE still isn’t buying it, but look at the MACD divergence. I’ll be watching to see if the XLE can break through after a brief crawl or pause.
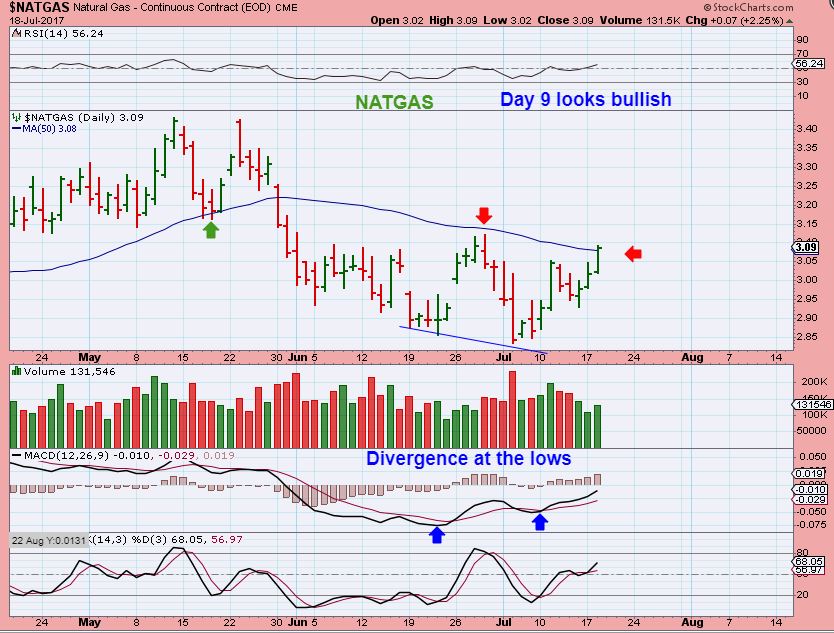
NATGAS – NATGAS is still moving higher after the ‘High volume, capitulation type, slam down low’. Now on day 9 , This chart actually looks more bullish after attempting this break out on Tuesday.
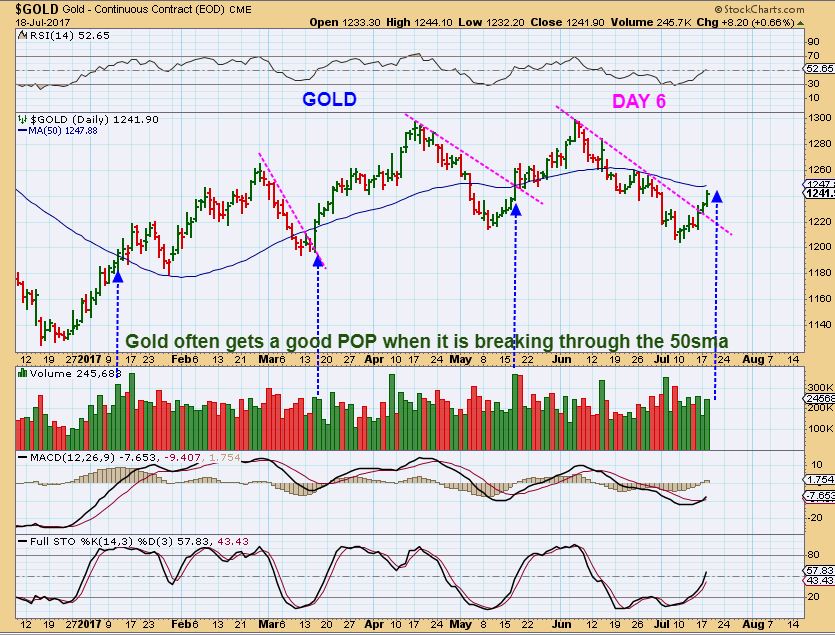
GOLD – Gold on Day 6 is approaching the 50sma too. At this point it still looks bullish and now challenges that 50sma at $1247.88.
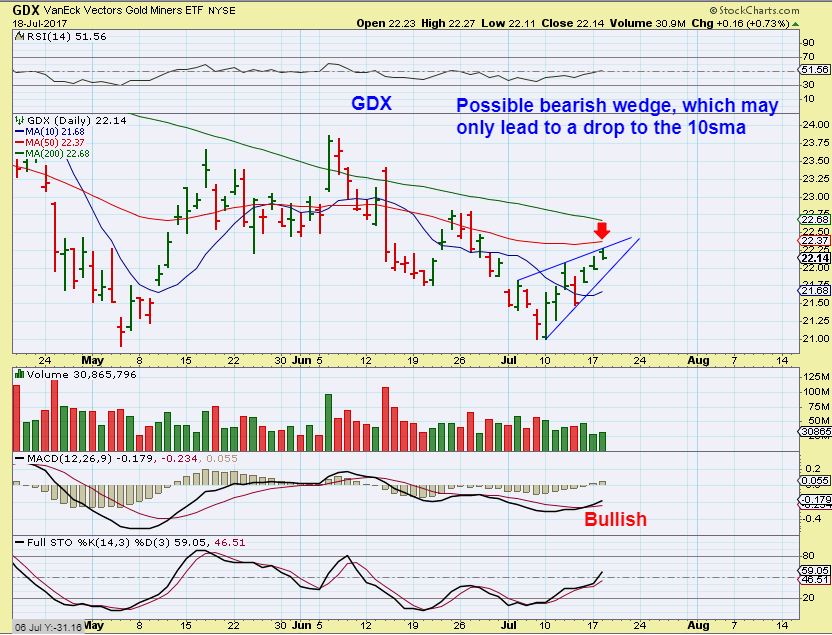
GDX– GDX has a small rising bearish wedge forming as it nears the 50sma. It may just pull back to the 10sma, or if Gold surges right through its 50sma, GDX may follow. Everything else looks Bullish though.
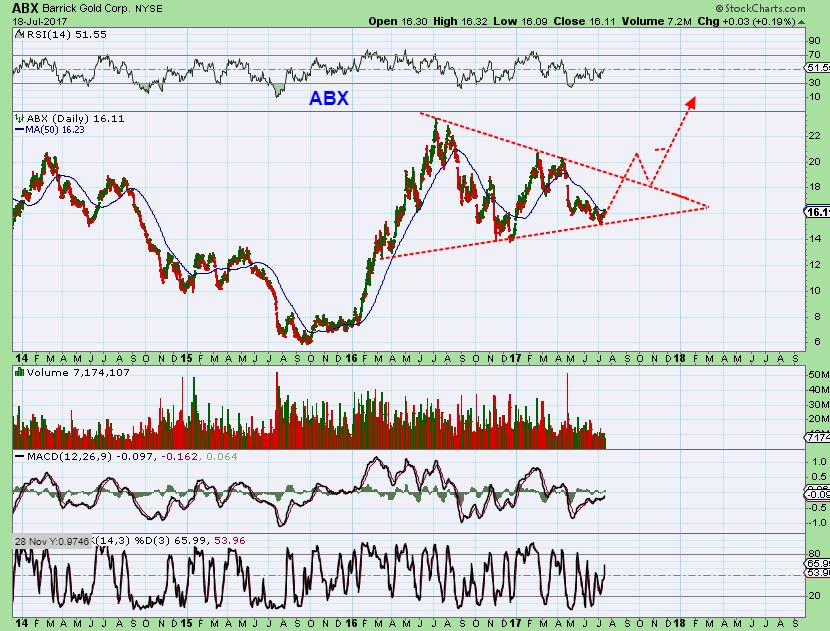
ABX – And the ABX chart still looks like it wants to climb higher ( ICL?).
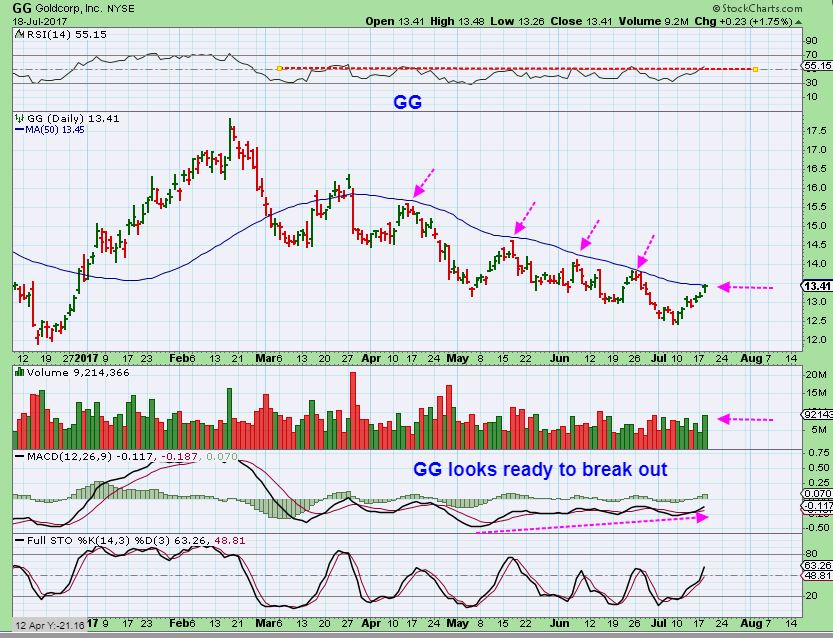
GG – GG actually had a nice burst of volume as it pushed on the 50sma yesterday, and that can be bullish, so Wednesday may give us more to the story. IF GG breaks out, it is bullish and it really could run well ( The ICL would likely be in place). Also…
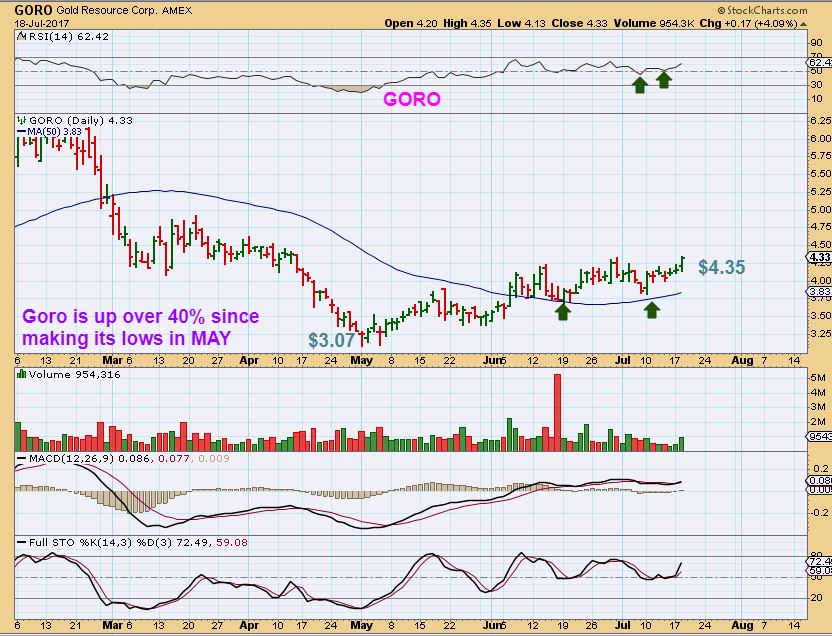
GORO – As I have been occasionally mentioning, GORO ( Slowly but surely) has held the 50sma break out and is actually now up over 40% since the May lows. I actually bought this at the May lows, but cut it loose near the 50sma with the sector uncertainty. This is 3 month highs for GORO and it looks like it is going sideways building energy for a run higher – I LIKE IT.
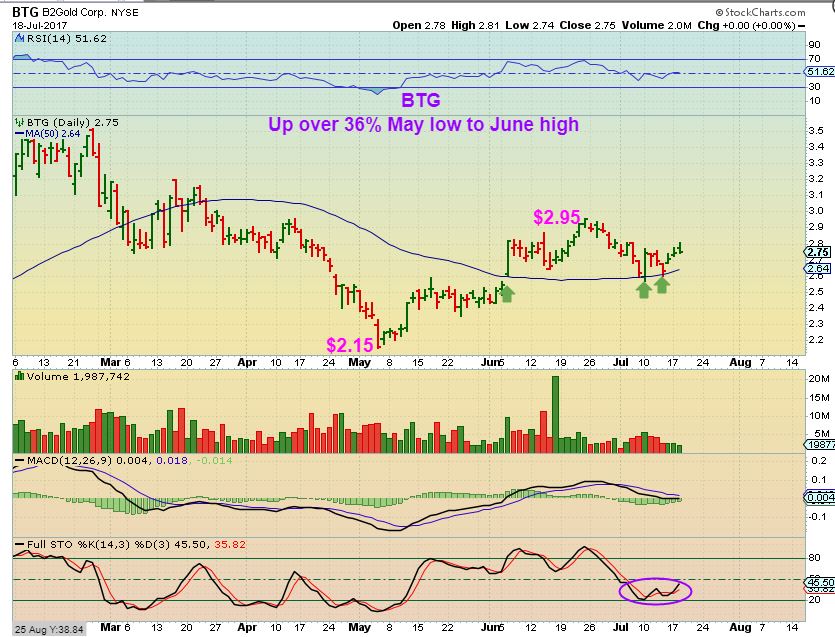
BTG – And BTG is also up almost 40% since May. This really seems to indicate that Miners have bottomed. Remember when Gold sold off all through JUNE, and I was reporting that a few miners were ignoring it, even rising higher? Look at BTG during June, and then scroll back up and look at GOLD during June. THIS IS WHY I HAVE SAID THAT IT MIGHT BE A GOOD IDEA TO OWN SOME MINERS. They do now seem to have bottomed. This could be bought with a stop under the 50sma , since it held on the last dip.
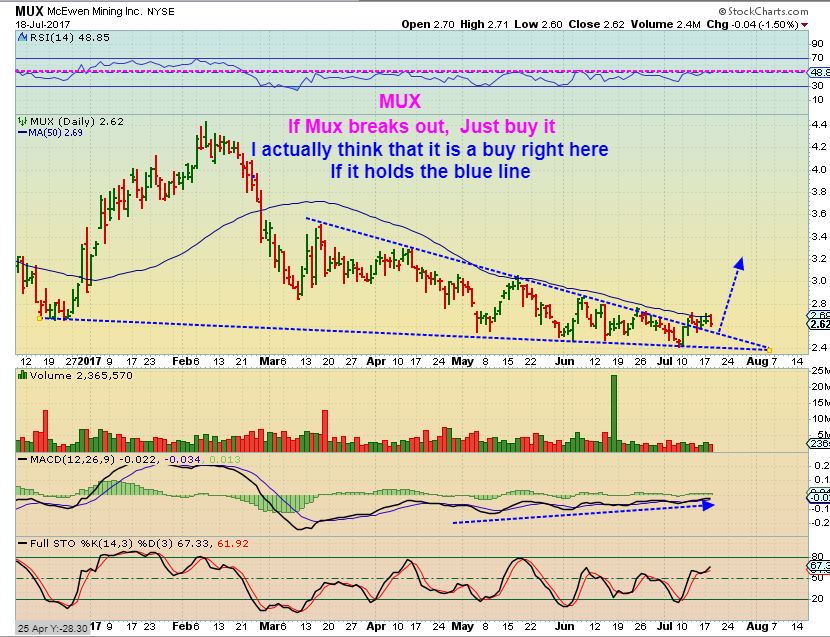
MUX – So I look at a stock like MUX, still trading at the recent lows. Does it have bullish signs? Yes. MUX broke above the blue trendline and is now pushing on the 50sma. One could BUY it here and use a stop? Wait to Buy a break of the 50sma, so you know that the sideways move is ending? You can decide, but I think that MUX may have bottomed LAST WEEK when I published my report on how the Miners are turning bullish.
The more I see Commodity stocks perking up, along with the recent low in Oil, Natgas, and Precious Metals, I wonder, “Will they run together with the markets? Or will the markets stall and move sideways or pull back as these ‘things’ run higher?” Commodities do look bullish and I like the set ups on many commodity stocks, as mentioned here in recent reports over the past couple of weeks. For now, the General markets continue higher out of the recent multi week sell off, so just ride them if you are long. Enjoy your mid week trading,
~ALEX
.
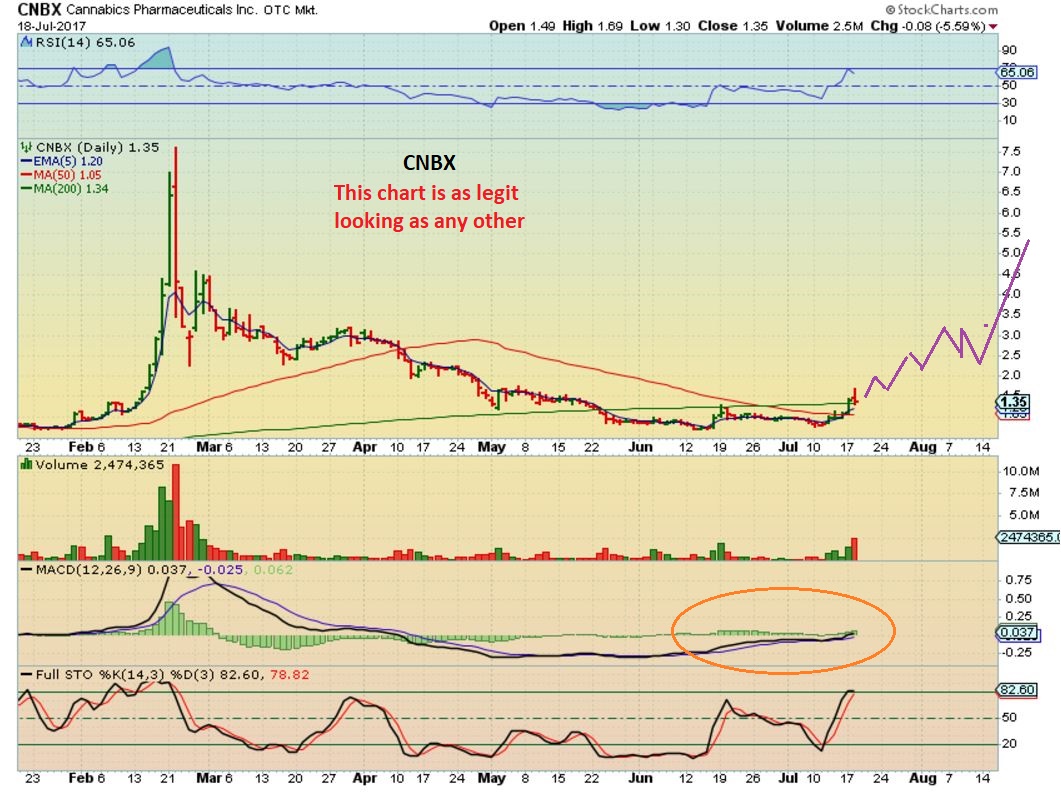
CNBX – We saw a 6% drop yesterday, and I was asked what do I think is happening. Since it was up over 30% on Monday, this drop on Tuesday ( after a surge higher Tuesday morning) looks absolutely normal, even closing above the 200sma. I’d like to see it hold above the 200sma, but it could drop and move along the 50sma and still be a normal long consolidation after Februarys enormous run higher. This sector is still acting bullishly.


The gdx to me is moving like a turtle and not how I would expect with gold acting better. Makes me very cautious. Any specific thoughts HMY?ty
RM- I am soooo sorry, my computer went to sleep this morning and when I came back & refreshed, I did not even see your comments ( I dont think I scrolled down this far.
Sometimes GDX lags under the 50sma and then when it finally POPS it runs, due to renewed buying interest. I can’t tell if that is what is going on here, but I am not overly concerned yet, with other miners doing well.
HMY – Use a 10sma on that one and it is slowly climbing.
The weekly needs to close over $1.83 and the higher above it the better. It has a down trend line there too.
I hope this helped and really sorry I missed this until now
HMY WKLY CHART – REFRESH
https://uploads.disquscdn.com/images/846d8be5734f406e261ff516c0d4a44e3a2bc49ba9e105df2ee024b55f7ff277.jpg
Good morning Alex. Philosophical question as miners come out of a possible ICL. When picking a horse to ride here, how much weight should we put on the amount of overhead that still exists, and also how big the short interest is? Also if a stock that is listed in Canada only has the potential to get a big board listing will that play much of a factor going forward?
Or do these things not mater so much when it comes to powerhouse stocks like BTG and MUX?
I take all of those factors into consideration for longer term buy & hold, and a future listing on the big boards does help ( it attracts more investors). I look at it as though you have an item for sale in a small chain store, but then Walmart picks up that item, sales often increase with that kind of exposure. ( I’m not calling Canada the small chain store, I am referring to the pink sheet listing that some Canadian Miners have).
For a short term trade, I will often see a stock set up to break out & it just does. Short interest can give it more pop as the shorts begin to cover, but I dont look at short interest as much s others do. I look for chart patters that are set to break higher.
And then there is always the dreaded ‘public offering’. Often Unforeseen and uncontrollable , so I recommend a basket of miners. I do have a theory for those that has proven true however, but that is for another time.
ohhh COME on…. u cant put the bait out there and expect a fish called wanda not to bite… 😉
bite, bite comeon take that hook….
it’s prob like when the 2 moons align and venus fly trap revolves around pluto …
What a tease our Alex is!
What about HMY’s chart. Like the 1yr?
Yes, some of those oversold beaten down miners will do great when we get the next run
aveo and vstm… twinzers…
Goodness MYSZ!!!! They dropped it to 1.01 yesterday and popped it today
Take a look a MYSZ of a 6 month chart. I sold that a while ago, but I love that longer term chart and kind of like the story of the APP too.
Hemp’s turn?
Nice strong reversal yesterday.
GRNH …
Looking like a bull flag could form on the 50sma
CNBX also held that 200sma so far ( Last Chart in the report)
CNBX dropped below the 200sma, may be gunning for the 50sma
MCOA – Again
I KNOW.. jeepers I WAS JUSSSSSSSST COMING ON TO SAY… I guessssss i should shave some off the MCOA beast .. and not be a greedy little piggy .. but it looks like it wants to power on…………………………………..
200sma?
yeah… well .im tracking this past move …. hey .. a girl can dream … ;o)
https://www.tradingview.com/x/m7SET7iI/
Was that the same company?
yes .. sorry cant fit it all on the 2hr … i can enlarge just the previous move if u want?
https://www.tradingview.com/x/D6BDSbmF/
No That’s fine, I was just curious if it made that same move before, or did you borrow a similar move from another. thanks
would it be bad if my pot sales funded my florida vaca?
*giggle
TAHN… great call :o)
mommies happy…
*Shh
Some of our trades from a month or even 2 months ago are still set up properly and following through.
For example TWTR, SPWR, CSIQ, TTWO ( JBL is ok, but not nearly as good performance wise yet), AMD, UEC, etc, etc, and so with that group, I also mentioned FSLR, JKS, and those are also doing well. That leads me to JASO – this could be the next solar runner, and SUNW, WNDW, SOL, etc . Are these next? RGSE still struggling along under the 50sma, but that still looks promising too.
HQCL – Set up nicely too for the solar sector.
JASO, nice pop today. Its at the previous resistance from mid June. I could see a pull back gap fill, maybe by then the 20sma will catch up. If it breaks thru then it could really run. I’ll have to put it on my watch list. Have you traded it before?
Me too- it has been on my watch list, but todays POP kind of ruined it. Maybe a gap fill would help.
JKS rocketing higher recently
hmm … im likin CIE on the hourly…
YEP- Looks like that HQCL was next- breaking out today with strong volume
Miners looking weak today. GDXJ just gap filled from early July.
Yea – I just filled on MUX as well and down quick lol
*my personal fav…. actually the very first miner I ever traded….
#ILuvRob
Lol – I thought id catch a bounce if it happened. 5k at yesterdays low… Welp (shrugs shoulders)
GMO…. 😉 shh
bahahaahaha, this is why I cant complain lol but also, vol so low I cant get out where I want lol
set limits at intervals… mr. deep pockets
Whoooa… Mr nothing! Im like Steve – I trade my retirement – and my brokerage lol
That GDX bearish rising wedge seems complete _ I sold all leverage yesterday and am still going to hold Miners. The dip may be short lived.
Gold Double top on the 1 hour
check those two candles on TPLM – I can’t find the meaning in the Japanese Candlestick book
MCOA did the same thing 4 days ago, and has moved a lot higher since. I’m NOT saying that will happen to TPLM, just though you might want to look at it on a 3 month chart.
Oil inventories= Bullish
SO FAR pushing above that 50sma
IPI looks like a bull flag on the 10sma ( I still own it)
Me too! Missed the buy this am though to add. Although I did hear some one once say…there’ll always be another trade 🙂 Thanks Alex for the great work. Now if only you could fix dem myners…
btw…any price targets if it breaks the horizontal weekly resistance at about $3??
yeah.. that was one of my bonehead overtrading moves…
i like YUMA over the big bad bully…. lol
DNCVF … nice .. take THAT bully…
IPI, UEC, TGB are my slow and steady climbers.
I believe that WRN may start doing the same soon, but I do not own it.
And I made a good trade on TANH, but that one is now moving on with out me 🙁
LOL jinx!
TEUM reversal…
Quite the break out and back test attempt on that one
check out that chart of XCO – 3 month or 6 month : – 0
Good observation with MUX, Alex.
https://uploads.disquscdn.com/images/164806076e02e913839dc90b1564d1893048adc1b8bbf49eb861188c044f10d0.jpg
I added to IPI on that BULL FLAG on the 10sma, look, but I added after the reversal started at $2.75
Volume is slowly coming in
IPI from my report a couple days ago- this is why I added to my current position.
https://uploads.disquscdn.com/images/778856305c22bb174e697d4ec8f968bee5e722705d34cb7f2f0b2010e67f1523.jpg
AEZS Wow- RIG and ZN -nice oil
It’s only up 96%, what’s the big deal 🙂
URRE hourly looking ready to pop
just for giggles I took a small position in UUUU – big short interest
I think that UUUU looks great , actually. I was going to mention it again in the next report
UUUU has a huge short interest.
I don’t know how important this is but I have been watching AAV and AAV.TO – same company.
AAV on the NYSE had a SI of 24.82 and since June 21 it has popped 20%
AAV.TO on the TSX only had a SI of 6.17 and it moved 12.5% in the same time frame
Short interest is bullish if price moves higher & they are forced to close their shorts- It is like adding buying
vrooooooom
https://uploads.disquscdn.com/images/41dcaae016767f2a56a615dbb8bf57abe1db78cd8b7f140009eb7a9f7bdcb10f.jpg
I agree Rob,
Could be forming an inverse head and shoulders as well.
I mentioned THM yesterday – It rallies onward
God I hate that Miner lol
Me too, when it runs up 25% in 4 days without me owning it 🙂
uggh.. wish i had more mcoa… lol .. is there ever enough when they run???
looks pretty similar to TRX spike the other day,, up to the 200sma .. hopefully with a retrace to match that lets us get onboard
i purchased it in my swing acct for u…
😉
hmmm… CYTR……
ICD
HLX… why did I sell lol
Yep, That is in the next report too- I posted this chart in a report last week, and now it is breaking out. It has been a buy above that 50sma for days
https://uploads.disquscdn.com/images/9d4e2354b0214661778f60bde97c1c041132194a5815feb899dc87d4d254609e.jpg
I do see quite a few energy stocks moving up 4,5,6% today & the XLE is back pushing against the 50sma
I know – I emailed u about it! U were concerned about Vol tho
smooochie smoochie
That would be incorrect, sir. 🙂
I am concerned when stock has under 250,000. This one clearly has over 1 – 2 million regularly. There is no way I would consider that low. And I owned it
I have a screen shot of you saying that lol
Show me
Unless you are talking about a while ago and it did have low volume. Seriously though, I trade stocks ALL THE TIME with volume over 300,0000.
https://uploads.disquscdn.com/images/7be9e471b22819714ce01ba87f0c03fad50f50c0b0c0a632156f51dcc3a8795c.png
Ahhh – Not concerned – Just wish it had more lol
That comment was for that day – at that time of day.
To explain: “I wish it had more volume as it is approaching and trying to break above the 50sma “, so I didnt tell you in an email that it has low volume like you said, right? It was a comment about HLX that day
That comment is situational…. Like If I own a stock and it is breaking higher , but the volume isn’t quite strong in the morning, I would say that.. ” I wish it had more volume”
Maybe I need to be more clear- I hope that isnt why you sold it.
Lol That is why – But i had a nice gain for the day. Steak and gas money
THAT IS WHY?? : (
CF – I buy and sell alot of stuff. I came here to be a long holder but since joining, markets havent been to easy to do that… I saw that and sold after a nice 305$ gain. Im not mad at all lol.
Yeah, but….. If you were still holding, maybe $1000.
As for buy & hold- we may be getting into some of that now that things are less jittery. ENRGY, MINERS, COMMODITIES, URANIUM, SOLAR, etc have been moving in the right direction for a while now.
I am loosening my stops ( Got stopped out of SPWR, CSIQ, JKS , Mental stop on Goro got me out , etc).
ehh – MUX hurt this morning.. Im still holding URRE and UUUU. I want more TQQQQ per steve t. Andf RIG is beasting for me
4 Q’s, that must be the 4x Etf 🙂
I do like MUX longer term, needs to take out that 50sma
Point out a good re-entry and well call it even LOL
Well, now that you mention it- I captured this chart earlier today for tonight ( but it is getting a tad extended for a low risk entry). I think it has good upside.
Maybe it’ll do a back test?
https://uploads.disquscdn.com/images/aaf3cd34acd51e479787ed9c45697bfebca69f7b291ae92475e63d6e287d5a01.jpg
PXT.TO is moving for me too. I added earlier
UUUU URRE – toodles!
Man URRE gets no love… Big pop Sharp drop… Every single time
Welp – Stop hit on MUX.. That stinks – Or – That SUX
Miners are “putting a harsh on my mellow” today. I’m not used to seeing red candles, TQQQ is always green. LOL
Normal pull back on the 30 min chart. Recovering
JNUG bounced off its 9 EMA on the daily chart today, so that’s still bullish IMO.
How soon we forget 🙂
refresh for June
https://uploads.disquscdn.com/images/299b2830e2f4cec52e0a29a6dc5883f51f05a3b761546dc7ca97c483b6c383e4.jpg
Pullbacks can be healthy.
Yeah I know. 🙂 Just having some fun. I think there may be a lot of short covering going on with the Q’s because I know a lot of traders who are shorting them but QQQ keeps going up, driving the bears nuts.
Gap open today too. Its 9 days in a row 🙂
@disqus_BmBD6EFEu5:disqus Have you taken a look at UUUU today lol
Yes…I was overjoyed and almost made it into the green….but back down a bit now. There is hope.
Just FYI……New Hampshire Governor signed bill yesterday to decriminalize possession of small amounts of marijuana….
“HB 640 will take effect in 60 days, making New Hampshire the 22nd state in the nation — and the last of the New England states — to eliminate the possibility of jail time for simple marijuana possession”
EGI is happy ….
Oil stocks moving higher, GUSH up 8% ERX up 3% maybe the sector is awakening.
gush ..nice
AMMJ….wish i’d been in that one today…..:)
SWN and OAS are breaking out. 3 month charts on both are very nice 🙂
Check out XLE with the 50 sma too….it may FINALLY be time for Energy
TRX short interest shot up to 50 days to cover. They reported yesterday and the worst of the bad is they have $1.6 million to pay $4 million worth of bills. Over $3 Mill of the payables are over 3 months. That was to the end of May and I can’t see any announcements where they have raised any more money so it could be worse by now
I was going to take the trade and hope for a crazy short covering binge, but they are really looking to be in desperate shape
I still might take it with a small amount of “crap-shoot” money
Thanks, I was looking at TRX, I won’t take it now.
I went away at lunch time, check out HQCL, CSIQ, JKS, and I think that SUNW was rejected at the 50sma, but it will get through it soon, if volume keeps swelling on the up days.
ALSO ENERGY FINALLY LOOKS REALLY GOOD- For example, see
SPN – Very nice , QEP, SWN, CPG, GURE, PDS,
GTE breaking out, SN set up to do so, and there are many more.
XCO – up 50%
do you find the action of CNBX more bullish or bearish. I am really torn about this stock looks good, but the downside of 1.00ish is pretty far from this 1.30 level
Hi Rick
That is the problem with these when they move so fast. I do see it as bullish action overall, but it could drop back to $1.00 and back test that 50sma. I was hoping to see it stay above ( or at least close above) the 200sma, but it is flickering around .
There is another way to look at it, and to me it is quite bullish…Let me draw you a chart and be right back
So when I strip down the chart of CNBX and just use a 10sma, price is CONSTANTLY tagging the 10sma. It holds it down as resistance again and again, and then it acts as support.
Right now the 10sma is rising and price could be putting in a mini consolidation or bull Flag to allow the 10sma to catch up. It will tag that 10sma and move higher if this is the case, in my opinion.. .
Refresh for a chart
https://uploads.disquscdn.com/images/9e627a67381e9968971e714ebc6b1b3aa20f2a39b90ab3f37a7174b6231d20db.jpg
All I can say is that the “highs” don’t last very long. Don’t hold your breath for too long
I REALLY like the charts set ups that are forming & following through. It gives the idea of less ‘chop / pop / & drop, and more gradual trending . Just what we need to buy & hold for a bit.
Commodities and solar are doing this already. See 3 month charts of
X, CLF, VALE, AKS, CENX, HBM, etc etc .
Now above the 50sma and even back testing has been done, These have been buy & hold for a few weeks at least.
And WRN today finished forming a small inverse H&S : )
definitely feels good to have a bit of follow-thru in some of these names… bravo…
Yes, that choppy trading is frustrating. The better set ups are popping up everywhere now 🙂
Im all out of GMO now – I like your steeze
Nice run
Hey CF are you still holding some NAK ?
Hi Fadi G
I am, but I did sell quite a bit a while ago. I wanted to hold 25% of my original position.
It is a slow process with this one, but it is shaping up again, and if the commodities ( metals) and Miners run higher, I can’t see this one sitting it out.
Refresh for a chart – it is not standing out right now, but we have a higher low and the MACD rising.
https://uploads.disquscdn.com/images/91b17c35cce0381f67dcd969534250e21f959c6756a87557e990ce86b6563df9.jpg
One of the most amazing (And alarming) things that I have witnessed in trading has been DRYS.
It just keeps reverse splitting & losing 90% of its value, reverse split – loses 90% , etc etc
just crazy- they should delist
And then you have TNK, NBR, SB, SALT, SBLK, DSX, GNK, and other normal tanker stocks moving higher.
3 month charts PDS, BBG, GURE, CPE, SN…
What are you buying? CPE looks good, but earnings on 8-2, SN on 8-14. GURE is making money, BBG is not.
Thanks, I haven’t bought anything today, basically because I am not in front of my screen all day. I do like many of these set ups .
RES
GUSH looks great today, above the 20sma. Lots of room to run overhead
We are going to be running head first into earnings season for these commodity stocks starting towards the end of next week.
The algos rule. If they like the charts, the fundamentals mean nothing
HLX… Insert Crying Face now
It’s only 7%, you can do WAY better than that 🙂 lol
My biggest problem is watching my stuff run hard after I sell lol
Everyones problem
yes, I’m having that with Solars right now
RGSE is still p*ss*ng about in the low 0.90s
need a giraffe soon or i’ll get bored & miss it
Just take a look at HQCL – I got bored with that one : (
SOL about to make a move?
oh my.. yes .. thats what i need
sorry for your (potential) loss
i got SOL too.. looks healthier than the other waste of space
Maybe if you jumped into AEZS when you posted it up 50% you’d be happy- I think its up 150 NOW
Insert really sad crying face here
I played it twice. 100$ scalps
Does anyone else remember LPI? Boom!
NAK just put in a reversal on the 10sma.
I would think that with Metals and Miners come off of lows, this will move higher too.
im likn GDX/GDXj …. daddddddy
MCOA… phewww … :o)
CENX had a nice strong finish
If natty is reversing looks like CHK put in a double bottom at 4.44 — here are the 1 month, 1 yr, and 3 yr charts https://uploads.disquscdn.com/images/efc7492be8ed47639533f7352ea7ad2a7e6c103ab44c4c2a77966750b47b41af.png https://uploads.disquscdn.com/images/2f85dbd0b1f8a2625c8a842a6b96c8721d85ddea8284a771541fb3a9ee45f04c.png https://uploads.disquscdn.com/images/79f3e9d3565d9701aad1b68f1ae49c1723a53d2b1e227e5e9af294b366ffa042.png