I’ve been posting a variety of trade set ups in the past few reports, and we are seeing some nice follow through. Let’s take a quick look at a few Market Sectors and then discuss more trade set ups, and current trades in the works.
NASDAQ – The NASDAQ closed above the 50sma and the 10sma and that is a bullish start to a new daily cycle. We do need an overhead trend line break, but I wouldn’t wait that long, I would go long on this close above the 10 & 50sma and just keep an eye on it until it gets a bit higher.

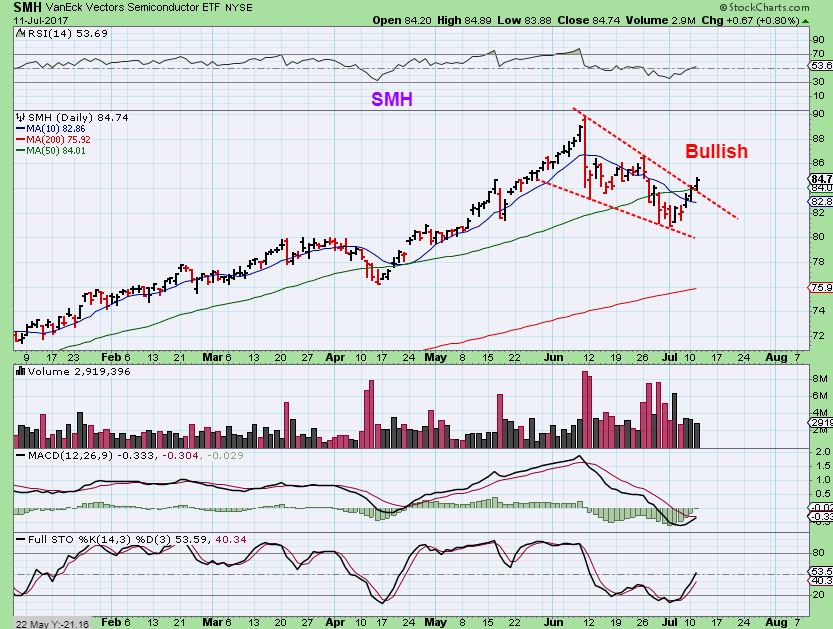
SMH – This is a bullish chart. It is ahead of the NASDAQ, because it did break an overhead trend line already. This is a buy here above the 50sma.
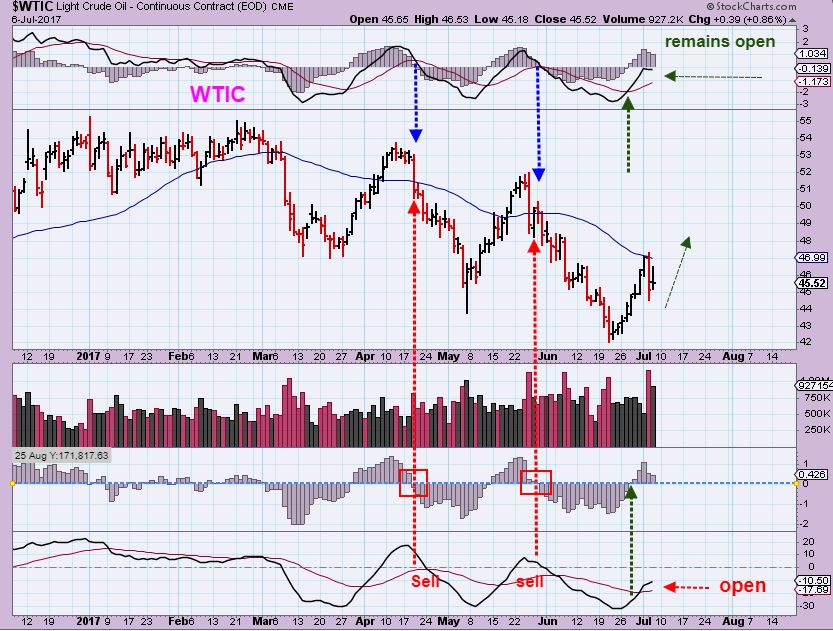
ON JULY 6th– I used this chart and said that my special indicators were pointing out to me that OIL had put in a real low this time. This was different from the last 2 daily cycles and I expected this rejection at the 50sma to just produce a higher low in oil with this drop.
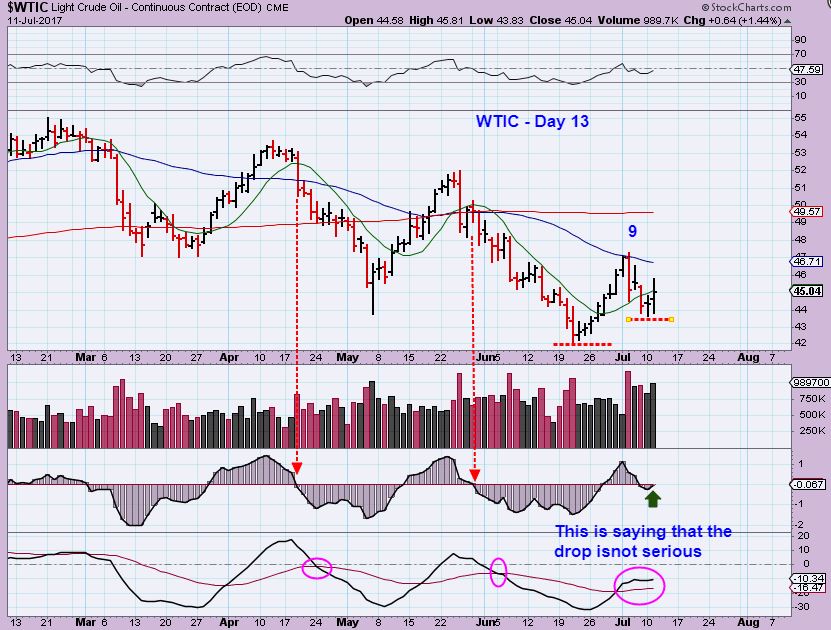
WTIC July 11 – I think we are getting that higher low. Here is the update chart and the indicators are still not bearish after the 4 day drop.
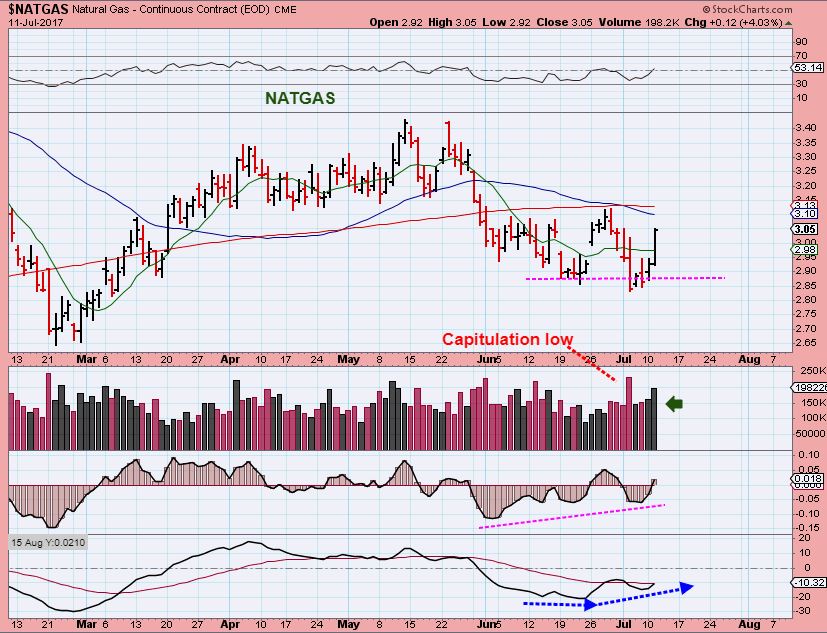
NATGAS looks to be bullish too. This looks like a high volume spike down, capitulation, undercut low. People shorting NATGAS may be in for a surprise here, especially if they went short on that spike down day. That was the lows so far. There is strong resistance above, but NATGAS may cut right through it.
GOLD
I said when Gold sold off into May, that the sell off didn’t have the ‘hallmark’ signs of an ICL that I look for. It was a fairly steep sell off, but a few things were missing, so it was suspiciously different from an ICL drop. This recent drop in June actually does now have many of the things that I look for. THAT DOES NOT MEAN THAT THIS IS DEFINITELY AN ICL, however, we need to look at things in an unbiased way, and there is a chance that it could be.
In yesterdays report, I pointed out many of the reasons that we should be alert to the idea.
1. The C.O.T. Smart Money short positions has dropped quickly.
2. Many Miners are putting in higher lows and some are even uptrending , when Gold sold off from $1300 to $1200. MINERS DID NOT SELL OFF WITH GOLD & SILVER , and SILVER HAD A FLASH CRASH.
3. The Cycle trend line was broken.
And there is more, so please re-read that report if you need to. That said, I did buy some Miners , just like I did at the lows in May with Goro and GSV for example. I do not expect things to just go straight up, but I want to see how this unfolds going forward.
GOLD – IF Gold has not put in an ICL, it can do something like this tag of the 50sma or 200sma and roll over with another daily cycle. I might be stopped out of my recent purchases if this happens, but remember, Many Miners did not sell off with Gold in this recent drop (and look at that drop).
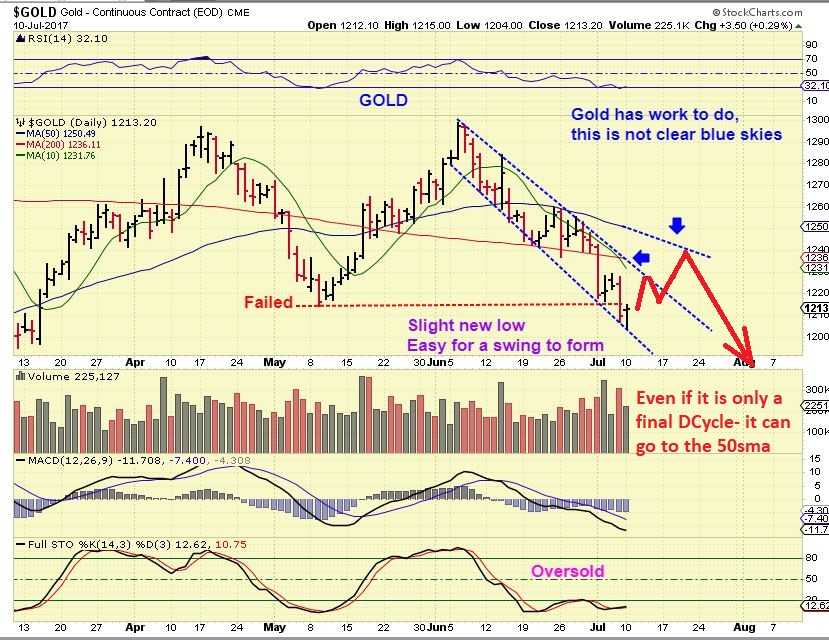
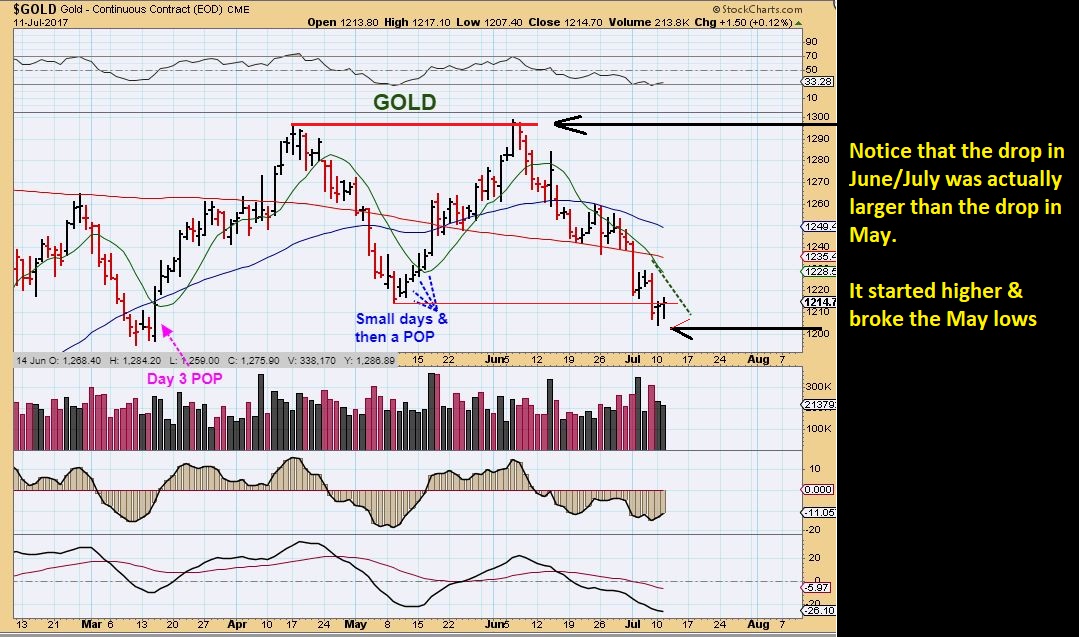
GOLD – Repeat: I said when Gold sold off into May, that the sell off didn’t have the ‘hallmark’ signs of an ICL. This recent one does have them. See the chart below and notice that we do NOT have a confirmed swing at this point. We want to see price close above the 10sma as the next step. Look at the last 2 DCLs and you’ll see that it can happen on day 3, or day 5, or whenever, so that is the next step to start to confirm a low in place.
SO we are looking for that swing low in Gold, Silver, and the miners next, but I bought a few Miners that looked Bullish. As a few reminders…
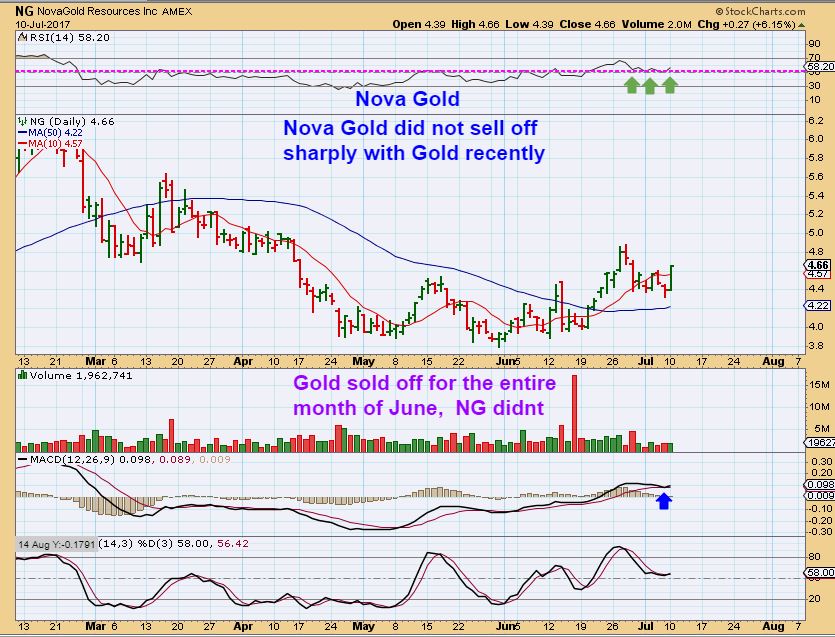
NG – Gold sold off in June, and NG ran higher instead and put in a higher low.
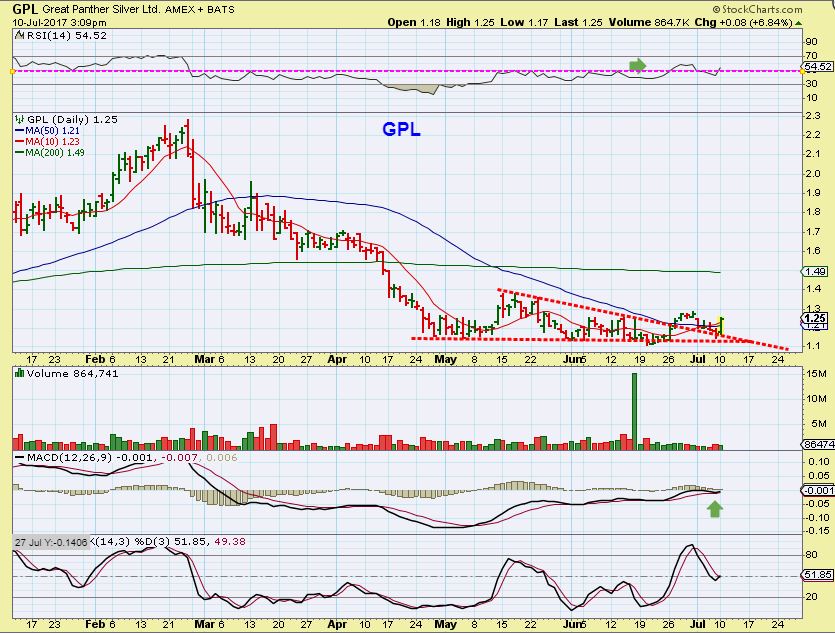
GPL- Silver had a sell off and a flash crash, but GPL is in a base and the lows are holding strong.
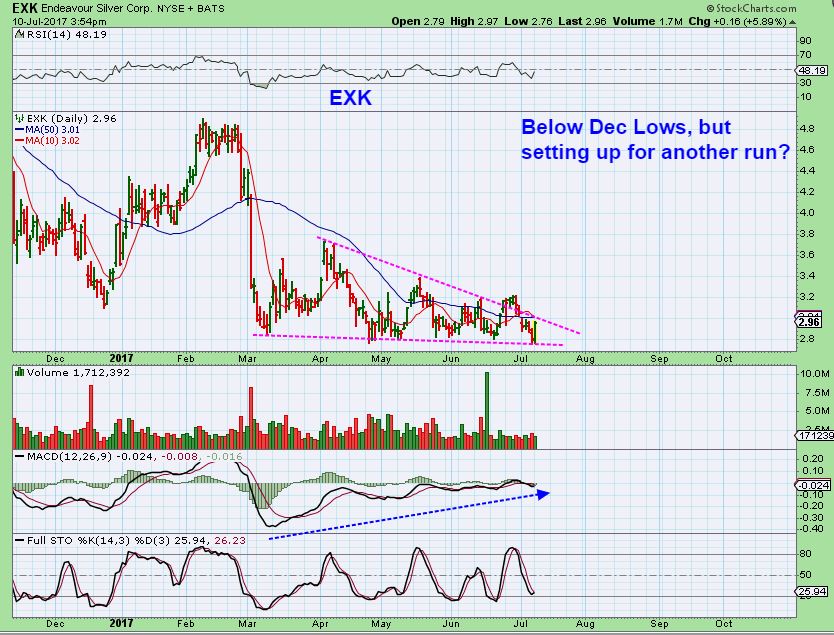
EXK – A base that didn’t break during Silvers sell off.
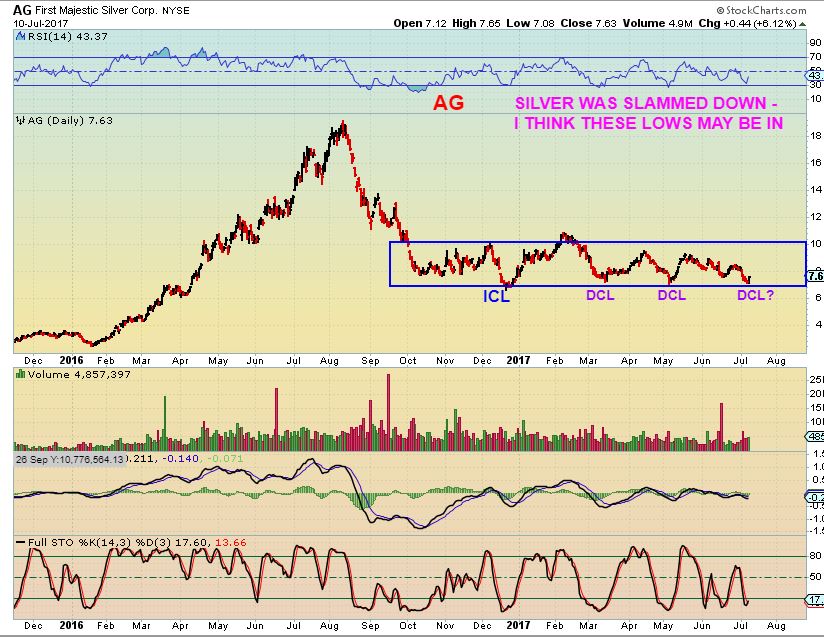
AG – Ditto, so these are low risk with stops below recent lows.
OTHER TRADE IDEAS
Yesterday I pointed out that CLF was looking good after almost tagging the 50sma. This is a higher low after the initial run off the bottom that I also pointed out when Commodities and Steel started breaking from their bases. I wrote a bullish report on Steel recently. We saw here a higher low and the 50sma is flattening out.
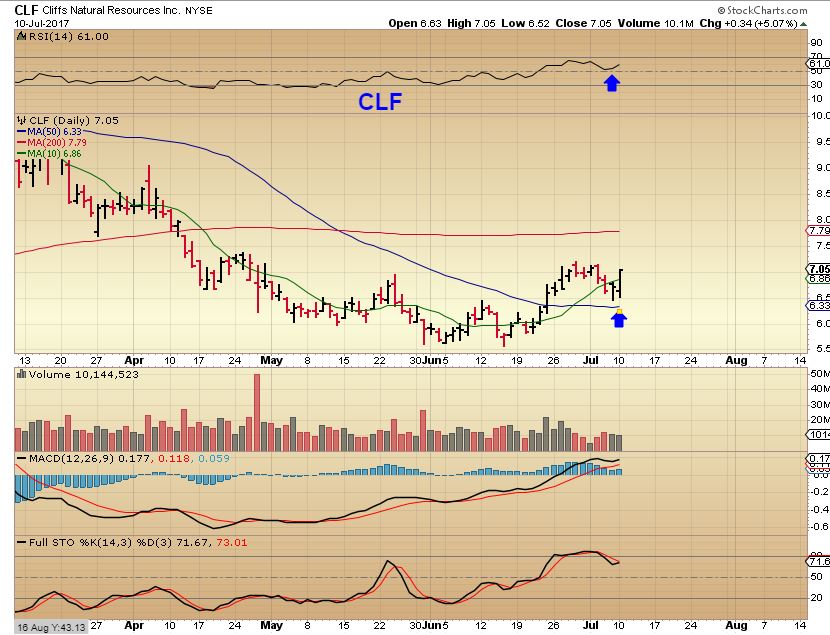
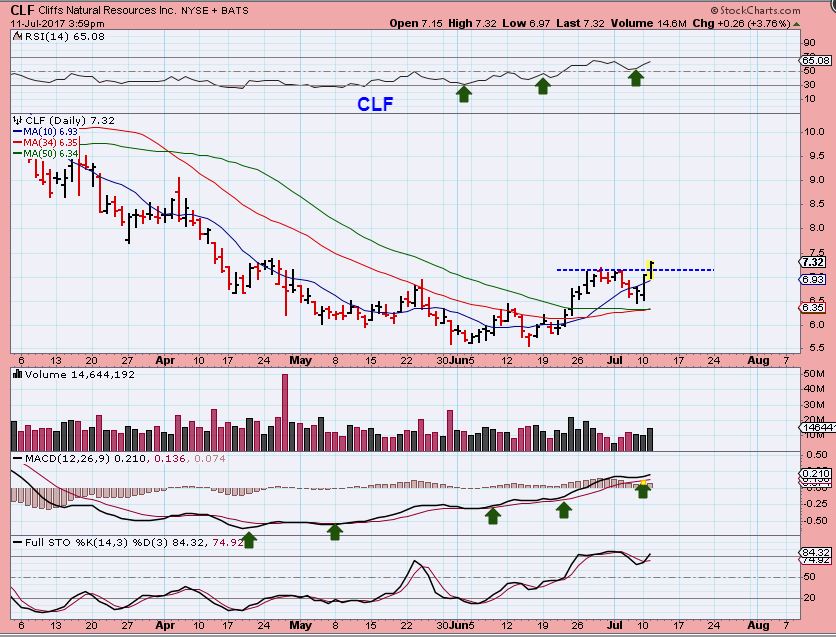
CLF is now breaking to new recent highs again. This is still a buy in my opinion, with an $8.10 price target for the initial move. You can see that CLF looks to have bottomed here.
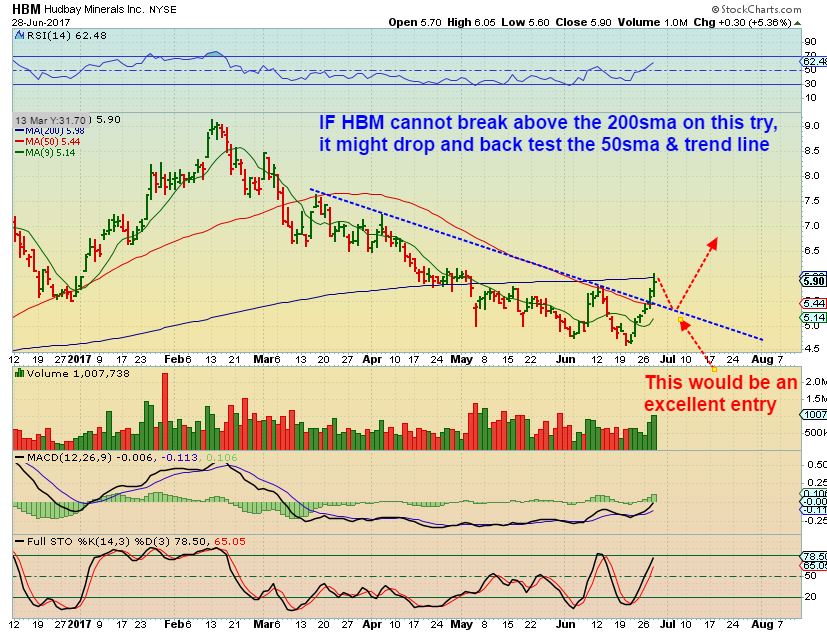
HBM – I pointed out several commodities in a report, and here HBM had broken out & tagged resistance. I said that I would BUY the dip that I was expecting at $5.50ish. Would this really fall to $5.50 so we could buy it?
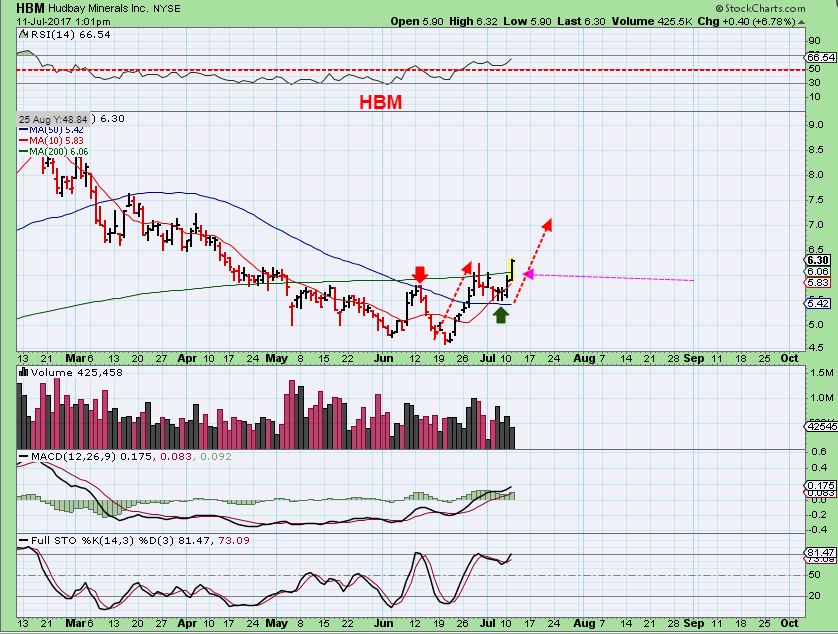
HBM – Did you buy that dip at $5.50? It landed on my target and took off. This also has more upside with a short term initial target of $7.14. These targets can be exceeded.
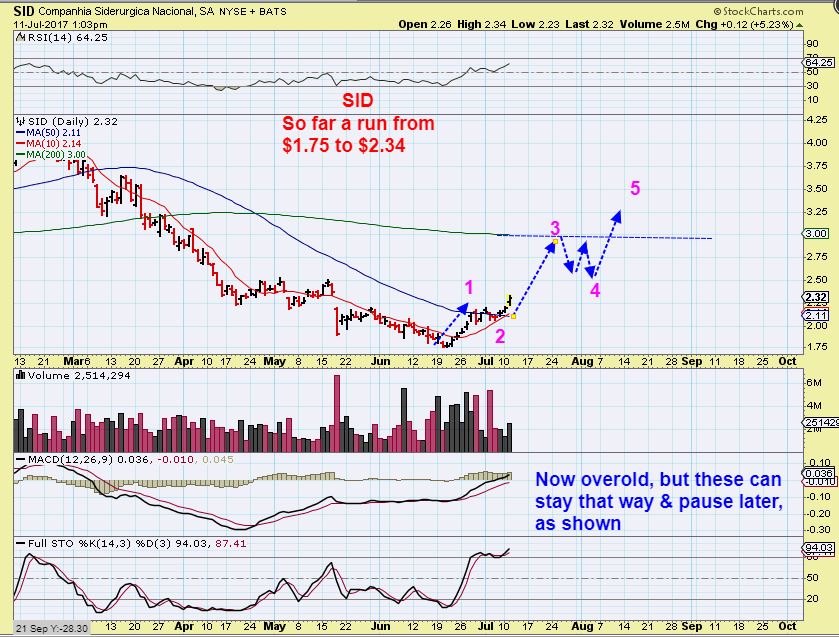
SID is also starting the next leg higher.
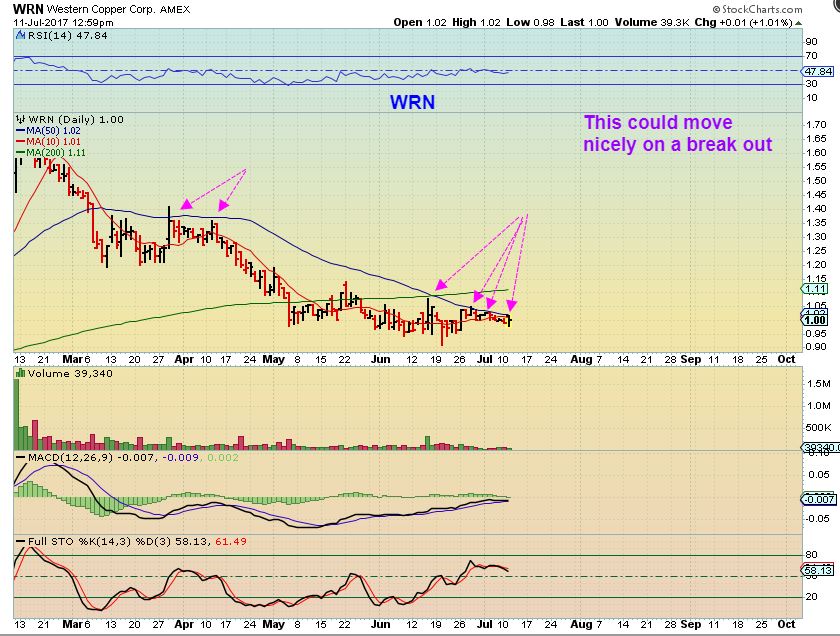
WRN A copper stock that has NOT been able to push above that 50sma, but I think it will very soon. I usually buy these crawling price patterns here with a stop under the lows, but it is deemed safer to wait for the break out too.
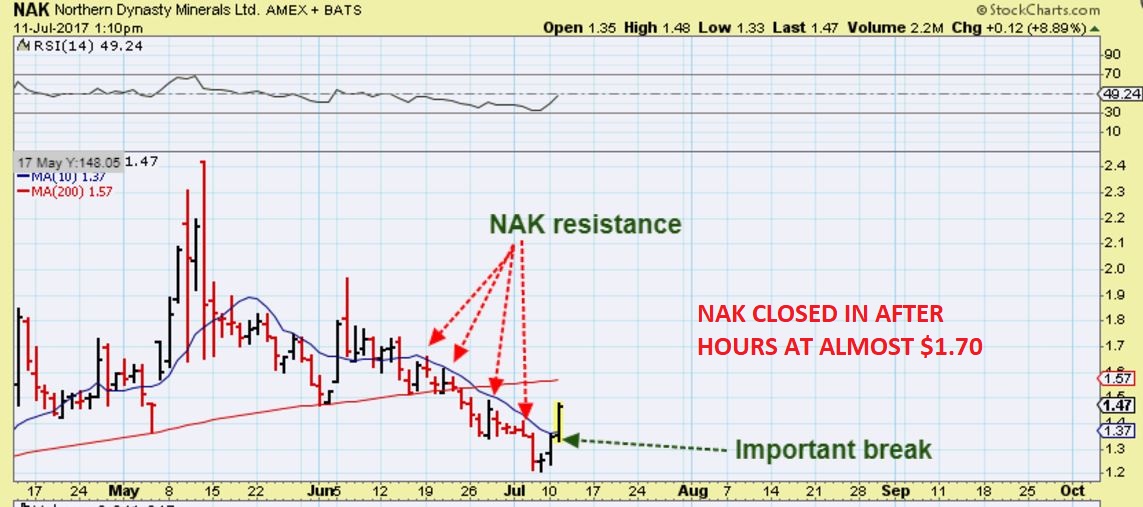
NAK – In the comments section I mentioned that “NAK breaking above that 10sma means that it should now run to at least $1.60”. It continued higher all day and then in after hours they released news about the EPA backing off on older regulations, and it shot up to $1.70 after hrs. THAT puts it well above that 200sma again .
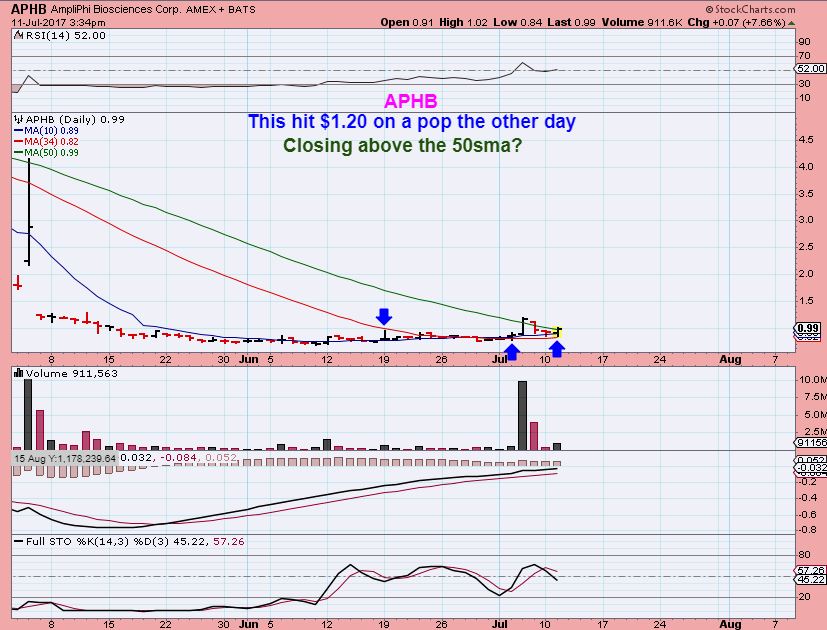
APHB – This is a higher risk trade. Why? It is a Biotech that moves quickly. Yesterday alone it dropped to 82 cents on Wednesday and then closed even higher than it was when I captured this chart. It closed above the 50sma and I do like that, this could move very quickly ( either way). If you buy this, you want to be ‘experienced with fast movers’ and be in front of the screen. Keep positions small.
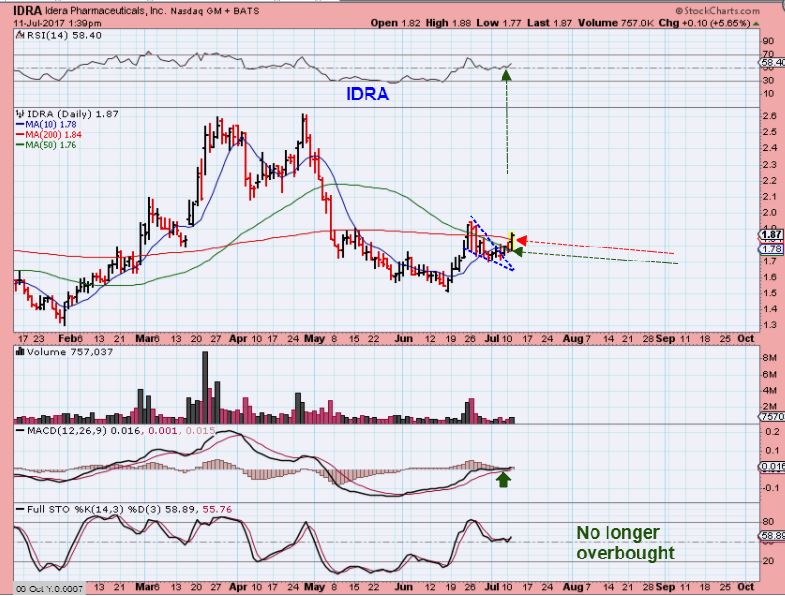
IDRA – This is a buy with a stop below the 50sma. it is Biotech/Pharma , so it has added risk at times.
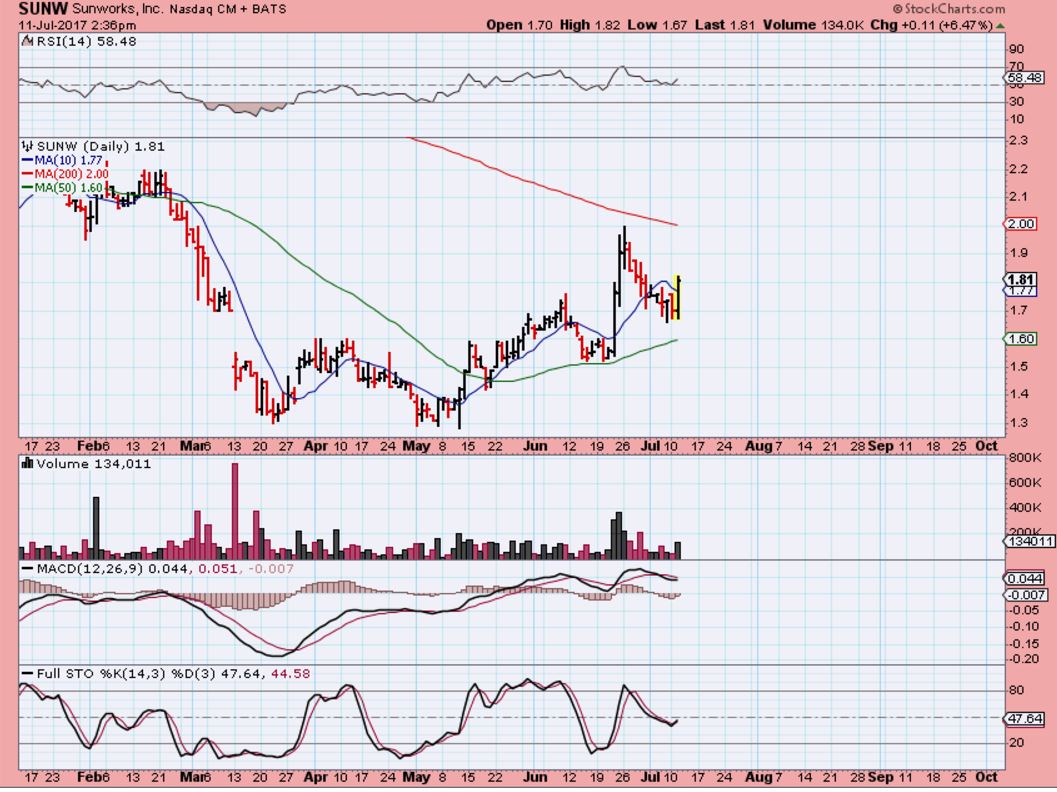
SUNW – $1.30 to $2.00 in 2 months and it looks ready to continue . I was hoping that it would drop to the 50sma again, but it didn’t ( yet?). I’m not buying this unless it does.
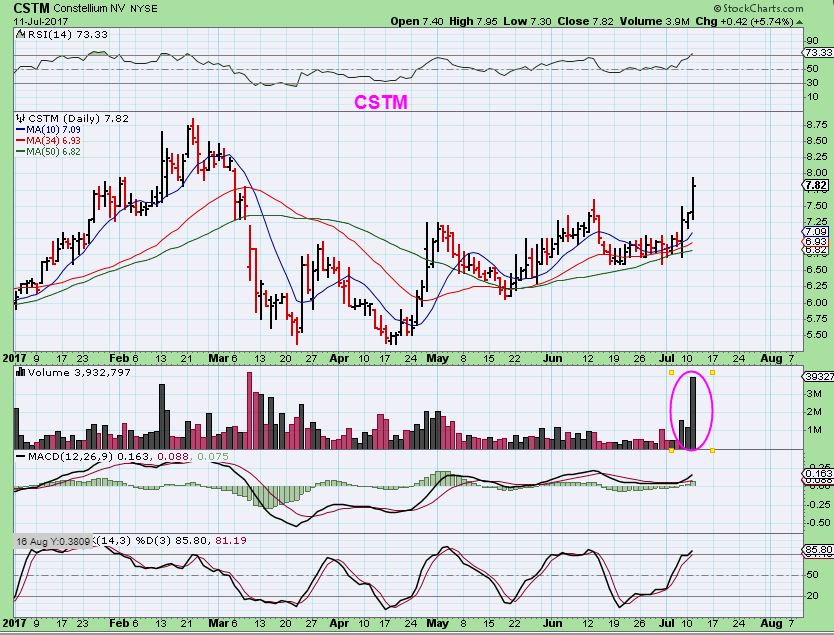
CSTM – I owned this and made slow steady gains on the last run higher. I no longer own it, but it is now higher than where I sold it and the moves this time are much better than last time. The last 3 days are bigger than a 2 week move when I owned it in May/June.
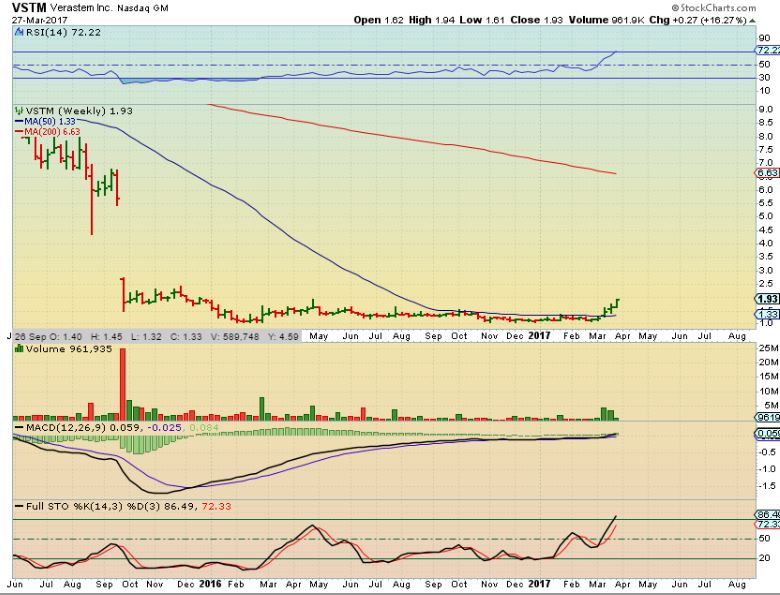
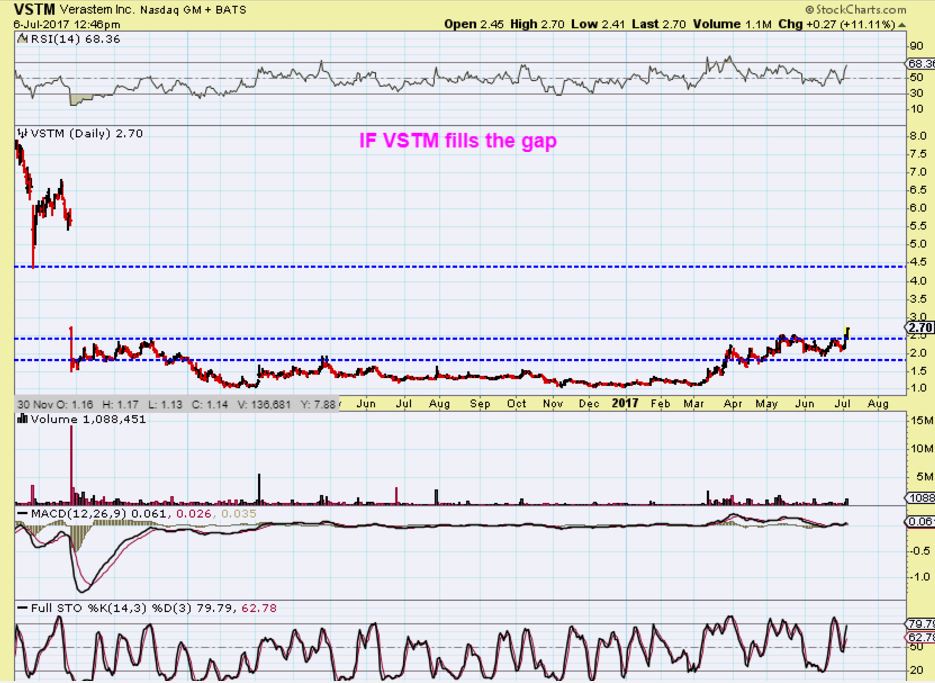
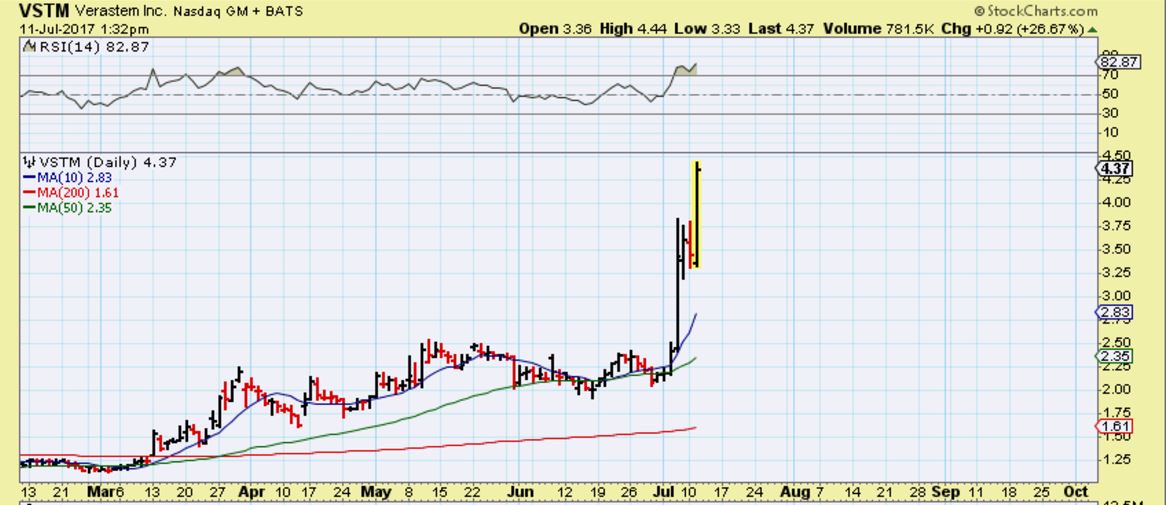
VSTM – We caught this base break out last spring and this stock ran strongly. I used this chart to show the wide open gap on the left. This gap offers minimal resistance and it could eventually run to $4.50 and fill that gap.
JULY 7 – Last week I posted this updated chart, since VSTM broke out at $2.50. Could it now run to $4.50? Again, This was last week.
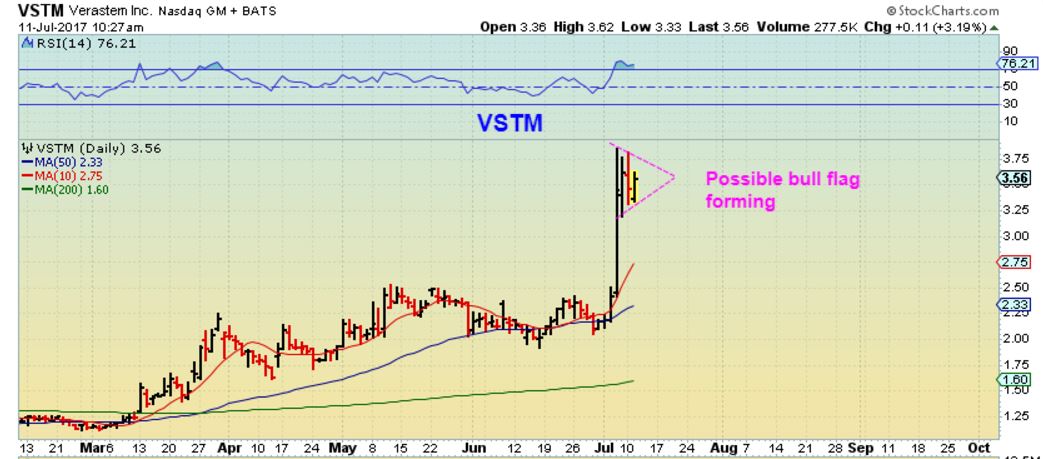
It burst higher to $3.75 and some of us rode this up like this, and I actually posted this chart in the comments section Tuesday morning at 10:27 a.m. to show that a possible BULL FLAG is forming at $3.50.
This was VSTM at 1:32 P.M. Yesterday up 25.67 % and it popped to $4.44. That GAP at $4.50 is now considered filled, since it hit $4.44. I still own some VSTM though. The gap fill is not the end of this move.
Most of our trades in commodities are doing very well, and we can expect this to continue as far as I can see. See past reports for those additional trade ideas. As they run higher, you should expect some selling and down days too, but overall we are seeing gains in these areas. Finally after the selling and the choppiness of the consolidations recently, we are getting some upside break outs and very good trades. I will continue to monitor these areas, including new trade set ups that should also be forming in Energy , Miners, Commodities, etc.
Enjoy your trading, and keep in mind that today is Yellens testimony before Congress. I look forward to seeing what GOLD does after they are released. Thanks for being here at Chartfreak!
~ALEX
A LESSON IN PAST REPORTS REVISITED
In a prior report, I mentioned that in Bull markets after strong moves higher, it is normal to get sell offs and consolidations before the next move higher. These are VERY tough to ride, but if you see one forming, it may provide an opportunity. In the past I showed large consolidations & corrections in NVDA, AAPL, GOOG,FB, and PCLN . Let’s revisit this though, and there is a good reason why.
AAPL – on May 1 I pointed out that steep selling and long consolidation that lasted over a year! Then look at that run! $90 to $145. I actually pointed out AAPL for my LONG TERM TREND INVESTORS back when it was at $100 and broke out.
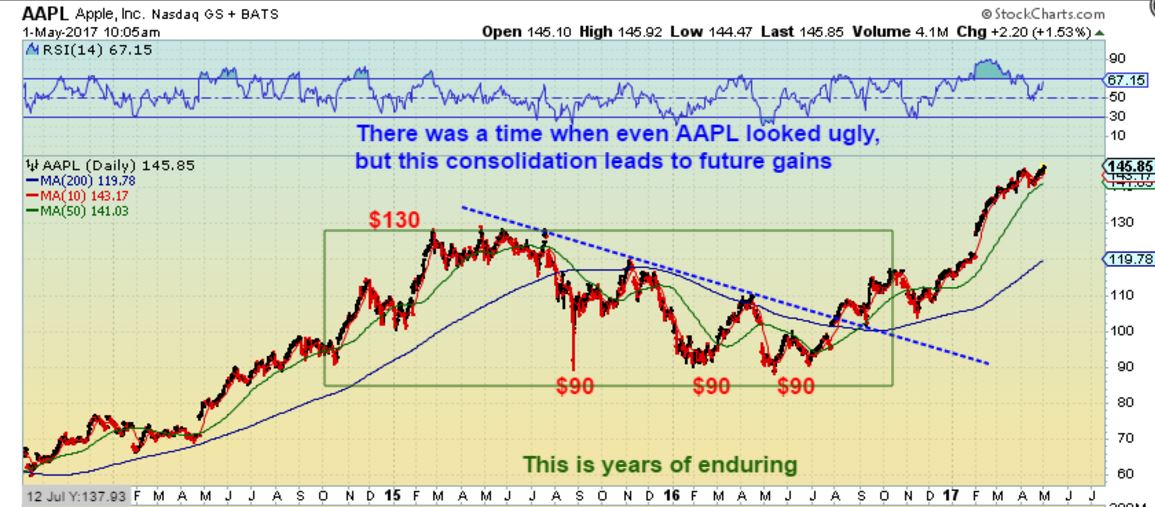
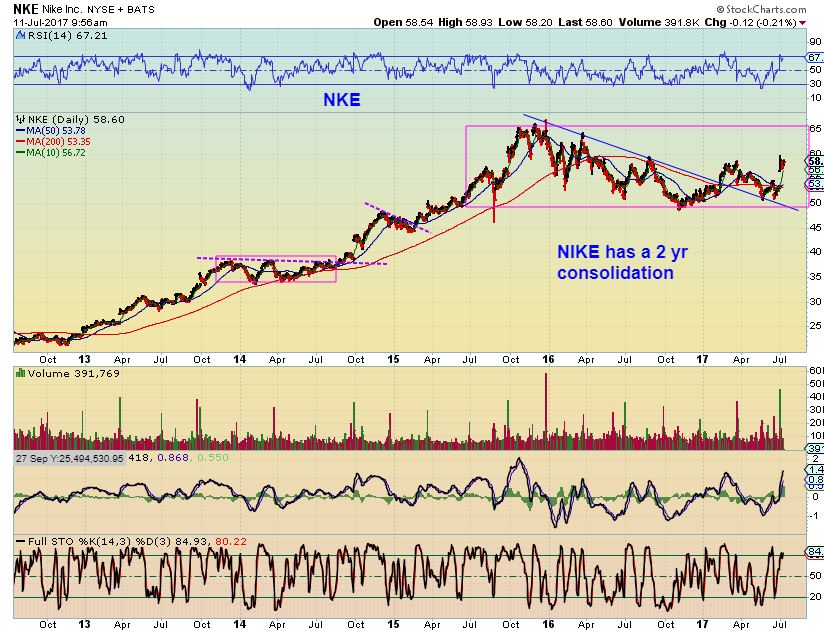
SO this is AAPL s big run, with those long boring consolidations. When AAPL broke from that $90, back tested , & ran to $145, I pointed it out at $100. On this chart, I am showing where I think NIKE is right now, so look at this chart and then we’ll look at NKE.
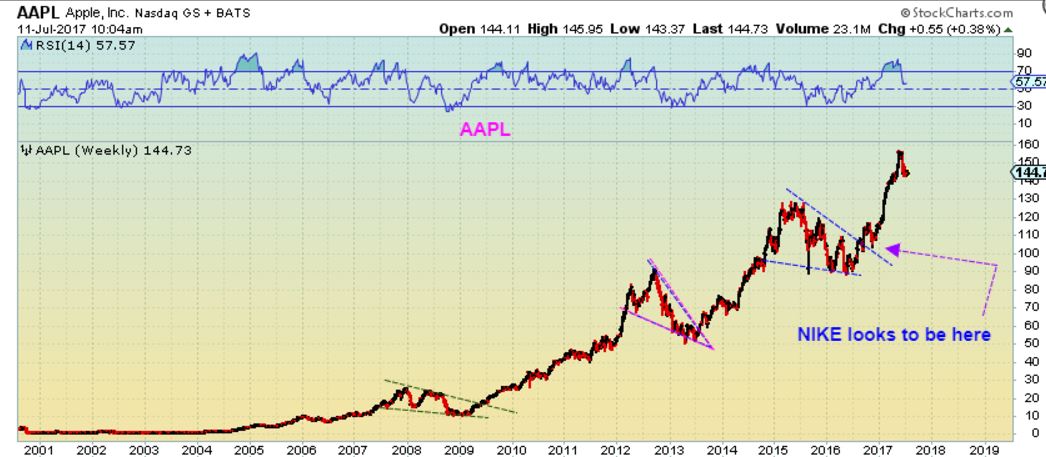
After the Long brutal consolidation, we have the same type of break out & back test that we saw with AAPL. For the Long Term Momentum investor, this may be perfect for you. NOT an easy ride, but it should go higher. Let’s also zoom in.
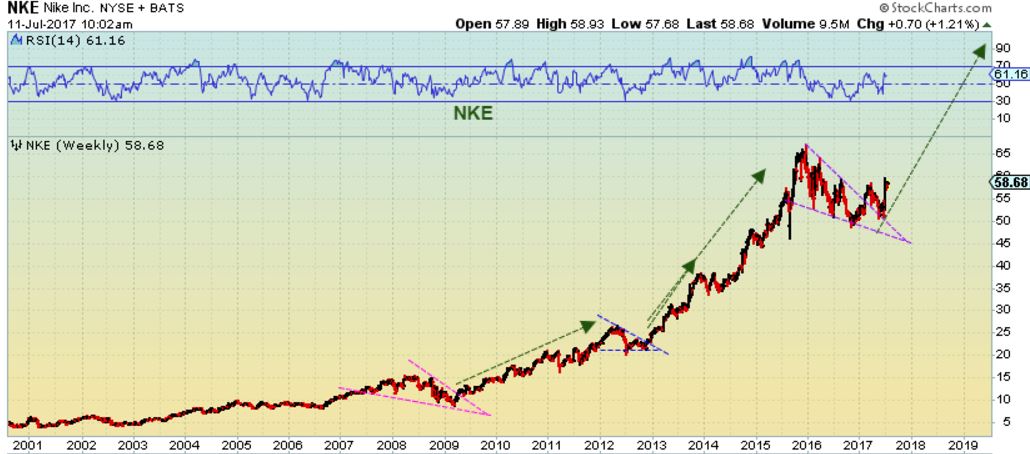
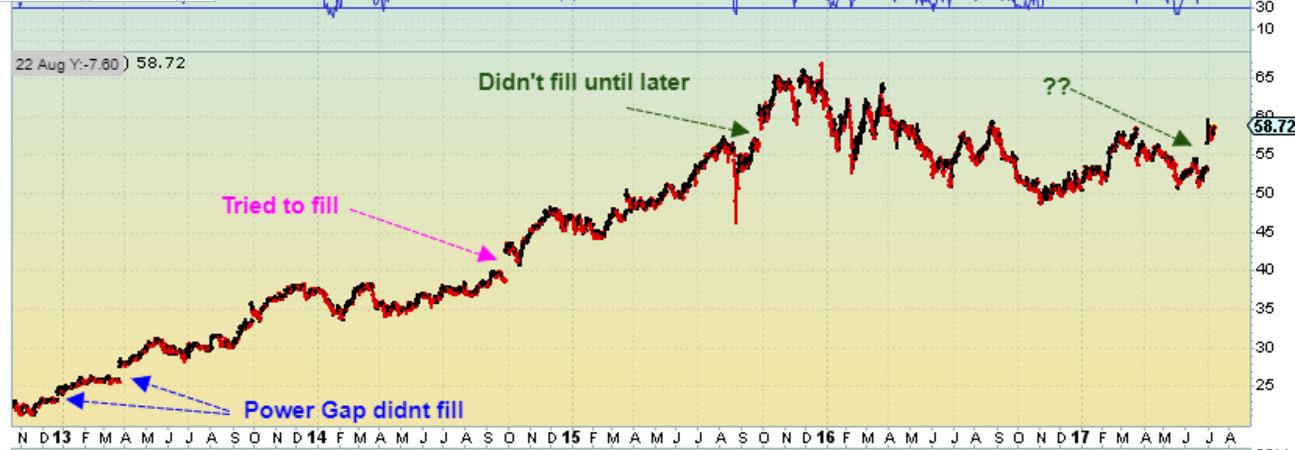
NKE – Break out & Back test- then a POWER GAP open higher. Will this gap fill? Sometimes these Power Gaps dont. Next chart…
This is NKE also. Do you see the previous Power Gaps after consolidations? They didnt always fill right away. For me, I would start a starter position, and add if the Gaps filled. If not, I would add on the way higher.
WHAT AM I SEEING HERE? THAT’S ODD. 
 Thursday July 13
Scroll to top

Thx for the amazing report Alex!
Its nice to see that VSTM and AAPL worked out for some of your readers. But not all suggestions work out, EDXC and OWCP for instance. How do we know which ones to get into? Stops protect your funds, but tight stops sometimes stop you out before a stock runs.
I think that I have touched on this before This answer to this question has SO MANY factors to it, it would take forever to explain. I could write a book on this, and probably will below. I hope this helps. 🙂
Number 1 factor in my experience is that people just want trade set ups. In certain MARKET CONDITIONS, set ups win more often than not. In choppy market conditions, many set up, pop, and fail until later. I get requests … ” I am an active trader, I just want more Trade set ups” – even during strong corrections , or even Bear markets. I will often warn that “We are in choppy markets, this may be a ‘bottoming process” – so many of these set ups may not have the follow through, trade according to your experience in this area., use stops, etc etc etc. I have done that recently in May & June and you should have been aware of that.
NOW I am seeing Steel and other areas put in Bottoms and higher lows. Now that sector can have more success in their trade set ups, because the Bears are out or closing shorts, buyers are stepping in, etc etc. The same will happen with ENERGY & MINERS.
Actually
, VSTM, CLF, CLD, X, HBM, CSTM, SPWR, UEC, and others have worked at
this point. Why? I wrote about STEEL stocks in late May & early June as a Choppy sector that may be bottoming & thus would become a BULLISH SECTOR . That is Key too, the difference between a quick trade or a buy & hold a bit longer is the Sector performance at that time.. Steel ( & most Steel stocks) has not
broken the lows, they are making higher lows, holding support , etc- SO wouldn’t that make then a more reliable set up? Yes. SO A BULLISH SECTOR helps various set ups to succeed. Individual stocks in a sector that is still consolidating or correcting, basing out, etc can have a bit less chance of complete follow through. Choppy trading. Again, I am CONSTANTLY asked to “Give us trade set ups”, even when I know that market conditions are in a choppy environment and less stable- so I try to mention that “There is more risk trading in choppy markets, Some May just want to be PATIENT and WAIT FORW an ICL in Energy or Miners, etc., but by request here are some set ups” . Set ups in markets that are choppy are a probability game, not a guarantee.
SO think about this : When the MINING SECTOR as a whole comes out of an ICL and is Running strong, it is harder to find a failing Miner than a winning miner in that 1st daily cycle. MARKET CONDITIONS FAVOR TRADING SET UPS . In a correction, a couple may do well ( RGLD, KGC, IAG) , while 6 set up & fail & struggle & continue to try to bottom ( GG, ABX, AG, GPL) . Bulls vs Bears. – so MARKET CONDITIONS AFFECT TRADING. Think about NAK – which also ran up hundreds of % when I first started posting it here. Then a correction, then another great run. Recently a correction. Now another commodity run? That gives NAK a better probability, but during commodity & minor corrections and choppiness, I read ” I hate NAK” “Nak really sucks” etc. That is because people rode it all the way up, took no profits, and rode it all the way down, but look at a 5 year chart of NAK & you see a chart like AAPL, NVDA, FB, etc. beginning to develop with strong moves higher out of the lows, then strong corrections and then another run. NAK 5 yr weekly looks awesome to me- but not everyone is making money in that bull run, right? Timing & experience, maybe buying heavier at the lows and then locking in some gains on the way higher.
Also – iF I am stopped out on a shake out below the 50sma, and price recovers, I get back in. Most have the mentality that is if they were shaken out, the trade was a bad set up & is weak, but a shake out is often the trade that runs the strongest. Why? Weak hands have been left out and buyers step in, shorts cover, buyers chase. I get back in if a stop is run and then a strong reversal occurs. That can be my best set up, so I DO NOT get emotional and mad at a trade that stopped me out IF it has a strong reversal back above that shake out point – I buy it back even though it is higher & get my small loss back plus 40% 🙂 If it stops me out and fails & keeps dropping, I just look elsewhere.
As mentioned in prior reports, you can make 6 trades, and if 4 fail (
And you cut losses at say 5% max) and 2 of them run 20% ,30%, even 50 % –
you still win & you can let those ride if they remain bullish ( like VSTMs Bull Flag).
Without stops, some ride losses down 30%, 40% 50%, and then need a few BIG winners to just break even. .
As I have said in the past, through out the year, and especially at the end of the year I look at my GAINS / LOSSES in my brokerage report. I have many losses through out a
year (Small) and when markets are in a good set up phase, I have a ton of good
winners too. One year during the Bear market, I booked $30,000 in losses, but $80,000 in winners coming out of ICLs. You can have losses, just let your winners be stronger and in bear markets, BE PATIENT AND WAIT FOR THE BEST SET UPS- ICL’s.
PATIENCE & WAITING FOR ICLS – WAITING FOR THE PROPER SET UP & MARKET CONDITIONS & NOT JUMPING IN & OUT TRYING TO CATCH A BOTTOM ALSO HELPS KEEP LOSSES SMALL, GAINS BIG.
Thanks for the reply. I think the way you wrote the report today was very beneficial. Stating things like Pharma Risky, and Higher highs in Energy looks good, etc.
Yes, and in the past I have definitely written that markets were choppy, that trading would not easy for inexperienced traders, higher risk , etc. in those market conditions. I added that I am being asked in email to just give trade set ups despite added risk of Biotech or bottoming process, and so on.
Some people ‘skim the reports’ and miss a lot of that, but it is all important to take in.
What a great thorough answer with a good solid overview on how you trade. I see some of my failings in there. I will keep working at improving and changing some of my old ideas.
Thanks Nancy – Another little tidbit…
Some of it really is not easy, because it goes against what we naturally want to do. It takes time & experience to look back and see what would have been better.
One of the hardest things that I do is selling partial positions on the way higher at times. I do NOT usually do this coming out of an ICL in that 1st daily cycle, but I often do it in the 2nd or 3rd daily cycle, because I know a top to that daily is coming and by then charts look more overbought and a pull back can be deeper. THAT is the thinking behind it that gets me to let go. Over bought/ 3rd daily cycle / these are going to drop sooner or later. I sell some & ride some.
It is still Very Hard to let go of a winning stock and sell on the way higher, but I look back at other 3rd daily cycles charts of miners at that time & see how stocks did actually sell off in a 3rd daily cycle- that often help me to want to lock in gains.
I’m getting better at taking some off the table…but I STILL fall in love with too many and hold too long. I will be watching more the 2nd and 3rd cycles. Please keep reminding us!
I totally understand. I fall in love with my best performers too ( like VSTM currently. I don’t want to sell it & miss potential gains, so I sell some & let it ride until it gets tired). In the past I have sold a stock that popped and seen it just keep going to ridiculous levels, that is why I try to just lock in some gains & let it ride.
We are all still learning 🙂
…book is right…:-)
Just able to read now… Very thoughtful answer.
Thanks Alex!
On the PM front, when I look at a weekly chart the rise off of the Jan 2016 lows was about 6 – 7 months.
The correction since then is about one year; so we can certainly argue that in terms of time it certainly has been long enough.
Picked up an E.W. book; Elliott Wave Principle Key to Market Behavior by Frost and Precter.
The last part of this long correction ( C wave?) for many of the PM stocks has been a triangle (you have noted the triangles many times).
Per the book, triangles are usually final movements in a correction; usually occur in C waves in a correction. Represent a balance of selling and buying (tighter and tighter range); Usually occur with decreasing volume and volatility (check)
So maybe with your example of AG above and many others we are nearing the end of the correction.
I think the triangle in AG is the DCL, DCL,DCL.
Have a great day!
I thought Triangles are a continuation pattern?
Hi Bill,
For a long correction like this one, you have combinations. Zig zag down for “W”, zig zag up for “X” and then you could have a triangle to complete the correction for “Y”
We had an up move into July 2016 before the correction started so I think we will have a continuation out of this triangle to the up side.
Just my two cents.
Alex, im confused. The FOMC minutes were released last week ( i think ) . However my calander shows the Chair to testify this morning and again tomorrow morning ?
Yes, saw her on TV giving her fake speech.
“Minutes’ are the content of the FOMC meeting that already occurred. Extra details can come out when released.
Minutes were released on July 5th I believe, and Today is her testimony. I think I may have written that wrong in the report, thus I think I caused your confusion.
I will fix that
is this not suspicious – gold up on the same day right before we have Yellen?
Her speech is already released. Market and gold reaction pop came after it was released at 830.
oeps didn’t know – thanks – I’m on the other side of the Ocean : )
Yes, I just saw that on CNBC, they were covering what she said, lighter balance sheets going forward , etc
Man, GPL is a LOW volume stock! Only 100 shares traded in the first 1.5 minutes of trading today vs 130K shares of AG. No wonder it is so easy to manipulate that stock by “pump and dump” guys.
It is fine. 100,000 in the first 10 minutes. That is a lot, I bet that it will be over 1 million by the end of the day
… beautiful open…. will it stick….hmmmmmmmmmmmmmmmmmmmm
think this calls for a………… ‘go NAKKY!!! giddyuppp!!’
shhh….
*act like a duck …;)
#gameFace
NAK up 26% for the week and the SLO STO on a weekly chart isn’t even over 20 yet!
Opps! # gameFace
ahemmmm … SHH 😉
*maybe today will be the day for TGB … not much room left in that triangle…………
#TrendLineAddict
#TrueStory
https://www.tradingview.com/x/KgmHyEKZ/
Yeah would be nice to see it break above that wick on a previous candle of 1.31
Bottom of todays candle is sitting on the 10 DMA.
QQQ/TQQQ finally broke above their 50 day SMA today, so all systems are go. I’ve been very heavy in my old friend TQQQ since yesterday … just hope the Fed Notes don’t “put a harsh on my mellow” as the hippies used to say.
Miners: Are we there yet? Started position..GDX
If I remember right, CF said he thought the lows were in Yesterday for GDX, however Today I think he said no guarantee the ICL is in, could still rollover.
Thanks Bill…will keep eyes on.
PLG has been sneaking up…
whoa .. SPWR
I saw that – I did not get my re-entry on the 50sma : (
Oh well, plenty of other fish in the sea now
US$ has positive divergences and is now trading above the 10-day MA
Will Yellen change that while talking to Congress?
CURE, LABU, AND $DRG all breaking short time down tends looking ready to flag higher
FWIW … NAK is a “sell” on my 15 min chart this morning and volume is very heavy. Bad news … or dip buying opp? Remember the 15 min is an intraday signal for day traders, not a long term call.
hmm CBNX CNAB…. interesting
wow .. nice pops…
look at that 200day to the rescue,,,, wow .. nice legs..err um Leg …….
CYTR
https://www.tradingview.com/x/bOPupFEW/
literally just messaged u and Cf about this… lol
TWTR is continueing to play out well above that 50sma and actually looks to be breaking out ( small inverse H&S)
what a tremendous little engine that could….. bring on 20 😉
TGB is still a nice set up. I think it is slowly climbing to the break out point, and then may Pop & run
I must admit it’s tough tough watching…like paint drying :-((. #patiencereq’d
I own it- You’re right, but when the time comes, this one could do very well
( look at a 1 yr weekly, another run higher would be stellar ).
IPI aye yeh…breaking out of long weekly triangle on good volume. Let’s see how far this puppy can run!
Its living up to its name “intrepid” 🙂
Pessimistic view for NAK.. hopefully not coming to pass.. but would probably satisfy BillyBob’s limit order near 1.05
https://uploads.disquscdn.com/images/ca67eb4e7a9302a813e48f7f64466eaf8bcf4991f3491d666648e7ea5e1817ea.jpg
I did a wedge pattern and if it back tests, I’ll be buying / adding depending on how it acts on the pullback.
I s’pose a pullback to the top of the wedge would complete the C wave, with a truncated Cv.
Everyone’s happy then,.. except maybe, B-Bob 🙂
Oil outlook
http://finviz.com/screener.ashx?v=211&t=QEP,UNT,SNMP,GPRK,REN,ECR,WPX,MUR,MRO,PNRG,GPOR,AR,ERN,RRC,DVN,SBOW,APC,KOS,LPI,CLR,NBL,HES,SD,COP,APA,NFX,RICE,ISRL,MPO,PDCE,AXAS,EQT,MCF,MTDR,XOG,RSPP,GTE,OXY,WRD,CPE,XEC,CXO,COG,EOG,PE,FANG,PXD,LLEX,PHX,EGN,BSM,ROYE,VNOM,SRCI,JAG,PVAC,KRP,ESTE,ROSEU,CDEV,UPL,REI,SBR&ta=0&p=m&r=49
Thats pretty much a ‘mixed bag’ look t this point ( I think).
Agree.
Hi Everyone
In my experience I tested GDX against a bunch of individual miners of all sizes and GDX did half the rise v buying
individual miners. So I skip GDX. If you are trying to decide to buy GDX or an individual I would do individual
stocks – split your money between at least two. Also, I think some Hedge Funds move in and out of GDX too fast and
effects the price.
While i agree with your thoughts on G D X, i think it will be interesting to watch the performance of SILJ considering their holdings & the gold/ silver ratio.
SILJ has very little volume, only 24K shares traded today (15 mins to close) so be careful! You can get clobbered with wide spreads when lots of traders sell at once. Also, trading individual miners is OK if you can have basket of miners because putting all your money into one or two miners exposes you to company-specific risk due to earnings, mining disasters, strikes, etc. Although I have to admit that I have at times put a huge % of my portfolio into only 1 or 2 miners, but I knew the risks.
Hi CF, Any insight into this GOAU. It might be new I think.
I just looked it up and I think it is new.
All I can say with that is that it should follow the miners, but without chart history it is hard to tell what the performance will be like. It isnt leveraged, so it should be semi easy to ride.
It’ll take about 3 months of history to be better able to get a feel for it.
Thanks for that CF
Alex, $wtic seems to be moving but XLE does not…any thoughts?? thx!
Alex, I am curious as to your gut feeling for uraniums – using URA as we’d use GDX in miners. Do you see a big sector run coming, or is it a wait and see thing at the moment? TIA
think hes been saying were heading up in a few reports now.. I could be wrong but hes discussed URAs for a while now
… yeah u have all that insider info from all that secret writing back and forth…
#bromance
😀
stops scribbling – tosses note in the trash can and puts head down
You email 20x as much as him – LOL
#OHYESIDIDSAYTHAT
https://uploads.disquscdn.com/images/2f2651532e92cc4a90caf836e22a118ea8cdb48c6540876ca5c0e7981a555486.jpg
hahaha
dont encourage him…. ;-]
To Rob, who is currently trying to delete his post 🙂
I do like the Uranium stocks and URA seems to have bottomed… HOWEVER ( Don’t cha love the ‘however’ ? )
URA
under the 200sma could pause . It is quite overbought, and it does
have other factors that make it look like it wants to pull back a bit.
Will Uranium stocks do their own thing as URA pulls back? It depend.s
URA could just crawl along that 200sma for a week or so &
become less overbought, & then break through, OR it could drop
back to the 50sma and some uranium stocks may pull back too. So time
will tell.
Hahaha. That intro made my day. Thx Alex!!!
Thank you WRN, for reading about yourself in todays report and acting accordingly
IDRA has the follow through needed ( See todays report).
and VSTM
*assuming u put it in the report i didnt read yet
Just sold 1/2 at $4.45
nice.. *think* i see 5.74 in the cards…. u?
Although, I don’t have my computer set up yet with charts etc. I bought 1000 shares of GDX on my I-Pad and will be able to average down if necessary. I hope this works as I won’t be up an running until around the 18th. I hate doing this without charts, but I’m not missing the next ICL.
That is TOUGH – I have done that and I hate it too. Especially since we do not have a CONFIRMED swing low in place yet. Miners have been acting well, with Golds sell off in June, so that is in our favor, but it remains tricky at this point. Feel free to email me with any questions in this special situation.
I may not be in front of my computer all day , but I’ll try to answer as soon as I can. I will be away part of this afternoon.
Thanks Alex. If we drop some more, I’m thinking we’ll come back up through my buy point again in the near future. Although I don’t have a stop, because it’s a basket of miners, I’m thinking that’s safe. Also, I can average down guide a bit if the bottoms much lower. Does that make sense or am I off the wall?
A basket of Miners makes good sense, because in one of my last reports, I did point out some Miners that just did not sell off with Gold & Silver in June.
Even that FLASH CRASH in Silver didnt break silver stocks lows, so HOPEFULLY you will be just fine.
Micheal Jackson was
“Off the wall’
Thanks so much!
DAYTRADING CHARTS told me to sell another 1/2 of my VSTM at $4.45 right now
EDIT – It might form an intraday cup & handle…I will watch for the possible handle.
I am using a 3 day 5 or 15 minute chart when I say that
VSTM – $4.50 , So I did hold on to some just in case 🙂
alllllRIgggggt .. im shaving a load off … 🙁 ;o)
Very Nice trade CF !
Thx Ken- I saw your PRNT & VJET gapped this morning 🙂
They did… 🙂
Whyd you sell VJET?
Sigh….I am kicking myself Bay. I just did not like how it was acting at the time. I was wrong.
Although I did add to PRNT at the time of selling VJET but now I am dealing with a low volume ETF. lol
Thank you for pointing out the Volume on PRNT……scary low, making me nervous. lol
AG Kicking major butt these past few days.. GPL gotta keep reminding myself this thing moves like a snail
AHHHHHHHHHHHHHHHHHHHHHHHHHHhh, They are both up 13% in the last 3 days.
AG up 13% total off of recent lows, GPL up 20% total off of recent lows.
I kind of like both right now. 🙂
LOL – maybe I have to remind myself. 1k shares of AG looks better than 10k shares of GPL. 50 cent move in 3 days feels better than a 5 cent move in gpl… ehh who cares lol
I know. I have that “I missed it” feeling with AG already. Up quite a bit off of the lows!
ALO – Big sell off, Big comeback??
CF – your SID chart – did u mean now overbought? RSI is getting pretty high
Yes, quite over bought. I hate it when I do that 🙂
NG lagging …….
As of 12:50 pm Metals:
Yen: further positive conformation.
USD: flat
Bonds: further positive confirmation.
This is just my trade …. Though would appreciate advice. Have been looking for an entry back into BWEN …. I like it here if it can hold above $4.50ish …..
supply just overwhelmed demand for CENX and I got knocked out of 1/2.
NSRPF up another 18% today coming off a very good day yesterday on high volume 180K as compared to its normal 50K (this added in deference to Alex and his concerns over volume) now at .88/share next resistance looks to be at 1.30-1.40.
Wow! Closed at $1.13 and went up to $1.30.
Boom 52% – I Hope you own that one Ed!
Yes indeed!
I really dislike URRE….
Sold my GDX for lunch $…going to wait for confirmed swing low. My gut said to do this
I’m trying to wait for confirmed bottom but some are really luring me to at least start a position. Not sure yet…
Another UPDATE to my NAK post from earlier today: I got stopped out of my small NAK position because I set my stop VERY tight due to getting in late. If I had bot 2 or 3 days ago under $1.30 it would be a different story. Also, I’m much more bullish on stocks than miners, to me miners are a short term trade. Still long quite a bit of AG and a little GPL.
here we go with this elusive rotation again – out of the “other miners” of industrial metals and into _______ fill in the blank
This is just me being a chicken, but I have also tightened my stops on AG and GPL. Will probably be out of GPL by EOD and will sell some AG for a profit. I feel very comfortable in TQQQ, but miners are not giving me “warm and fuzzies” right now.
https://uploads.disquscdn.com/images/5cc31c553b1cec5734b2e3be3b2b6bcfc32a653ca83593cd70da77025e808d31.gif
CYTR Cf – and Mama
what means this post???
Lol, Alerting CYTR has some activity. CF trades it and Maria trades it…
that explains why I couldn’t find the ticker MAMA lol
https://uploads.disquscdn.com/images/029bcf0befd4785759742325926db79a32f0af68dcadeec31f34b82bc7f88259.gif
lmao
c u tuesday round the corner friends
im dying
https://uploads.disquscdn.com/images/da85fe8f9ee9ec8fbda0171c4e5a935f8913407244019d57fd914762423a2c54.jpg
How do you have your left hand around that guys arm, and in front of your waist too.
3 arms…
Cool 🙂
*I’m sneaky like that with my hands ……
*so im told … ;o)
Meow
Is that CF with you? Being all salty in thr corner?
What doe this mean?
Raised my stops on NAK. If I get stopped out, it will be with a decent gain. *bort*
If I stopped on NAK now, I’d get raked so gonna have to hold for next pop. Disappointed *bort*
anything strike your fancy coming into the close… daddyDearest …?
VSTM dropped to $4 after selling near $4.50 – and the 5 & 15 minute look like a short term buy at $4?? 🙂
Honestly – I am just checking in quickly – I haven’t had a chance to scan everything, b ut I have been watching PXLW , CY, AMD TWTR , GRPN for TECK stocks
PXLW is looking pretty nice
I’m heading back out however, so no buying for me into the close
tx
CF,
Without telling you the stock, would you buy this back test ?
Somewhat unfair I know but …… https://uploads.disquscdn.com/images/753d4b7b95a19cc36a5a7b270d330d090b5183f13a342d41a8cd2676c1a3d71a.png
I dont care what stock it is, but I do need to see the volume.
It does look like a buy though, if it doesnt break back inside
Thanks
WAIT—- you might want to draw that trend line from the MARCH high and across the tops. It may lead to todays high
Checking….
It does on the money no less
Like this …I may not buy this unless it breaks higher again
refresh
https://uploads.disquscdn.com/images/4512f9f004ecb2777047095c7b929acf83fb29fe228ae314a434cdc644b2a5f4.jpg
Got it ! Thanks
The way that you drew it is not wrong though, it does look like a longer trm break out. I’d just watch it for a bit longer.
Thanks CF !!
Yes- a 3 month pattern may give you the shorter term direction. It may need to still break out from this pattent
Hey Man… If you brought it to class, there better be enuf to share with everyone..
MUX 🙂
This is a rowdy class. I like your style!
I am holding my recent positions, but I should mention that GLD tagging that 10sma and maybe rejected there could be a sell for just scalping out of the lows , but GDX & GDXJ Seem to be holding theirs right now
I am going to see what it does for now.
Vacationing Spain and Cuba, so wont be charting. Keeping an eye on Nvda for double top. 700 % in 2 years, PE at 60. A joke and bubble, just curious if it burst now or later.
Very Nice – are you traveling through Spain or just visiting one specific area? That is one place that I have not been to yet, but I would really like to go there.
And Cuba too – that should be quite interesting with recent developments opening up a bit of tourism.
Enjoy –
Thx Alex.
In Alicante and Albir in Spain, attending a wedding. It’s a beautiful country with nice climate and delicious food.
Cuba is the main destination where I travel 4 cities in a period of 2 weeks. I wanted to visit before it change too much from its current state. I think transportation will impose a challenge as communism often lead to market failure in some areas. However, if I get sick, Im in the best hands 🙂 I’ll update along the path.
Sounds like a wonderful trip….enjoy!
Using the vaca funds from trading?! :O
Observed gold got rejected at 1225, which is sign gann degree from 1296 top, also comfluence w Ema 10(?). Im still bullish, and hope shorts accumulate for proper thrust upwards. In a bull market, surprises should come to the…?