
Thursday July 13
The climb is hardly ever straight up.
.
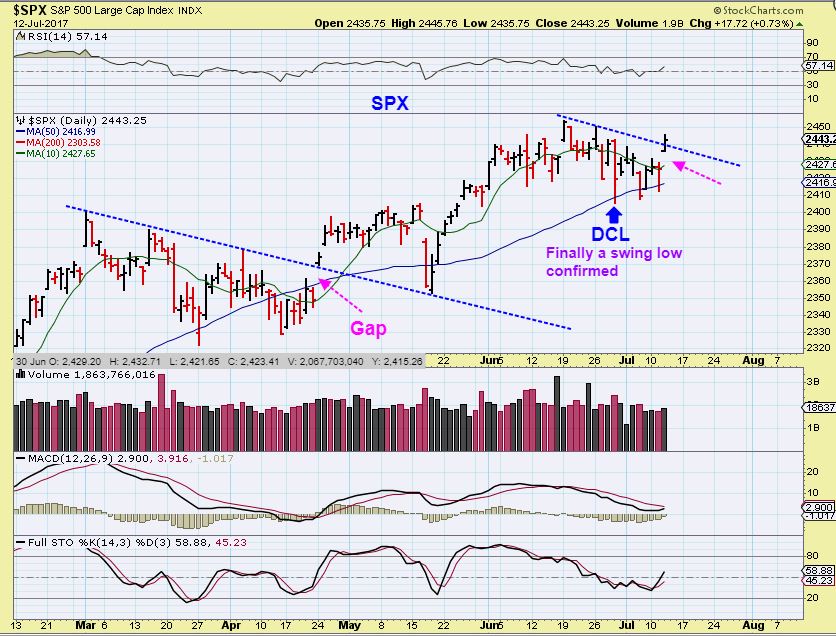
SPX – We were anticipating a trend line break and a close above the 10 sma to help confirm a dcl. We got it. The last time that this happened, the gap filled one month later.
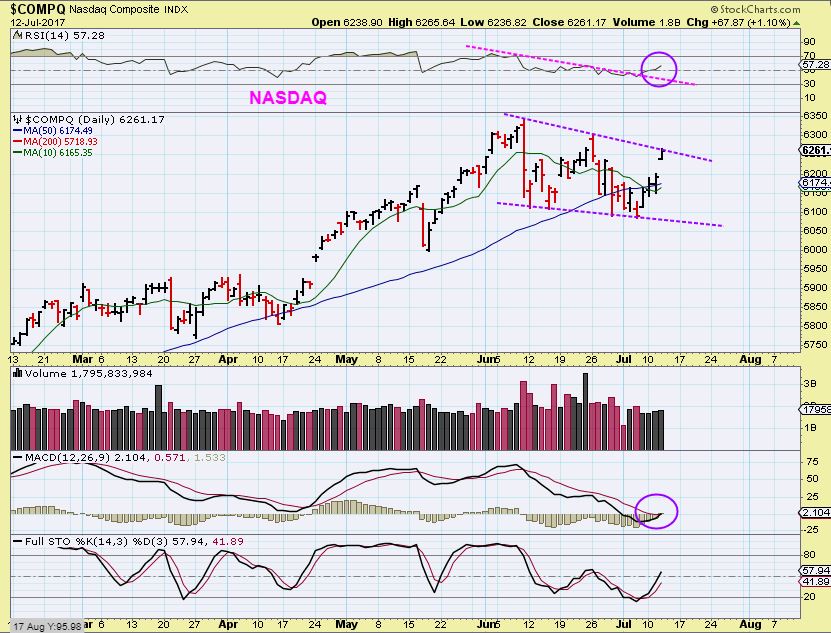
NASDAQ– I pointed out that the SMH had both a trend line break & a close above the 10sma, so the NASDAQ would likely follow, signaling a DCL in place. ‘Long’ positions were encouraged as early as Monday with that close above the 50sma, but there was a need to keep a close eye on them. This looks bullish with the follow through.
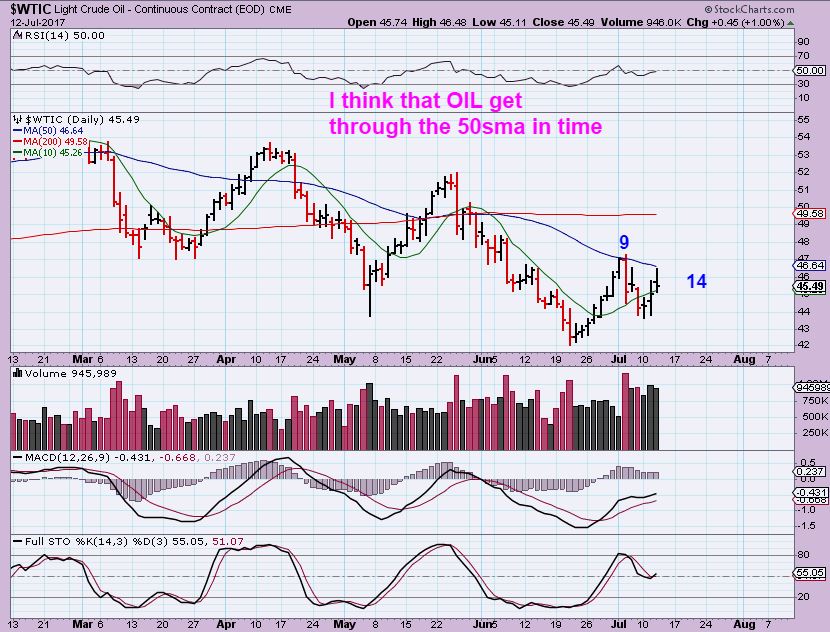
WTIC – Oil was stalled at the 50sma, but I am thinking that this stall will be temporary. It remains above the 10sma & the oil Inventory showed a drop and that ought to be bullish.
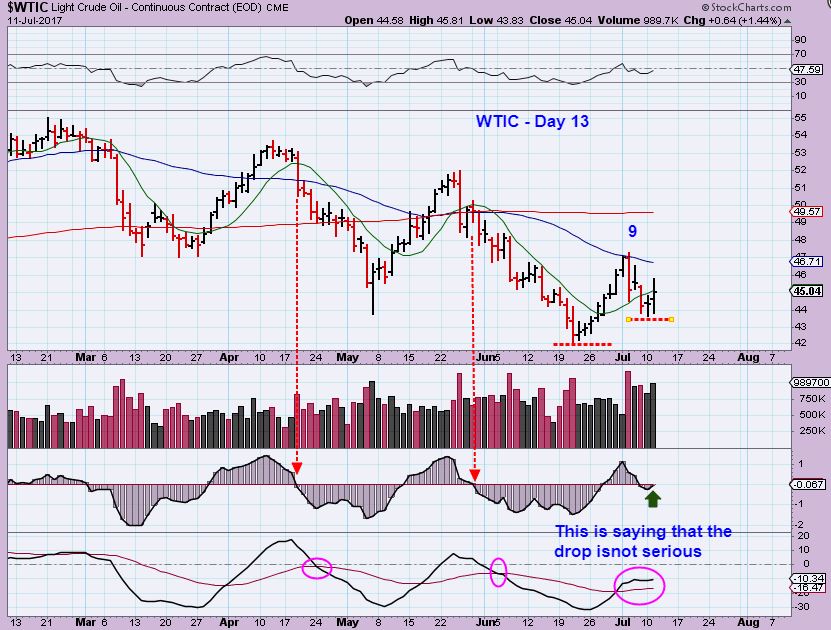
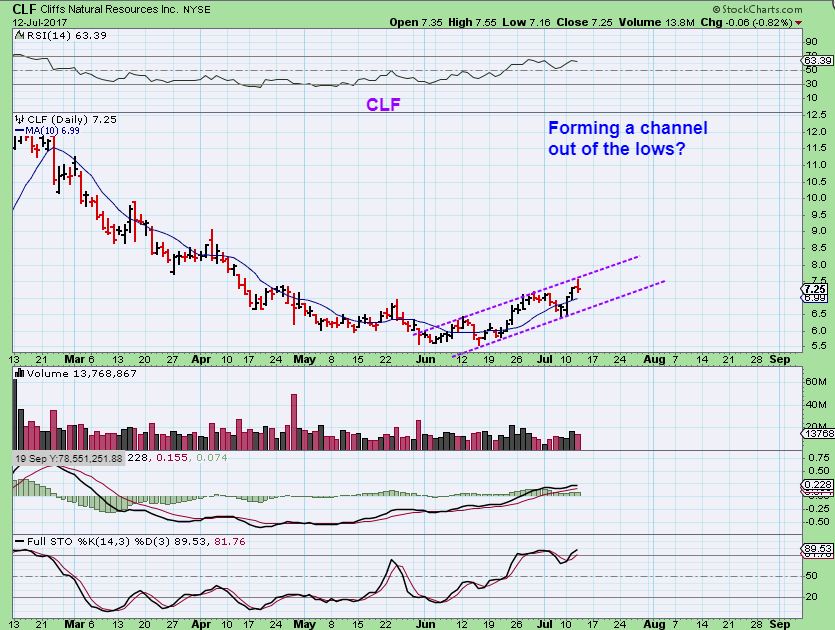
This chart from yesterdays report ( and one posted last week) indicates that the current bounce out of the lows are stronger than prior bounces out of the lows.
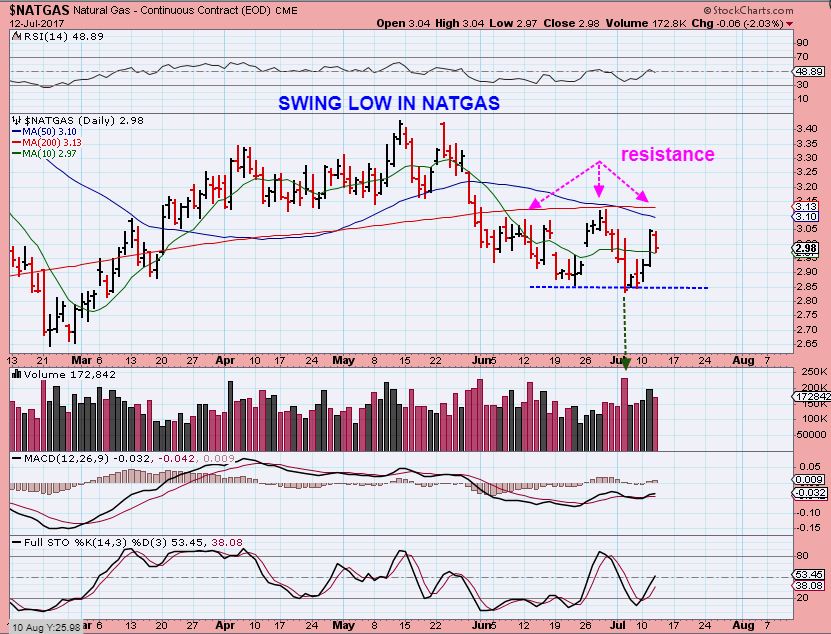
NATGAS -Inventories come out on Thursdays, and the NATGAS chart seems to have put in a slam down high volume low last week. We do have solid resistance above with a 50sma & 200sma cross under, so this needs monitoring.
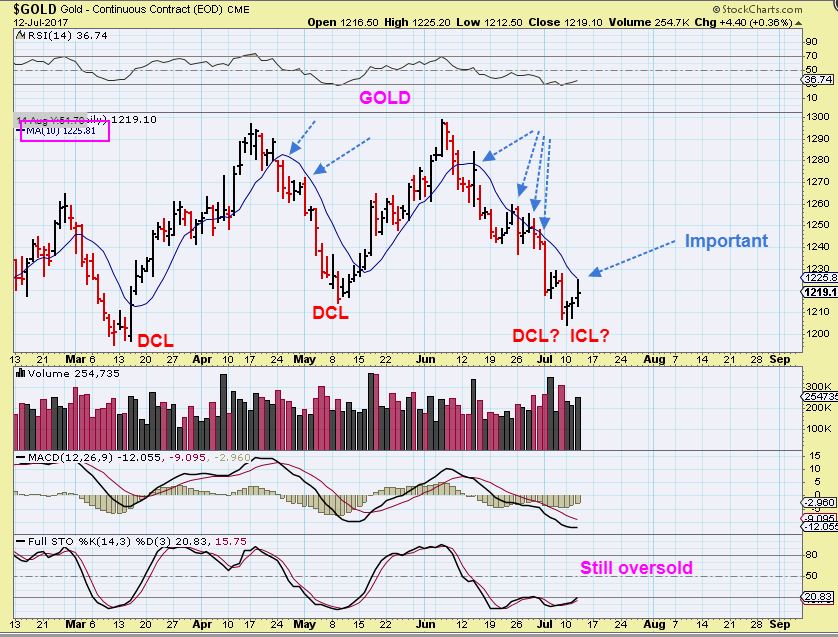
GOLD – I want to go back and just revisit the thinking that I had last week.
GOLD – I entertained the possibility of a dcl in June and a drop forming a bear flag on day 10. This would lead to more downside.
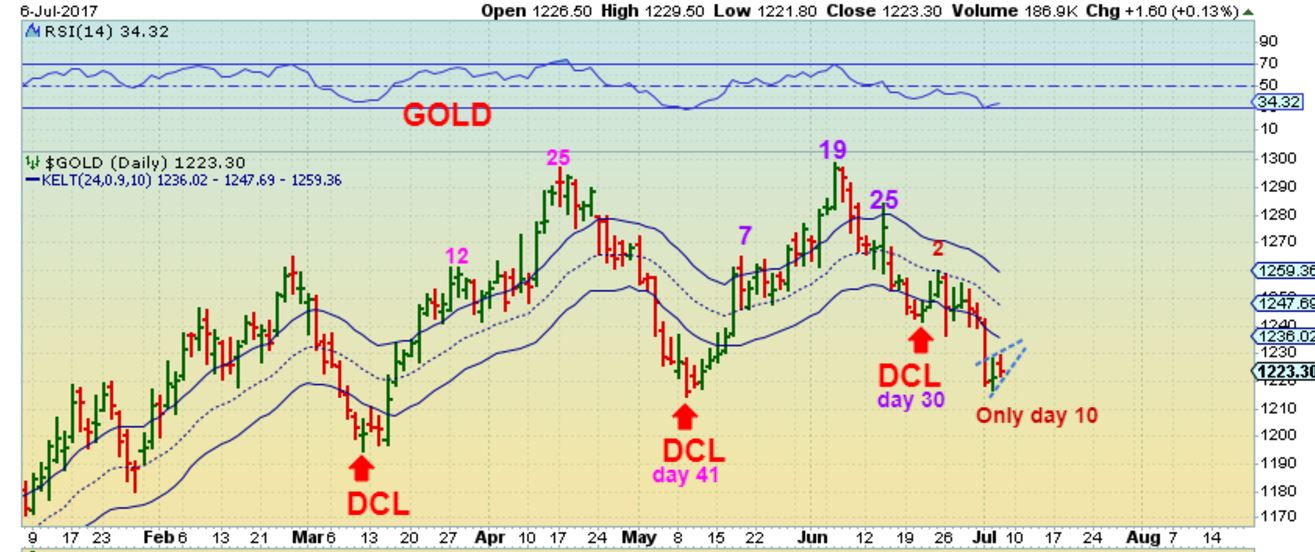
GOLD – We started that drop on possible day 11. Were we about to drop into a solid freefall ICL into day 20+ for the daily cycle ?
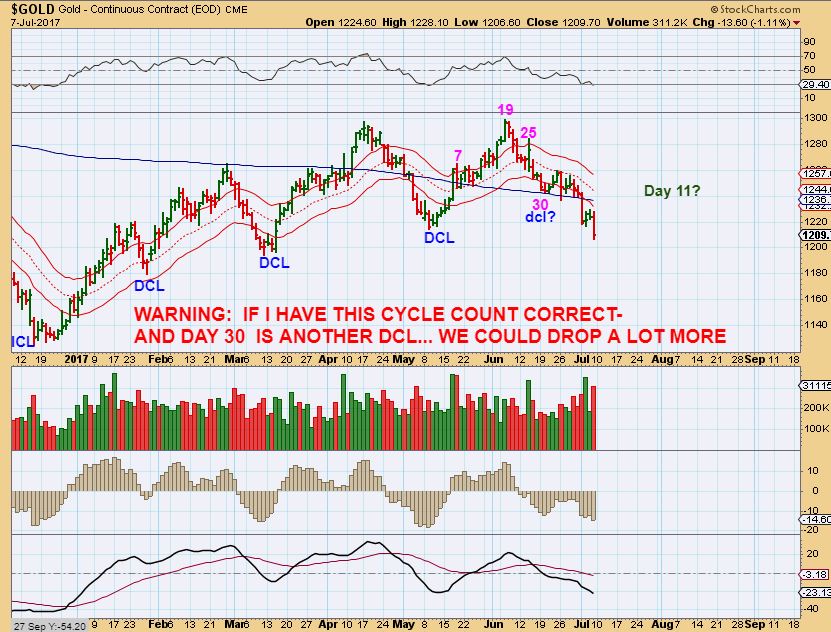
GOLD DROPPED FOR 1 MORE DAY, AND THE WE SAW A REVERSAL ON MONDAY. I THEN POSTED A REPORT SHOWING HOW MANY MINERS WERE NO LONGER FOLLOWED GOLDS SELL OFF THROUGHOUT JUNE. THAT RAISED A FEW QUESTIONS…WAS THAT SIGNALING A BOTTOM COMING IN GOLD & SILVER? THE C.O.T. LEVELS WERE ALSO DISCUSSED. COULD WE BE SEEING AN ICL AFTER AN EXTENDED SELL OFF ON DAY 41, INSTEAD OF DAY 11 OF A NEW DAILY CYCLE? AND THAT BRINGS US TO TODAY.
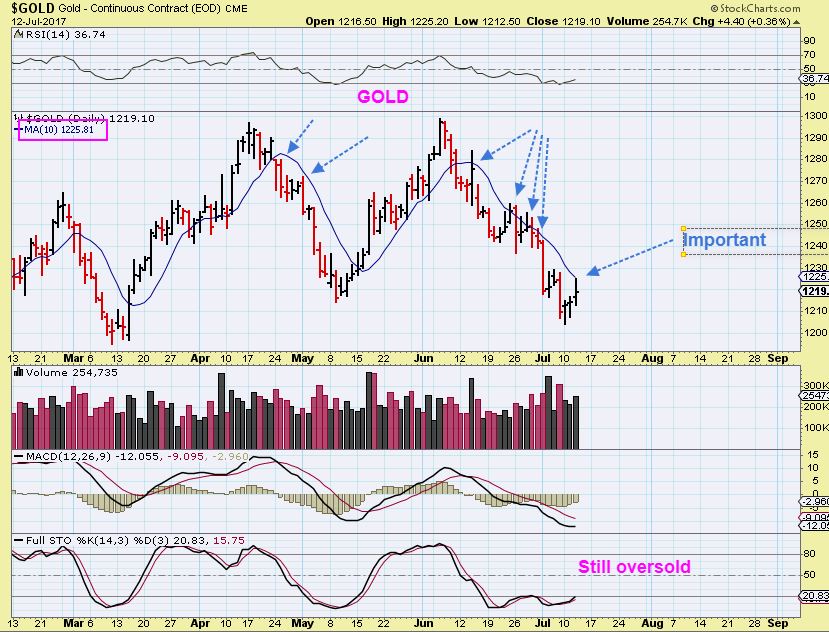
GOLD CLOSING OVER $1225.81 would be a nice start.
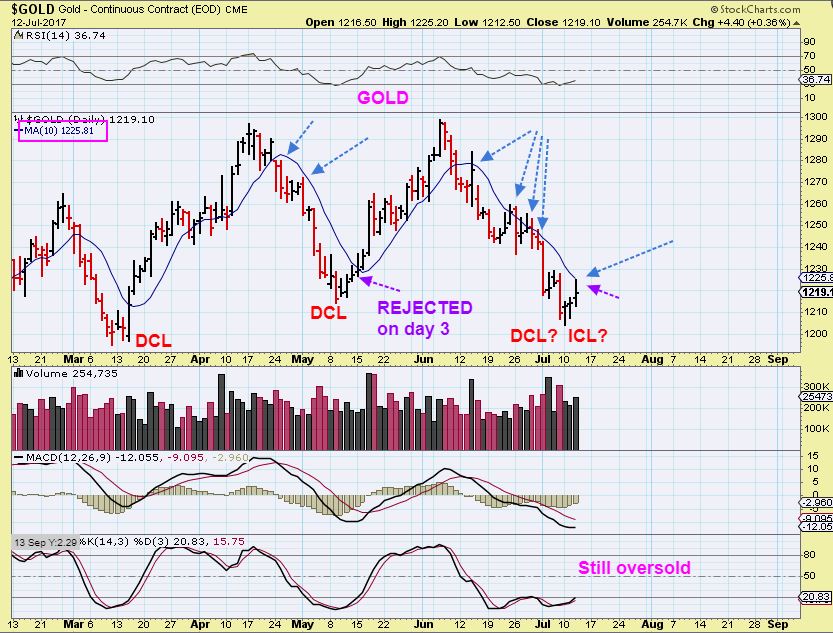
$GOLD – I Bought Miners on Monday and would watch and see how this plays out coming out of this reversal low, but I would remain cautiously optimistic. We are nearing ‘Do Or Die’ time for Gold. Gold was rejected at the 10sma Wednesday day 3 – ( OR – DAY 14?) .
GOLD – This rejection would have been where I might sell JNUG if I went leveraged and just watch it play out. Gold is up in pre-market, so with yesterdays 10sma rejection, one could sell JNUG pre-market too, and watch if they were uncertain too. The question is, was that an ICL on Monday or Day 14 Wednesday of a continuing daily cycle? I am still holding my Miners for now.
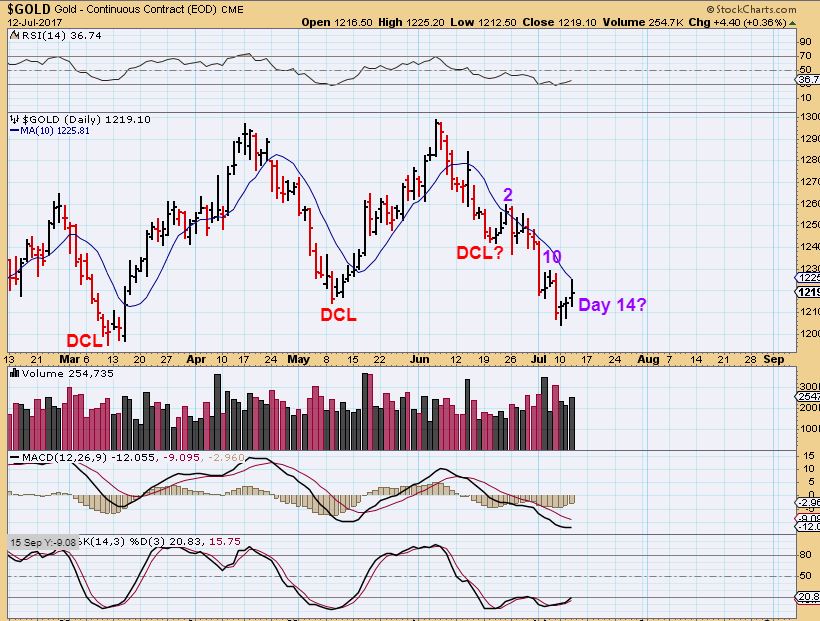
GOLD – The 10sma is important, so I am watching that this week.
GOLD – Gold was rejected on day 3 in May at the lows, tagging it and selling off into the close. The 10sma was then broken on day 4. Right now we are possibly on day 3 too, that is why I held on to my miners, PLUS they didn’t sell off in June with Gold & Silver, so I feel I have a little time.
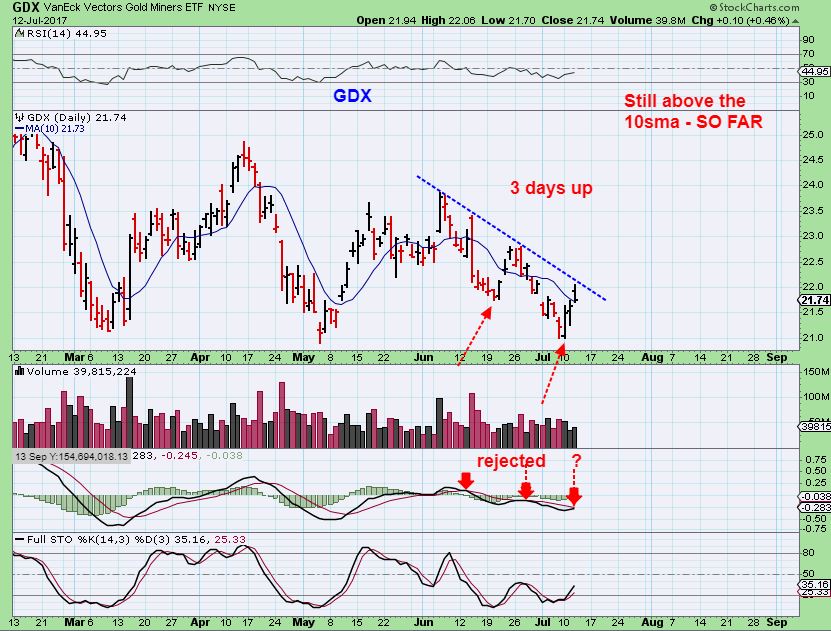
GDX – Gapped over the 10sma on Wednesday and then filled that gap.
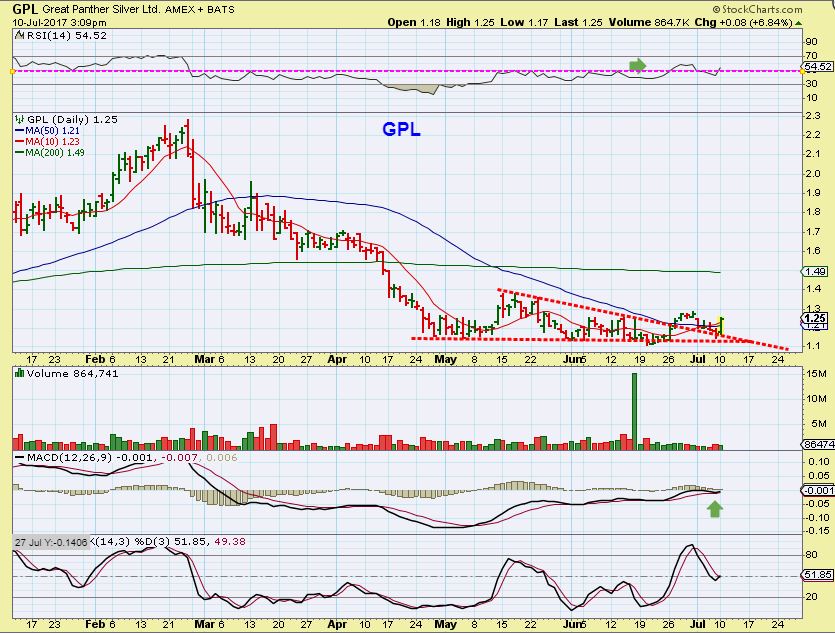
GPL – For example, I used this chart of GPL to show that Miners did not sell off with Gold and Silver in June.
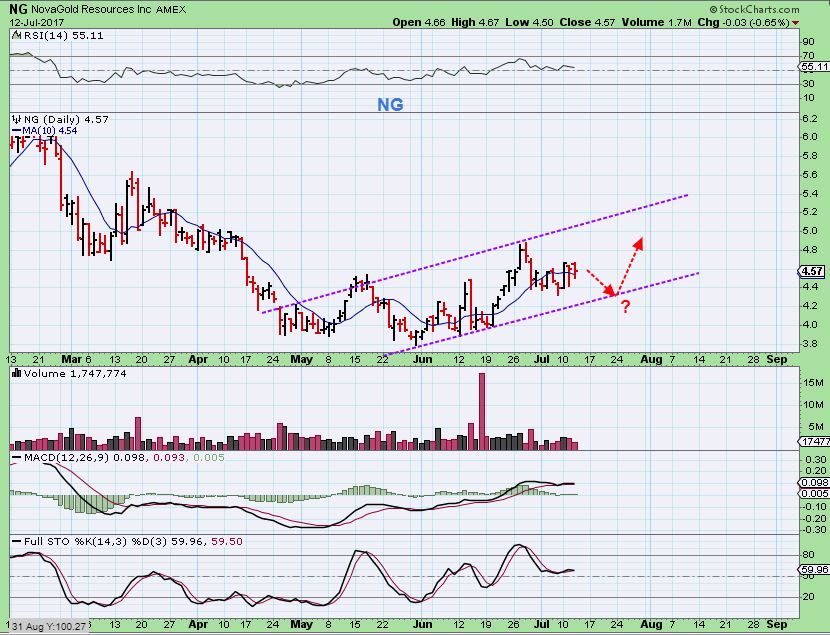
NG CURRENTLY – This could drop or Pop and still be inside of this up-trending channel.
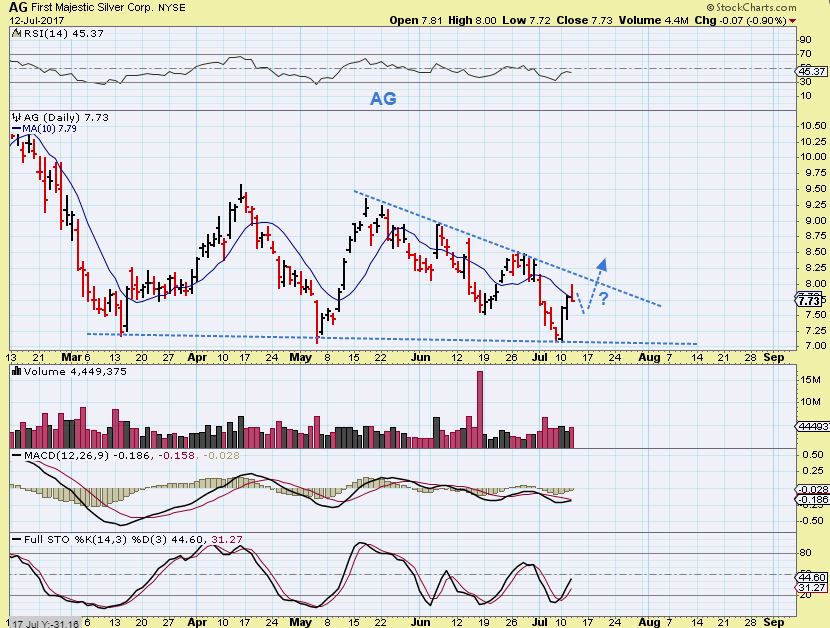
AG – Take a look at day 3 in May. It broke out above the 10sma after day 3. SO AG may still be just fine so far, in my humble opinion.
The Commodity stocks turned lower too, but still look fine.
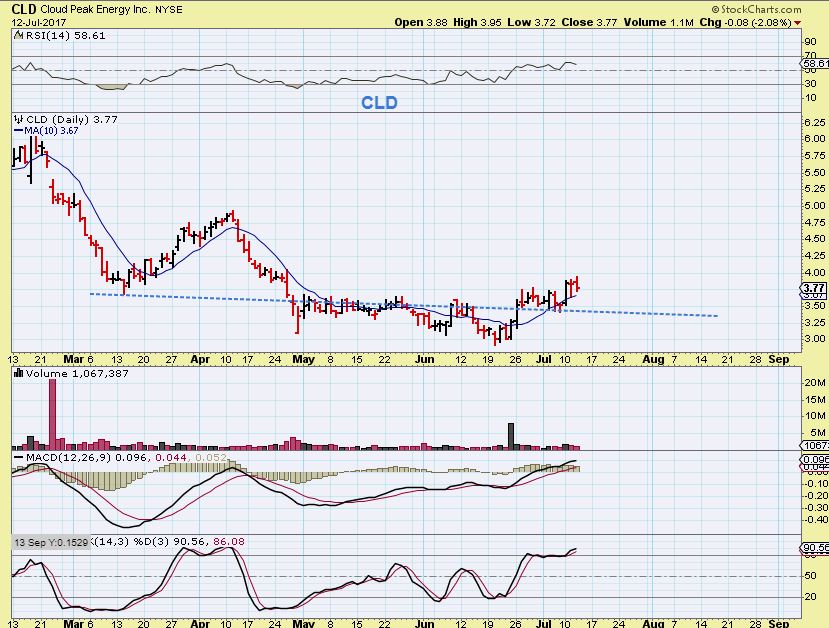
CLD – This turned lower too, but remains bullishly set up moving out of a small base / bottom.
CLF – Also turned lower & sold off into the end of the day. It also still looks fine, even if it drops further.
So what does this mean? These look like lows in the commodity stocks, with multi week bases in most of them. This gives me some ideas going forward that I will be watching for, and I will discuss this further in the bigger picture weekend report. For now, the trading has been good, and I’ll be watching NATGAS inventory today and see if the Precious Metals do anything important too. Enjoy your Thursday of Trading, and thanks for being here at Chartfreak!
.
~ALEX
.
NASDAQ BLOW OFF TOP POSSIBILITY? I have mentioned this quit a few times now over the months.
That said, I have been watching a few Tech charts for Months too. Entertaining the idea of a possible NASDAQ blow off top, I wanted to find something that may really excel, and Semiconductor stocks seem to be doing that. Some are already well along, others look ready to go soon.
In prior reports I have discussed CY, AMD, TSEM, MU to mention a few. There are other Tech stocks that I watch too and I have done a few ‘quick trades’ in a couple of them, TWTR & GRPN being 2 of them. I wanted to share 2 of them with you now ( I have mentioned a couple here already).
GRPN & PXLW
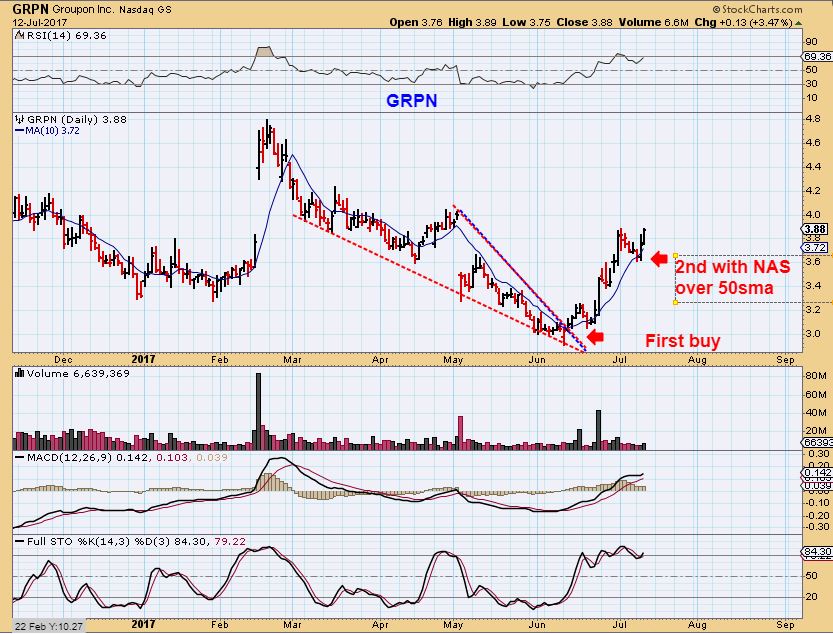
GRPN – This could be bought with a stop under the 10sma. In my personal day trading, I did a small trade on GRPN when it broke out from a wedge near $3.00. I then I watched it continue higher after selling a POP at $3.40 area. It has moved up quickly in a Month and the set up is acting correctly at this point. My conclusion now is that after months of selling, GRPN seems to be recovering. This used to be a $12 stock.
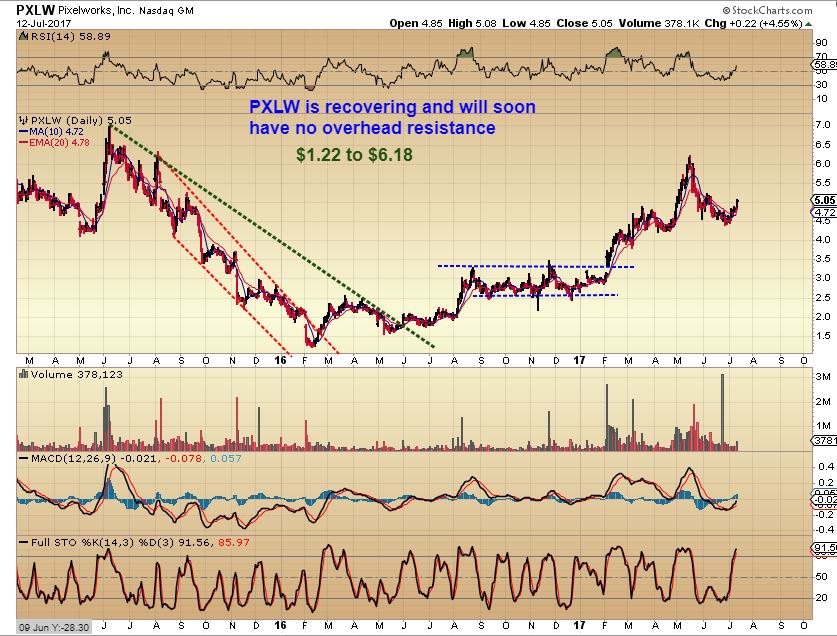
PXLW – This too is recovering after being sold off to $1.22 in 2016. It is in a bullish uptrend for longer term investors ( or traders) That wish to look into the fundamentals. ( Chris?).
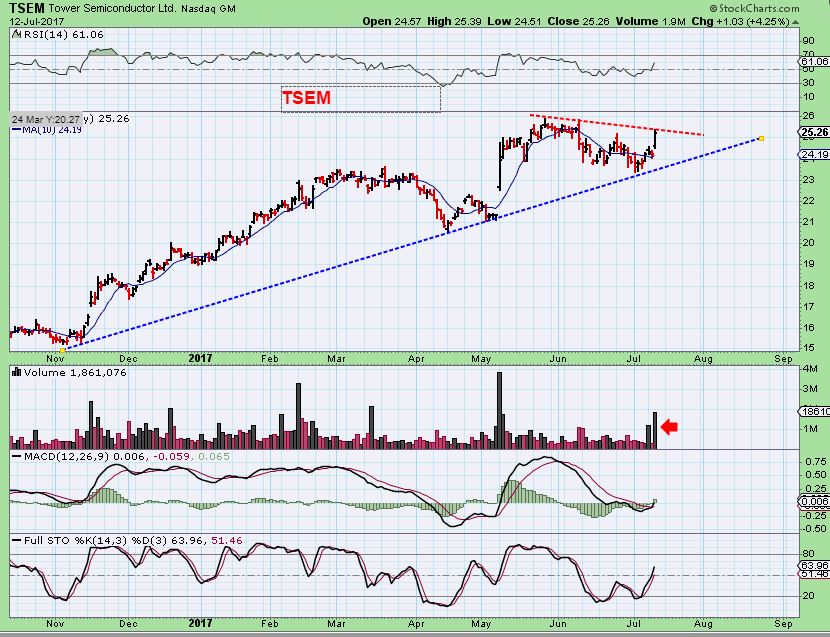
TSEM – This semi has been on fire and the set up is bullish again. Long term investors may like this set up too.


Gold does have a failed DC, so maybe an ICL is in place. Miners GDX and GDXJ do not have lower lows. Do we need a failed DC in miners to have an ICL?
MAY lows broke MArch lows & failed within that triangle.
Wouldn’t that indicate the ICL was in May? Yet it didn’t feel that way?
Triangles, I’ve mentioned them repeatedly in the reports
And now could oil be doing the same thing and setting the stage for a drawn out time of triangle / range trading? At least with oil stocks I see quite a few that have set higher lows. Not too many in the miner world though.
OIL up Energy stocks lower! Go figure
You have, I paid attention.
Yeah, they are tricky and I have seen them ‘change’ or hinder cycle analyses in the past.
https://uploads.disquscdn.com/images/a499ffd54b2f2f95710f88e7203538aba9b575fb7858233aa9d664b29f5738ca.gif
lol – I see you are making good use of those riding lessons you took as a kid
I was the instructor… it was MYYYYYY ranch… PLDDD ;o)
who could ever forget the 35 horse stalls that needed pitchin every single Saturday… uggh …
#StrongBack
I LOVE the minions!!!
I would be interested to see your thoughts on Silver, or should it just follow gold?
Yes, I’m really not seeing anything different from Silver, except for that flash crash
Thanks CF
Good morning Alex. Another fine report, your hard work is appreciated. When considering gold, you make it plain that a break of the 10 DSMA would have you adding or at least have you breathing easier. What POG would have you selling? Or, with the independence displayed in miners of late, perhaps a bottom price of GDX instead of POG? Im now 50% invested in the PM miners and of coarse a bit guarded. I find your guidence to be quite valuable but as always i’m the responsiable party should things run amuck. Thanks again in advance!
I am somewhat using the individual Miners to decide about selling, since they didnt really follow Gold / Silver recently. GPL for exaple, has a base, I’d sell a break on that.
Thanks Alex 🙂
Every now & then I see a pretty decent long term, and just figure I’d throw it out there for my ‘Chris’ style investors 🙂
Always appreciated. 🙂
NKE, WTW, and a few others – I don’t know if you prefer a certain sector or just a certain longer term chart with 22,44,66 or another method, but there are definitely some good long term charts that just pulled back with the recent correction &could be set to run again. ( TSEM looked kind of good in a semi sector for example).
wow – Opra just made another killing
Yup – WTW – And after her initial huge POP, I watched it pull back below the Gap and well below the moving averages, and crossed it off of my watchlist !!
Then it took off higher & never looked back.
While I’ve been ‘laid up’ I’ve been doing a LOT of work on a more rules based and systematic approach to everything from LT investments to shorter term trading. I should have done this a LONG time ago but better late than never. Using my ‘rules’, WTW gave a confirmed LT buy signal back in late March around $15.50. A real pity I didn’t spot it back then!! Lol As you say though plenty of good charts around I just get very torn and cautious with so many utterly crap looking fundamentals though, which no longer seem to matter in the age of QE and seemingly unlimited liquidity!! Although I am certain they will once again at some point!! Starting to wonder now if I’ll live long enough to see it!! 😉
Those last few sentences are what is in the back of my mind too. Like musical chairs, and when the music stops? Look out below possibly.
That’s what keeps haunting me especially as I am trying to invest my TOTAL life savings. So if I was to take a major hit with those I’m toast!! I started in the investment world in the very late 70’s and I’ve seen a few events since then when liquidity suddenly dries up and buyers disappear in the blink of an eye and it’s not pretty!! We are now in TOTALLY unprecedented territory where liquidity on an unprecedented scale and literally borrowed from the future, has been literally poured into the financial system for years and years by central banks. IMHO this has increasingly created TOTALLY false demand in markets, effectively on the back of borrowed money and completely corrupted any true pricing mechanisms. Many people seem to believe this can continue ‘ad infinitum’ without any serious consequences. I could not be more diametrically opposed to that belief. But I also wonder now, given the scale of this, whether there will actually be ANY hiding place when this storm finally hits in which case all the planning in the world won’t matter!! That is a real dilemma!!
MGXMF, Alex they annouced the approval of an additional 80K acers of lease ground. Should be viewed as a positive. We’ll watch. This company could really be a winner. ( or i might put the jinx on it, its been rough skating of late)
Yes, I saw that last week or on the weekend I think. Did I mention this one recently? I was debating mentioning it, and I wanted to, but the low volume at times had me pause on that idea.
Volume has been ok recently though, and sometimes when a company grows, the volume does too, along with investor interest.
disclaimer : I do not own it
I accidentally plugged in ‘MGMXF’
HHHMMMM 🙂
This partiular annoucment was released by the co.this mornings date was on it. Yes you gave it a mention along with a link as it was of intrest to you. I found the technology to be sound and took a starter even considering your warning at the time of low volume. Low volume was evident this AM. as it opened up +4% and pulled back to +1%.
Crickets here today……..
lol bill the bell just went off – morning to u sir
Alex — what do you think of UA? (Since you mentioned NKE)
UA used to be one of my bigger winners ( only had a medium size position in a separate account- buy & hold type investment.) Then it really started having troubles and sold off quite a bit.
At this stage, I just view it as basing out. It tried to break out in June, but fell back inside. Often the first attempt that fails can be followed by a 2nd attempt that succeeds, so I might add it to a Watch list.
I’m not sure why my charts only show a little over a year. It ran up, split, ran higher, split again, ran even higher and was up at $100 a few times. The charts that I see are wrong
It was a winner for me too several years ago. …. I am suprised how much it has dropped. Might snag a few cheap shares with a stop for a long-term wait and see very, very, very patient account
I was very surprised at the constant selling in that drop- I haven’t really looked, but it must be a ‘fundamentals’ thing. They had a product for every product line – maybe they saturated the markets and lost growth potential.
I’d have to do research though.
CF – RIG… I know its oil but im digging that chart
My reports have shown that Oil may be bottoming.
I like it too.
What it reminds me of is LTRB (only in the face that we might be too early)
Double bottom at 7.66 from Feb 2016…….
Ooh BWEN:)
That’s an interesting chart too- ‘bottoming’
I mentioned it yesterday and started a position …..
I saw that you mentioned it , but I was running around all afternoon & didnt have time to look it up. Glad you mentioned it again.
Very nice Crystal.
I should have pulled that up yesterday……..I did not 🙁
Your JO was a good call as well and I wish I hadn’t missed that one
You could wait for the a b c corrective wave for another entry ?
Any thoughts on MTZ CF?
Not too much –
the 2nd run higher here looks a tad weak
Looks like a possible bearish rising wedge at a glance
could be a double top.
Adding to Alex’s NASDAQ “blow off top” comments … my charts indicate that QQQ/TQQQ is ready to explode into a strong rally that may last a month or more. Check out a daily chart of $BPNDX. Bottomed a few days ago and a big jump in bullish stocks yesterday and today. The P&F chart of TQQQ shows a double top break out on July 10 with a bullish price target of $122. My avg cost is a little over $100 so that’s a better than 20% gain for me. I know some of you can do that in one or two days with some of Alex’s stock picks, but for a “tortoise” trader like me, slow and steady gains are better than quick 1-2 day trades. I’m very heavy in TQQQ and for me to get in and out in my retirement accounts is like turning a battleship around.
Nice Steve. I was also looking to get in with SMH on a pullback last week or early this week …. never got one….. so now I wait for a corrective wave of some sort, maybe a 38% Fib retrace. Nice Trade !
Gaps below on SMH & QQQ could fill at the 50sma and offer you a low risk entry.
My eyes are on it !!! 😉
Waiting for gaps to fill in TQQQ has been frustrating this year. I’m STILL waiting for that April 21-24 gap to fill so I can buy TQQQ around $88 🙂
I would take a gap fill and a touch of the 13 ema at 101 sh …….
I REALLY want to play this Wave 5……
I added the 13 SMA to my daily charts on Alex’s recommendation a while back, was that supposed to be the 13 EMA? I like to use the 5 EMA and 9 EMA for “early warning” signs of a change in price trend and the 10 SMA and 13 SMA for “support” once an uptrend is established.
No the 13 ema just “fits” better.
I use the 10 sma And the 5 day RSI for my early signs of “change”.
Try adding a 10 EMA to your 5 day RSI chart, I used a cross of the RSI line above the 10 EMA as one of my “buy” signals. I got that dip from a day trader friend of mine.
Cool…thanks
Hi Steve, I’m holding TQQQ so I hope you are correct. I’m also holding SOXL & TECL. They look just as good to me.
SALT, DSX, SB, SBLK, and more shippers looking pretty gd.
I forgot GNK
VSTM gettn happy feet… holy YUMA .. .
WKHS… nice…. 🙂
YUMA – Yeah, big pop.
I watch YUMA, YELP, YNDX ( Nice chart ,big pop today too) , the “y”s of tech stocks : )
Sidenote: FIT broke out above the 50sma today – 3rd time is a charm. I remember that tech stock selling off over & over- now might be a bottom.
whatya think of CNBX, TEUM, CNAB, CNBX….
I played TEUm the other day and today.. Quick scalps… I think its done for today but I still dig the overall chart
Which CNBX do you want me to look up…the first one you mentioned or the last one 🙂
hahahahah
succhhhhhhhhhhhhhhhhhhh a smarta$$
Actually CNBX look VERY interesting. Daily and 1 or 2 yr weekly
CNBC as in the tv show? ha ha ha
I fixed that in 1 second, but I know you get the email alert
no.. i saw it here…. pfff
also stalkin AVGR for a possible pop….
chewing up a lot of mva today…. see if it holds
FIT -And it just kept climbing 😉
I like WKHS very nice…thanks Ms Maria. You in ?
just at close yesterday… from CF mention a while ago….
I sold mine for a good profit , after BILL called it a radio station – lol
Someone mentioned RTK and that POP to me last week.
6 month chart is a great looking base….
It pulled back to the 50 sma and is Popping again today- up 20%
I want to take credit and RTTR I think
I was watching and somehow missed the buy at the 50 sma…..
OVAS is another one where the 50 is holding ….. watching
CF – I took GRPN at the the open – I likey
GRPN IPOed around 30 in late 2011 now it is a 3 dollar stock……
HTZ
JO …….
Breaking out or top of wave 1…….
Hi Alex,
I tend to think that charts of EUR/USD (Euro/USDollar Spot) look like it has a top (and I’ve been positioned that way – altho I got in a bit early, as usual).
If you have time to take a peek and give an opinion, I’d love to hear it – If you don’t, I understand – you have a lot going on!
Thanks,
Cal
It looks like it wants to drop, but how far? I can’t tell at this point.
Thanks, Alex
dang.. look at GDX …- im on 8 min …. is that breakn down …. orrrrr are they pulling down that right shoulder (inverse H&S) wayyyy back like a Slingshot …
Mama – Im actually liking the 5 and 15 on TEUM rn for another quickie
im watchn… i lovvvve quickies..
but have my hands full now w/ too many at the moment….
tx
.. cute little hammer building on the hrly too… 😉
Yea, on a 30 minute chart looks like an inverse head and shoulders, I like that slingshot analogy!
https://uploads.disquscdn.com/images/e810cd667db52be76bf447c3f53ff0241eab287a4c42501f6459bbbb69b8daaf.gif
Good eye, actually there are lots of those sling shots in the pm space all over !
Im liking TK as well
stalkn YUMA too… see what happens here on the pbk…STB or another nice burst…?
BONT little C&H on the intra rn…
whoooooooooooooa
…looks like retail shorts gettn scorched today…
yeeeaup
Is that a double bottom that just formed for the U$D – June 30 and now July 13?? is it lulling us to sleep??
Looks like you and I have the same question from different viewpoints!
Mine below is on the opposite side of a strong dollar (a weak Euro)
Right – if you look closely at the gold to USD relationship over the past few weeks, it looks to me like they are trading inverse to each other, and now today the dollar is perking up and GLD has been rejected at the trendline.
CEI – too small for most of us, but keeps chuggin
yuma
… and when i mention – it means im watching it … not taking it Necessarily .. FYI
I just stepped out for food… and she makes a move. Smh
.. there’s no eating .. or toileting in baseball.. err . .i mean trading…
Some people think QQQ and NASDAQ are basically the same, but the 100 stock QQQ consistently outperforms the broader NASDAQ index.
Here is a chart showing the QQQ:NASDAQ performance ratio:
http://stockcharts.com/h-sc/ui?s=QQQ%3A%24COMPQ&p=W&yr=3&mn=0&dy=0&id=p46023390591&a=402418530
What in the world happened? 🙂
I had a stop under 90 cents for RGSE – just because I’ve been away in the afternoons.
My chart shows a slam down to 82 cents, and back. Boom. I got stopped out and it is back at 90 cents.
oh well, not that big of a position anyway…
“Some will win, some will lose…some were born to sing the blues.”
I think the computers are set to grab as much wealth as they can.
It’s hard to trade against advanced software systems.
up and down and down and up “churning” a lot of $ being taken from retail.
Have to be very, very careful. That’s why we subscribe here to share info!!
Well there goes FIT
Yup – I just posted about that too – mentioned it this morning.
I actually like that chart.
And while we are talking about possible ‘come backs’ from big sell offs
FIT, GRPN, & GPRO,
CF – thoughts on TK?
Looks good – holding that 50sma. Quite a few shippers looking good
GV has been good to me in the past, And I like the current set up too.
Refresh for 2 charts-
Tempted to take a position here, not quite sure yet though.
I do like the set up
https://uploads.disquscdn.com/images/f93c0460072a980267fc6f2a278fc4300577ef5d4ba4c889cd0e81b7fcc0d66c.jpg
https://uploads.disquscdn.com/images/61bff3dc984b31ea65e30069168d881bab79d1cd5845b8a515963778e1d9b9dd.jpg
Platinum (PPLT)…….
recovery in commodities
X, AKS, CLF, CLD all reversed to green
CSTM – break out follow through mentioned the other day in the report
FCX, GV, CENX, ZEUS, etc etc
Edit: CLD just returned to red
SHLO keeps getting hit….not sure why?
They did the dreaded ‘offering’.
Well there ya go….thanks
Trumpy was on tv talkin about steel
Is that what it was? I missed it but everything moved the same amount all at once, had to be news.
Anybody think that today’s price action in SMH, QQQ is leaving a reversal candle? Just wondering if this advance in price is going to hold up—
TQQQ is currently a “buy” on my 15 min chart so it will probably rally into the close, very bullish to me for a longer term hold, not trying to day trade it. On the other hand, I noticed a “topping” candle on the daily chart of AG yesterday so I sold all my AG for a small profit. PM’s not making it easy right now.
Did not rally into the close, but still looks good longer term. A pullback to the 5 EMA or 9 EMA on a daily chart would be fine.
I thought I saw a doji signal on the US$ yesterday . . . . signal to go down more.
hmm labu… pecos…
Stole my comment! I started a small position yesterday. Missed my add this morning (too busy sleeping and then going to work!).
Bill, whatchu think?
wow… nice STLD too…
Alex- does the market making new highs on lower relative strength any concern to you or might it just be low summer trade volume effect?
Energy stocks continue to not follow crude. What gives??
FRTA?
Quick little scan came back with some lookers
TRVN, JCP, UNT (I really like the chart on this one the divergence is great), SPN is great as well, ORN, ICD, and HLX…