This is a long report. I wanted to discuss Gold & them Miners in detail in this report. I have mentioned that I am seeing various interesting things in that sector over the past few weeks, so let’s just briefly review the general markets and go right into Precious Metals.
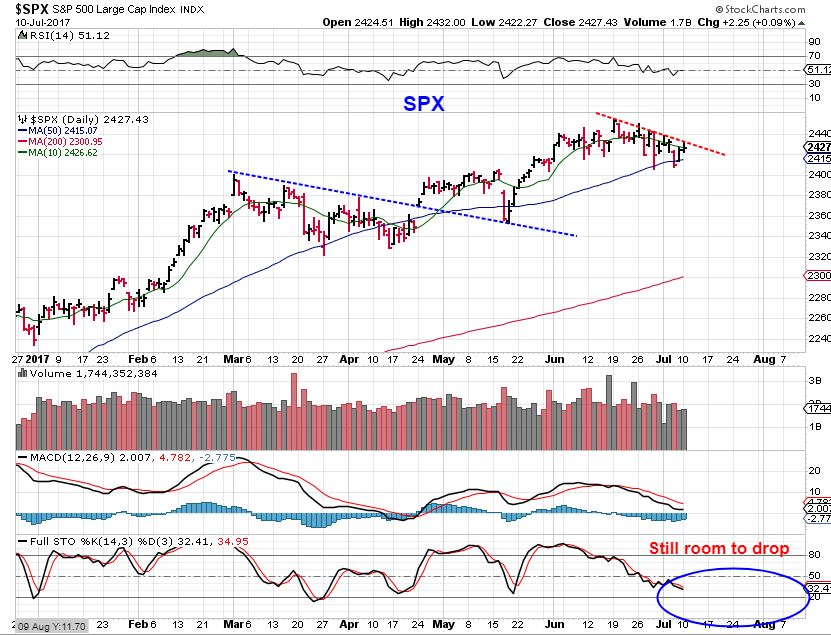
SPX – The actual lows were 6 days ago, and we do not even have a swing low in place yet. I would say that a close above this trendline & the 10sma should signal a dcl occurred, and then one could go long with a stop below that 50sma.
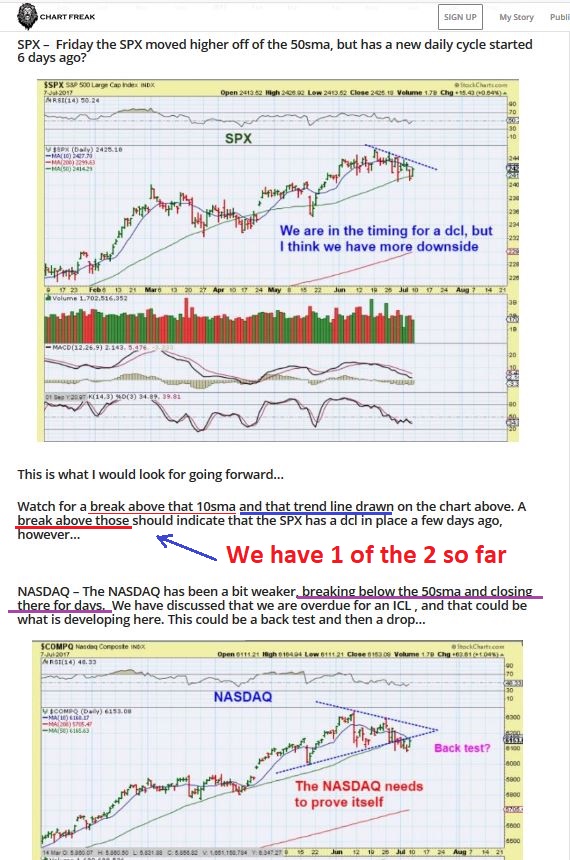
You can click on this to make it larger, it is simply a copy of what I wrote in yesterdays report. Under the chart of the SPX I stated that we wanted a close above both the 10sma and the trend line. The nasdaq simply looked like a back test at that point, and should close above the 50sm again to add bullishness.
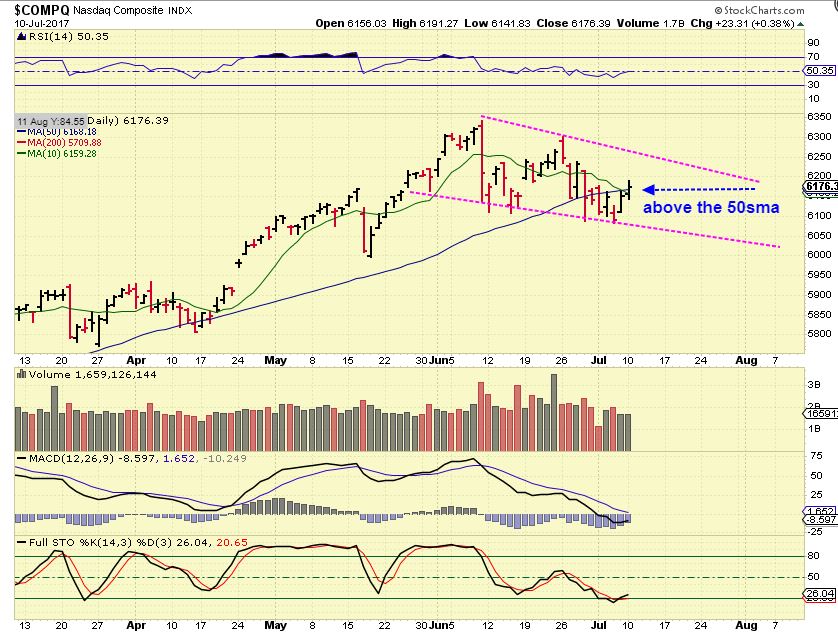
NASDAQ – The NASDAQ did (just barely) close above that 50sma & the 10sma and this is a good start. I cannot believe that we are still not dropping into a deeper ICL. If this keeps up, it has me leaning even more toward a runaway blow off top. For now, The NASDAQ may still lose the 50sma and roll over, so one must still keep an eye on a long position and be cautious until it gets moving a it higher. If it does continue higher, you can expect the buyers to step back in and we can all relax a bit more.
The TECH SECTOR has experienced some consistent selling though, but if you look at AMZN, FB, NVDA, etc. I think you will be impressed. Take a look when you get a chance.
Jumping right to Precious Metals.
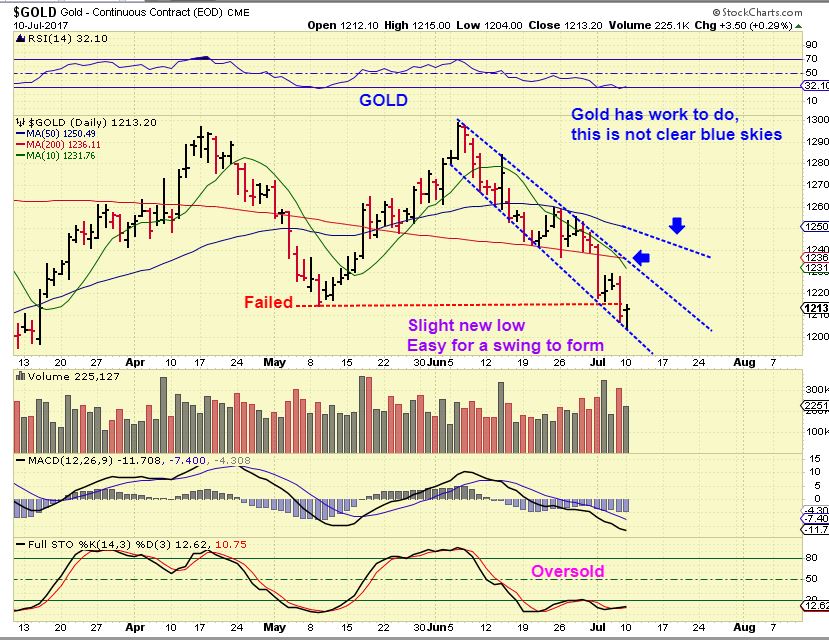
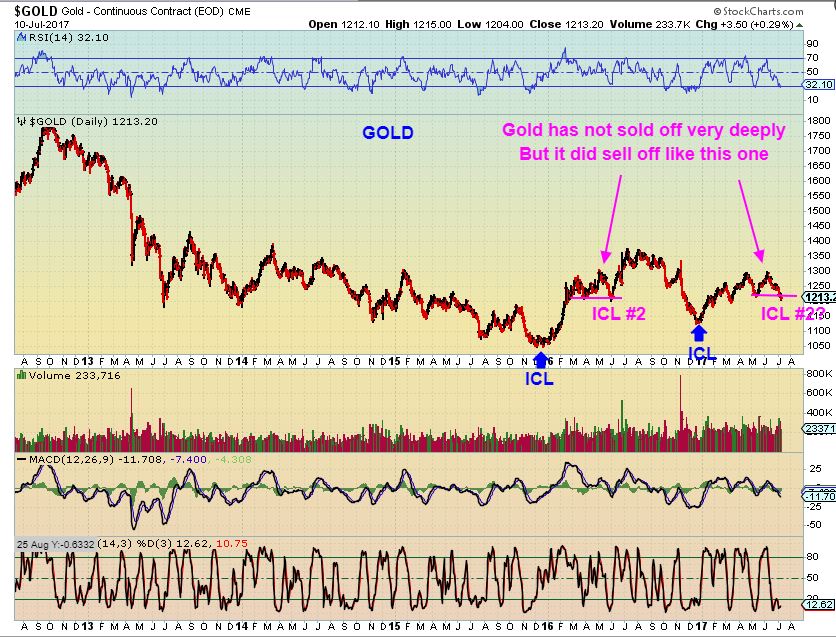
GOLD – I was looking at Gold this weekend and seeing 2 possibilities in the cycle count. Did we start a new Daily cycle at day 30 and we were on day 11? Or was this a stretched daily cycle and we would be on day 41? Gold lost the 200sma and it was looking like it could drop further, into our ICL. The selling in Gold for June has been fairly steady, $1300 to $1200ish.
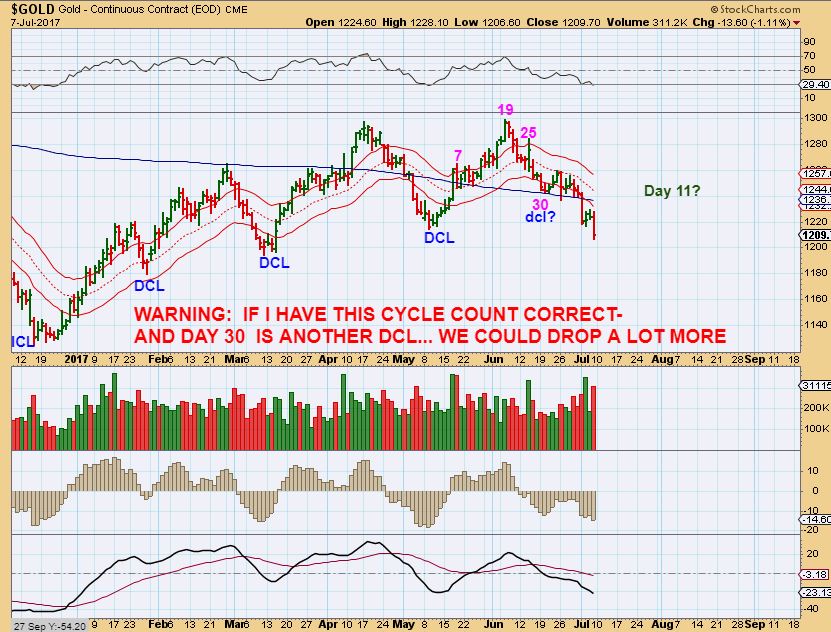
GOLD dropped to a lower low , and then put in a reversal on Monday. This EASES the parameters for a swing low if this was a stretched daily cycle, and I also have mentioned that the Miners are just not acting normal. I am going to go into that deeper today, to prepare us for various possibilities.
As mentioned in the weekend report, Gold has now been selling off for weeks, and it even sold off deeper than the May lows. I would normally still expect even deeper selling for an ICL, but could this be enough? I know that many were telling me that Gold was acting too strong and would not break the May lows, but we do now already have a deeper low than many expected, and bullish sentiment is fading.
** I want to address the idea that this could be an ICL sell off this by looking at the Miners.
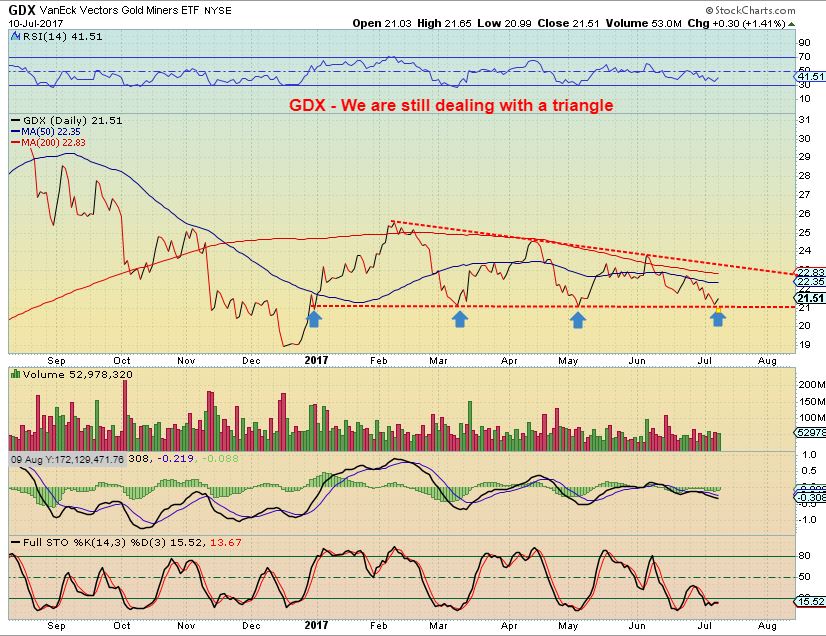
GDX – We are still dealing with a triangle formation, and I have repeatedly stated that in my experience, Triangles throw off cycle counts and expectations. Instead of a sharp steep slam, you get a long, slow, boring, exhausting, lack luster sideways move. This wears people out too. A quick slam CAN still happen, sort of a false break down & recovery, but let’s discuss Miners further…
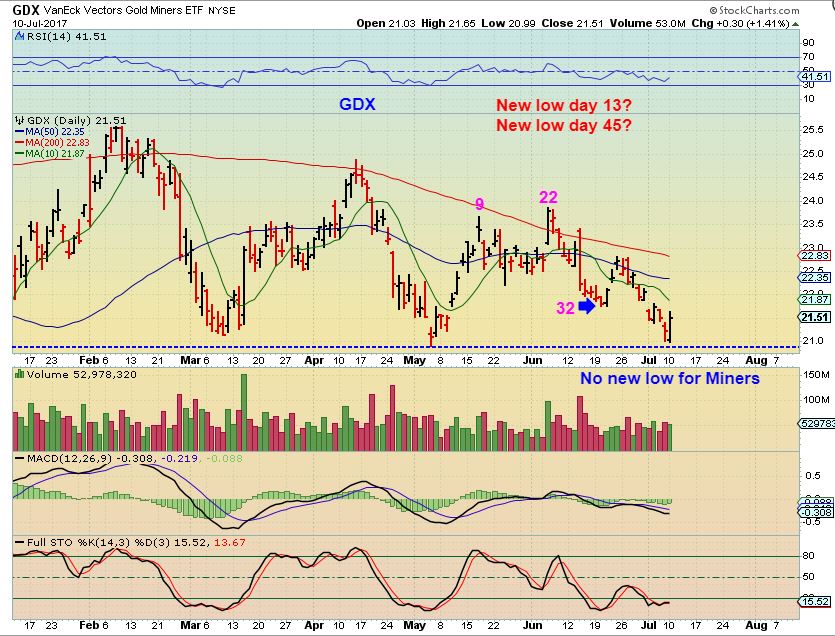
GDX – GDX had a strong reversal Monday. I’m not worried whether this is day 13 or day 45, because if a swing forms, a 32 day daily cycle works, and a shorter 13 day can have occurred too. I have seen 13 day daily cycles in the Gold Bull of the past. (Sidenote: GDX did not break the May lows ).
Here is the ongoing perplexing part
As mentioned in prior reports and in the weekend report, Some Miners are looking sluggish and still at the lows, maybe even below the May & December lows! Other Miners are looking Bullish. That presents a VERY MIXED PICTURE. What does it mean? What could it mean? We should look at a few examples.
GG – A big component of GDX is actually below the May lows and at the Dec ICL level, and made new 7 month low on Monday! ABX & NEM are at May lows. So note: GG is at Dec ICL price levels, 7 month lows.

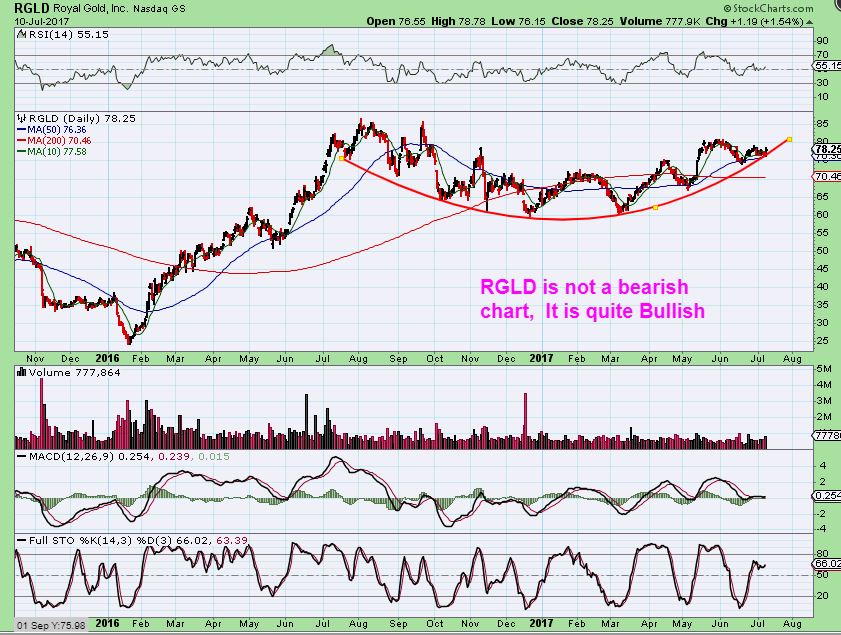
RGLD – Royal Gold is remaining near the highs, even with GOLD selling off for the last 5 weeks.
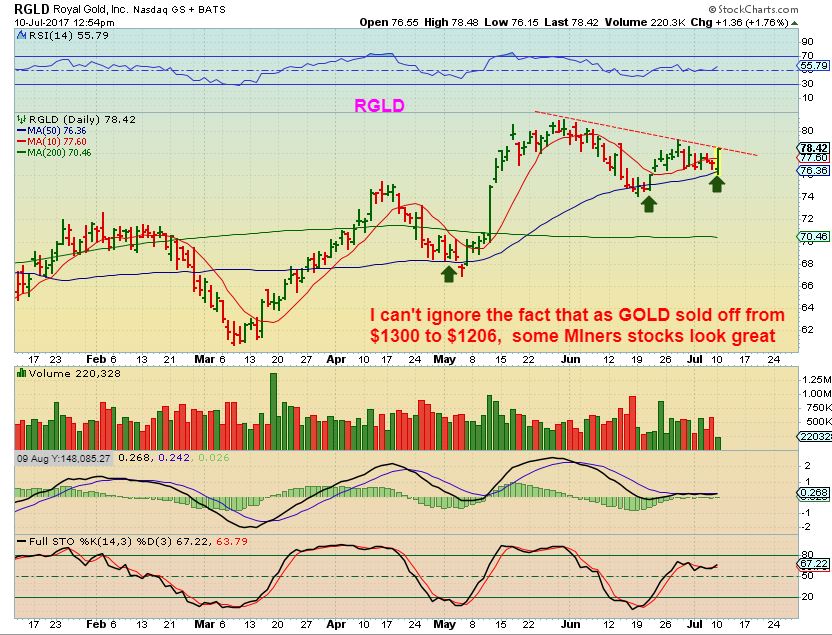
RGLD – Again, Gold just sold off in all of June from $1300 to $1200, and RGLD is holding up. This is a bullish chart with Gold breaking May lows.
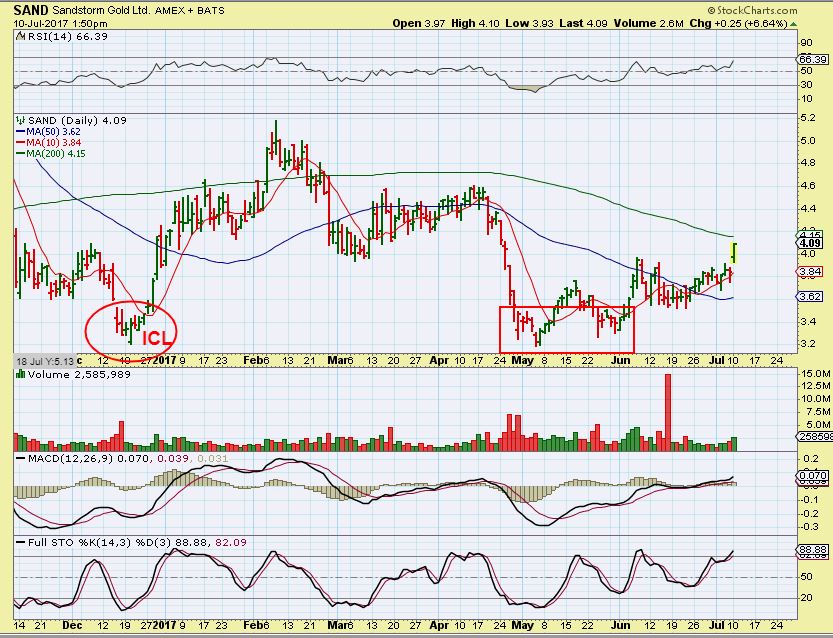
SAND– Yes, I know RGLD is a royalty company, but so is SAND. SAND crashed down to the Dec ICL level in May & June, but notice that as GOLD dropped from $1300 to $1200 in June, SAND has made higher lows. HMMMM, THAT is interesting, isn’t it? It makes me ask, what am I seeing here?
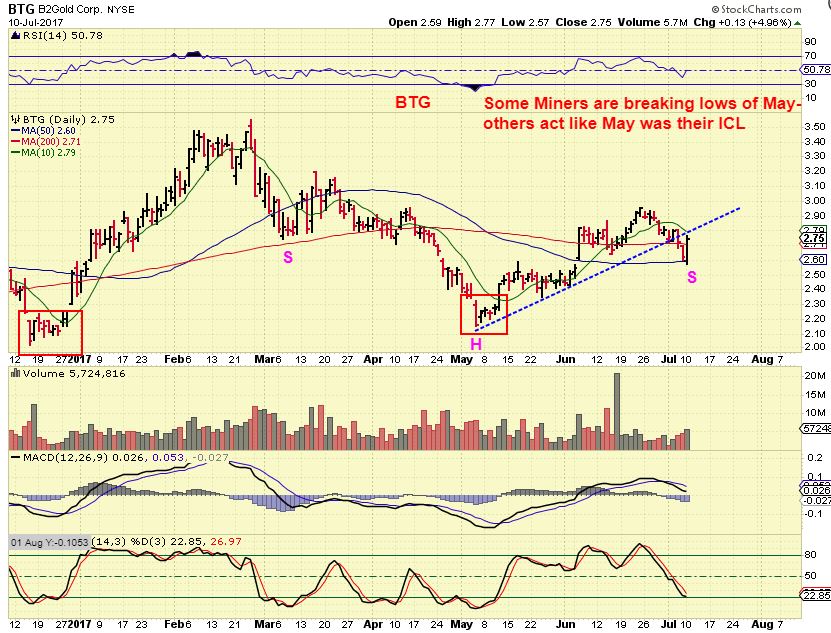
BTG – Again, we now have Gold selling off, breaking below the May lows, into what is supposed to be an ICL type sell off, and BTG looks like it put in an ICL in May, doesn’t it? BTG started to sell down over the last 2 weeks, but Monday it reversed strongly. It makes me ask, what am I seeing here? A break back above that trend line is bullish. Gold sold off throughout June and this chart looks Bullish. Inverse H&S?
EXK – Ok, back to the weakness. EXK went below May lows and December lows, but this pattern looks bullish and gives the appearance that selling is drying up ( Wedge pattern). Look at that MACD. Silver crashed in June & July, EXK held the lows.
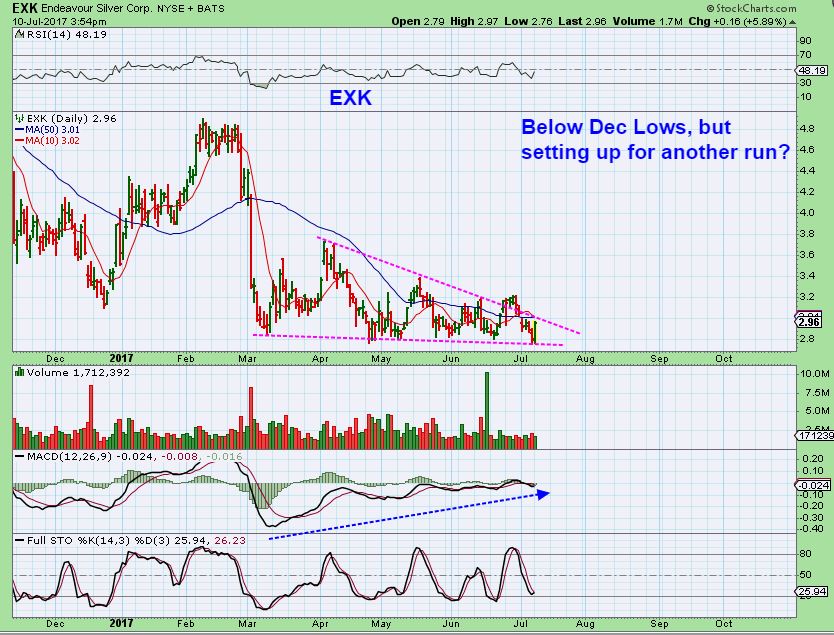
SO I zoomed back and EXK actually has only pulled back 61.8% of the total run higher. If EXK runs back to the 2016 highs, that is a 100% move.

DID I MISS IT?? A few Miners moved higher by 4-6% and I get that same old question,
“Did we just miss the move?” NO! “The Move” that we are looking forward to will run for weeks & months, it is not a 1 day event. Take look at MUX for example…
MUX had a great POP on Monday, but haven’t we seen these a lot lately? Yes, and even so, Mux was still at 7 month lows Monday morning. I will say this however…
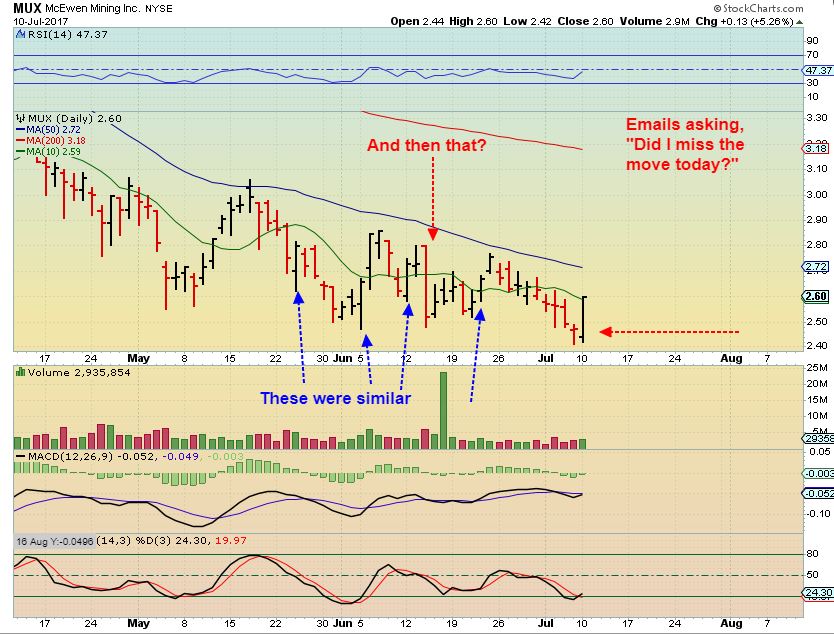
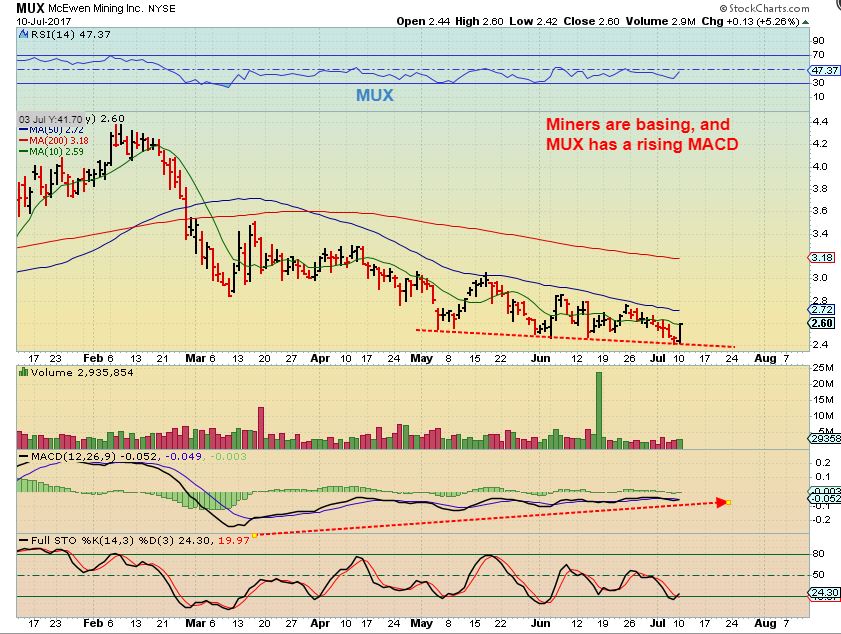
MUX – This chart is basing out & boring people to death, but it looks like it will run very nicely when it finally does break higher. Does this chart look like we missed the move 🙂 This stock could run up 100% when the real move starts.
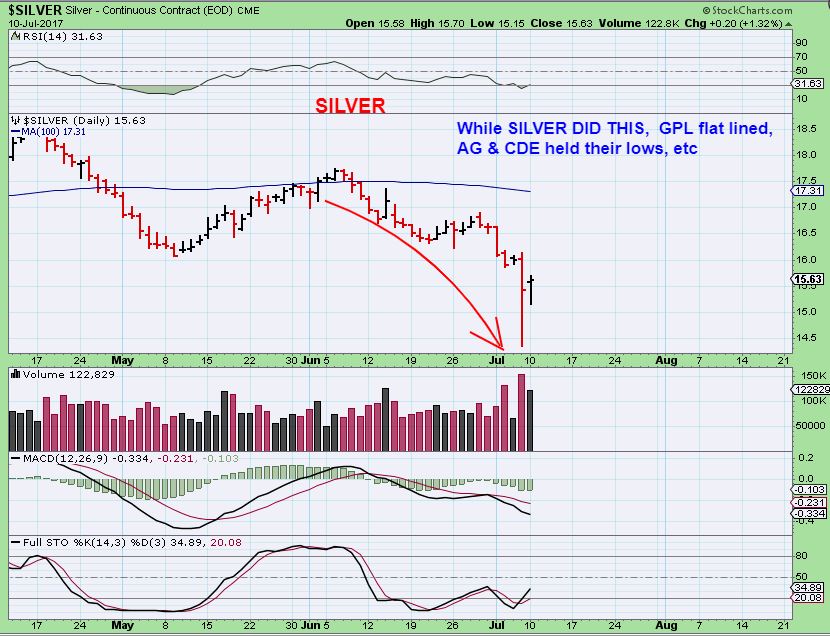
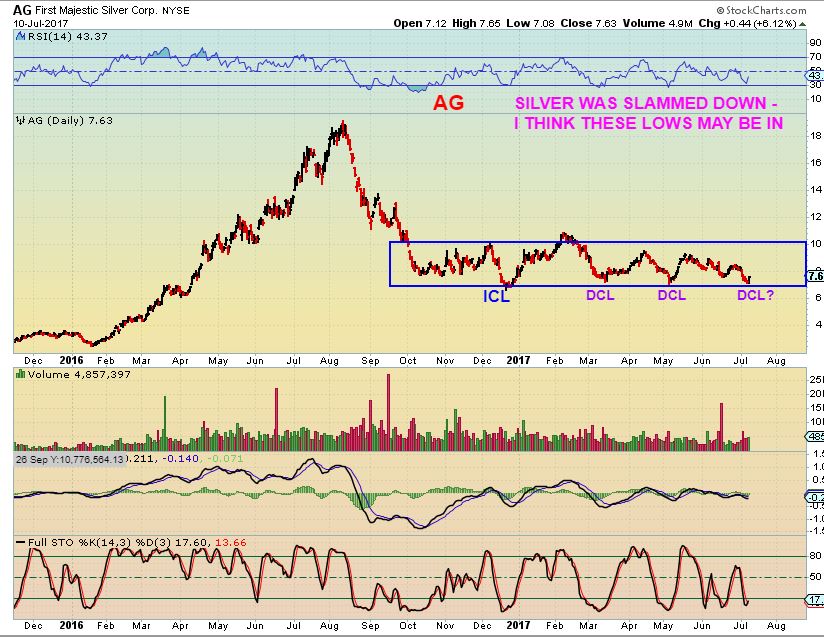
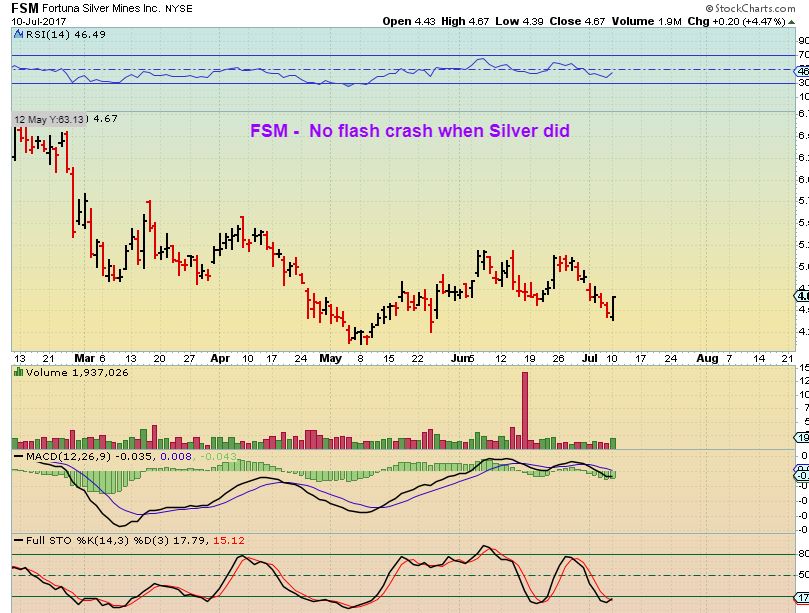
Let me show you what SILVER did over the past Month. I do worry about the Silver spike low getting ‘tested’ in the future, they often do, but Miners seem to be putting their lows in already. EXK did not follow this crash, and neither did AG, CDE, FSM, GPL etc.
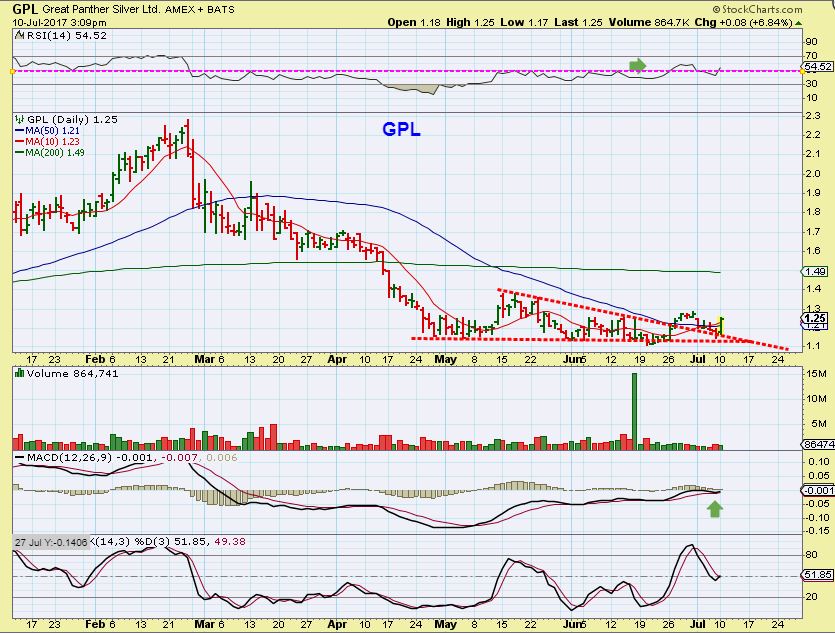
GPL – What did GPL do while SILVER crashed down? GPL has formed a base and is really still inside of that base, but we also see a wedge that it broke out of and back tested. What am I seeing here? I am looking at this like that baby chick in the theme pic is looking at that other chick. What? I am seeing a silver stock that has held these lows solidly since early May, while Silver was slammed down & flash crashed? So I actually bought this on Monday. My stop will be under recent lows.
AG – What am I seeing here? Sure, each bounce has been short lived, but the same lows seem to hold each time. Please read the chart. This looks like a low risk buy, since your stop is at the recent lows.
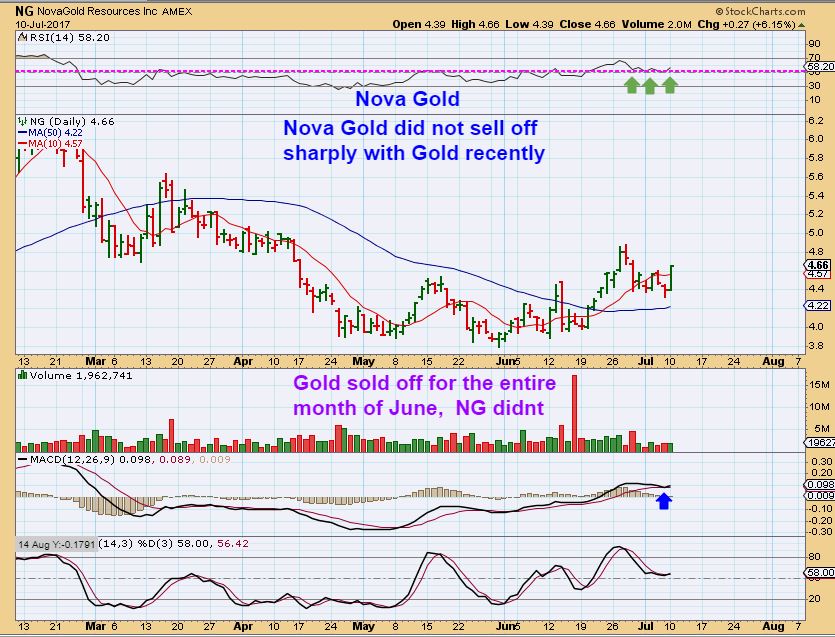
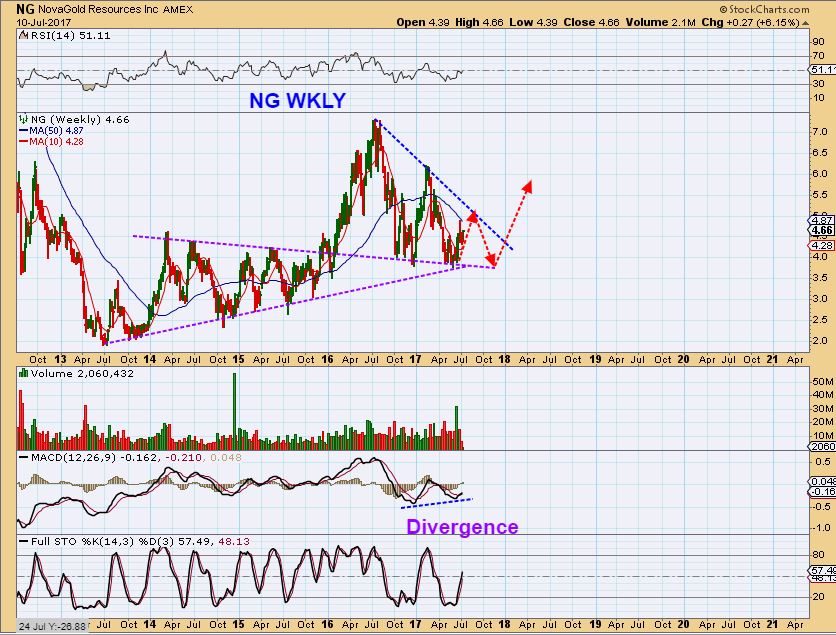
NG – Nova Gold was 6% higher today. It has made a higher low with Gold selling off last week. Nova Gold actually went higher in June while Gold was selling off. What am I seeing here? The selling in the Precious Metals is no longer affecting some of these Miners.
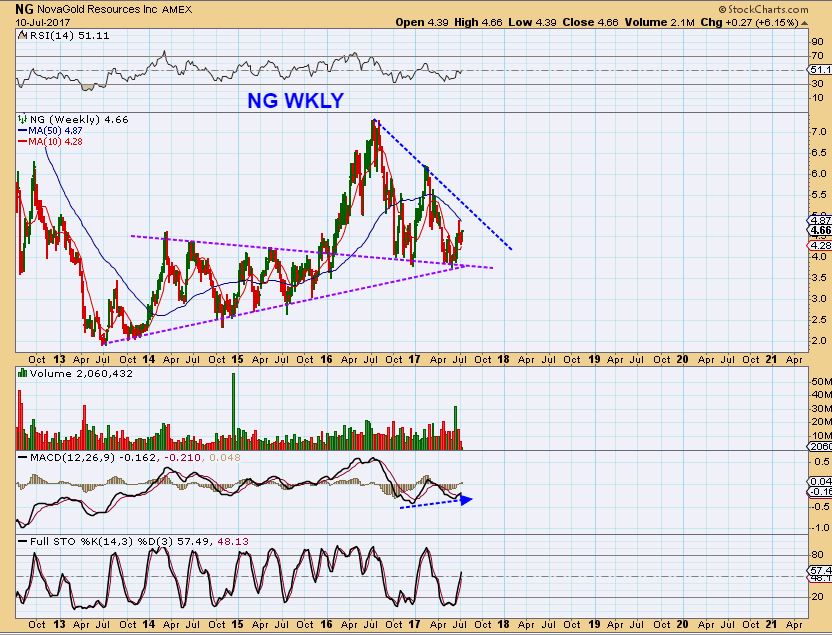
NG WEEKLY – This is is a giant wedge or triangle too, with divergence in the MACD.
NG WEEKLY – This could break out if GOLD & SILVER are putting in an ICL now.
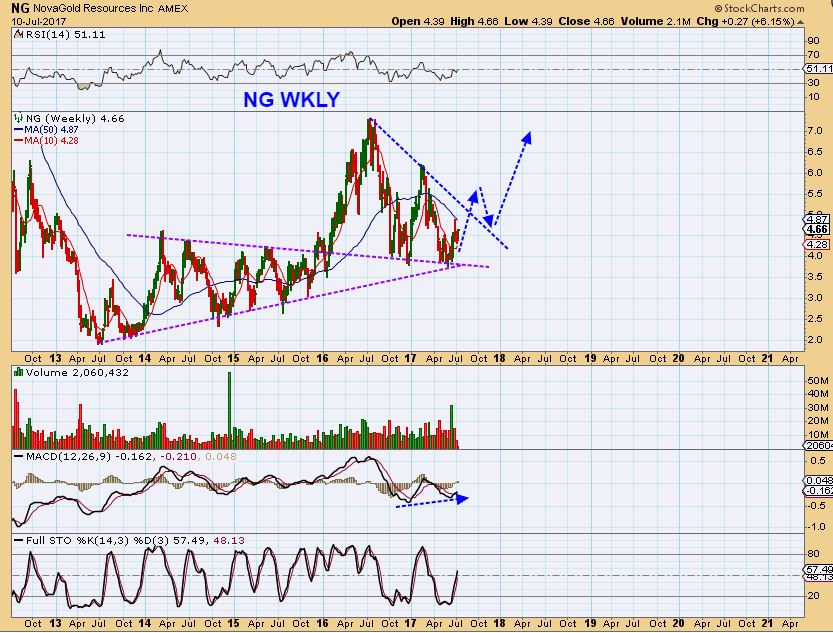
NG WEEKLY – This could bounce and drop to the same low one more time if the ICL is not in place.
SAND – SO Sand was very weak, and it dropped to Dec lows and below in May. NOW – when Gold & Silver are selling off, it decides to put in higher lows? I feel like that little chicken in the theme pic looking at the other one. What am I seeing here? Miners usually sell off twice as fast as Gold & Silver, don’t they? They do, but not when triangles are involved. SAND is acting like it has put in its lows.
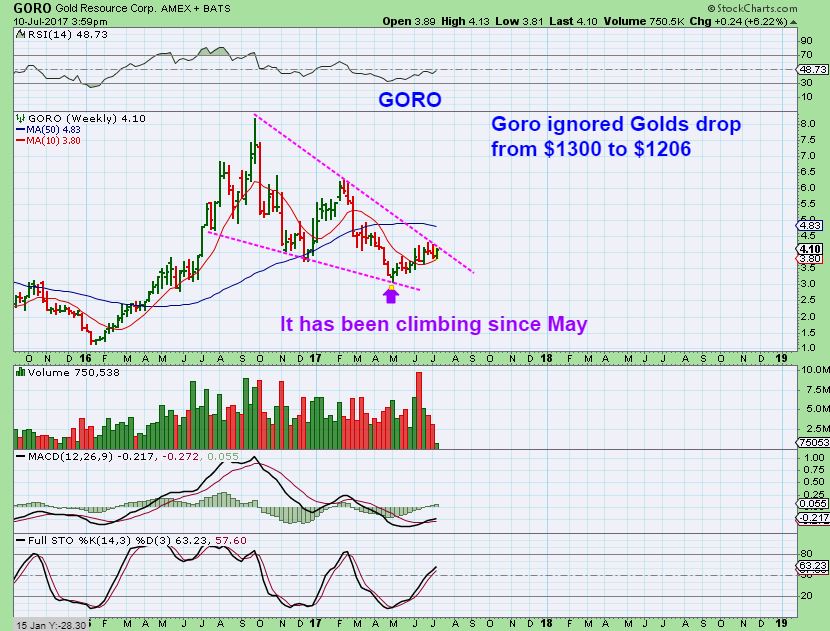
GORO – I traded Goro & GSV out of the May lows and sold it expecting it to follow Gold as it dropped into an ICL. GORO did not Dropped while Gold sold off in June , did it? Read the chart.
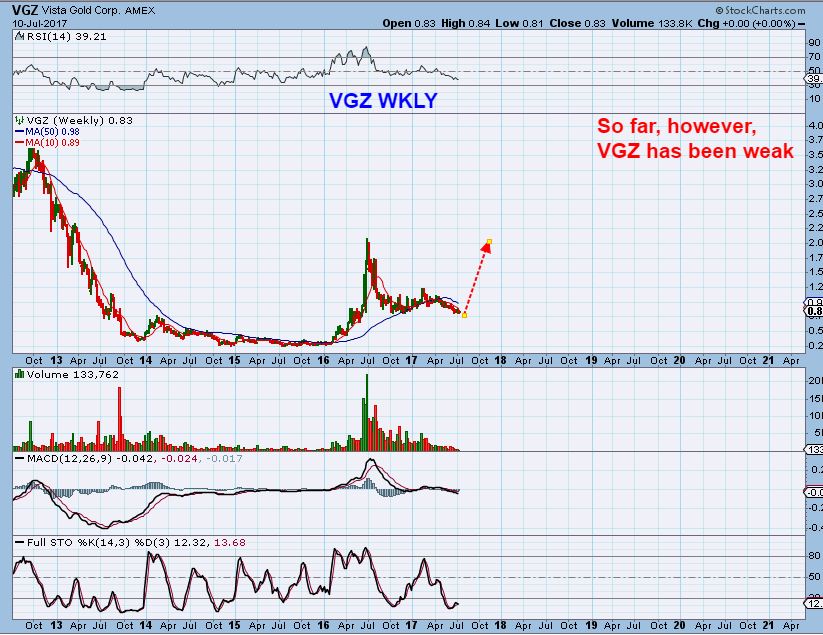
VGZ WEEKLY – VGX ran from 20 cents to $2.00 and has consolidated those gains for months now. Now oversold and with other Miners moving higher, this might be a double bottom. It needs more time, but it is on my watch list.
SO in summary, what does this mean? Well, I have covered a good number of Miners here, but obviously I could not show you them all. Some Miners look like they bottomed in May, and have been making higher lows while GOLD & SILVER sold off over the past 5 weeks and Silver plunged as shown below.
We have seen Gold & Silver selling off to their recent lows. I would have expected Gold to sell of further ( and it may) , but it is similar to the ICL last May 2016. Is an ICL here yet? It is too early to say for sure, but Miners are not getting trashed.
SIlver has big volume and almost returned to the 2015 ICL lows in that flash crash. IT is also in a large triangle. Can you see 2 other flash crashes on this chart?
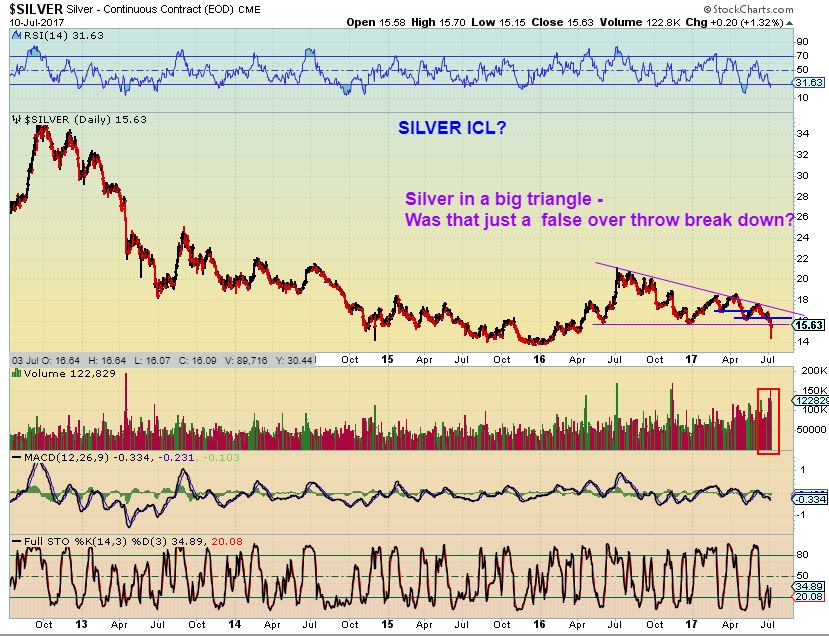
So we have seen some Miners that appear to have bottomed in May, now making higher lows. Look again at the charts of BTG, NG, GORO, SAND, etc. , they are NOT selling off with Gold last couple of weeks. Then we did see some Miners still at their lows like GG, ABX, NEM, and other Juniors forming bases like GPL, EXK, AG, CDE, etc. They also did NOT sell off with Gold & Silver last week. Since that is what I am seeing here, I would have to say that it may not hurt to hold a Miner or Two, if they do appear to have put in their lows. I do remain cautious, since this did not look as much like an ICL sell off in Gold as many in the past, but we could form a low here, and I do see some Miners making higher lows since May. Like I said in the weekend report, I am NOT shorting Precious Metals or Miners, and this is why. I am actually looking at some of these Miners and seeing them resisting the selling of the past Month in Gold & Silver, setting up as Long candidates. Along with some Miners perking up…
AND OTHER ‘STUFF’
I mentioned STEEL & ALUMINUM Looking Bullish a few weeks ago, and the commodity stocks looked to be in a “bottoming Process”. Those lows are still in place and Monday I pointed out in the comments / chat section by 10 a.m. that I thought I was seeing something lining up in CLD & CLF and a few others. I also pointed another area out, so let’s discuss these.
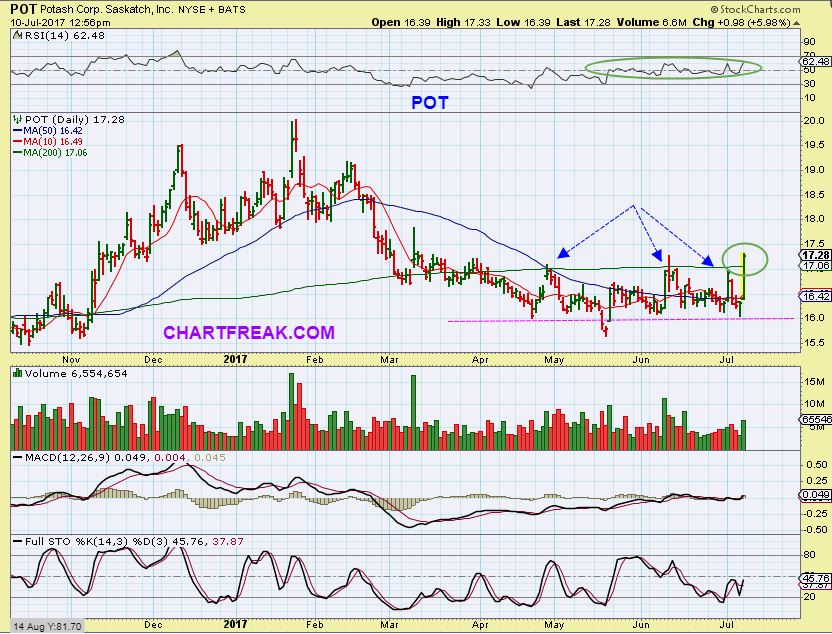
POT, AGU, MOS are fertilizer potash stocks and they have been bottoming. Since they have formed multi week bases, I think that these are low risk buys with a stop under recent lows. They started breaking out yesterday,
-this was POT after Noon time on Monday and it did close above that 200sma.
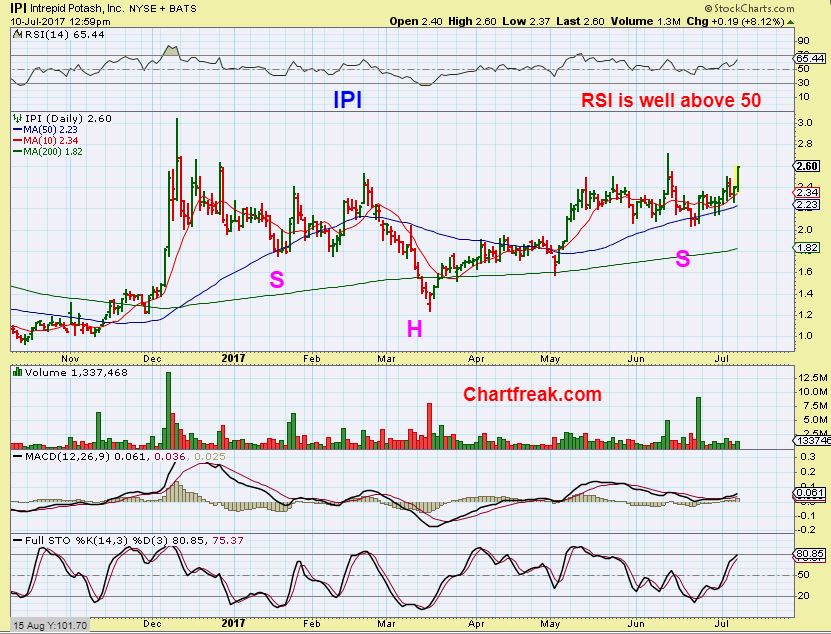
SO I immediately pointed out IPI, which I had mentioned in a recent report as one that I bought recently ( Thanks Crystal & Chuck for reminding me of this one in the past). This was IPI after noon yesterday and it looks to be breaking out too, so I added to my current position. After this consolidation, it can move higher.
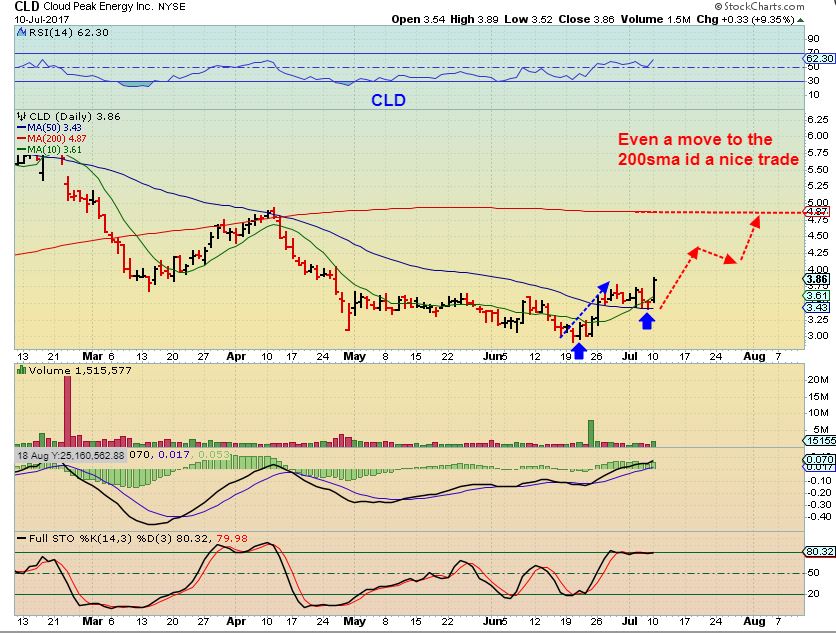
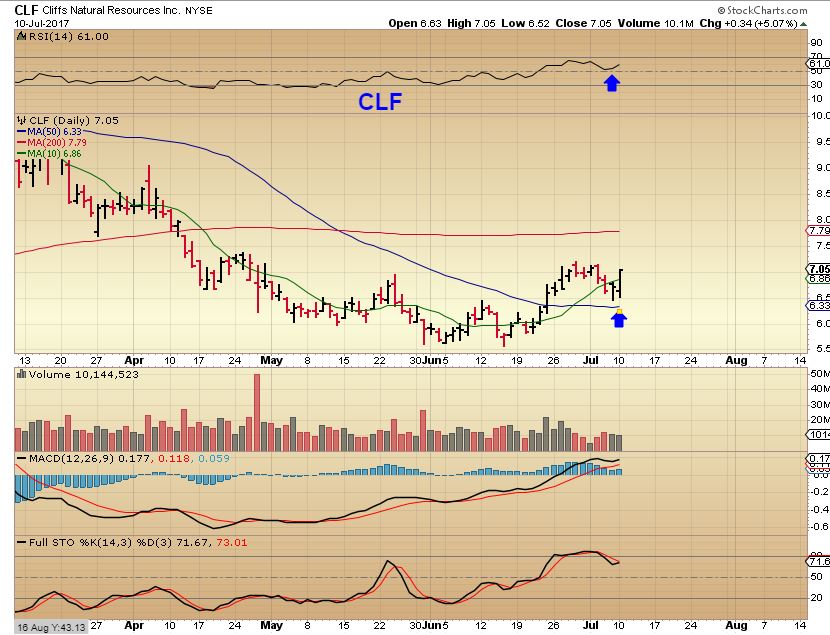
In the comments section at 10 a.m. I saw CLD up 3+%, but it had strength coming in on the 5 & 15 minute charts and other internal factors made it bullish, so I mentioned that CLD & CLF looked good. The daily has them going sideways above their 50sma, forming higher lows. This was a buy with a stop below the 50sma. It closed up over 9%, but it can work its way higher with this bullish set up.
CLF – And CLF did close up 5% also, and could keep going. It could be bought here & may break out & run higher , but it also MIGHT stall at the 200sma and bounce around between the 50 & 200 for a bit building steam to break through. It is worth a try, in my opinion in case it breaks right through that 200sma.
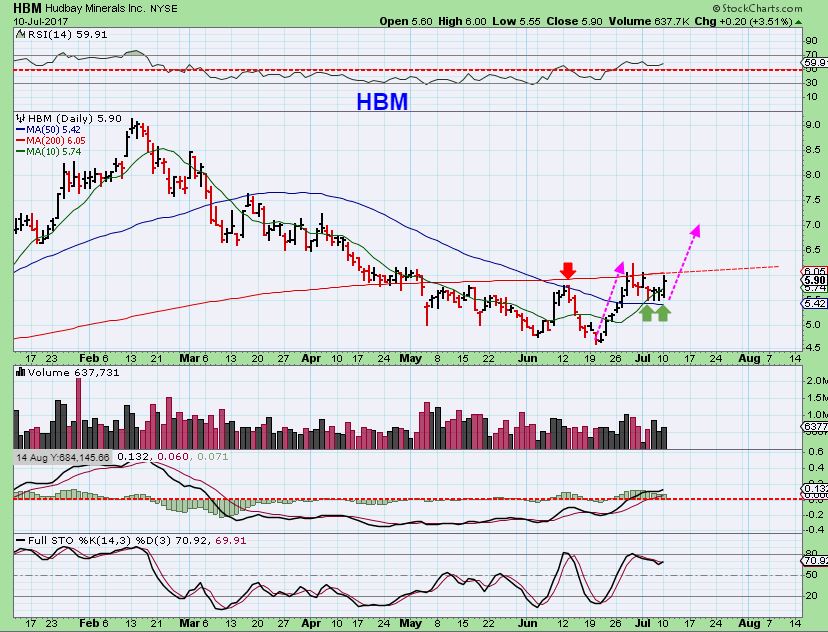
HBM– You can see that HBM has the similar struggle as CLF here, but it is holding above that 50sma too. The sector seems to have put in their lows, so this might be a decent buy area, with a stop under the 50sma. OR wait for a break out above the 200sma. HBM is actually a pretty bullish set up in the longer time frame if this sector has bottomed ( This is mostly copper).
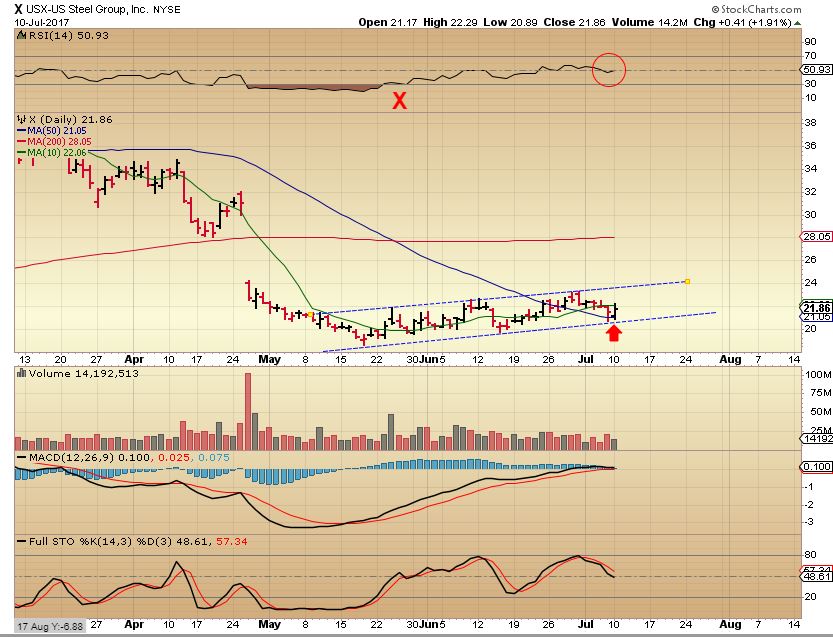
X – I have been pointing out X, STLD, SCHN, AKS, etc for a while. X has a rather slow bottoming process that has been a bit frustrating if you bought and held when I first mentioned it, but it got through the 50sma and back tested it so far..
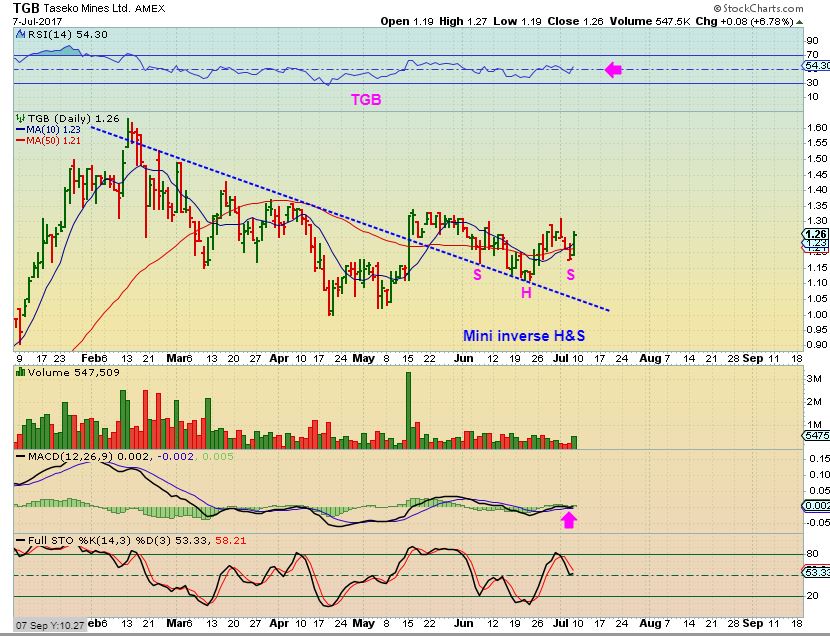
TGB – I own this and have mentioned the inverse h&S patterns lately. With most of the commodities higher yesterday, it dropped 6 cents. That alone is Not a big deal, but obviously I’d like to see it run from here, rather than threaten to drop & test that blue trend line again. I’m hoping that it just moves higher from here.
UEC – I also own UEC from a while ago when I discussed URA shaping up & possibly bottoming. This one does not break out & run day after day yet. It pops and drops and pops and drops and bores the investors 🙂 See also URG, DNN, UUUU, URRE.
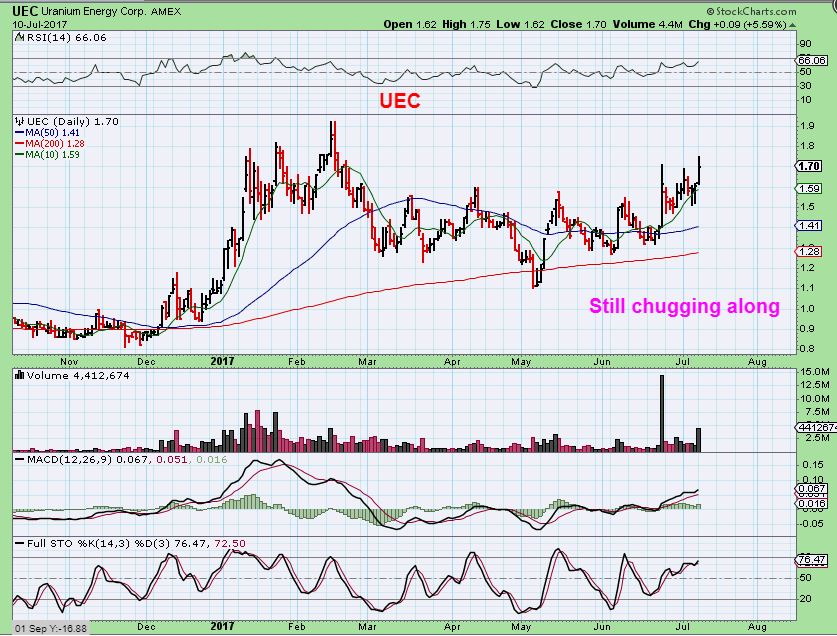
UEC WEEKLY

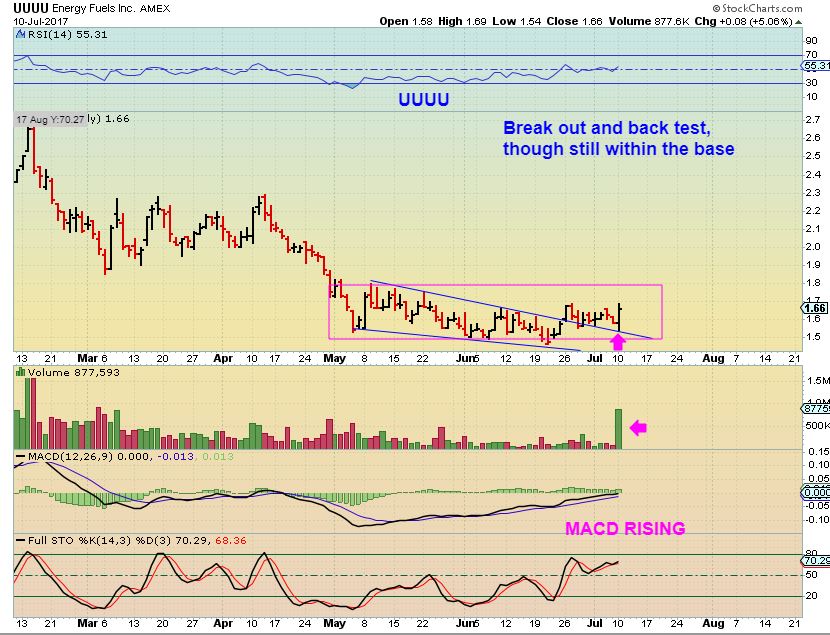
UUUU – If the Uranium Sector looks to be bottoming ( And I pointed out URA in a report last week), then this could be bought here with a stop under recent lows.
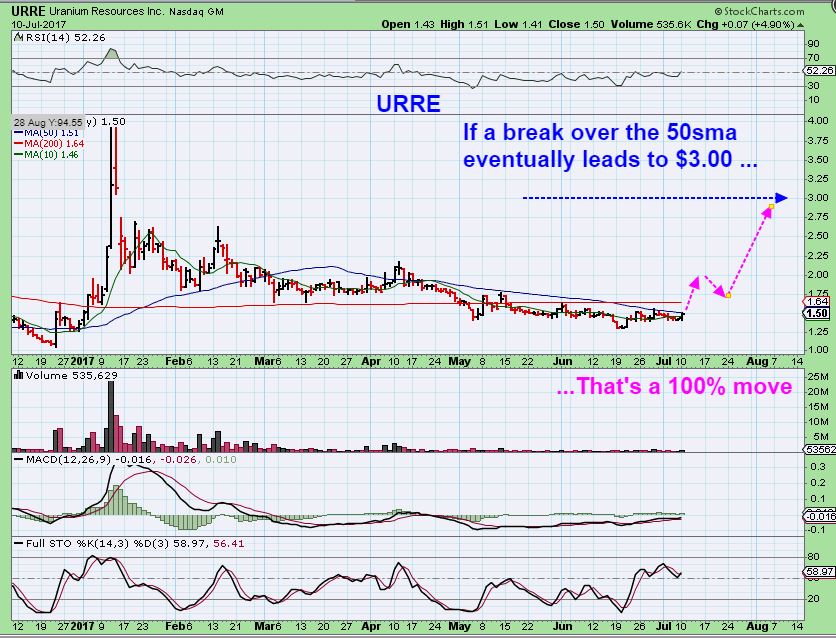
URRE – Uranium & Lithium, this also popped a bit, up 5% yesterday.
SO we see the Commodity sector bottoming and set ups in this area are finding follow through, though they are a bit slow and boring at times. The Miners seem to be more in sync with these sectors, somewhat ignoring the June sell off in GOLD. The COT was mentioned in the weekend report too. Smart money have been closing their short positions during this Gold sell off from $1300 to $1200 – Miners may be in the accumulation stages. This report was designed to show you that with out steep selling in GOLD & SILVER, we see some Miners appear to have bottomed in MAY and are NOT getting caught up in the selling.
Based on my trading style & experience, individual Miners may be bought with a reasonable stop if they exhibit signs of bottoming, but I will NOT be using leverage here yet. Why not? GDX & GDXJ ( GG, NEM, ABX) are following GOLD & SILVER a bit closer than some individual Miners and remain a bit more risky and uncertain at this point. When we know we have an ICL in place, my trading style may become a bit more aggressive.
So we have a lot of bullish looking activity & set ups appearing now, after enduring the recent choppiness. Stocks began selling off and bouncing back in a choppy manner over the last several weeks, and bottoms have been forming. Enjoy your trading for Tuesday!
~ALEX
FSM did not slam down when Silver sold off and flash crashed either. The lows seem to be in place in May.
MY ADVICE WOULD BE TO MAYBE START A SMALLER POSITION OR TWO WITH MINERS THAT LOOK TO BE AT LOWS OR MAKING HIGHER LOWS DURING GOLDS SELL OFF ( OR WHATEVER YOU ARE COMFORTABLE WITH) AND JUST ADD IF WE GET FOLLOW THROUGH. USE STOPS IN CASE WE GET A FINAL FLUSH . IF GOLD PULLS BACK LIKE WE ARE SEEING IN PRE-MARKET, WE MAY GET A LIGHT PULL BACK IN MINERS GIVING US THAT OPPORTUNITY AT LOWER PRICES.
June 9 Weekend Report 
 Wed July 12 – Target Practice
Scroll to top

Hilarious picture! Had to comment before I even read the report…I started the morning Alex news with a big smile! Thanks. Talk about “bad hair days”! Now back to read….
Yeah, I liked that picture too 🙂
I was looking at the Miners charts moving higher in June with Gold & Silver selling off, and I felt like I was looking at something pretty strange too .
At-A-Boy., Needless to say i got a good chuckle out of it. Im using a dab of DUST , with some of the bigger componets lacking, to insulate my few stronger individual miners. Still 75% cash.
Great report! Wild chicks 🙂 hopefully this is the beginning of
Summer Fun!
I agree Crystal, Summer & Fall fun, right ? I’d expect a good 3 or more months of bullish trading if things are at ICL levels and commodities are set to go too. Right now its too soon to tell. 🙂
https://uploads.disquscdn.com/images/c47d728553e2c4692c6967081e43f0ce95c834caaaaad59eca389000ee9f930a.gif
2 wild chicks … ;o)
*I realllllllllly want to come see the cherry blossoms this year.. when is that?
Spring ,… Usually April, but DC is good all year ‘Cept August.
I just added a final sentence to the report, right at the very end. Please scroll up if you finished the report earlier.
share this entry?
Rhetorical again? 🙂
No the last sentence- the ‘share this entry’ thing is at the end of every report. I do not write that.
Nice report ALex. Compelling charts on some of those miners, especially AG. I am going to wait here for a lower risk entry. I don’t think we have seen the lows in GDX yet. Im looking for 20.35-20.50 in GDX. We’ll see
https://www.tradingview.com/x/Dc6nBNux/
Thanks Bill.
It could be because of what I wrote that I am seeing in GG & ABX.
Most of the stocks that appear to have based out or bottomed in May are juniors like NG, GORO, BTG, etc
SOG … fyi .. lol – the original rocketship … from way back when.. not too shabby…
granted – i have only played in and out….. but curious to see if this is the BIG month .. .;)
taking a small position …. if it holds here…
https://www.tradingview.com/x/nMVnyd1O/
Just gonna check me charts for HPJ.. tempted to join you with a small ‘gamble’
Probably gonna run to $4.00, but then likely gonna chop around for a while.. may let it pullback/ flatten-out before entry
Crude futures just had a spike
hmm pran looks interesting ..
FWIW … NUGT is currently a “sell” on my 15 min chart and heading toward the long-tail candle target from yesterday. Will it hit $26.58? Also, I added a bit more TQQQ on the dip this morning.
Alex, thoughts on the JD daily chart? Didn’t quite fill the gap, but close. Looks positive to me, 50sma holding support.
https://www.tradingview.com/x/JUTFP9Cr/
That was one of those high volume power gaps, and they dont always get filled ( they often get tested though).
So we have it oversold and now tested the gap area ( Almost filled as you said) , then recovered the 50sma. It also has good volume to exit if it goes against you.
I like it
running to stops on UEC?
I posted this chart last week when I was asked the same thing.
UEC is above the 50sma and that trend line and it does not go straight up ( Not sure if you had a chance to read todays report yet, but you might want to go back up and read in todays report what I wrote about UEC and its price action. ).
Right now UEC is still above the 10sma, so I dont see how that would run any stops at this point- I think it is normal movement inside of a bullish set up
https://uploads.disquscdn.com/images/a966a3a731eef11776cf2f1250b03fc10d5aa1a18e3ccb1235109ba6daab1db9.jpg
HK … whaaattt? lol
yea… what i said
Oh for crying out loud I was looking at that yesterday with you…..
big news, or short cover?
would normally expect that to come back down
Mners:
Yen…..not confirming yet
Bonds…..not confirming yet
USD…..miner uptrend
So ….. maybe a tad early ? But worth a shot imo
think TRTC is a B or a breakout
wave 5 of 3 maybe ?
Alex, I think your earlier scenario is playong out here. I remember you mentioned that it could tag 200ma and then resume decline. I think we will get the bounce, tag 200 and then resume ICL.
Hey Aniket – I would not disagree. GG and ABX are at lows 6 or 7 month lows – so there has been weakness.
I’m not sure if by “it” you mean GOLD or GDX or GDXJ – but basically with regard to this report….I’ve looked at all of the possibilities and it is true that we do not have confirmed ICL in place by any means, and GG and ABX followed Gold down in June.
That said, the ‘evidence’ in the report that some Miners seem to have bottomed in May ( So far) and no longer following Gold & Silver- even with the flash crash – just had to be shared.
With a triangle forming in GDX- It has been quite a mixed picture for months .
Time will tell, and I agree that caution is warranted….but I am now trading Miners again, and I also traded GORO & GSV in May due to those circumstances, and I made money 🙂
VSTM … hmmmm gonna go again?
I am still kicking myself on that one…… grrr
I’m looking at a bull flag so far ( and those can break either way, depending on whether the Bulls or Bears take control. I still own a good portion of mine.
Refresh
https://uploads.disquscdn.com/images/4647d1ce64cafc61ba7ab877313a9d55ddaa453fed0455122dbe7039a1c05bd2.jpg
I am continuing to add to my TQQQ, looks very bullish to me. But what do I know? LOL
I have been trying to get some SMH on some sort of pull back just can not get one lol
I like QQQ and SMH both starting their final wave 5’s imo…….
SMH moved nicely above the 50 sma today
That’s a very good attitude Steve! Like wise me: “What do I really know”?
Thanks man!!!
Selling VJET for a small profit.
Buying PRNT (3D ETF)
I do not like how VJET is acting rather reduce risk and go with the ETF.
I thought you owned PRNT – last week you wrote that you bought your first tranche.
I only remember because I looked at it and wanted to mention that the volume was only trading 4000 -6000 daily. Very easily to manipulate that. Yesterday Volume was huge for PRNT, and it was still only 50,000.
Today it has 2500 in the first hour. Kind of keeps me away.
I should have said added to PRNT.
Man I was thinking the individuals were more of a risk of manipulation……hence selling VJET
Yeah – those 3-D stocks can move quickly. They act like the mining stocks at times.
But you are right only 3000 shares traded on PRNT so far today. Maybe SSYS would have been a better play ? Now you got my heart rate up ! 🙂
*well .. someone has too .. besides your wife…
Hmmmm……she is sitting right next to me maybe I need “a break” ? 😉
**Go do pushups…
Well…oh never mind. 😉
dang CF .. TWTR has been stellar… GREAT CALL !!!
I didn’t get the call?
u musta been standing in line for a beer that day…………
look back…
#MEOW
Probably.
He mentioned TWTR numerous times brother
I miss a lot
Yeah, and that set up on the 200sma back test was nice too.
It still amazes me how these imaginary lines act as support & resistance.
( This is where someone tells me …
” I think it is self fulfilling. Everyone knows that every one else is watching those moving averages, so they trade around it and it becomes self fulfilling”
And I say , “yes, it could be”
And then someone else says, ” Well what about ALGOs? Wouldn’t they see it and mess with everyones head?”
And then the conversation goes dead -lol
Just thought I’d save everyone a little time there, but I do still marvel that these moving averages act as support & resistance so often. 🙂
… just took ALL the words outta my mouth ……..
*dont even go there …………………………
.*squinted eyes..head tilt…
CRMD about to bust a move CF….?
It is oversold, but it really needs some help to get going
AVEO….
yea…4 of 5 .. no?
I’m watchin that 61.8 RSI.. im out when it crashes thru it….
This is the one that I missed & wished I had jumped in
TEUM!
Lol…where was that recomendation CF ? 😉
oh no.. Just something on my radar for weeks because of the base – Of course I didnt trade it
No worries Bay just giving CF a hard time. 🙂
ah lol – well I feel semi responsible. My scanners pick up many of the basing stocks like CF and I always email him about them – a few end up on his reports as well.. I shoulda mentioned TEUM but I really didnt think it would pop like this…
Like VSTM…..grrr
No , VSTM was a reader named Chuck. CGIX was one that I traded yrs ago.
Bay trader often writes to me about the same ones that I am already looking at- or have on my watch list from trading them years ago & they POP again from long bases. Its like we have the same watch list – lol
They Both Popped without me on board…..
Yeah, I rode both this past spring, so after that strong run, I kept both on my daily watch list. CGIX is still now breaking higher yet, but I like the long consolidation so I keep checking it 🙂
Me too…. 😉
TEUM I did not know however
B.T. – This is an odd statement. I dont get emails from you ‘all the time’ . I don’t know why you would say you feel guilty? I can’t recall many emails this year, maybe once or twice every 2 months? Don’t feel bad if you find a good one & didn’t email about it. There are tons of bases forming out there, especially in Biotech & maybe miners now. Can’t win them all and I certainly can’t list them all 🙂
LOL – I was just tryna take the heat off of u LOL
ok , thanks 🙂 I thought you were saying that you weren’t feeding me your favorites or best set ups or something like tht and felt guilty. NO worries there.
And TEUM I did not know, so that win was yours.
OVAS too, right? I didnt have that on my older list.
These things are popping up everywhere, I LOVE THE BASES!
feeding you?? What would I need with this place if I was that good lol… No way man. But yes, OVAS and TEUM. I try and alert them as I find them, or after asking your opinion on them… Just didnt see this TEUM pop happening like it did today..
I can see how TEUM developed- basing under that 50sma, and then trying to break above, but yeah… it was up 35% when I looked earlier and now up 100%??
I wish I knew it would do THAT. You got yourself a giraffe
who’s on first?
lol … imagine that ………
*smirk
Some one other than his wife has too…… 😉
OVAS bouncing off its 50 …. hmmm kinda like it here
I think that BAYTRADER found OVAS? That one was not on my watch list either.
Nice on that 50sma
Trying to get me a piece….
Bot more AG on the dip today to add to my small starter position from yesterday. The P&F chart for AG currently shows a bullish price target of $17. 🙂
As did I
NG might be a lower risk imo ?
AG looks a lot stronger than NG on my daily chart. It’s the best silver miner IMO and silver has been beaten down more than gold, so may have more up side. But again, what do I know? Check your own charts and make your own trades, don’t follow me. 😉
Yep NG is more of a gold play for sure but it is above it’s 50.
I do see AG looking very good coming out of it’s oversold state so …… it does look strong.
I added some more AG, looks really good, now green on the day.
Ag has always been a favorite of mine too. I bought and rode this one from the lows of 2015 and it was amazing! Also owned it when it first started trading on the NYSE and it was up hundreds of % then too.
And now- it is coming out of almost 7 month lows. Upside could get very good.
Alex, I remember trading AG when it was still on the “pink sheets” back in early 2011 before it became “AG” . 🙂 You remember “the good old days”
Yes, I remember too, it traded Canadian exchange, but not in the US except for the Pink sheets. There were a few Canadian Miners that finally got listed on AMEX or NYSE like that. GPL was another.
As soon as they got listed, buying poured in .
And this is why… above yesterdays close now. Im almost proud
I added to my core in 1 account…and bought also for my neglected account too. I did great with AG last year. Good company.
UNG 3day chan update (for Ken & whoever)
bounced right off the bottom of red chan..
PPO failure could be fake.
https://uploads.disquscdn.com/images/72087b02498f65e4bbf83279a0a28eb6c140f13ec85f956b8853d2794f0f93e1.jpg
Very Nice SOG thanks !
looks good to me as well .. looks like it’s in “3” on the 5 minute….?
I was going to put in the report that NATGAS looks like a DCL, because it hasd a Sharp spike down – high volume.
The reason I didn’t, other than the fact that the report was focused on Miners, is because it isnt above the 10sma and no swing in place yet. It could be a dcl though.
thanks
So do you make anything of the oscillator break down? Or just a possible shake out
Unless PPO reclaims the t/l, I think any rally likely stops around the purple 13ema…
But these things overthrow all the time…you can see that first set of red circles.
Drives me mad! 🙂
It has been quite a nice match to the movement in 2012- 2013, except it hit the lower line twice this time, but that is still really close match up. So…
If it continues to match , it is at this point that Natgas would take off and not look back 🙂
The patterns often rhyme, but theyre never quite the same are they?
Market Movers never make it so predictable for us (damn them to hell)
Go NAK go! Still following your pattern, Maria?
LOL .. jinx!!
nik nak patty wak
IPI .. weeeee
CLD sold off back down to the 10sma and just recovered too.
DNCVF … ever trade that CF…? that’s a huge gain if it goes like last time
AQMS too …
No – I do not even know this one.
Checked it out, I dont like the volume.
4000 shares traded on a 20 cent stock. That could be ‘anyone’ buying or selling 🙂
DID NAK just push back above the 10sma : – )
That opens up a possible run to $1.60 – and that is not a small run %-Wise
widowmaker opening her eyes….
you talkin bout AUMN?
yea
wanna fill my boots at these prices… but cheap could get cheaper.
having said that, everything (miners) seems to be putting in higher lows
yeah.. well – she has so many fake outs .. im waiting for more proof.. there’s PLENTY of upside…i hate sitting in her forEvvver waiting…………………….
be happier when it gets above that d/t line from May’s high
It appears many oil stocks may have a higher low in place.
GPL – added another load at 1.23 – seems like just in time.
I did too – I like the base
MBRX tryna do a lil sumn today as well
IDRA has a decent set up.
RES…..
NSU?
That is a possible 2 month inverse H&S Maria.
Good potential if it goes.
Marietje…. it looks very good NSU !!!
Why…. I own some of it.
Thank-you.
yes… Me too.
JNUG ( SHHHHHH).
It was down 75 cents the last time I looked,
yeah.. SHHH .. no one talks about fight club
Exactly.
**we dont mention the unmentionables ….
AREX again…. sheesh.. energizer bunnny
Nice pop in GDX…Will it hold..??? We will see…
I need AVP to get its act together and move…
NUGT did not hit the long tail candle target from yesterday ($26.58) but it got fairly close with a LOD of $26.86 I’m still not sure the long tail candles really mean anything, but it’s interesting to see how often they seem to point in the direction the market will take over the next few days.
Certainly interesting. Keep posting
Yes, I wonder if GDX had one at the same time and got closer to that low today. Maybe the 3x etf burst higher yesterday and just didnt fall as much today, since it came up 30 cents short. It also could drop there on follow through selling tomorrow, but I am thinking that yesterdays lows should hold.
I bot some GPL (AKA “widowmaker”) to add to my AG, but a much smaller position than AG. GPL can be a wild ride going up (and down).
Think CF and myself added a load at 1.23 – glad to have you on board lol
This is true 🙂
USO & UCO breaking back above their 10sma, NATGAS moving higher with UGAZ up additional 12% Boil looking good.
I was wondering if we would actually see rotation, with an ICL sell off finally coming in NASDAQ , SPX, etc, and funds rotate into OIL, NATTY, URANIUM, STEEL, ALUMINUM, Miners?
That is absolutely a theory that I’m watching right now.
Look at the chart of HBM in the report, and look at it now 🙂
See also SID & CSTM CHARTS
I think we are going to be making money in commodities and maybe even Miners here
…And what I mean by that is that HBM was a buy with that break out , mentioned in the report.
I was just in too much of a hurry to post a chart right now, so see the one in the report & a real time one 🙂
WRN with the 50sma ….watching, waiting, watching….
Earlier in the comments I mentioned that NAK breaking above that 10sma at the open also opens the way for a nice run to the $1.60 area.
I didn’t think that it could do that all at once, but so far it just keeps creeping higher. 🙂
Nice trade going on there too, commodities are looking good.
refresh
https://uploads.disquscdn.com/images/e3847cdf2924d003d3387f2fae45a11bf5eeb8acd2d5d595366c1cb0959583a5.jpg
NAK was up 12 cents when I posted this chart, then it dropped to up 7 cents after I posted it.
Sorry guys 🙂
NAK, back in the saddle again? Sure hope so, that’s been painful recently.
GSS – Double bottom? Nice divergence.
URRE kicking it up
Feast or famine. I remember in May when it was difficult to find a good trade following through.
I kind of like this environment much better. 🙂
As do I.. Plus my account likes this shade of green
🙂
WHOA! I couldnt figure out why my account jumped so much,
then I saw VSTM 🙂
LOL i was JUSSSSSSSSSSSSST gonnna say that………… jinx
Giraffe neck on Giraffe neck, can you go get your giraffe maria : )
This was the only one that I could find from a search of old reports. Ahhh the good old days, I think we are close again. 🙂
https://uploads.disquscdn.com/images/233322cfd1a77789f090e5748712add48651962032ebf3055c31328a64f3e939.jpg
https://uploads.disquscdn.com/images/de5c255d759cbaad0c0e156c3c5030c499a2d29be22d42a0f8462edb8c8586dc.jpg
Jeez ..had to do a doubletake there . thought i’d missed a TRX rocket just now! 🙂
Sorry – Ur right, that was a false alarm. I was reminiscing & waiting for Maria to post her giraffe from yesterday
lol..no worries.. i didnt read the accompanying comment straight away.
Just saw ‘TRX’ and a mighty giraffe
but … butt .. daddy .. i tried to post the giraffe and darn discus cut it’s head off…
. buthttps://uploads.disquscdn.com/images/3a84421d59b9af8dac8bb23db9210df9ba69ca3725c54074a007f4f465735cc4.gif
Yeah, this one doesn’t open either, but you were able to post it yesterday..Odd.
man TGB .. wantssss to go .. needs some luvin
….. yo . loverboy w/ all the pent up energy… stop your pushups and throw down
I envy you guys being able to play multiple stocks in multiple sectors, I don’t have the time or the ability to trade like that. I just keep it simple and trade index ETF’s and a few miners.
https://uploads.disquscdn.com/images/5cc31c553b1cec5734b2e3be3b2b6bcfc32a653ca83593cd70da77025e808d31.gif
That has been a good style in the markets bull run.
now tell IPI to follow suit ……
https://uploads.disquscdn.com/images/de5c255d759cbaad0c0e156c3c5030c499a2d29be22d42a0f8462edb8c8586dc.jpg
There it is 🙂
The bull flag at the shoulder 🙂
I need me one of them pet Graffs
Keep an eye on CGIX – It is set up properly, but these BIOTECH/PHARMA can go either way.
Yea yea Nice Trade CF ! 🙂
CF, report was so long I won’t have time to get through comments before work!! :P.
I’ll be back tonight…
hey case…..
Yo! I got 222 comments to get through tonight. Ain’t nobody got time for that!
MNGA .. :-O
wow , stocks that sold off are popping up everywhere
yeahhh a repeat of 12-2013 wouldnt be all bad… 😉
BAYTRADER – You still have your GMO?
Looking good
Still got both URRE and GMO!!
shoot… that looks ready to launch tomoro
They both look really good to me – hang on 🙂
GMO is killing from my .37 entry
GMO is going to go 🙂
I hate URRE lol
URRE looking good
This is what drive ls me nuts with URRE… hold gains plz
AG and GPL and Silver remaining strong…..I’m in before the close. Yen is now confirming also which is always good. 🙂
Bonds looking for a bottom …..
USD under attack …..
SBB.TO up 6% broke out Canadian silver miner
nice round bottom for the last years
I was just about to post about SGSVF – I used to own it and so it because….yup…low volume. and it has been in a solid uptrend since then. LOL. I missed this whole move, and what a nice chart.
SLV Calls ?
Trying to stay patient with SMH ….
I saw that SMH seems to have broken the over head down trend line & closed above the 50sma. It looks pretty good.
Waiting for a pull back? Like 2 of 5?
Sigh yea may not get it lol
It might just run …..
You could, the last time it did a run from April lows ( And it looks like a 1-2-3-4-5 ) – I think that the 2 was a drop back onto the 10sma, but it was sideways and quick.
So you might get that entry.
Agree.
Can’t even get a 15 min. Buy Signal last few days lol
THIS TRADE IS NOT FOR EVERYONE- Consider it risky at this point.
It bounced off of 82 cents this morning, and is now at 99 cents.
I added on that pop and pointed this one out last week & bought some then too.
It has BORED me to death since then, but this looks pretty good.
Again, NOT FOR THE AVERAGE TRADER, but this could be a future rocket ship
Refresh
https://uploads.disquscdn.com/images/ebd0dd01fb2f611d3d9510500cb8a30facb192ef17a903327cc8d6422c187afd.jpg
Thanks for the heads up CF
Scary one – Kind of a do or die. I bought in the .90’s when it took off last week and we hit 82 cents today! But you look at the chart and the moves look muted, because it does move big up & down.
That said – Not a huge position, but I’ll regret that if it doubles 🙂
Eyes
Nice….It’s like owning a popcorn machine here.
Hey that what I just said!
More eloquent than you btw 😉
oh nice velting…now u brought out catwoman……….
wooooooooooooooooooooooooooooo
https://uploads.disquscdn.com/images/3eebda16c479915a534c13e773f5c65895a110f1c4bfbb4a32e07513e2f0277e.jpg
Your scaring the Cat !!!
And throwing out ‘names’
http://media.giphy.com/media/DHujNQWc9XjRC/giphy.gif
LOL… what? ha ha
You said Velting
LOL yeah..
dang .. FCX chewed up the 100 day… but that 200day bully looks ominous….
Seems like it gives and then takes it away…. 🙂
Whoa- she is starting to rock on again… Now I wish I bought a little more. 🙂
well … that was fun…
adios .. off2myMassage………………….
culater
It’s pina Colada — lol
whatever she’s drinking, i hope she enjoys it 🙂
blimey o’reilly.. had a hot flush at close, and bot starters in TRX & AUMN.
TSLA …..
Is the 50sma resistance now?
Very possible Bill
NAK!
WOW – news moves
NAK time?!!!
https://www.wsj.com/articles/epa-moves-to-roll-back-proposed-restrictions-on-alaskan-mine-1499823880?mod=yahoo_hs&yptr=yahoo
Oil setting up ahead of US in inventory report tomorrow AM?!