
June 9 Weekend Report
SPX – From Fridays report, this shows that the SPX could be forming a megaphone pattern as it sat around the 50sma.
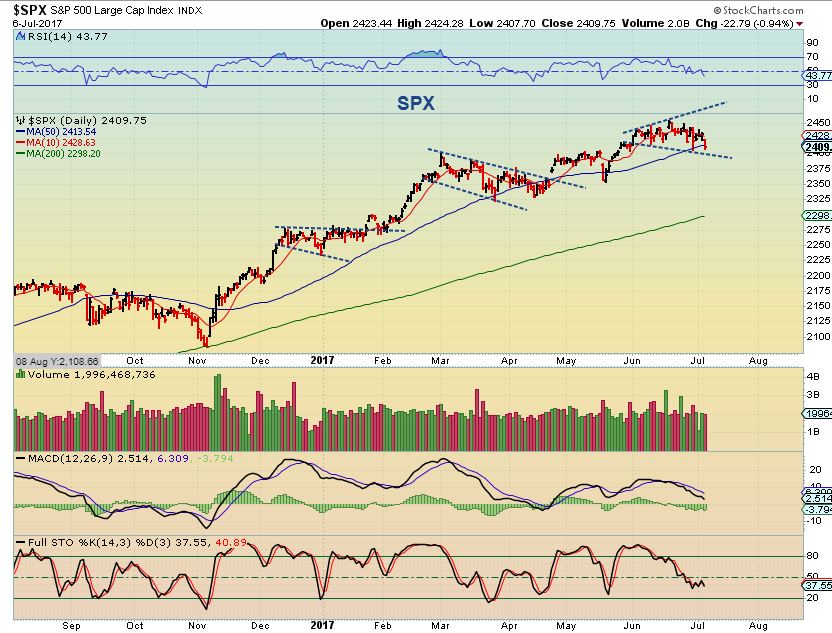
SPX – Friday the SPX moved higher off of the 50sma, but has a new daily cycle started 6 days ago?
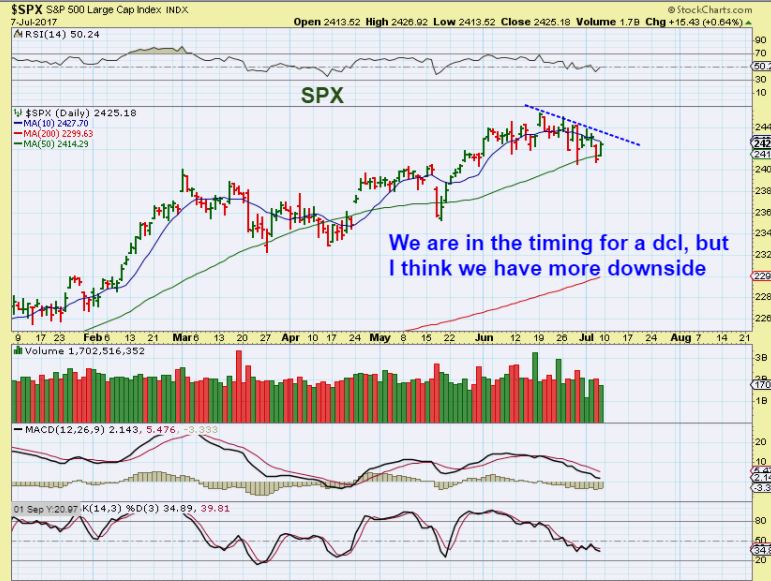
This is what I would look for going forward…
Watch for a break above that 10sma and that trend line drawn on the chart above. A break above those should indicate that the SPX has a dcl in place a few days ago, however…
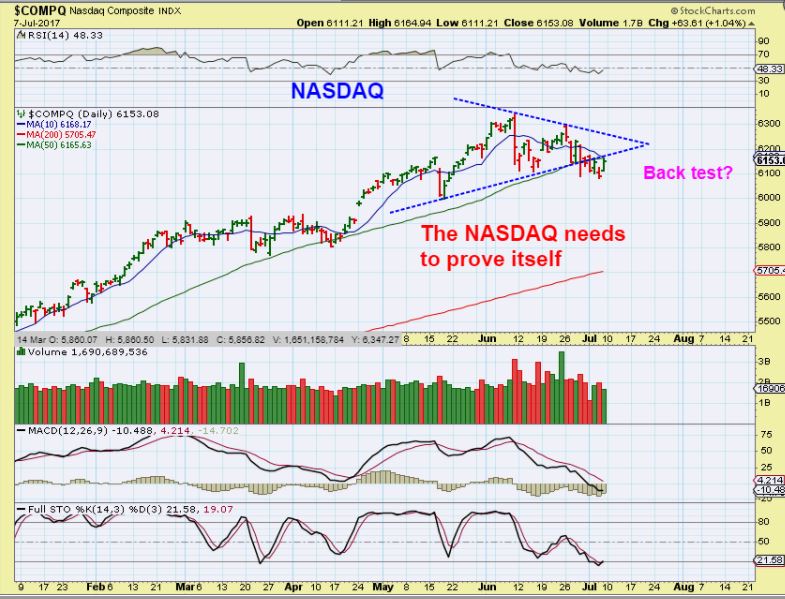
NASDAQ – The NASDAQ has been a bit weaker, breaking below the 50sma and closing there for days. We have discussed that we are overdue for an ICL , and that could be what is developing here. This could be a back test and then a drop…
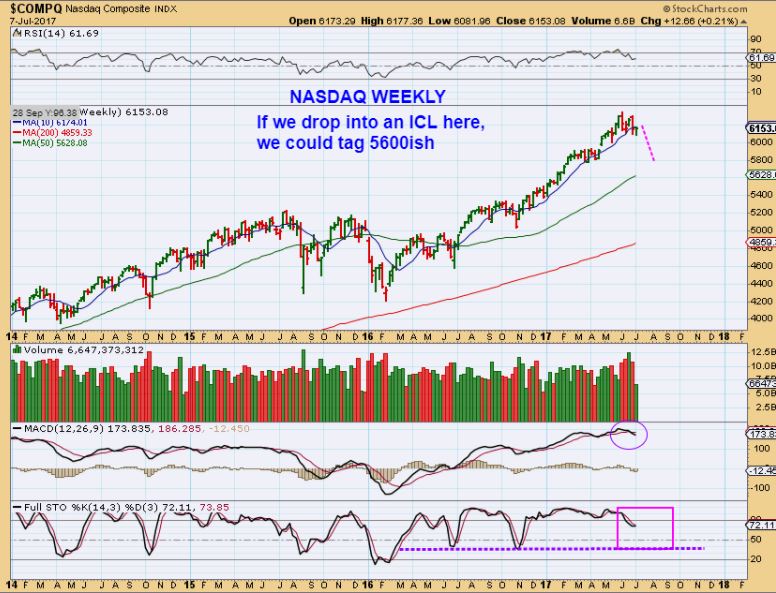
NASDAQ – I posted one of these last week too, showing that The Weekly chart of the NASDAQ shows that it could easily drop more than many expect.
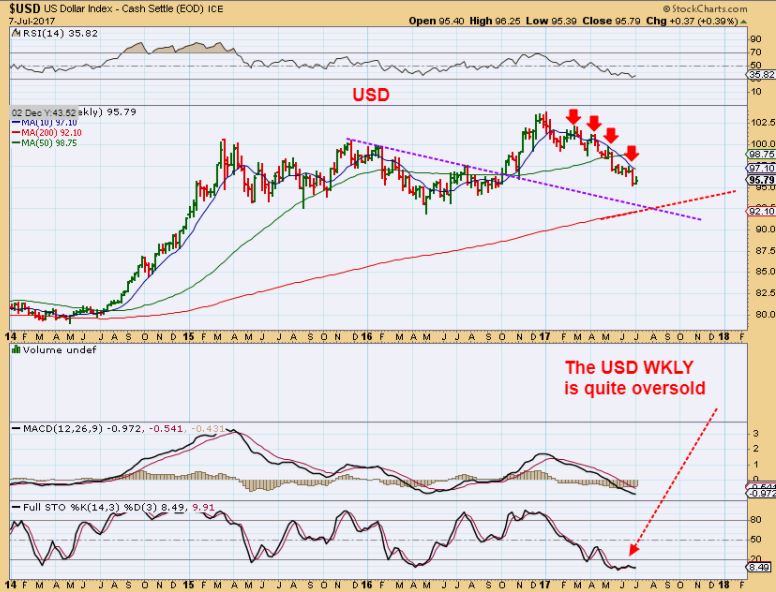
USD – The USD has just been weak. Week after week it has bounced under and closed under the 10ma on a weekly chart. It too is due for a Low & a bounce, but it cannot muster the bulls to step in yet.
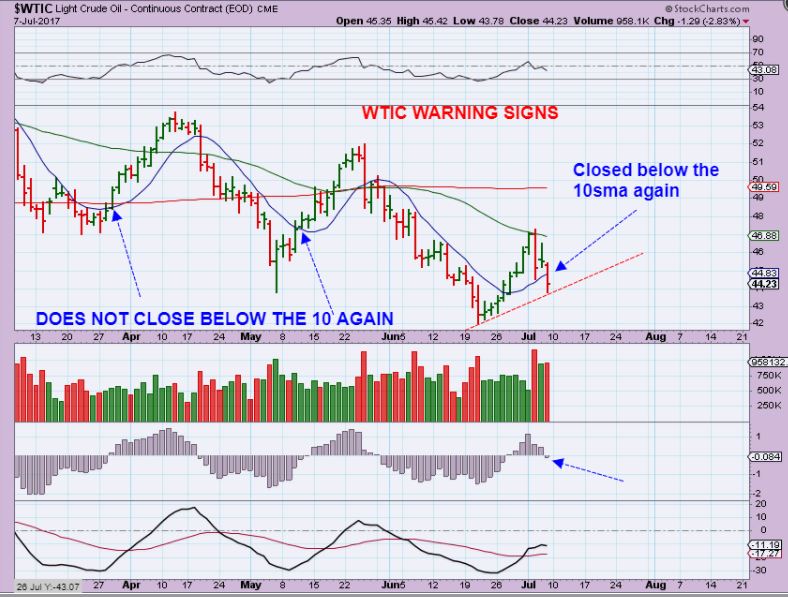
WTIC DAILY– Oil looked good coming out of the lows with 8 straight days of Buying. Now suddenly it is already sending out a warning as of Friday. Please read the chart…
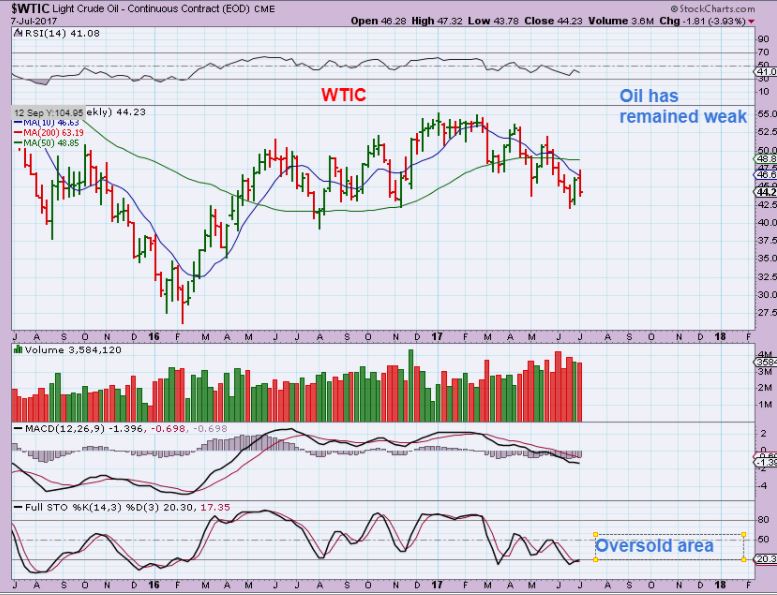
WTIC WEEKLY– So the weekly closed down and took back more than 1/2 of that 8 straight days higher. That is a warning too. It is oversold, but it can get very oversold if the bears gain control and so far it is heading in that direction once again. This looks ready to drop again.
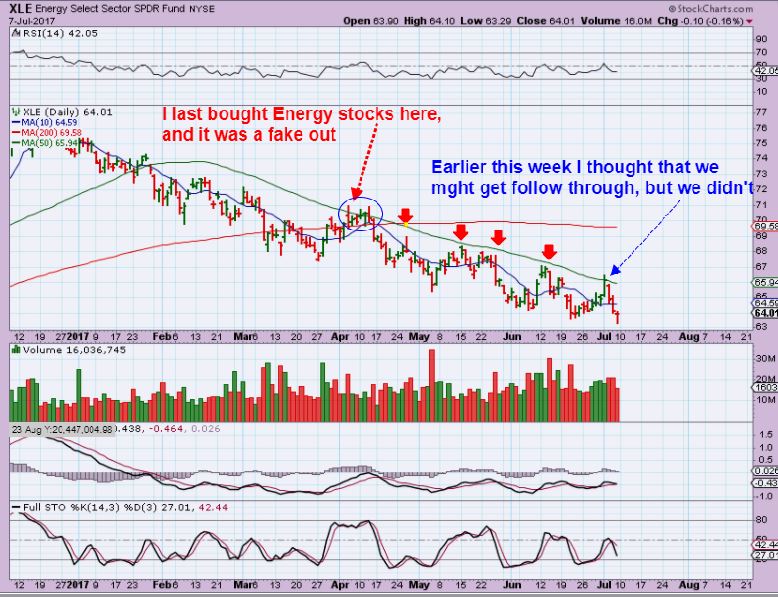
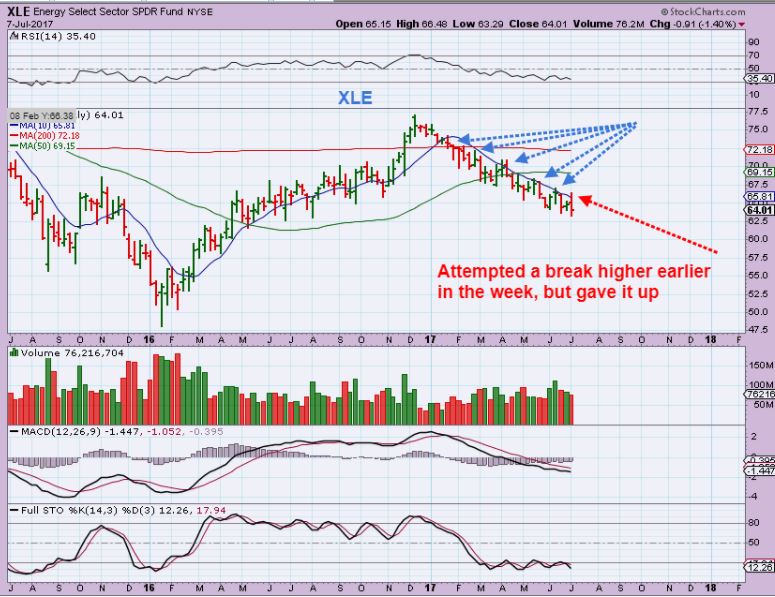
XLE – I noticed a break out in March and bought energy stocks. I Made some money, got stopped out on others for a loss, and haven’t touched this sector since, because this has been a long downward sell off. Lower highs , lower lows.
LAST WEEK, I THOUGHT WE WERE FINALLY ABOUT TO BREAK OUT AGAIN– so I mentioned that to prepare readers here that we may get ready to possibly buy. well, the XLE slammed to new lows and recovered Friday, but I cannot tell if this is a real low or not yet, so I will remain patient. Some of my indicators are saying that a low is forming, but that needs to be proven.
XLE – At this point, XLE WEEKLY remains in a downtrend for sure. Notice that it is quite oversold for a weekly chart though.
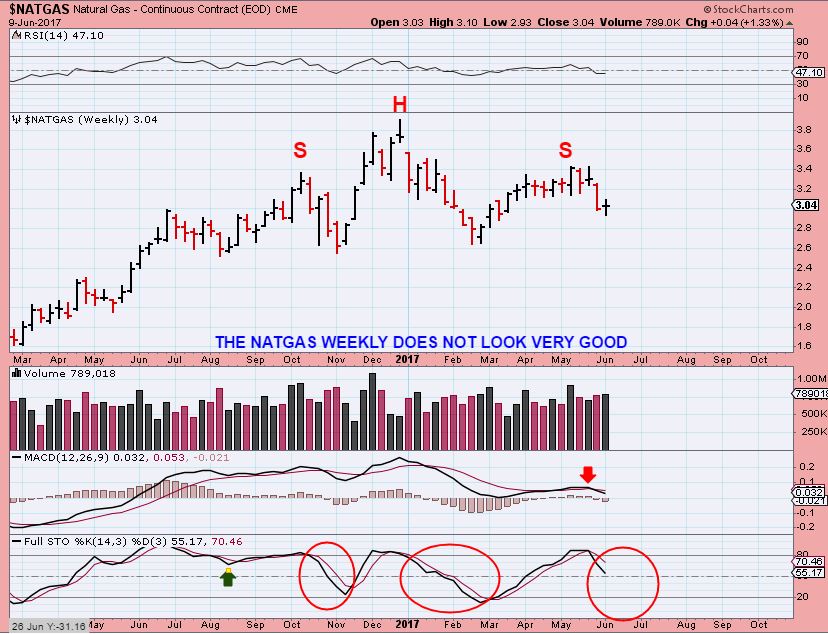
NATGAS – NATGAS broke down at the end of May and it has not been able to recover on its bounce. This is a bearish looking chart and could drop pretty good if the H&S plays out. SO far, the neckline is not broken, so it is semi-neutral , but closed near the lows last week…
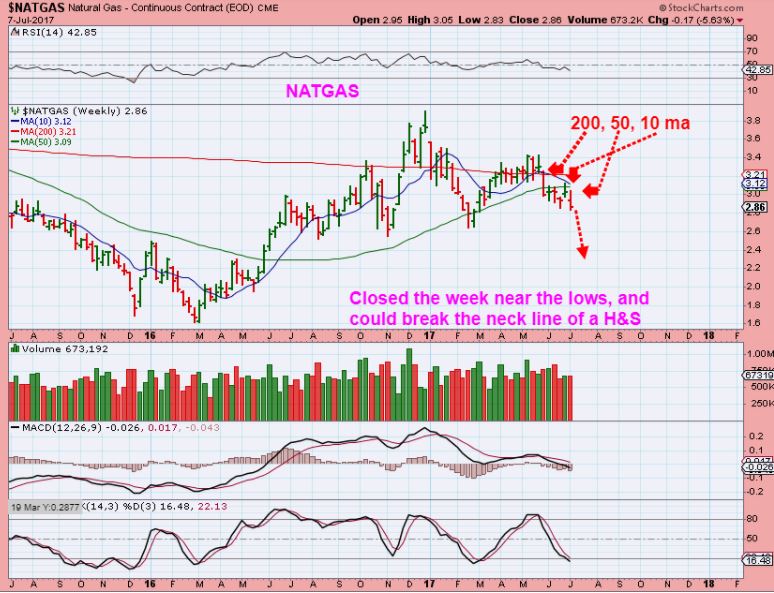
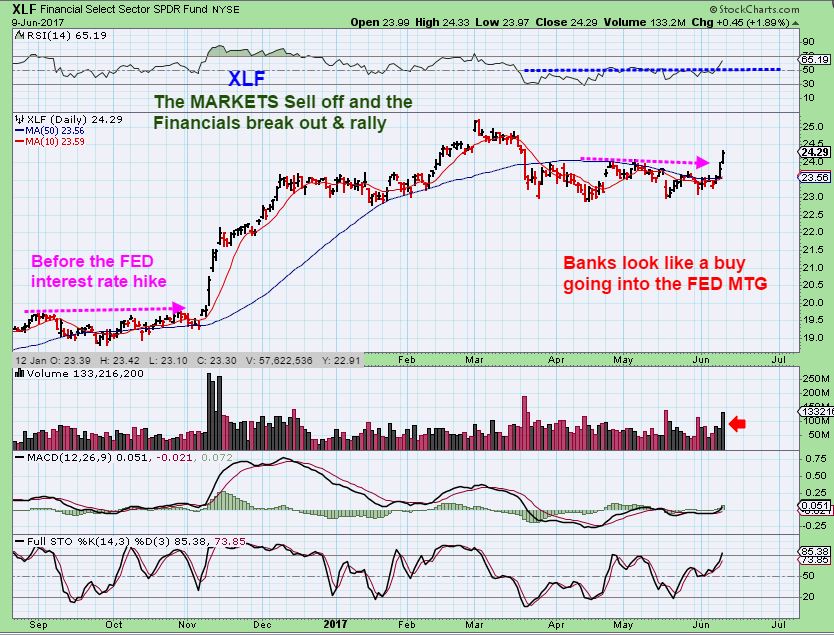
Reminder: Do you remember the XLF & all of the Bank stocks H&S?
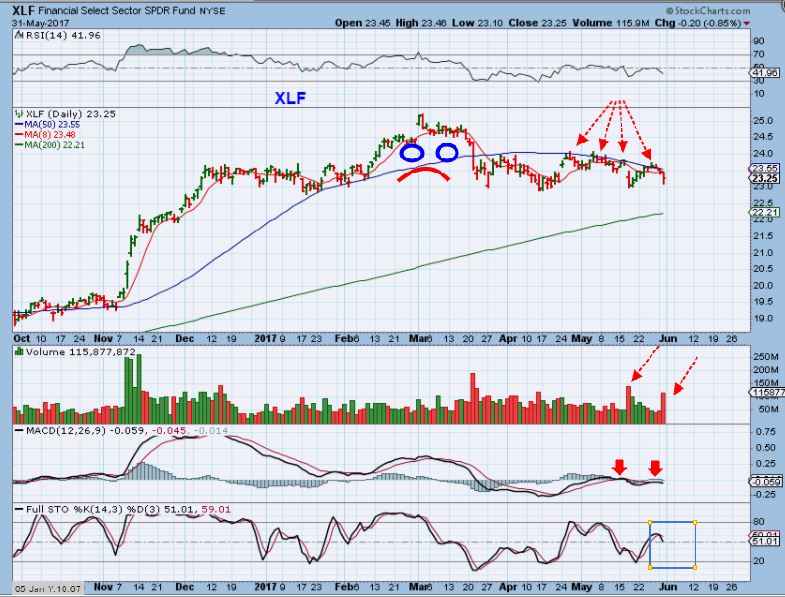
They all negated the H&S pattern with a break higher, so shorting it before the break down is risky. We should consider the NATGAS chart the same way. I’m waiting to see if it breaks down or not.
From way back on June 9th – The H&S was possibly forming after that break down, but here we are a 1 month later on July 9th and price has gone sideways. Shorting with leverage would not be working out here. I’d wait for confirmation if shorting is what you are looking to do.
STEEL – I mentioned that I thought that STEEL was bottoming a few weeks ago on June 10…
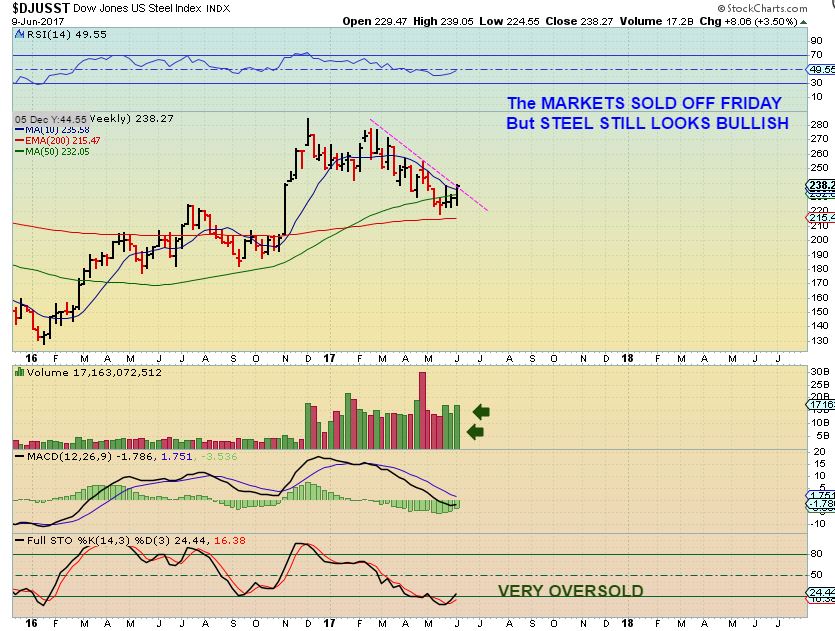
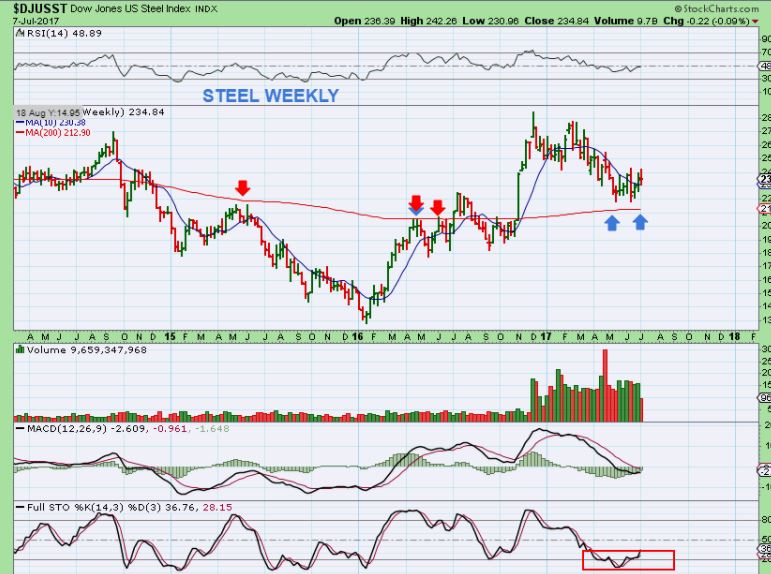
STEEL UPDATE – Steel itself has held these lows and still looks fine…
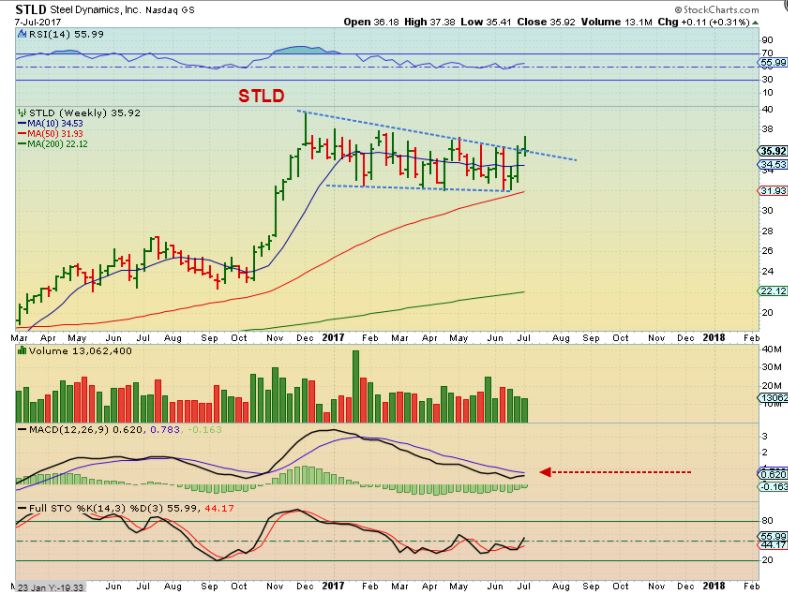
STLD – This steel stock has put in a long consolidation and remains bullish.
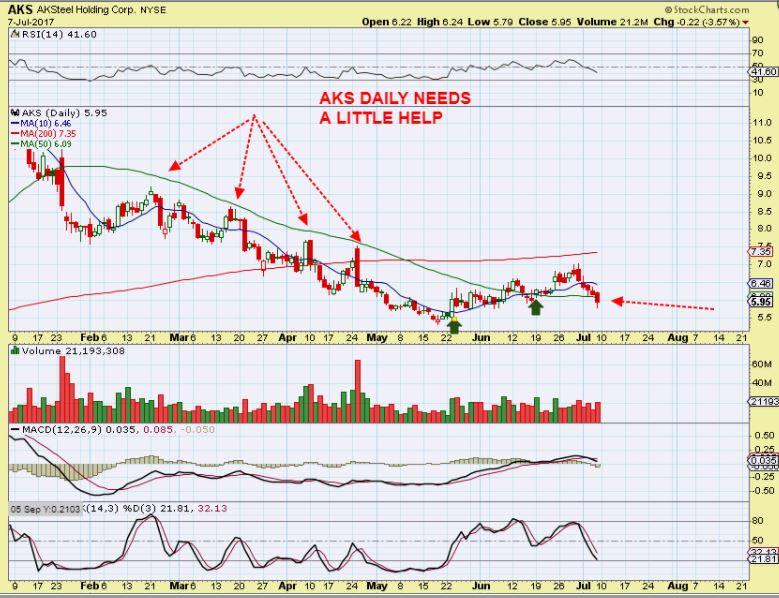
AKS– AKS broke down and tried to recover on Friday, but came up a little short. It did sell down a little each day last week, so it now needs to be monitored if you own it. A stop under the 50sma may have stopped you out. We’ll see if it can push higher- if not, it may be experiencing some sort of trouble.
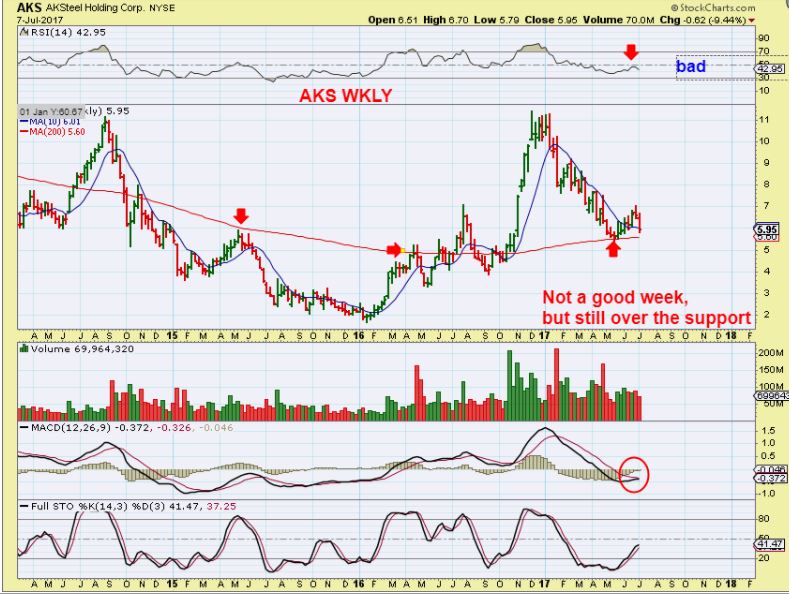
AKS WKLY– The weekly chart shows 1 bad week last week. $5.60 could be a stop, but you really want to see the weekly price back above the $6 area.
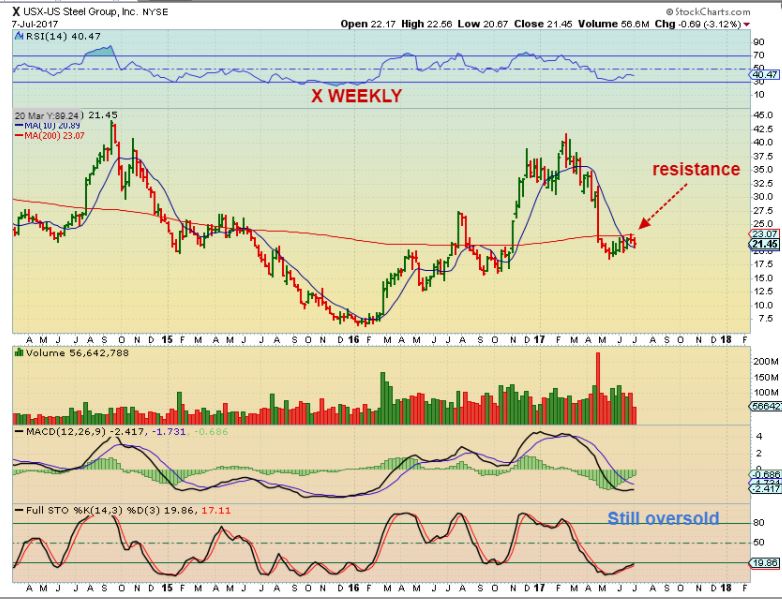
X– This one actually has been pushing on the 200 ma on a weekly basis. It remains oversold and hopefully can push higher next week. Steel itself still looks good, so I don’t think that this is a bear flag for that reason, but if you own it, do not let it get away from you if it starts selling off.
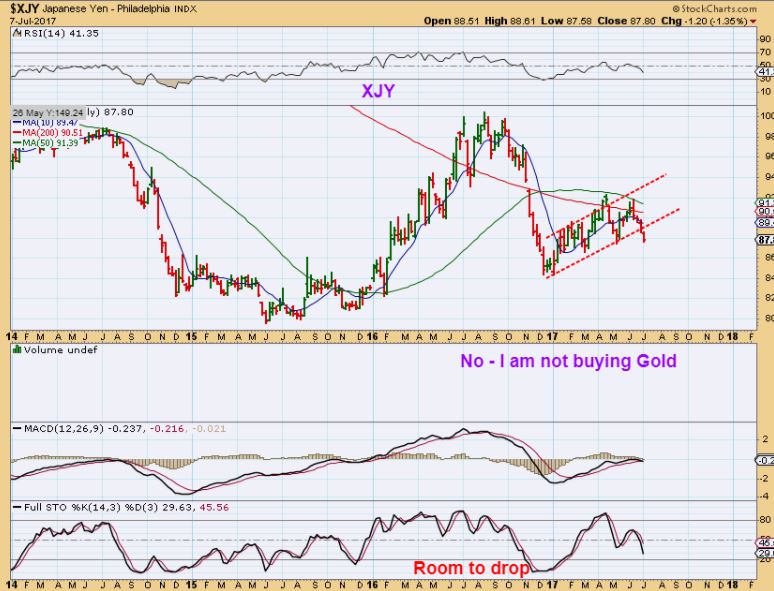
PRECIOUS METALS ( & The YEN)
YEN– The Yen started to break down last week, and I would expect Gold to be doing the same.
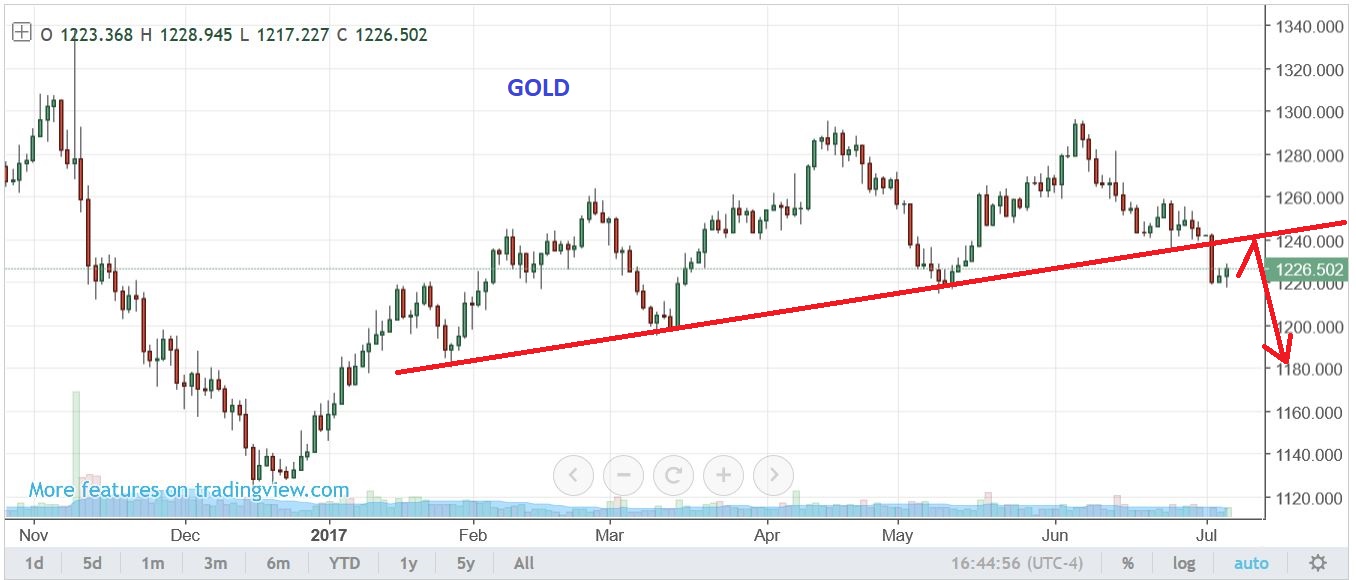
GOLD – I discussed a break down in Gold & a possible bounce that Should NOT be bought, since it Could be a bear flag & back test.
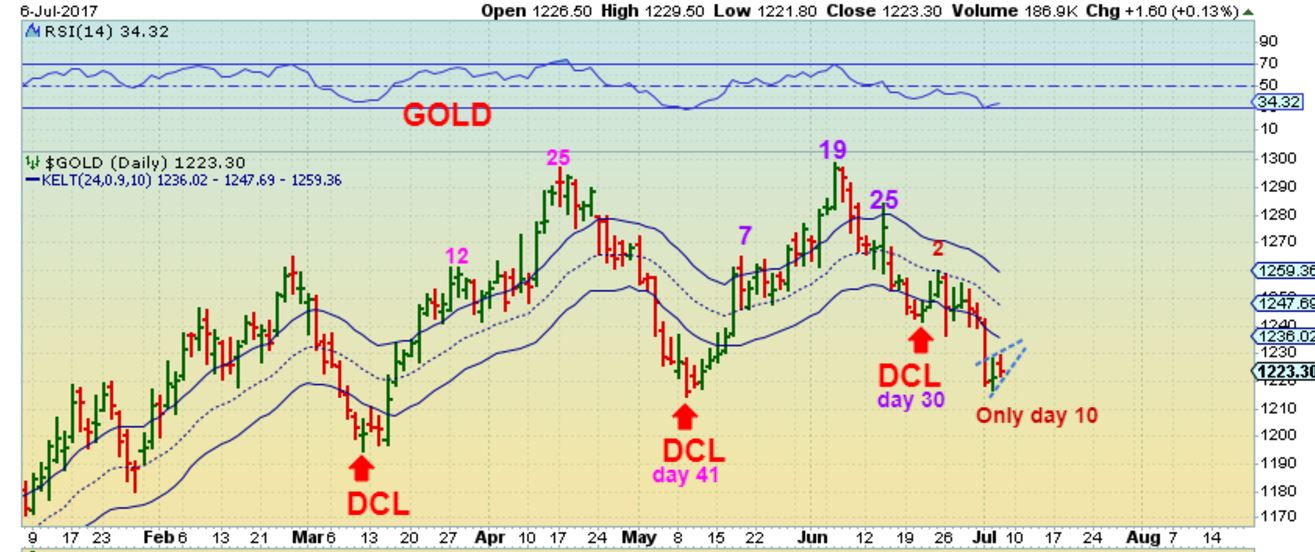
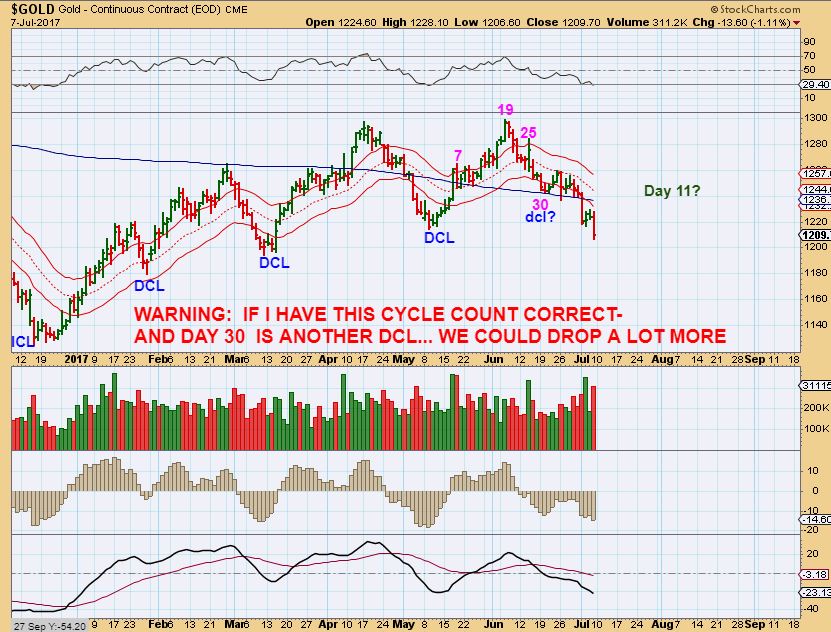
GOLD – JULY 6th- I pointed out the same Bear flag with an early cycle count on day 10. More downside expected. I feel that this cycle count is correct, with a DCL recently on day 30 ( If not, that would be day 41 on Friday). If this count is correct & we dropped from here, I would NOT be buying on day 11 ( Friday) 12 ( Monday) or onward, I would be patient and watch this play out. We could drop into Day 20-30.
GOLD – So Friday GOLD did sell off sharply from that bear flag. Gold closed below the blue line ( 200sma) last Tuesday. Please read the chart. Day 11 or day 41. I have to encourage my readers to be patient and wait for a confirmed swing low before going long.
.
IF you like the prices of Miners now , and are really excited about buying them, imagine if they even get cheaper? This could happen next week.
.
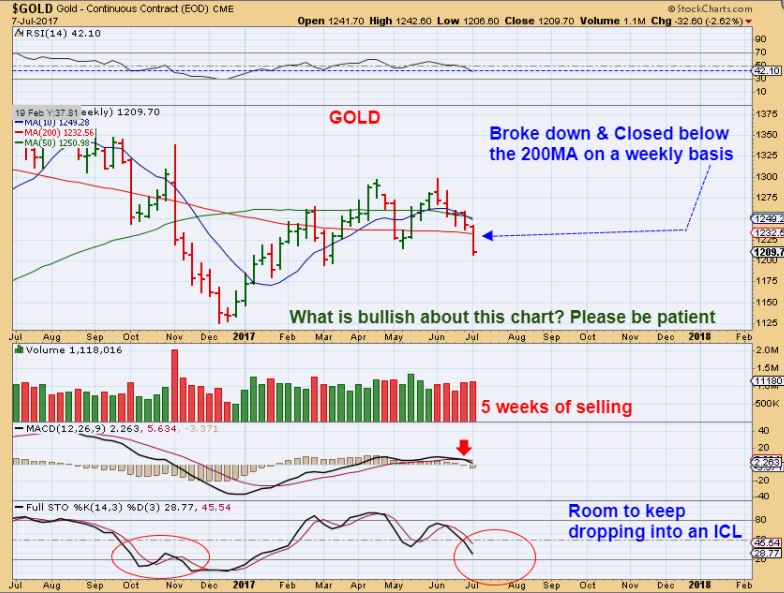
GOLD WEEKLY – SO I admit that in Jan, March, And May you see a similar 1 week slam down in Gold ( Similar to last weeks). That was the lows on the following week. This does look different to me, so we may see follow through next week. I recommend patience.
PERSPECTIVE
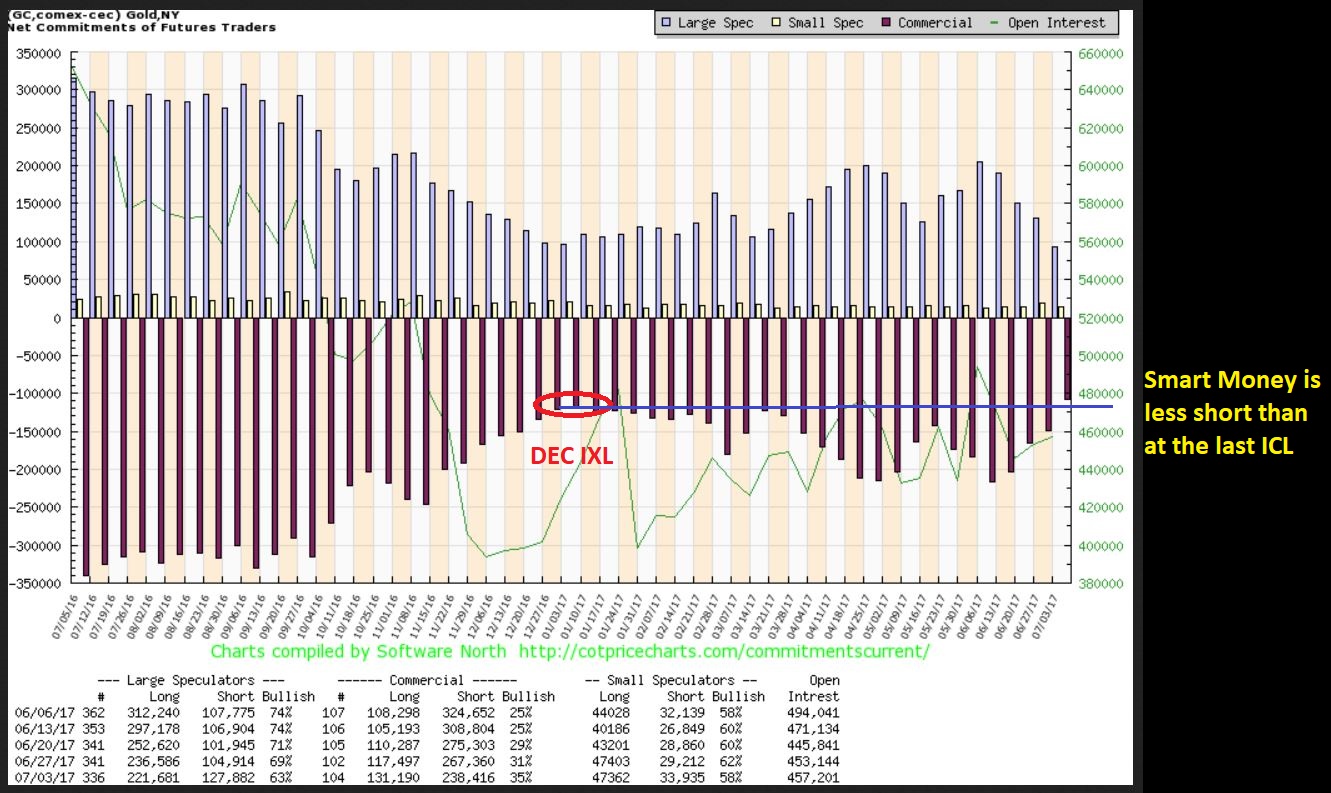
Is the C.O.T. improving? Yes it is. Is it better than the Dec 2016 ICL? Yes, it actually is as of this last Tuesday. Friday Gold dropped even further, so the COT likely improved. In the past I have emphasized not using the COT to trade, jump in early, gauge that selling will stop, etc, so lets examine the current situation.
COT- YES, this is showing that Smart money is now even LESS SHORT than in the last ICL of DEC 2016, and that is Bullish. ( SEE THE CHART NOW) . This is very encouraging & it does alert us to the idea that this drop may be an ICL drop and a great buying opportunity is coming, but I still encourage waiting for more evidence…
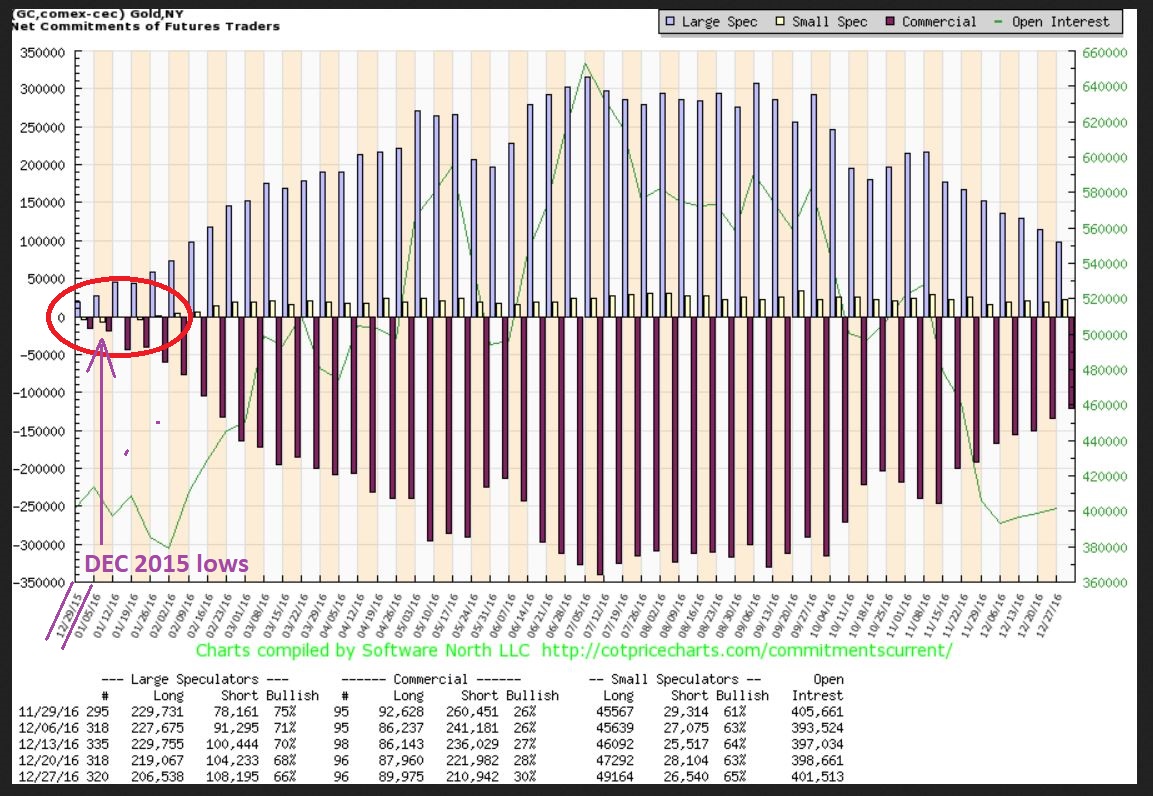
GOLD – Please notice how this COT chart of the Dec 2015 ICL was looking. Smart Money was still A LOT less short than now. So they can do better than the current short /long set up as Gold sells down more. Patience is the best play here.
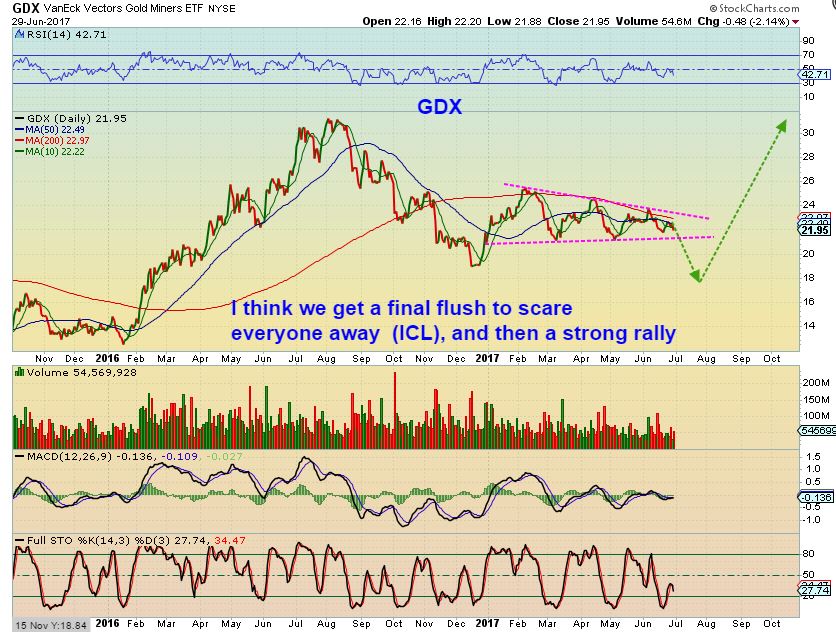
GDX – From June 29 – will GDX continue lower? I thought so here. I drew a quick flash break down below May lows & then a strong rally as a possibility.
Let me point out something else that stands out to me…
.
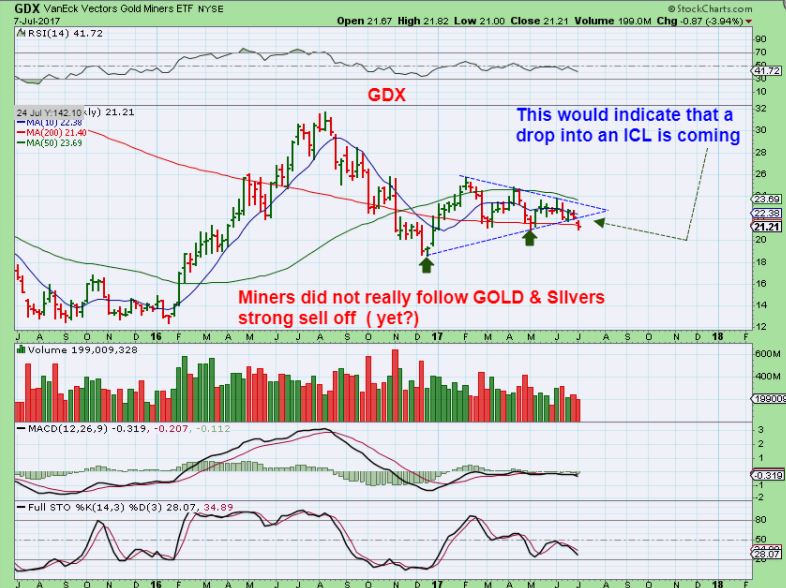
GDX & GOLD – Currently Miners do not seem to be selling off as sharply as Gold. SOME MINERS are even holding up much better than Gold & Silver, as pointed out in prior reports. Lets Look at GOLDS daily chart again below – do you see 5 weeks of selling down in Gold here? 2 strong down days last week under the 200sma? Yes you do.
DO you see 5 weeks of selling down here on Golds weekly chart, with a big drop last week? Yes, you do.
In GDX- The selling down in GDX does not really seem to be selling down as steeply as we see in Gold & Silver.
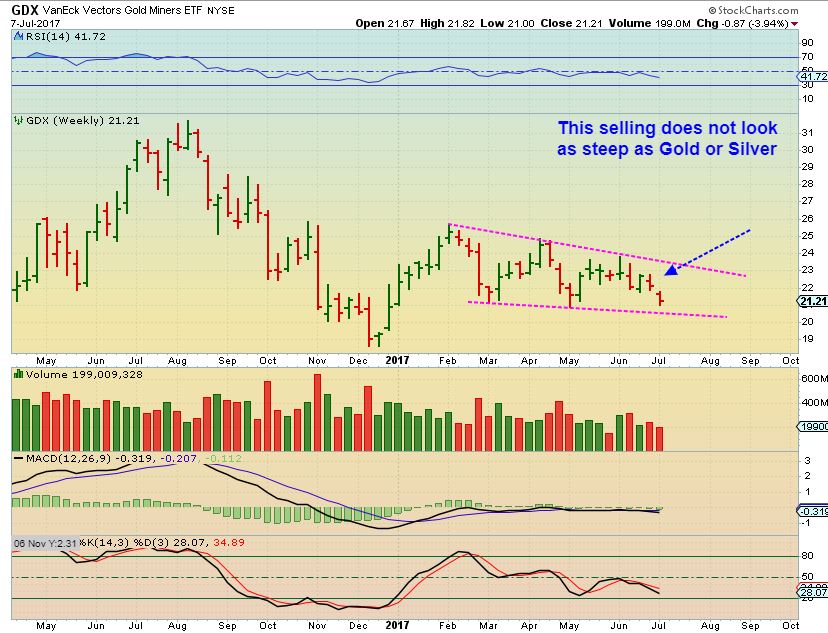
GDX DAILY – Some of those down days are very small candles and price has remained sideways inside of this consolidation. So far that is bullish for Miners, but it isn’t quite time to buy safely yet.
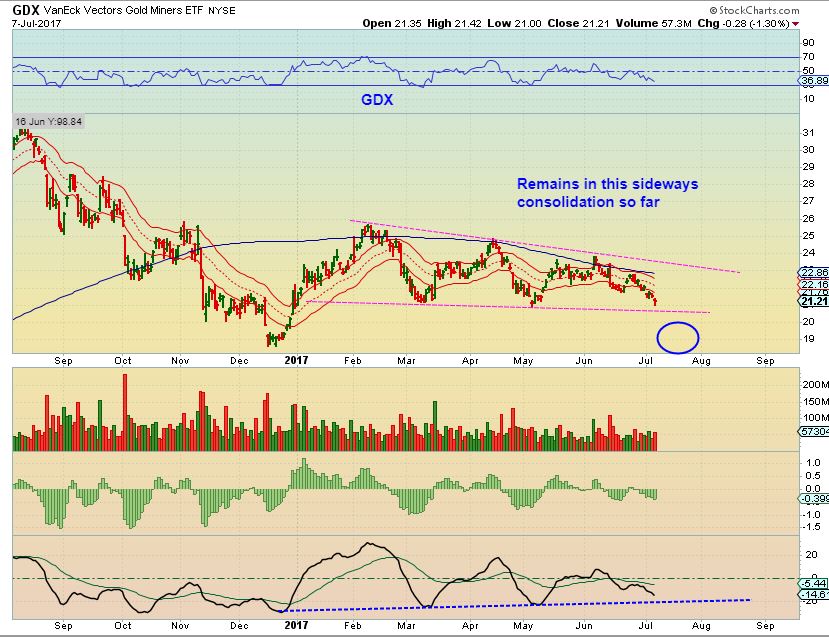
GDX – I do see a break down here in the GDX trend line and near the 200sma, so we remain cautious for safety. GDX could sell off more quickly once it closes below the 200sma for a day or 2.
I believe that the coming rally out of an ICL in Gold, Silver, and Miners will give us a great set up to make some really good trades and some really good money. For that reason, I may just patiently wait for those lows to be in place, instead of trying to short this down, and then go long.
GDX WKLY – If we are on day 11, I have drawn a quick 1 or 2 week drop ( milder view) compared to GOLDs possible drop. Time will tell.
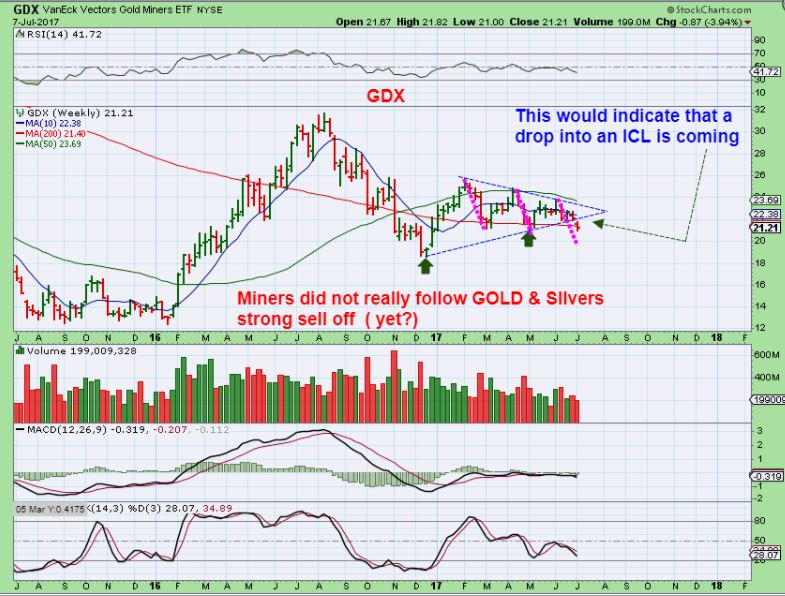
So basically, Gold has been selling off for weeks and it really picked up last week. It has broken below the 200sma and may drop further. Is it on Day 12 Monday? Or is it Day 42 and a low is very close as a result? It is a tough call when Triangles are involved, and the Miners remain minimally damaged around the triangle at this point.
THAT SAID, you can see why I am just patiently going to allow these precious metals markets to tell me what is going on at this point. Again, the C.O.T. is more and more Bullish as of last Tuesday, and Gold sold off another $14 or so Friday before bouncing, so the Smart Money likely closed even more of their shorts. With the cycle count on either day 11 or 41, we will know this week where we stand.
The Good News? We are getting close. 🙂 We’ll see what Sunday night and Monday bring to the table. Enjoy the rest of your weekend!
~ALEX
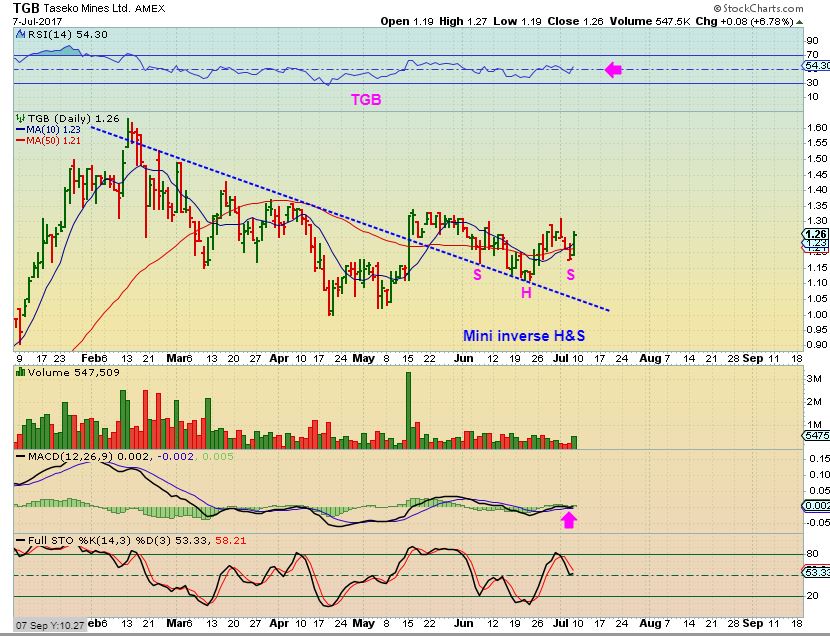
TGB – I still like this set up from June 28th, and believe it or not, Price closed up 7% at $1.26 ( Same as it was on this chart).
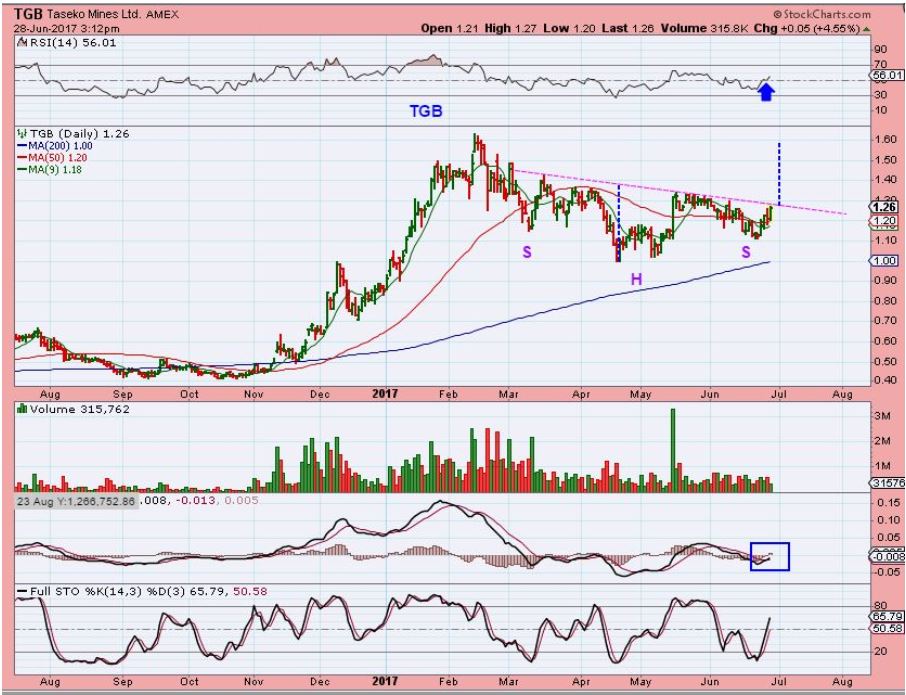
TGB – A different view, a large Inverse H&S with a MINI Inverse H&S – it remains a bullish set up.


Thanks for the great report, Alex. Last week, someone was disappointed that they didn’t participate in Miners’ drop, but I like your idea a lot – just wait for the ICL and then buy long. I have too much experience in “death by a thousand cuts” trying to go short on a short-term basis!
ditto…
**heyyy .. THAT’s probably how he cut his thumb… trying to catch a falling knife ….
**tap tap.. is this mic on?
LOL
HAPPPPPPPPPPY NEW WEEK OF TRADING ALL ……
hope you’re all enjoying … sum sum sum sum summmmmmmerTIME ….. 🙂
That’s funny Maria- I didn’t want to say anything, but I’m over it now 🙂
I actually cut it potting plants on the deck. A ceramic pot shattered & when I went to catch it, it sliced my thumb like glass. Silly.
😀
https://youtu.be/6VZhSkREYBc
🙂
I luv Bryan Adams…. giggle – back when I was studying to become an Interpreter for the deaf and hearing impaired, I had to choose a song to sign as part of my exam and I chose “summer of 69”
#GoodTimes
🙂
We played it in my band for a while, but it was a tad slow for the audiences, so we switched it up for the Ataris version of ‘Boys of summer’
to pick up the pace a bit 😉
#Notafakeband
giggle… awesome.. sooooooo .. when you host the CF gathering.. you can play it in your fake band and i can stand out front in my hot pants and knee high boots and sign it ………..
#HellFreezeOver
#RIPGLENFREY, #CG, #FAKEBAND?
Umm, what is that picture?
HA!!
#DirtyMind
#CG
.. https://uploads.disquscdn.com/images/19c25376c6fb5b8106de8c43c517ee59351178be27ab99d81734835912865a0d.jpg
haha.. ummm wrong finnnner
of course… he didnt want to make a fuss
Hey cal – It has been choppy and sometimes just the choppiness alone can cause one to doubt whether they should be long or short and so on, so we have to watch our positions daily.
I may just look for the ICL and go long to avoid the need to be in front of my computer all day.
so how do you do this, look for the ICL without being in front of a computer all day ???? : )
Experience 🙂
ICL s actually do not show up intraday
Yeah I was a bit disappointed but we also didn’t get that more HR-style short that we got in May. Probably more disappointed that I tried long at that last DCL and it didn’t really work out. Makes you want a “revenge short” to try to make it back. BUT, CFs keen analysis here helping me to realize it may be best to try some patience and wait for the setup long to come to us. Appreciate the community here helping us all to see the bigger picture sometimes. 🙂
Are u saying if we get a confirmed swing and it was day 41 it’s time to look long?
That is where it gets difficult.
1. Is this the final daily cycle and is it stretched that far ( 40+ days) , so the Miners triangle is signaling that they aren’t selling off much more and an ICL is very close at the next swing.
Or
2. Is this day 12 – and this can sell off for 2 more weeks?
or??
3. If this puts in a daily cycle low here ( Confirmed swing), could there be another to follow or is that an ICL?
I lean toward day 12 and further downside into an ICL at this point.
Thanks Alex. Great report! I’ll be traveling next week and hope I can get the computer set up in Florida before this ICL
hey H5O – Are you changing the name when U get to Florida? 🙂
Have safe travels.
I have vacationed in Siesta Key and I love the white sandy beaches there & warm gulf waters.
If your Internet is not set up & somehow we get an ICL ( like this is day 40+) and we slam into a low quickly ( I think that is less likely), maybe you could hit a coffee shop , Barnes & Noble, free internet somewhere and grab a position or two & then change your password as soon as your home is set up.
Someone else may have a better idea- I do that, but I dont trade using my phone anymore ( that’s just me)
Thanks Alex. I’ll have my I-pad, so I’ll be able to buy something, but it’l have to be pretty safe as won’t be able to watch it except maybe once a day. Will probably keep H50.
You should keep it, that way we recognize you , and when I think the lows are in, I’ll just yell “Book ’em Danno!”
Or maybe we save “Book ’em Danno!” for when you sell as in “Book those profits!” Whoo!
Alex, what are your thoughts on solars here?
They are a mixed bunch, but if you look at a 1 yr weekly, many have the lows in place last November or February.
See TAN, SPWR, CSIQ, JKS, etc
RGSE – I own it too, but it is more of a risky one, since it is still in a base and bouncing around the lows.
I am also watching the 50sma for RGSE too, and it is trying to break out lately.
SPWR WEEKLY – I got stopped out of SPWR , but I love that weekly chart. I would love to get back in around $8 ( weekly chart looks like it could get down there) *Bort*
Thanks for the details!
does the fact that gold is breaking down in the dollar euro and yen at the same time mean that something more that just a correction is going on?
I think we are seeing a correction and in time, a rally will follow.
I don’t know the meaning, but GDXJ has really exceptionally low volume in the pre-market – 15,000 shares. Maybe Nasdaq has a glitch reporting.
If anyone else is following Kirkland Lake Gold here is a news release. This company is smokin’ hot, and I would guess it is only a matter of time until they are listed on the NYSE
Kirkland Lake Gold Ltd info@klgold.com via q4websystems.com
SAND up with a gap – and looks like good volume
c’mon UEC.. u cannnnn do it ….. 😉
meanwhile, UUUU goes in wrong direction.. ffs
Miners holding positive while gold is down. I think bottom is in on Wednesday when Yellen speaks.
CLD & FCX look good to me
what about CENX?
yes, I’m looking at commodities to see if they’d make a higher low (And have) and I see that some landed on the 50sma and have turned higher, which is also rather bullish for these commodities.
When I mentioned CLD & CLF, it was because they were the first ones this a.m. that started to move higher by more than 4% in the first 15-30 minutes – after landing on & crawling along their 50sma – now others are catching up.
THANKS Alex. Your work style I really like.
You aren’t go short heh, with Gold or miners ???
Again good Job !!!
Not at this point – They are forming a triangle & triangles can move differently
hmm.. GPL… tryn to wipe sleep from eyes….?
Nice base
CLD up almost 10% –
It was only up 3% when I posted, but the volume looked good and it held the 50sma. It had a nice look to it.
Silver fighting back
Taking a shot here, $1.05 limit price for NAK.
https://www.tradingview.com/x/agjlMTx3/
I bought for $1.25 just a few minutes ago. Let’s go NAK! *bort*
Good luck, Mr. Meatball. Bort!
Bill , FWIW I think it was you asking about OWCP. I no longer own it as of this a.m.
Nice move so far
nice job…..
tracking exactly to this pattern… wouldnt THAT be nice if it continues… one can dream .. lol
https://www.tradingview.com/x/MkBCT2xL/
I’m in TGB, is that the only commodity stock not green today? – lol
ahh, so its you!..
I though Cason might have bought some.. dragged it down
Oh no, it’ me. I’ve been in it for a little while now, and I was even thinking of adding if it respects that 50sma for the next day or so. ( See last chart in the report ) 🙂
hahah.. ur bad……..
if I don’t say, it he probably will 🙂
No, the ones I own are red too. 🙂
URA could be starting to move – this new cycle in uranium could be profitable.
I own UEC only at this point.
Finally!
I have the Canadian versions of UUUU and URG. I also bought a lottery play from the Canadian Venture Exchange: GXU.V.
I own a little basket of URRE UUUU & URA, but so far its been more of a little basket case
IPI still a good looking set up , use a 50sma ( I own it from when I first put it in the reports)
IPI is a large consolidation that formed an inverse H&S, see a 1 yr chart with a 50sma.
I added at $2.50 to my starter position just in case this is ready to break out higher..
Also take a look at AGU & POT – same sector
Did you happen to look at RTK
I did see it pop last week, but I didnt know that it pulled back.
May be worth watching – thanks!
nice …..
Just got stopped out of UUUU
I do like the ‘base’ for UUUU, but it is struggling under that 50sma and is now under the 10sma, so I dont blame you that you are stopped out to keep losses at a minimum or lock in gains ….until it clears that 50sma anyway. Then it might get some legs to run with.
Silver kickin’ up a notch now.
Added 2nd load of UEC 8 days ago at 1.52 when I mentioned it in here. Unloaded half at 1.71-1.72 today. Freeing up some cash for these miners that look to be turning up
Annnnnd I sold too soon lol
.20 profit times 20,000 shares is $4000 gain…Nice trade!! 🙂
j/k but 20cents/ share gain beats a loss any day!
280 shy of that but I cant complain… plus greed has killed me a few times recently so Ill run with it
#moneybags
GORO is still right around where I sold it weeks ago and it is respecting the 50sma well. That is with GOLD selling down recently, so I am thinking that GORO could be under accumulation & may be an out performer in the future.
‘MAYBE’
Adding a starter to URRE here. Not a 100% Uranium play but its been testing that 50… With a float this size, this thing can pull when it does move…
Wowser!.. I already own some of URRE,.. but just checked my 8day indi, and its showing a potential breakout from a 12yr downtrend.
It already made a primary break in January with a +250% rally, but is now testing again at 1.48.
Tempted to double up on this evidence, and just hope its not faking on me 🙂
https://uploads.disquscdn.com/images/e53f3fb5a30303d26163c2e09e22d35603e08a7e1b6c515f72699992a3cbf72f.jpg
CLOSE UP…
https://uploads.disquscdn.com/images/78e403fe626bd66054de4af294724d6e63c5853065ffa903c503e8c3aed34451.jpg
Good luck to us both
I was just looking at it this morning for 2 reasons and I think this mornings POP might be the start of a nice run.
IT DOES HAVE RESISTANCE right now at the 50 & 200 above it, so it can bounce around, but this has a very long base.
I’m in that too.
If it breaks, I expect (at very least) a run to that 65ema, which is +300% away
well. I added more…
My charts are set with sma s….could you say target price approx of the 65ema?
Took a position in GMO… I hate miners this size but with the major MAs below, seems to be some strong support when this rally starts
Mama Maria – GPL wiping those eye bugars away
I took a starter position in CENX. I far prefer more expensive names because A) I can control my risk % better and B) I can therefore sleep better at night. It’s just my way of trading that works for me while applying CFology.
I also own RGLD and will probably add to PARR today.
IPI .. ….. niccce
Wow – up over 10% now. Glad I added when I did, looks like it might break out on that inverse H&S from last weeks reports
AVP cant catch a break…
Just thinking out loud – observations
Again we have what look like Bullish engulfing on GDX & GDXJ ( We had it 3 or 4 days ago in GDX, but it didnt hold up).
And again we have many Miners that ignored the sell off in Gold recently, While others are at the lows.
SAND – good
Goro still looking good,
RGLD looks excellent,
GG, NEM, ABX – not so great, below the MAY lows, somewhat near the Dec lows. It is all about the follow through or lack of follow through going forward.
tricky stuff
https://uploads.disquscdn.com/images/7af15fc367bb7d88ea7b820bca50390f57c37580c29331306d7dbdcfa74055ca.png SAND, OR, FCX…royalty companies looking good!
I do like sand, watch that 200sma though.
3D Printing:
PRNT, VJET, DDD….. looking good.
stockcharts.com changed the Summary format again….hate that !
UUUU – Just took offf
Where did that volume come from – Short cover? looks nice with that reversal.
It looks like a short cover.. That was a quick Spike
20 days short interest
I was watching it this morning and wasn’t giving it a second glance with UT+RA looking good, it looked weak. nice catch when she broke ( I was outside) . Glad you mentioned it.
AG.. nice Viking 😉
Got lucky on that one 🙂
GGB still kicking butt!.
I am starting to think that many of these Miners were holding up well, and a DCL could be in place.
Is it the ICL? It is a tough call because of the triangle in Miners, but it would not hurt to hold a miner or two here with a stop below the recent lows.
May just be a trade ? may be longer term, time will tell, but we have some like GPL, AG, CDE, GG, etc etc coming right off of the lows. Seems there will be more chance of upside if a dcl is in place, than downside risk.
I took GPL once Marie pointed it out. I took that one off my WL for a while.. We ended on bad terms before…
I actually had a great run with that last fall and sold at a good time, so I have been waiting for it and now it does look rather nice 🙂
yes …. the Original giraffe….
https://uploads.disquscdn.com/images/564fe9547fa4c98456611cfe76cfdf5e48bdd5c498598c0a2959d25926c28042.jpg
man GLBS big reversal… does it look like shippers could pop CF …. stop playing Martha Stewart in your garden and get back to the charts….
Some do , others did and are dropping ( She SHIP).
I was on my bike ….Nosy!! 🙂
me too
glady…. but who is she ship and how do i finder her….
https://uploads.disquscdn.com/images/533d22a404495f7d30e50f39debd62123cbe74d7661fce97f5133290f4d1170a.gif …
Corrected… “see ‘SHIP’ for example 🙂
Alex, do you think that JNUG is real today or do you think a pullback is in the cards? I could sell before the close for safety. Any thoughts?
sold out of my JNUG with a bit of profit but still own a a canadian miner 2x etf
Look at this for example, and there are plenty of others.
Downside risk is small with a stop under recent lows, but this set up is a bullish set up .
Even if this was a DCL and an ICL was ahead, it should run at least to the 200sma, and that is $1.25 to $1.50 roughly.
Break out and back test complete. Still within a ‘base’ , but looks like it wants to move higher.
https://uploads.disquscdn.com/images/a1570b4f44e6b698c0e67b964748b391fe17005bca569cb3001cc89b32d54f9e.jpg
I would like to but that would be like dating an old girlfriend with a drinking problem.
LOL I posted something similar a few moments ago.. Howver I took the trade anyway lol
Look at the run from OCT to FEB. She is fun at parties 🙂
Harvesting the rest of my Bond short profits at these levels…..
Should be positive for Metals if Bonds start another wave up…..
If the Yen also starts a new wave up, now we might have something in Metals….
Waiting to pick up some SMH on a dip…..corrective wave 4 complete imo…..beginning final wave 5 ?
hmmmm… cytr …
hey mama you bin keepin an eye on HPJ?… may be wrapping up on its correction.
i have… and i ALMOST wrote u today about it …. it’s on my WL always… ;o)
Tx SOG ….
https://uploads.disquscdn.com/images/9312c095e56f58bc5664dfc9796428cd2fab506390f2f8e52279e1ebd2936035.jpg
ARNA pop on positive phase 2 results on patients with pulmonary hyper tension
I bot some TQQQ today because it looked good on my daily chart and I notice that Alex said a close above the 10 day SMA would signal that a DCL is in. QQQ and TQQQ both closed above their 10 day SMA today. Will be watching closely, adding on follow through to the upside and selling on a deep drop. I HOPE I finally get an UP trend that I can ride for a few weeks, but will bail if it doesn’t materialize. Also picked up a little AG for the PM side. Miners are sill well below their 10 day SMA so the up trend remains to be proven.
Agree Steve !
Just keep an eye on it for a bit, Steve. In this report above, I mentioned that NASDAQ could be just a back test, and it is still below that 50sma ( which is what it would be back testing. If you go back through Friday & Thursday, I was also cautioning that we COULD get that ICL drop, and I’d really like to see NASDAQ close above the 50sma- but you may be fine. It could easily do that tomorrow. ( Just keep an eye on things until it closes back above that 50).
For a swing confirmed, I look for a close above the 10sma, and a trend line break on the upside.
have you ever traded REEMF?
Rare Earth correct?
yes
A long time ago. I trade rare earths when they were all listed
I actually like the rare earth etf chart and have it for tonights report ( without todays data – I captured it pre-market).
Yes I agree, this could be a fake pop … so I’m watching closely. Will not hang around too long if it starts going the wrong way and I didn’t buy “heavy” as I normally would if I had more confidence. I try to trade longer term (weeks to months) but I still watch every day to make sure my positions are on track with what I expect.
ACTUALLY – I didnt think it closed above the 50sma, but the chart updated and it has.
That is a plus 🙂
VALE ….
back from the dead
I know …. can it be trusted ?
I had a good run with her before… But I dont like her much lol
She is a fickle one. 😉
i could have sworn she was a he …..
https://uploads.disquscdn.com/images/0f348f499eda6387739adafea987790df54ddb851a99056bf1319e1289235f4b.gif
He/She/It… AS long as I get paid I dont care what it posses as in its free time
Some of the commodities did well, a few up 5-9%. CLD up almost 10%. They look like higher lows and look to have bottomed.
TGB was down 🙁 Hope to see that one turn around.
CEI… why do i miss all the fun ones
Am I the only one in 3D printing ?
Nope – I took a starter in VJET today, actually per your reminder
Welcome aboard
Now finally also bottom “channel” hit and provided a nice bounce. Expect stupid meaningless “test” of low.
https://uploads.disquscdn.com/images/927cef2f5e8dc8c0dc2644eb00dc1ef9220eb84fb86c7ec667bbd010fc1f4c45.png
If we fall as much out on the upside as downside, that would target approx 1350.
Nord….Thank-you.
Excellent done, indeed now the hope to at least 1350
oh snap… BTG…
Ken – SOG — any EWrs ..feel free to chime in …. would you count this wave like this in AVEO …
don’t want to overstay my welcome…
I “think” it’s in the 5th of 3 ….
https://www.tradingview.com/x/XNekhdHu/
working late here tonite, Myhrr?
your ew count looks like wot i would give it
Wowsa ! That little pharma is no longer little, do you know the drug that is performing well for the FDA?
EW wise that will also work for me but that might be a tough wave 4 correction to catch at its low for the final wave 5 up. But certainly worth watching, really big move % wise.
Cool thanks
hmmm TRTC…interessssting ….
ps. cute pics for your reports these past few reports…
*I just look at pics — don’t read report…
LOL … kiddddddding … what’s a morning and fresh coffee w/o blah blah blah…
**smirk
Since I know many are watching miners, her’s a long-tail candle for NUGT in today’s AH.
The “target price” (low of the wick) is $26.58 near the “break out” point on my 15 min chart for today.
A pullback after a big up day in miners is normal, so it will be interesting to see if this one “hits.”
https://uploads.disquscdn.com/images/fabde2948f84cdd1bfc72474caafeb21924b0c8283a8a4ec5a738512cd0eb39a.png
Yes….I will be interested to see if a pullback is forthcoming. Thanks Steve.
here is a little news about Taseko which might account for the weakness today in the stock price.
https://www.reuters.com/article/us-canada-wildfire-idUSKBN19V23X
I AM WORKING ON A VERY LONG REPORT – I SHOULD RELEASE IT BY 8 A.M.
I AM FOCUSING ON GOLD & MINERS – AND COMMODITES.
THE REPORT HAS BEEN RELEASED, I AM PROOF READING IT AFTER RELEASE & WILL FIX TYPOS NOW 🙂