
JULY 16 WEEKEND REPORT
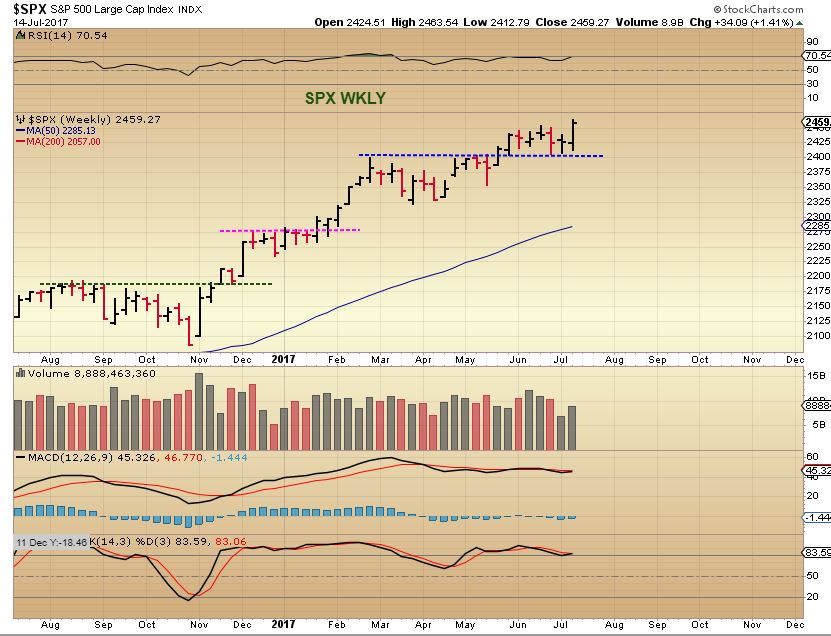
SPX – When we gapped up over that trend line ( Again, see April) and held above the 50sma, it was obvious that the bull market remains in tact. The SPX also experienced follow through last week. I’m not saying that we will drop soon, but that last Gap in April was filled at the next dcl as a back test of the break out. If we get more sideways movement than upward , that may be what is happening.

SPX WEEKLY – Bullish, though extremely overbought.
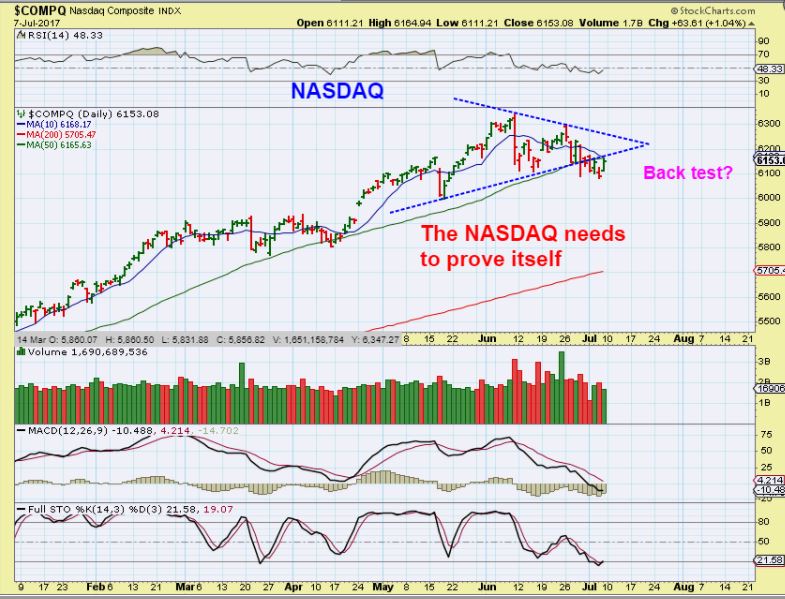
The NASDAQ July 7 th – We needed to see the NASDAQ recover
1. The 50sma
2. The Trend line , and
3. The 10sma, if it did, that would be a buy on Monday- and it was.
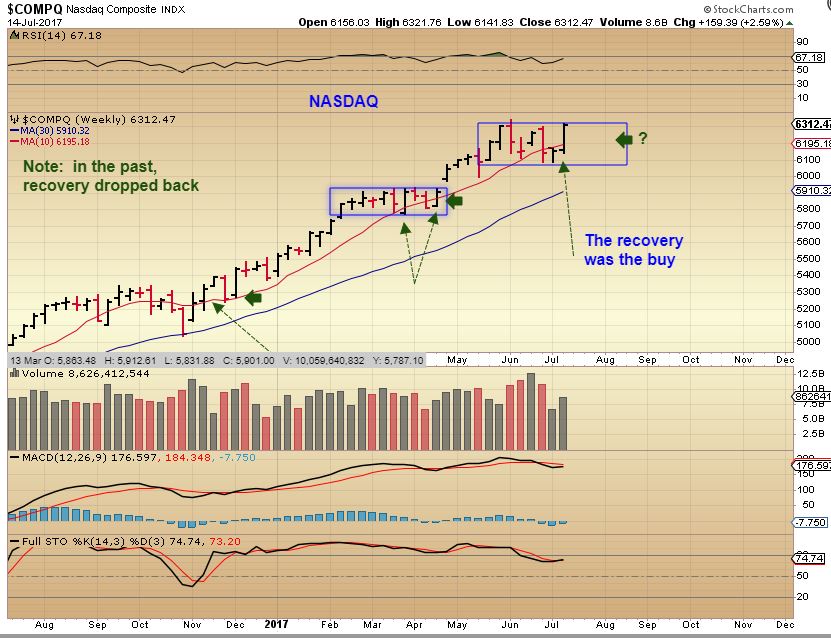
NASDAQ WKLY – And follow through last week made a bullish looking weekly chart, as the NASDAQ is back at the highs. As a side note, I just wanted to point out that prior drops below the 10ma on a wkly that then recovered, did drop 1 more time as seen here. That may or may not happen, just a side note for future reference.
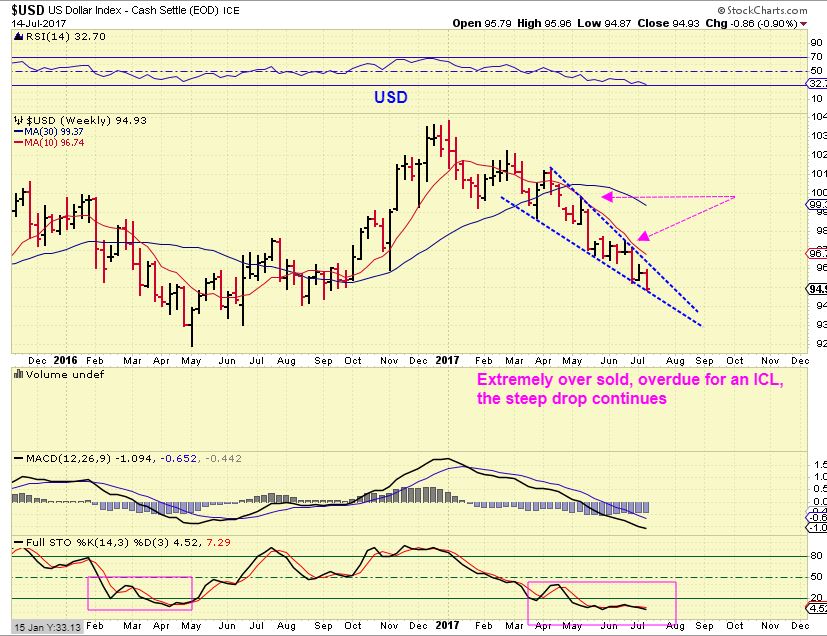
USD WKLY- The USD is overdue for a low and an ICL, but it just keeps breaking down. A break from this wedge would be short term bullish. That conflicts with Golds expectations for now. The USD & GILD are no longer tightly held in an inverse relationship, but it is common for Gold to drop when the USD strengthens. Right now, however, Gold looks bullish, as you will see.
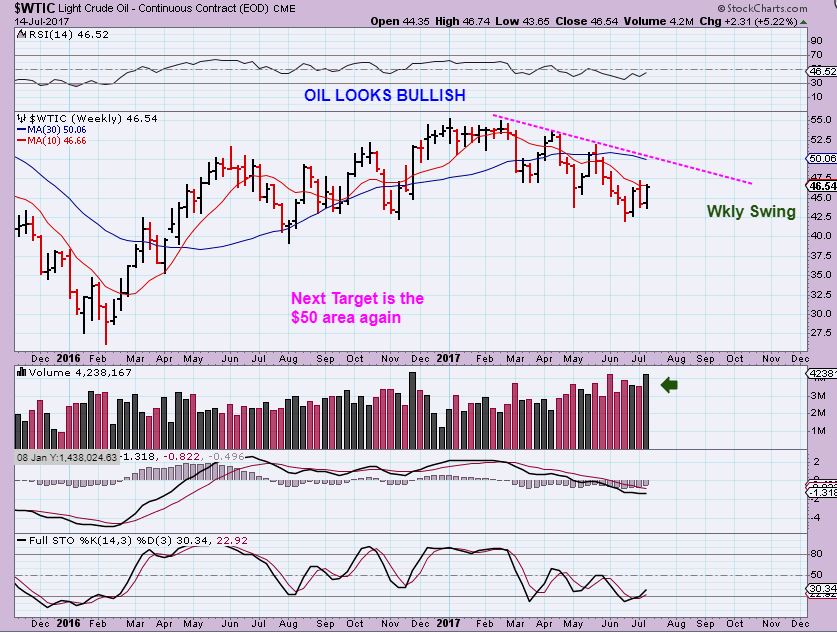
OIL WEEKLY – I have been saying that OILs low 3 weeks ago looked real. It has proven to at least be a dcl, but many energy stocks are still not quite following along, so the ICL could still be ahead. The ones that I have been tracking as possible leaders do remain healthy however ( ERF, RES, AREX, etc).
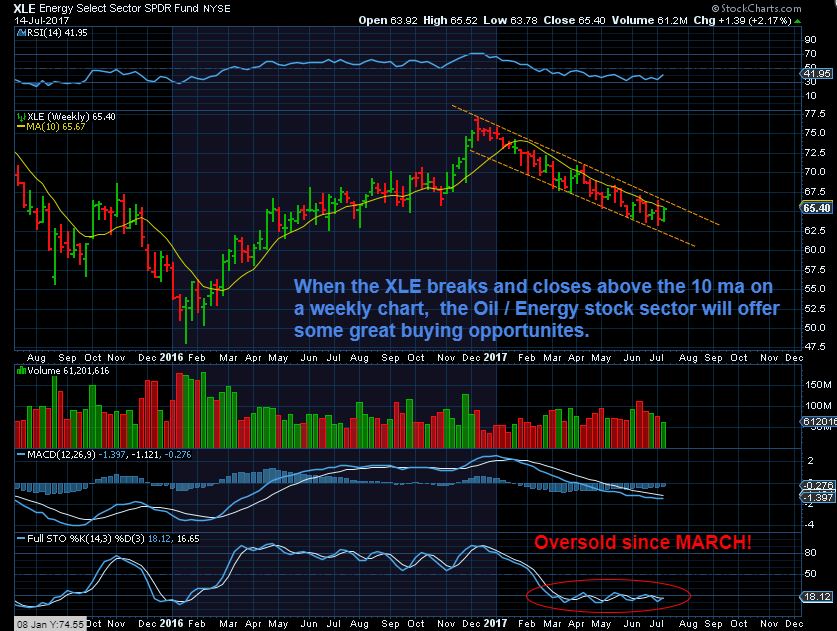
XLE WEEKLY – please read the chart
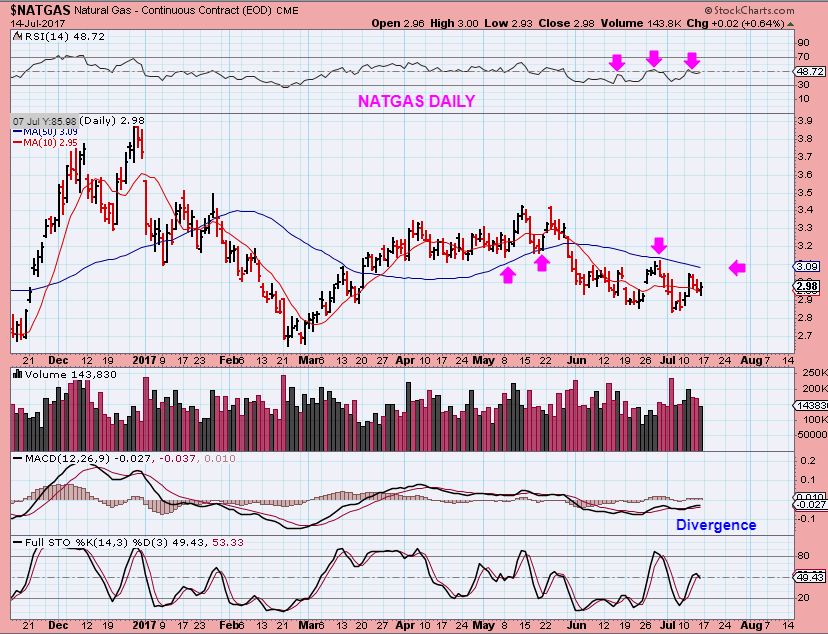
NATGAS DAILY – Natgas is 50/50 to me right now. We had a slam down , high volume low and that could be bought with a stop right under it. We also see divergence in the MACD, and it closed back above the 10sma, so these are bullish signs of improvement. A break above the 50sma would be very helpful.
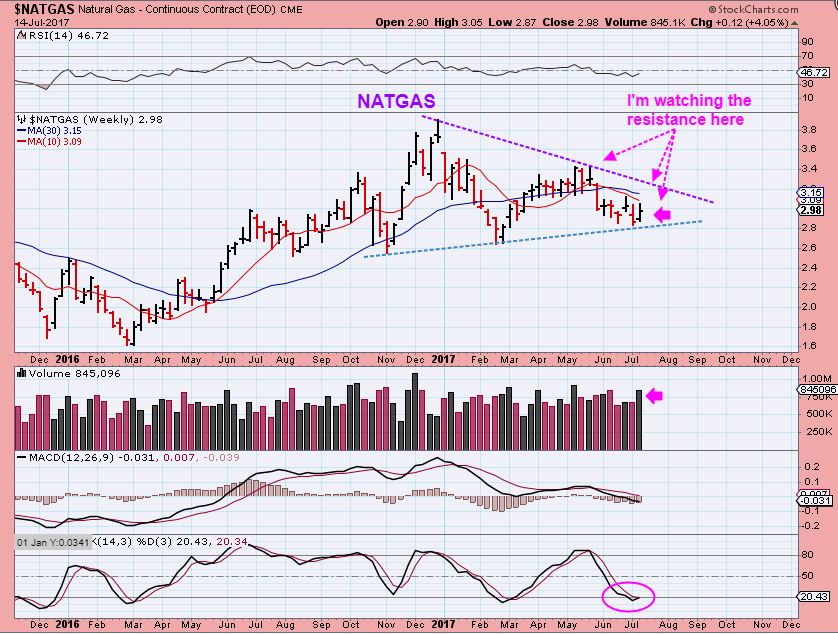
NATGAS DAILY – The WEEKLY chart is nearing a conclusion. We did have a stronger volume week higher so far and it is oversold.
GOLD, SILVER, & MINERS
After doing a little additional research this weekend, I am really starting to see some very bullish looking developments in this sector. There is nothing wrong with being patient or cautious, but as the signs continue to add up, I am thinking that holding at least a couple of Miners would be prudent. I mentioned a few in my report entitled , “What Am I Seeing Here..” earlier in the week. Let’s take a look at what has happened last week, and since last weekends report.
.
C.O.T. – This is getting quite Bullish, and now it is quite a bit lower than the ICL of Dec 2016 . AN ICL in Gold could be in place with this recent low & COT reading.
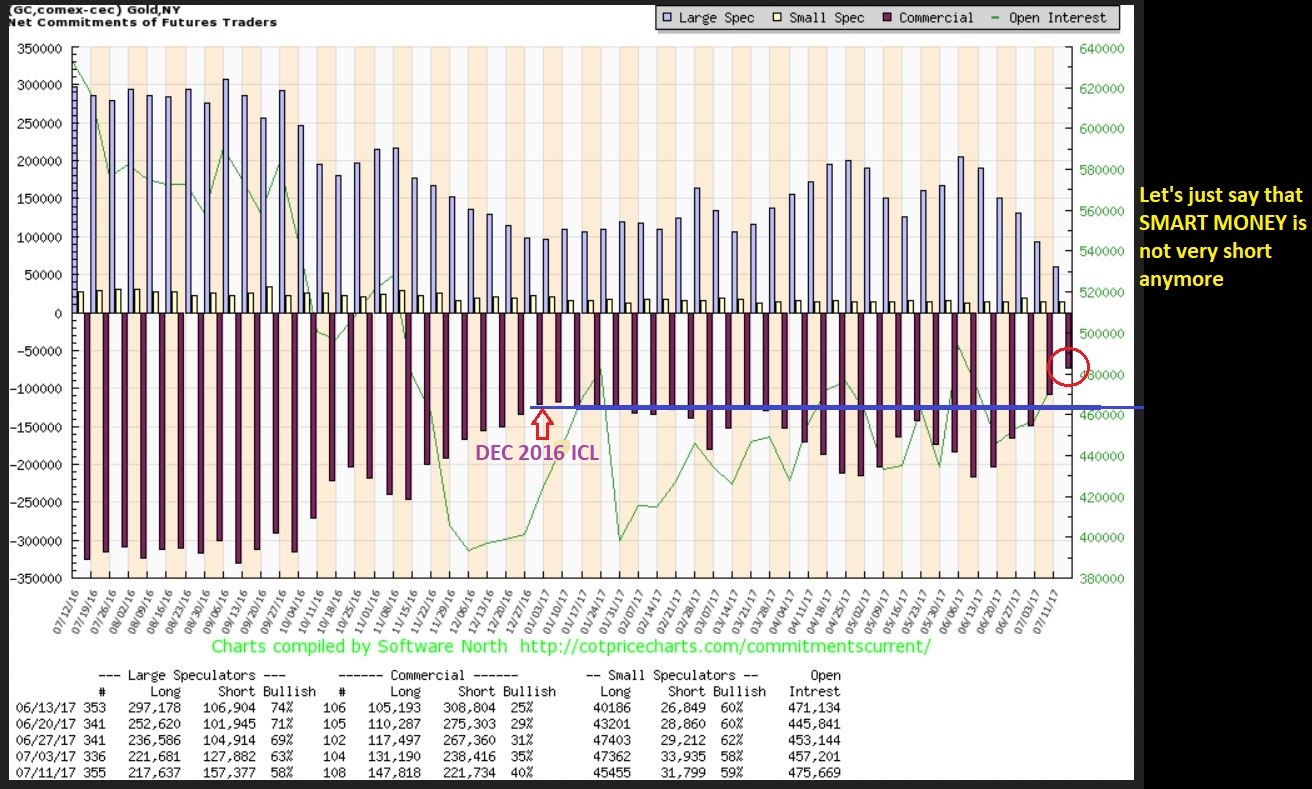
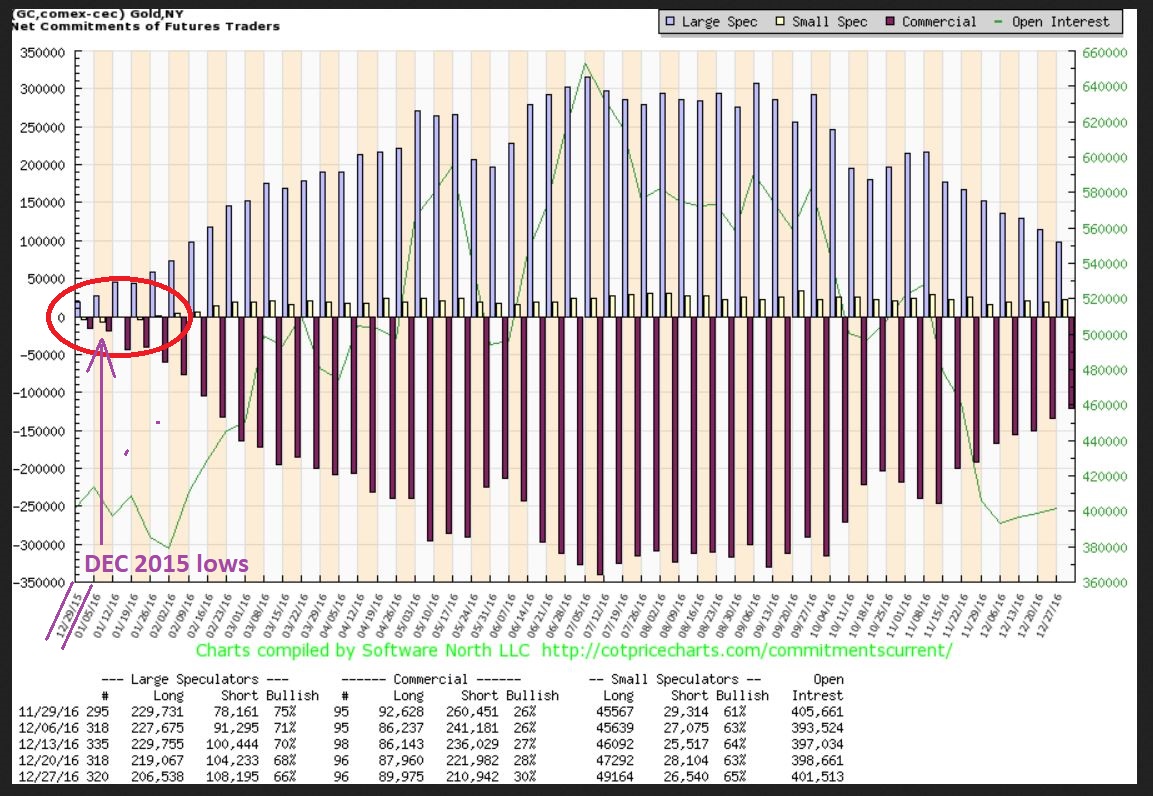
As a reminder, Last week I pointed out that the Smart Money short positions had been extremely low at the ICL of Dec 2015. So I do not use current COT readings as a solid sign of an ICL, but it is definitely encouraging and Bullish ( Especially when it is below last Dec 2016 ICL levels). Again, we may have an ICL in place, and I did a report last week pointing out that many Miners are already coming out of lows nicely.
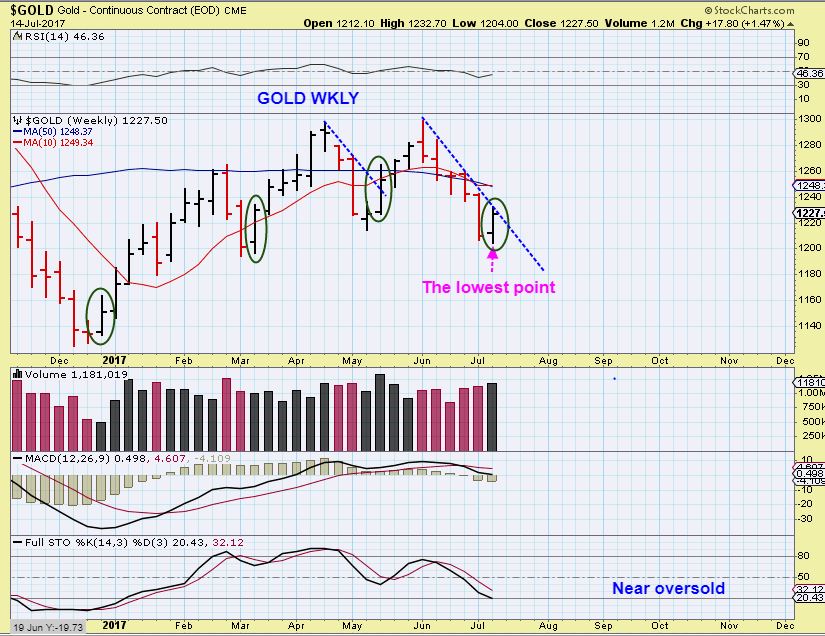
GOLD WEEKLY – Large weekly reversals can lead to higher price ( DCLs or ICLs), and the last few saw 4 or 5 weeks higher, but that was during the uptrend. Is Gold starting the next uptrend after putting in an ICL? We need more time to know for sure, but many things look good after last week. This trend line being broken is the next goal, and then recovering the wkly 10ma.
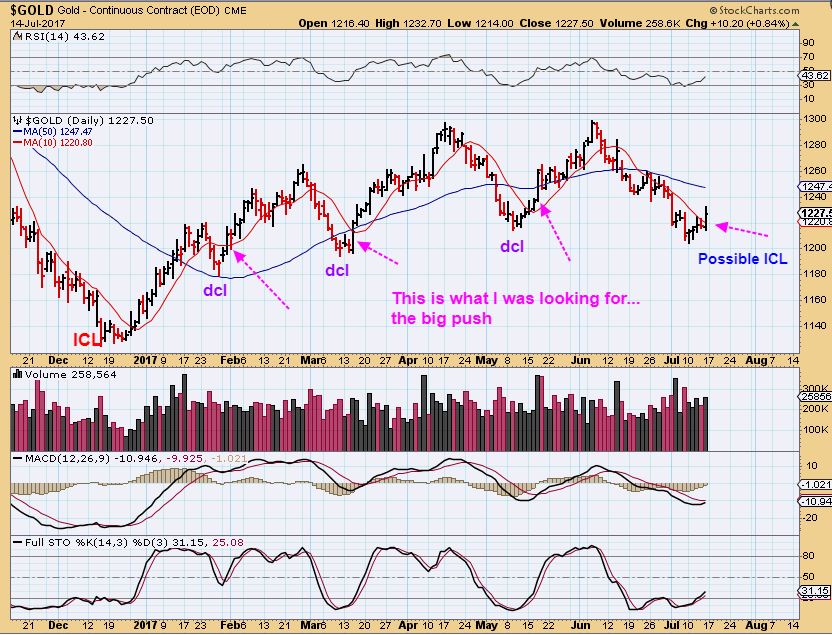
GOLD – On this July 12 chart, I was pointing out that even though it got rejected at the 10sma on day 3, we had seen that in the past, and then we got a burst higher over the 10sma. We also made new lows , so we have a failed daily cycle, something that I look for when looking for an ICL.
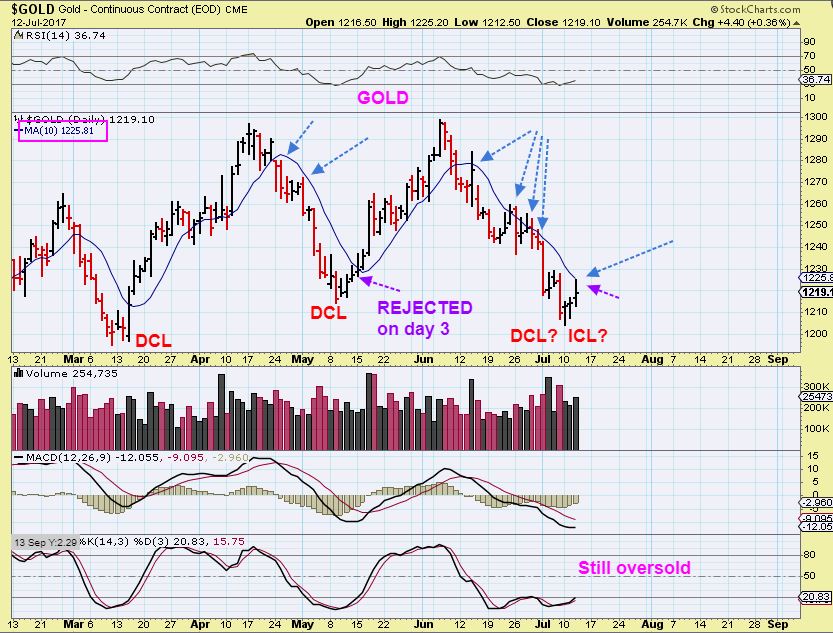
GOLD DAILY – We got a nice solid burst higher above that 10sma on Friday. This breaks the overhead trend line and closing over the 10sma is bullish ( Dcl or ICL in place). If you took a position when I did on Friday or Monday in Miners ( GDX, GDXJ, Individual basket, etc) this is what you wanted to see and now you can raise stops to at least break even and avoid any losses if this did roll over into another drop. This is taking it 1 step at a time after each successful move forward, and friday added a high volume burst higher. Shorts may be starting to cover.
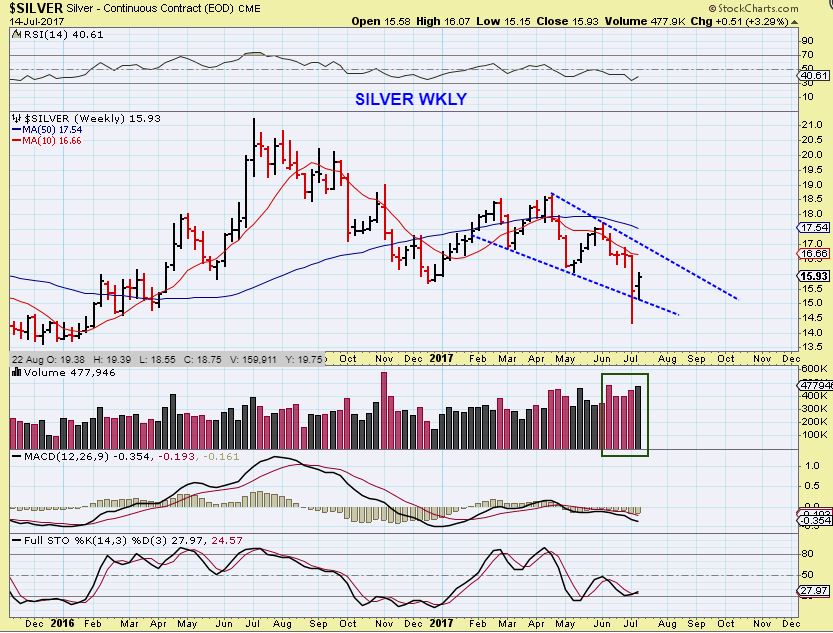
SILVER WEEKLY- Silver is a tad behind Gold, but it recovered from that flash crash and closed near last weeks highs.
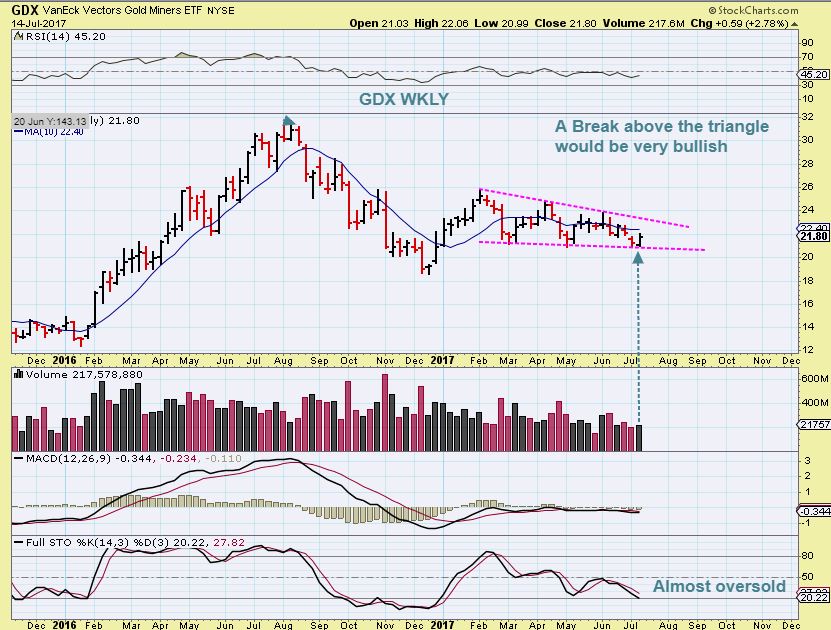
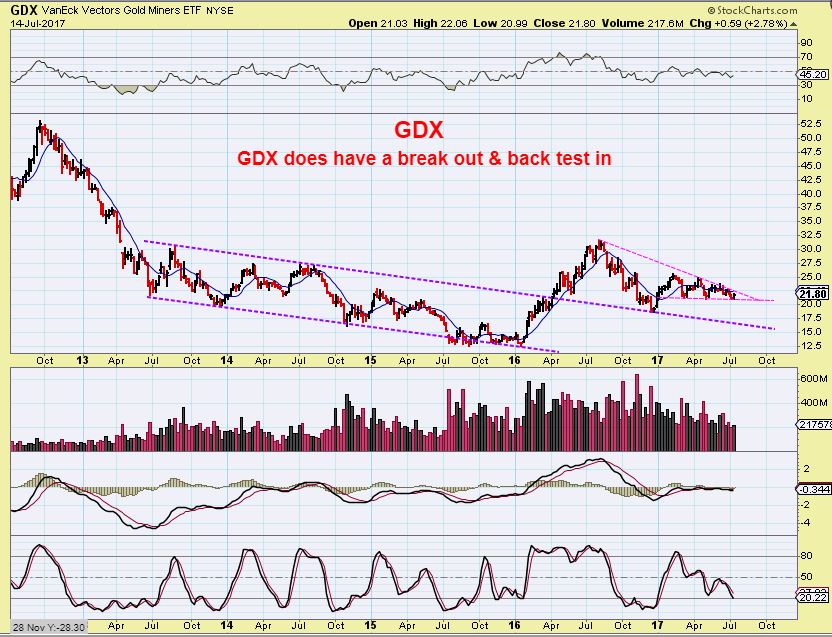
GDX WEEKLY #1- This is a Big picture of a triangular consolidation. You can see that THE LOWS were near $12 in early 2016. At this point, this is a normal consolidation so far after a mountain of gains in 2016. If shorts start to cover, this could rally. ALSO PLEASE NOTICE THAT IF AN ICL WERE IN PLACE, NO ONE HAS ‘MISSED THE MOVE” in MINERS. The next run will be very profitable.
GDX WEEKLY #2 – This could be a break out and back test low.
ALSO PLEASE NOTICE THAT IF AN ICL WERE IN PLACE, NO ONE HAS ‘MISSED THE MOVE” in MINERS. The next run will be very profitable. 🙂
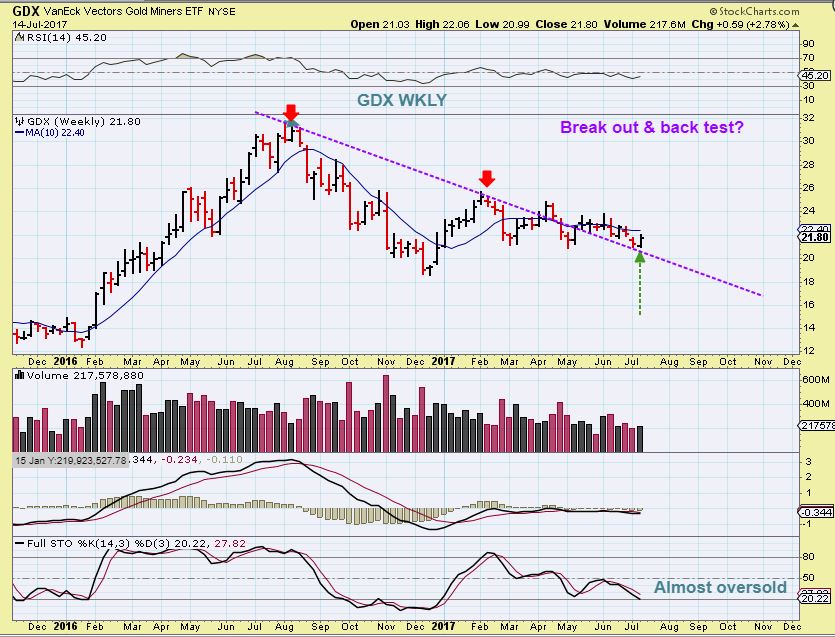
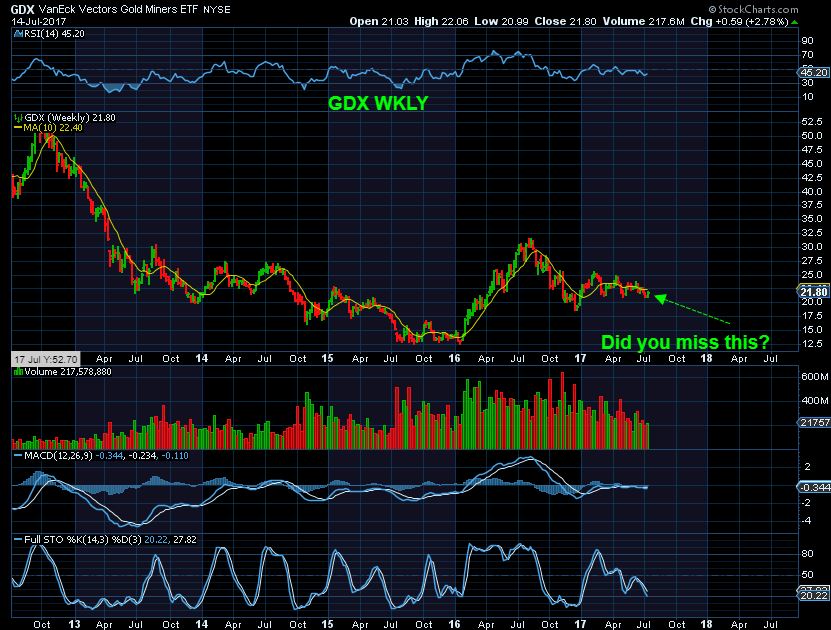
GDX WKLY #3 – This Bigger picture does show that gold already had a break out and a back test for the first step out of the bear market sell off. Could it get tested again? Yes, but I would have to view it as less likely timing-wise. ALSO PLEASE NOTICE THAT IF AN ICL WERE IN PLACE, NO ONE HAS ‘MISSED THE MOVE” in MINERS. The next run will be very profitable, patience is often rewarded.
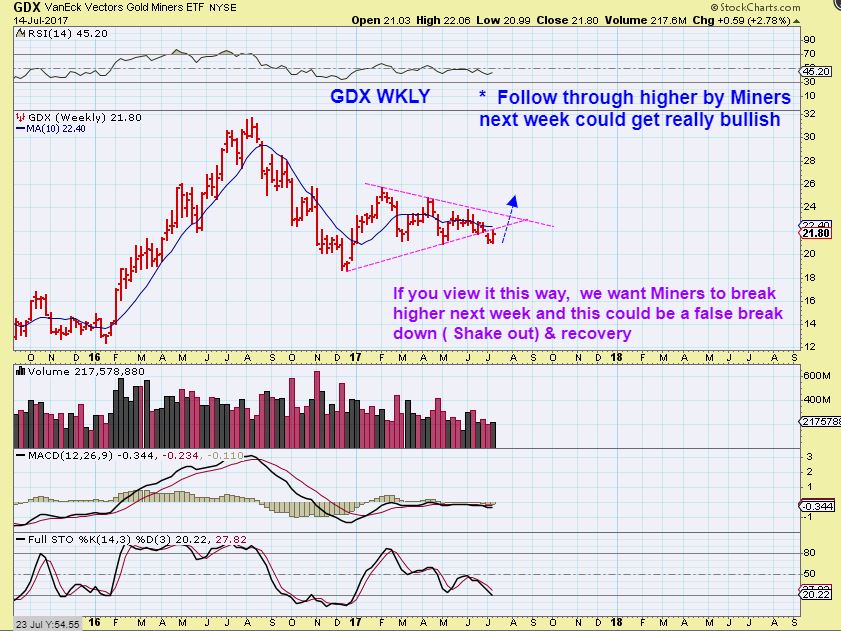
GDX WKLY – And this would be a more bearish view IF we did not get any follow through higher next week. It would be a break down & a back test, possibly about to be rejected below the 10 MA wkly. Follow through Higher next week would really be Bullish looking, so we will let the markets tell us what is going on in due time.
SO this is basically the time when I like to step back and get away from the day – to – day wiggles and look at the bigger picture. Things continue to basically go as expected in this view. The General markets have recovered from their dip under the 50sma, and continue bullishly higher as a bull market that claws back after each bear attach ( DCL). Oil has put in another new low, and Natgas is a little bit more 50/50 at this point. Some Energy stocks are shaping up, while others remain at the lows, so that section requires either being selective or continuing to be patient ( My picks of AREX, ERF, RES, and a few others recently do hold up fine). I am starting to see other Energy Stocks follow too. Commodity stocks are acting well again, and I like many of those charts ( X, CLF, VALE, HBM, AKS, TGB, WRN, etc etc ) . See prior reports. These are bullish looking set ups.
The Precious Metals Sector is also playing out as expected with the recent low in place. I’ll continue to monitor this area to decipher whether we are seeing an ICL or another DCL. I actually am seeing more & more bullishness in this area, and I think many Miners that have been consolidating for months really want to run higher soon. Some have already been doing so. Check out RGLD I explained this in last Mondays report, but I will cover this in more detail in future reports. 🙂
Enjoy the rest of your weekend,
~ALEX
.
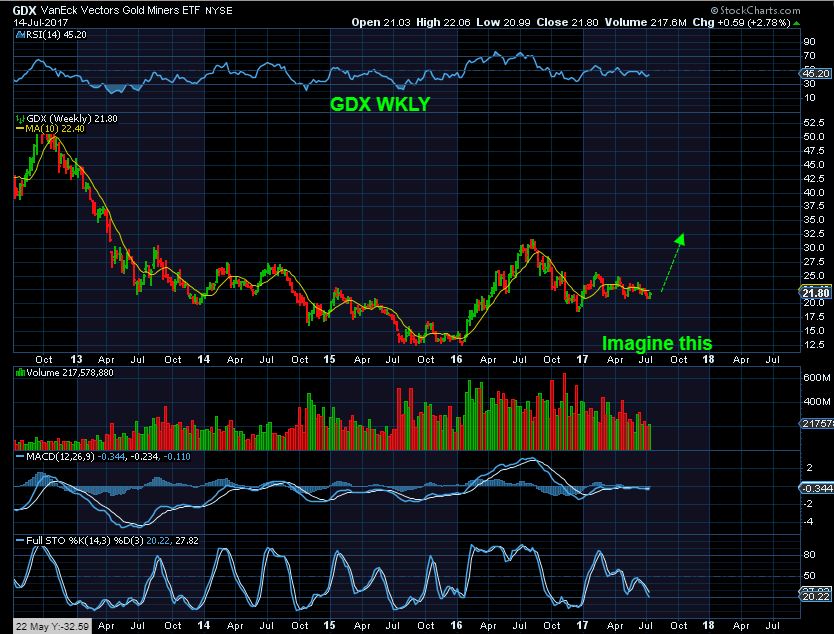
GDX WKLY – PLEASE LOOK AT THE SIZE OF THE MOVE FROM LAST WEEK ON GDX ( SEE THE CHART) . NO ONE HAS ‘MISSED THE MOVE” in MINERS. The next run will be very profitable.
GDX WEEKLY – THAT MOVE LAST WEEK WAS NOTHING COMPARED TO WHAT COULD FOLLOW. Look at the size of last weeks candle vs the move drawn here. So if you are being patient or cautious, and you see some of us buying Miners, do not worry. When the ICL is known to be in place, many miners will start to run in a very profitable manner. These consolidations have been large consolidations, often leading to big moves.
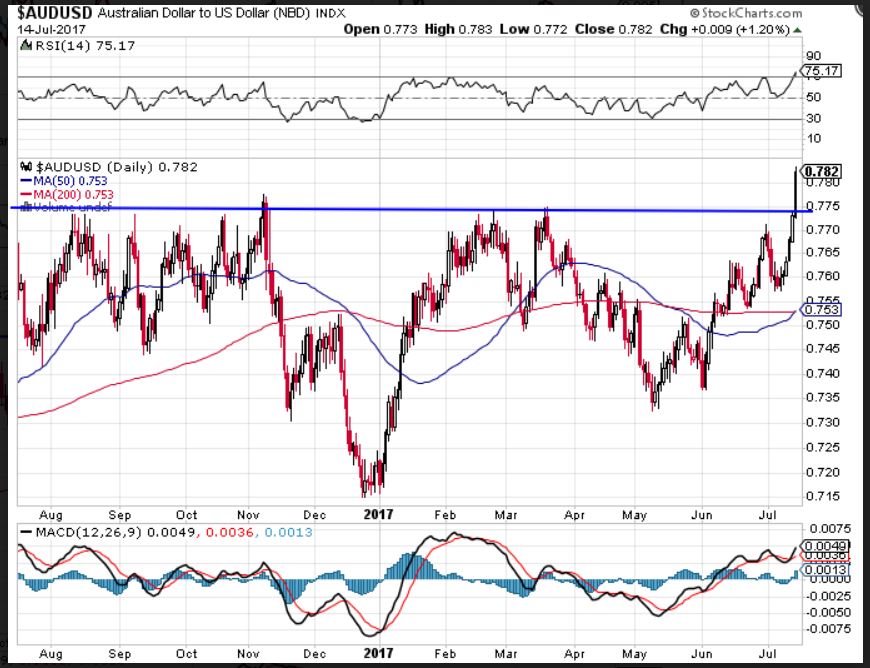
MATT from Australia writes to me about 1 or 2 times a year, so it must be important right ? 🙂 Well he wrote while I was putting this report together to share this with me. The Australian Dollar is breaking out VS the USD. Why is this important?
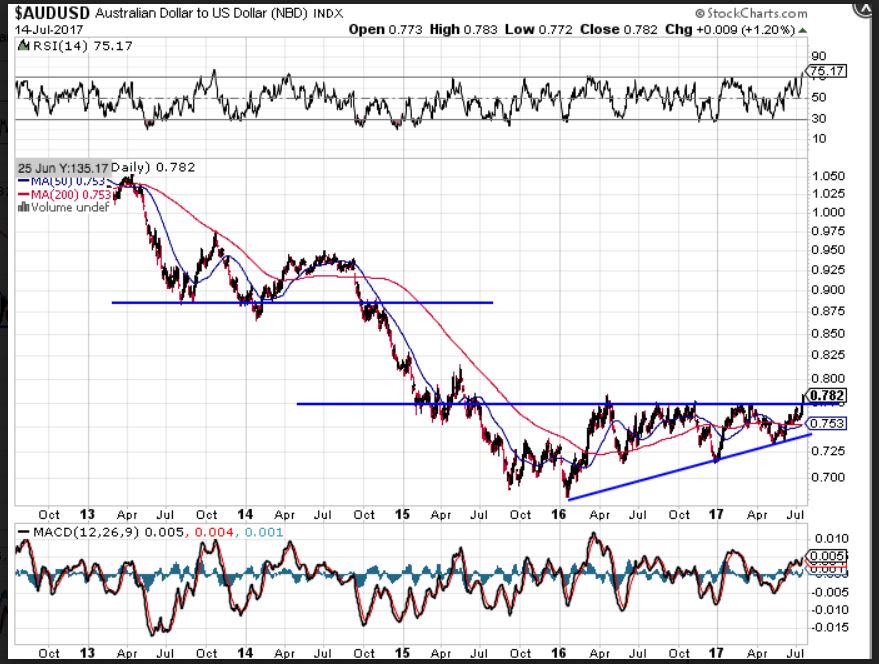
Much like Canada , Australia is known as a having a big resource economy. This could also point to inflation in the commodities and precious metals area, leading to a revival in those sectors too. Thanks Matt! 🙂


Yes, noticed the Aussie$ move – it will end up PAR and more.
I am diversified in Aus and New Zealand long ago in prep for US$ fall.
You have to file annual tax forms for anything overseas so more CPA fees
to prepare them . . . .
Slammin report chotfreak…damn couple of those GDX charts/trendlines belong in a freekn museum.. phewwwWee (wiping the sweat beads from my brow)
… Only thing I’m NOT clear on is if we missed the move in miners….
*Snicker….
meow
Thank Maria – I’ll try to clear that up in future reports -lol
It is a little confusing that we didn’t miss a move in miners. Usually an ICl doesn’t wait for anyone and really takes off. Could it be a 6th cycle? Never heard of that?……
well .. if we get a spike up for ‘4’ (stop out shorts) followed by a slam down for 5 (stop out longs) THEN it will take off and make EVERYONE chase. He’s spoke of one more slam down… 855x (ad nauseum) lol
MEOW
Do you trade in and out of all that? #CG
as of this am.. im not in any gold miners… just trading bios and weed … oh and GMO -swinging
SHAZAMMMM
Like this … FYI
https://www.tradingview.com/x/wEeSNihs/
I missed this comment
Actually go back and look at Dec 2016 ICL…spent plenty of time at the lows.
Dec 2015 spent weeks at the lows.
The point That I was making in the report is that it was only day 5. A move out of an ICL runs for at least 2 daily cycles. That is 2 months. That can be 30+ trading days to the possible Peak, and maybe it peaks in the 3rd daily cycle.
People worry if they miss a day or two out of the lows and start asking, “Did we just miss the move?” The move lasts for weeks.
Alex, I skim your reports looking for signs of the elusive “ICL” signal to go heavy in miners, which I only do once or twice a year when the timing seems right. So I personally appreciate your bold red warnings that “you haven’t missed it yet” … I don’t have time to digest all of your charts and analysis as thoroughly as I would like and I’m a very simple trader, I’m usually only in TQQQ and/or a few PM positions. So please keep putting the big red comments in the reports to help us skimmers! Thanks!
#verbose
ahhhahahahah
Thanks Alex! Great report as usual. Following on my I-Pad. Now in Florida, but won’t be set up with the computer until mid-week. Still holding 1000 shares of GDX.
SO far, so good. This mornings little pop helps, and Mid week is not as bad as you originally though, I think.
Great report…..
Thanks David, hope you had a good weekend:)
Ended up selling my UWT on the Friday AM pop. I still think we hit a low in oil, but maybe not an ICL. XLE and other energy stocks just didn’t react well enough. Kind of the same deal with gold & miners. They look good. But not great. When we have hit true ICLs in the past it’s really been a rocket ship. Anyway, the crude trade has been MUCH better than the energy stocks. I still have just a bit of WLL and OAS, but I don’t recommend either trade right now. Just wanted to take profits on UWT while I could since 3x can get pretty crazy sometime. If we really hit a solid low then we’ll have other entries.
Just wish I hadn’t missed the move in miners already. HA!!!
There’s always next year 🙂
Lol…Great reply!!
I’m hoping there is always next month. Bring on the ICL!
Great report Alex…… especially the last bit!!! Cheers mate! Our conversations are always important 😉
There he is, Top of the morning to ya – Mate! ( It’s probably a winter evening there as I write actually). Thanks for the charts and I always enjoy hearing from you…as rare as it is. : )
“Top of the morning”???? He’s not a leprechaun, Alex. 😉
ha ha ha
LOL – I figured that I had to reply to this before you delete it : )
I would have said, “Let’s throw another shrimp on the Barbeeee, Mate !”, but that’s how I amswer all his emails 🙂
hey little leprechaun… can u tell me what u think of PPHM…. slapped down by the big bad bully – 200day? or heading to 8ish
and TEUM pretty please and thank u … mate
Check out CNBX on a weekly chart with the 10 & 50sma. I know you were stalking it on a daily – both look very good.
Today is a break out if it holds
:o) yes daddy… i own it… tx https://uploads.disquscdn.com/images/70ef30743868a2a42f0aa813b6ecafce0435f9831f9cde746e8a63a8645939b7.png
CNBX now up 8%
Yay!
Almost 20% now – I think we have a winner 🙂
🙂
shh
watch out kids.. 8 day chart says countertrend with resistance directly above
https://uploads.disquscdn.com/images/c66537f361702b3e1ec9b7e27e4095fcc20ea1dbdcd1886563d24cddfd493af3.jpg
I am seeing so many MJ stocks setting up & breaking out in a strong manner.
I may have to do with an upcoming vote for the entire country to legalize recreational MJ.
The shrimps are safe for now Alex!! Way too cold for BBQ’s right now! Mind you, cold for us is like 65 degrees Farenheight haha. Soon be barbee’n’beers weather again for us while you will be snowed in under some polar vortex ice freeze :-/
ha haha.. omg so spoiled..
im envious
60 degree weather!! – My barbecue is running strong then- too cold is below zero Fahrenheit , and thats only becuz the lid if frozen shut 🙂
off the top of ur head matie… do u recall the biggest gainers in the last run up .. or “1 or A” in EW world
Of what?
sorry .. LOL … well miners but if u know energy .. ill take that. Only if u know.. if not ill research that in my spare time..
*when we have an 8day week….
😉
Off the top of my head….I do not . Sorry
np
do you mean the run-up since last december?.. or jan 2016?
Jan 2016 … sorry– i just a$$ume everyone is in my head with me…. lol
#BadMaria
ok Mammamamma.. here goes with rounded gains…
(btw..some made lows earlier in 2015)
NAK 1600%
GSV 1100%
AXU 1000%
CDE 900%
HMY 820%
AUMN 800%
TRX 800%
VGZ 800%
WRN 800%
ALO(TGD) 750%
AG 700%
DRD 700%
GPL 700%
GSS 700%
THM 660%
MUX 650%
GORO 600%
for comparison…
JNUG 1500%
NUGT 900%
GDXJ 200%
GDX 150%
refresh f5.. to remove spaces
OH MY WORD …. as my Daddy always said.. Ask and you shall receive… 😉
THX SOG!!
https://uploads.disquscdn.com/images/545f13b9a5b1353444ef14597e0e403fc5e81a669b71fe6f91257a28608bcf28.gif
i always meant to do a list for myself before next leg up.. you just spurred me on to do it now 🙂
btw.. i’ve only listed those above 600%. if any others you wanna know individually, just ask
lol .. nah .. i THINK I’ll be ok … 1.60% of those is good enuff .. but hey I’ll take 2.61 … LOL ‘
wooop …
great info tx
Interesting to see 3x etfs out perform their own expectations
GDX up 150% and GDXJ up 200%, you would expect close to 3x results.
Interesting list SOG, thanks.
P.S. – No disclaimer 🙂
* “Past performance is no guarantee of future performance. Please do you own due diligence, etc. etc. etc. “
yes.. of course… :0)
Thanks for this.
those gains seem unreal.. when i’m sat here cheering on an 8% rise in TRX
here are the best of the rest, with up to 300% gain…
BTG 500
EXK 500
BVN 400
FSM 400
HL 400
IAG 400
SBGL 400
XRA 400
AGI 350
ASM 350
AUY 350
KGC 350
SA 350
SSRI 320
AAU 300
ABX 300
EGI 300
PAAS 300
PGC 300
RIC 300 (this was actually up 1200% in total, from late 2013)
u dah man ….
being the autistic completionist pedant that i am.., i might even post the also-rans shortly
also ran…
AKG 270
SIL 250
NGD 250
SAND 250
KLDX 250
GFI 220
WPM 200
MAG 200
PVG 200
PZG 200
NEM 200
AEM 190
EGO 170
TAHO 160
NG 150
TRQ 150
XPL 140
GG 110
FNV 100
I’ll take any of that!!!
Sounds like it’s time to own the miners, and I don’t mind being a bit early. I’m up to 48% invested in my favorite names, looking to put more to work.
There goes RGSE 🙂
and HBM….
and CDE
lol…
I like this move in SWN – as a natty play – and hopefully it can push through and make a definitive upward pattern change…..
CF, thanks for doing the recap at the ends of your reports. I read the whole thing, but really like the ending recap. Keep it up.
I agree, much appreciated.
Taking a stab at KGC …. I like it above $4 … It’s time I think for these miners to start
URA just got stopped at the 200sma, It looks like it could pause here. Its had a nice, steady climb since the lows a couple of weeks ago. No one here is talking about uranium…i guess thats a good thing since it’s sneaking up with no one noticing.
I personally am sick of the sneaking….I want a BIG giraffe neck on my UUUU and URRE!
there goes UUUU for ya
Good start….more, more!
youre testing the 200 today…
There it is!
Bay, I am greedy…I want more…more volume to push it up!
LOLOLOL – Im right there with you sister. Im in UEC, not UUUU, but congrats.. UUUU and I have bad relations. Although I should probably get over that and play it as its chart is lovely
Rob, a few of us have been in UEC and URA and the others and talking about them alot lol
took a position in SA actually SEA.TO north of the border. This is a pure explorer with no income. They have a story as John Paulson just sold his company Snowstorm to SA and became a major shareholder and it has one of the larger short positions to cover at 15 days for SA and 28 days for SEA
TGB
I still own this and I really like the long term set up as well as short term
TRX!
I was JUST going to post that the volume in the first 1/2 hr was almost a full days volume.
I captured this chart, up 6% with volume swelling, but then it TOOOK OFF – up 14% now
https://uploads.disquscdn.com/images/fa37e4304333b811fd5c6f7978e22a0e7739f8a57bead621f63b1c833c5664c5.jpg
… Also I do recall that you mentioned last week the 1 million OZ of gold that TRX recently found avail on their property
Yes. And they have worked out profit sharing with the Tanzanian Govt. – which is a smart move
http://www.newswire.ca/news-releases/buckreef-gold-project-supports-proposed-legislative-trends-in-tanzania-632704343.html
I actually managed to buy that little dip when it was down 🙂
I actually managed to ignore it : (
getting a 2nd chance now.. only up 2%
TRX doing the old rollercoaster that it seems to do better than the rest
Nice!
And also blasting through it’s 200 day MA.
URA poking above the the 200 MA, I would still expect resistance here but good to see and the uraniums are a group I would like to get involved in again, maybe after URA can work through the 200 MA then come back down to test it.
FCX looking good on a 6 month chart
I stopped on 1/2 my position in CENX last week, but the remaining 1/2 is moving to fresh ground today – up 5%ish
GMO – break through 45 plz
HAHA i was jusssssssssssst going to say that … woop
TRTC…
MCOA, GRNH, RMHB, …AND CNBX : ) All MJ stocks
oh sweet duchie…. 😉
CLNE…wakn up
THIS SECTOR IS SUDDENLY GOING BOOOM
CNBX was up 8 % when I posted that. Now up 30%, with many others. IT is a sector alert if you ask me.
Along with MCOA, GRNH, TRTC, RMHB, CNBX….CNAB just joined todays race
I’ve also been watching CANN ( Up 2 cents) on the 50sma. Interesting to watch
huge potential in those…. if the volume continues… wow…
I know….I hate to own too many, but those long consolidations after the huge ramp up last fall seem to be legitimate chart patterns.
exactly…
OGRMF ( OGI in Canada) – Breaking out above that 50sma too
some are speculating there’s a roll from cryptos — to MJ and then gold/silver …
AAAAAAAAAAAAAAAAAnd there goes AMMJ – And that daily chart looks pretty good too.
Can we get some phyto-bites going? #ScoobySnacks
FWIW … my charts are indicating that today is a good buying opp for miners. $BPGDM is finally turning UP, indicating a change in the recent price trend. And I have multiple “buy” signals on my daily charts of miner ETF’s so I bot more AG (started last week) and bot some JNUG (gasp!) on the morning dip. I’m still leaning more heavily on TQQQ than miners but will have 30-40% of my accounts in miners. Good trading to all!
You using the 5ema and 10ema as buy signals?
Bill, I use a variety of “buy” signals on my charts including various MA’s, TSI, RSI, MACD and comparing previous chart patterns, so there is no single “go” sign. I take a look at the whole picture. A 9 EMA cross above the 10 SMA is one of my favorite “confirmation” signals since it triggers later than the 7,4,7 TSI and 5 day RSI. When the standard TSI (25,13,7) and RSI (14) also confirm the up trend, that’s a pretty clear “buy” IMO. For example, all of those signals are bullish today for JUNG , so I finally took the plunge. I am not a cycles guy, so I like it when Alex’s cycles analysis matches up with the TA I’m doing on my own charts. My TA style is unique and something I’ve developed over the past 4 years through trial and error. I am posting what I see to encourage others to check their own charts and make their own trades, don’t follow me! Alex is “The Master”
Thanks for explaining Steve. Good trading
BTW once I’m in a trade I like to ride it as long as possible, hopefully for weeks or even months. As long as the 9 EMA stays above the 10 SMA on a daily chart, I’m usually comfortable staying long. Choppy markets kill me with that kind of trading strategy, so I try to wait for good deep drops to get in. TQQQ was below its 50 day SMA when I went in heavy last week. JNUG is also below it’s 50 day SMA. The odds of catching an up trend that lasts more than a day or two are better when you buy the “ICL” as Alex says.
Thanks……
You looking at a Daily chart? I don’t see an up angle on the 5ema or 9ema, at least not much.
Yes, I’m looking at a daily chart of JNUG. Here is a screen capture to show what I mean.
Notice that the 5 EMA is more sensitive, so it is sharply angled, the 9 EMA is also angled up but not as steep. Meanwhile the 10 SMA is still angled down. So if I were watching the 10 SMA only (as many traders do) I would think that JNUG is still in a “down” price trend. But by using the shorter EMA’s I get an “early warning” that the price trend has changed. And I’ve found that a cross of the 9 EMA above the 10 SMA is usually (but not always) a signal of a bullish price trend.
Hope this helps. Please understand I am NOT trying to encourage anyone to follow me. The worst mistakes I have made in trading have been when I followed somebody else’s advice rather than my own charts. So please check your own charts and make your own trades. Follow ALEX! That’s why you are paying for this service. I am merely offering “alternative facts” to consider to help in deciding whether you want to make a trade.
https://uploads.disquscdn.com/images/f2abd0d21c1f4f4be298858cc0a0e8ecc9e814c7ea8a69a2fc0479b1aed639e6.png
Thanks Steve, good illustration. Also please keep us posted on those long wicks… I seem to not be able to pick them up any more on my service…
There were some long neck DOWN candles for GDX and GDXJ in today’s pre-market pointing to a “target price” of Friday’s closing price. Neither will hit today (I think) and they may not hit at all. I was hoping JNUG would pull back to last Friday’s closing price of $16.78 but the lowest it got today was $17.20, I bot some at $17.22 but I was not patient enough and bot most about 2 hours into the day around $17.45 to $17.50 because 11:30 AM ET is often the LOD. Don’t be surprised by a dip to test last Friday’s close, which is also about the 9 day EMA for JNUG.
thanks Steve
Got it, thanks for your time
Thanks for this..I really appreciate the visual to understand and follow your explanation. Really helps me.
One more thing … the ANGLE of the MA’s is important to me, not just the value. Notice that the 5 EMA and 9 EMA are angled UP today on JNUG while its 10 day SMA is still angled down. To me, that indicates a clear change in the price trend and I consider that to be very bullish since JNUG is near its recent lows. The only problem with being a “trend follower” is that the trend can change quickly. So I hope this UP trend holds! 🙂
UCTT.. Looking good to me..been adding on dips today. Earnings out this week. Should be very good.
THM – Daily & weekly
And does anyone remember TMQ? Also breaking out on a weekly – wow.
right shoulder Slingshot ??? ……………………… :o)
DNN – Daily & weekly – strong volume
UUUU
Alex, have you noticed any change in performance for GDXJ/JNUG since the big rebalance? I don’t see anything obvious.
No, Not really
Has the ratio of JNUG vs NUGT not changed?
Added to AG 7.90
My Silver Calls Outperforming AG and GPL big time “this” time around.
Looking to add another tranche on some sort of dip…..
My Mary Jane holdings looking good today…..can we just get some carry thru ?
CNBX seems to have figured something out. Need some others to get on-board!
They are
CF: How do you play a bullish multi week Rising Wedge Breakout to the upside ?
Alex, remember your old 2/8 MA cross on the $BPGDM chart? It turned bullish today, which is another reason I bot some AG & JNUG to get on the PM train.
UUUU and URRE came to play today
I was rubbing my eyes to make sure I saw that correctly. Never thought I’d see URRE pop again!
DNN just popped and I climbed on board. I have studied this one and they are NOT going bankrupt despite what the shorts might think.
DNN looks real good
anyone know anything about why PBYI was halted?
Gdx, Gdxj, Jnug, : pathetic volume.
Maybe the beginning of a stealth rally- where everyone is elsewhere.
Maybe it is just summertime.
ORIG was drilling for oil and struck GOLD.
crazy because they were Bankrupt a little while ago