
Holiday Trading For July 3
With only 1/2 day of trading on Monday in the U.S., wedged between a weekend and a holiday Tuesday where the markets are closed, I think that we can expect light volume trading on that Monday. Many people may have just checked out and gone away from Friday through Tuesday, so let’s just discuss where we are with the markets.
.
DJIA – The markets have started another sideways consolidation or pullback again, however…
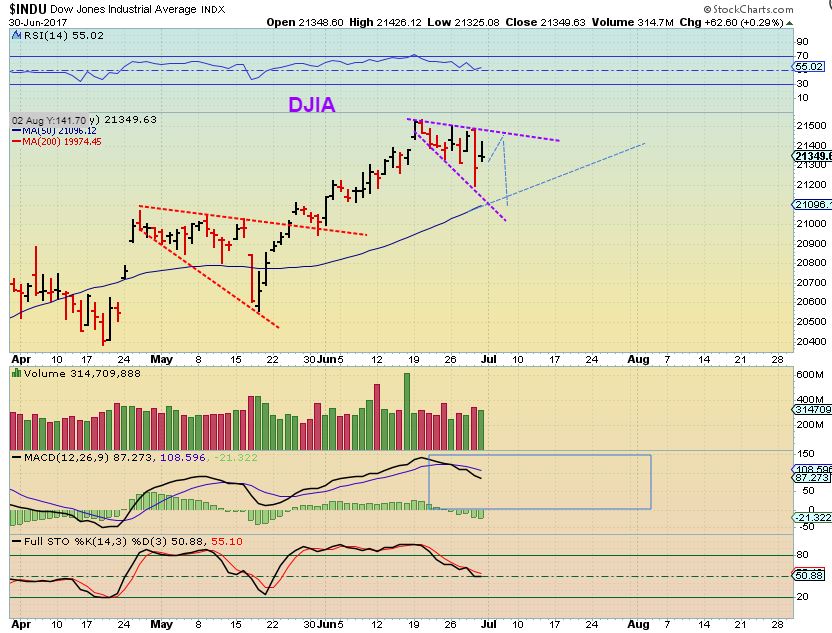
This does look a bit like ‘distribution at the highs’ with that heavy volume. Please read the chart.
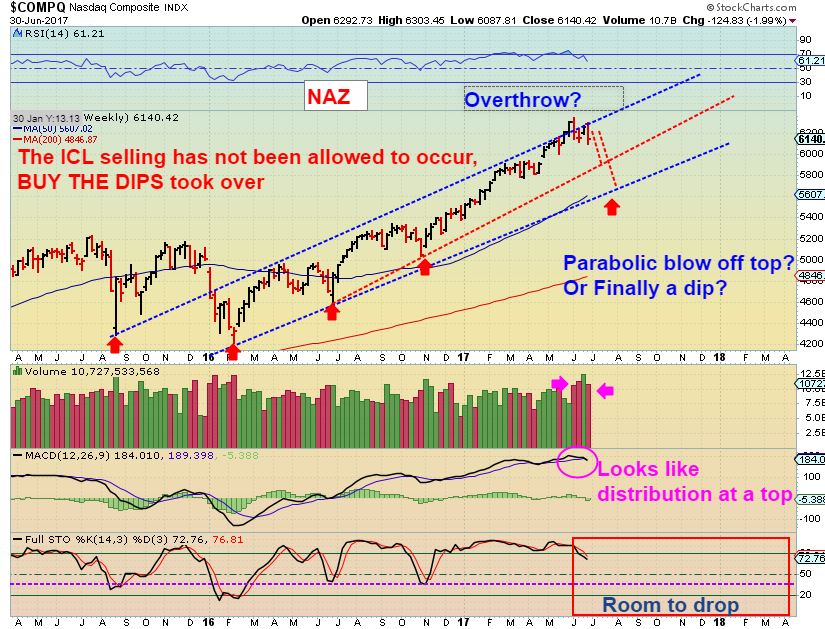
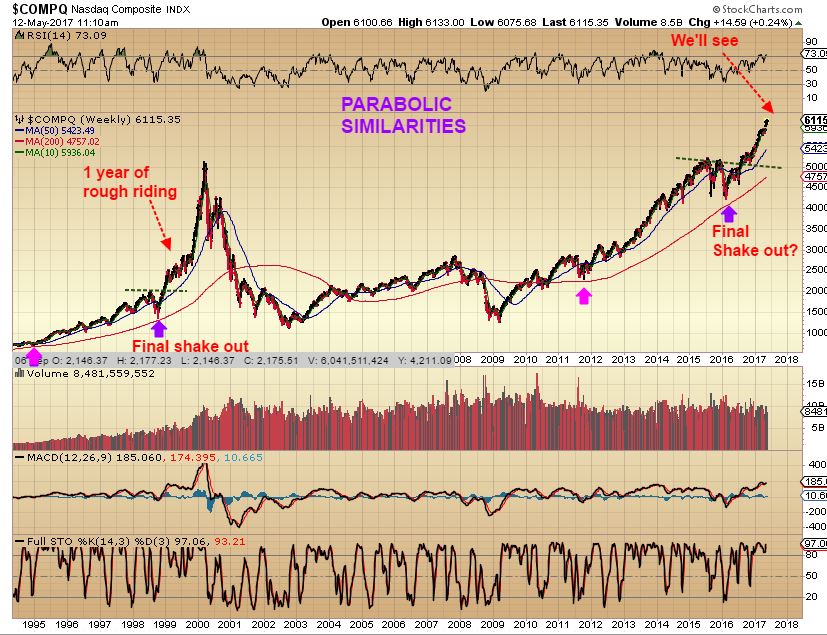
Since we are due for an ICL soon, we will find out soon if this drop take place deeper than most expect this time. A drop to 5900 or even 5600 is not out of the question, if we were to get an ICL type drop as shown? Or…
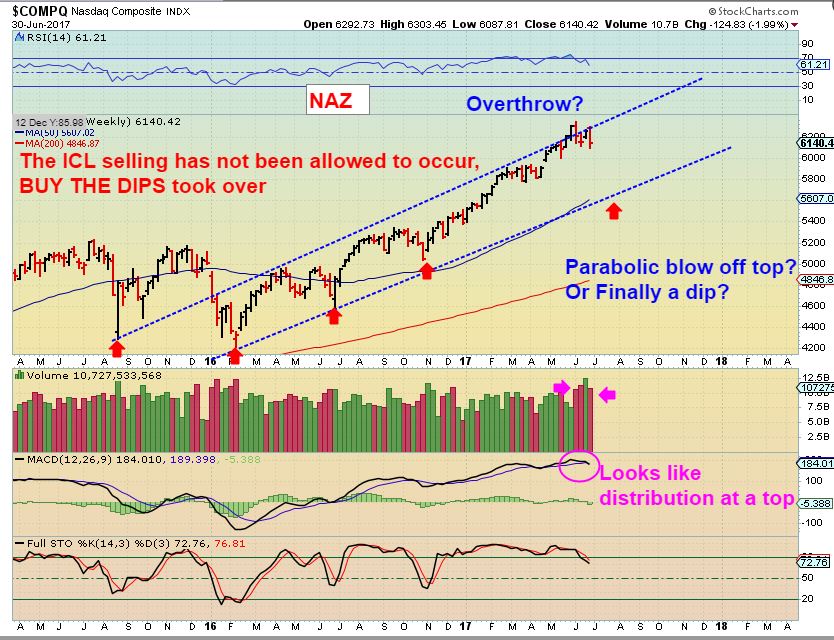
This would reflect a normal quick drop into a dcl and the ‘buy the dips’ take over, causing a continuation into a parabolic blow off top?
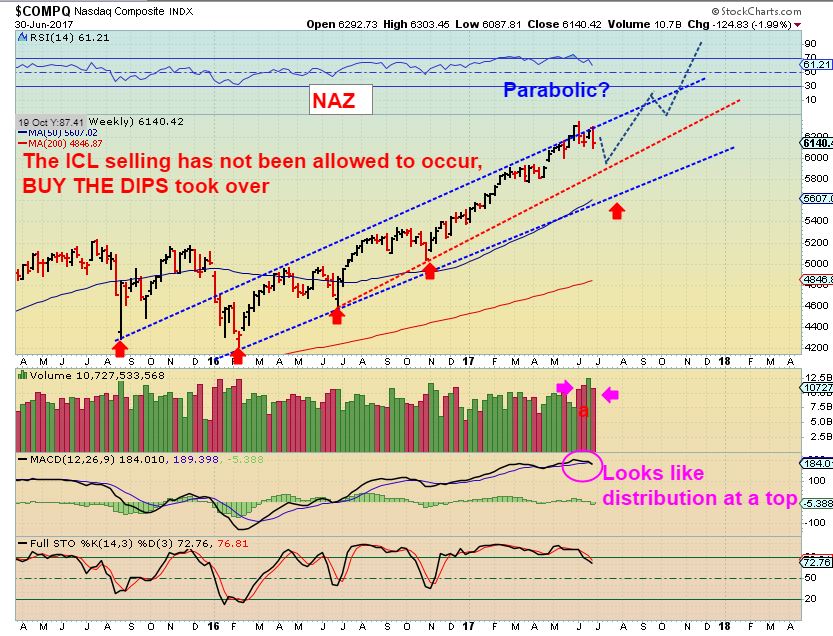
I’ll post my May 12th Parabolic chart again.
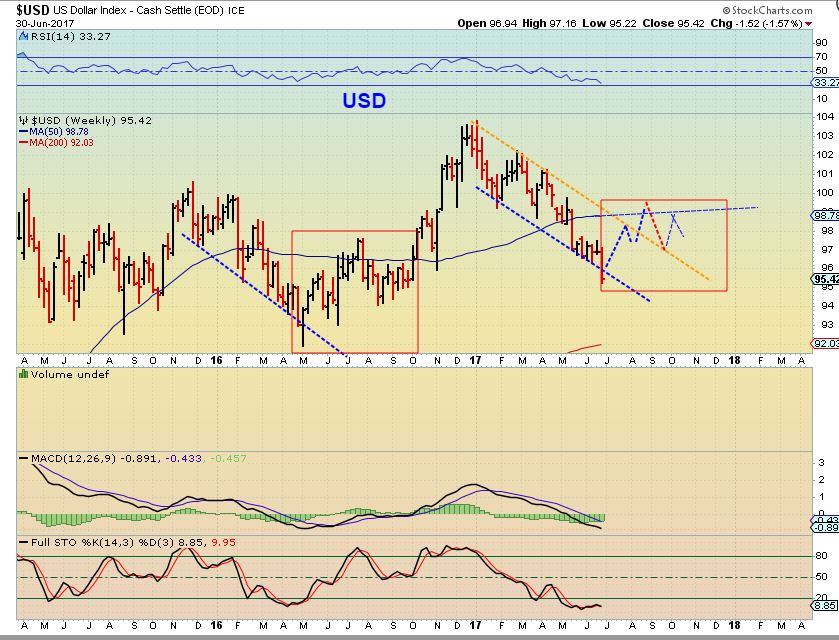
USD – The USD is due for a low, but it just keeps rolling over and dropping. That is what happens when price is searching for an ICL , so we may be seeing final sell off phases ( It seems that Gold does not believe the drop will last) . This resembles the drop into May 2016.
WTIC This was June 23– Important note for future reference = Do you remember when I said Oil has probably put a low in, because we then not only had an ‘inside day’, but we had 2 inside days in a row at lows on this chart. They often happen before a reversal higher.
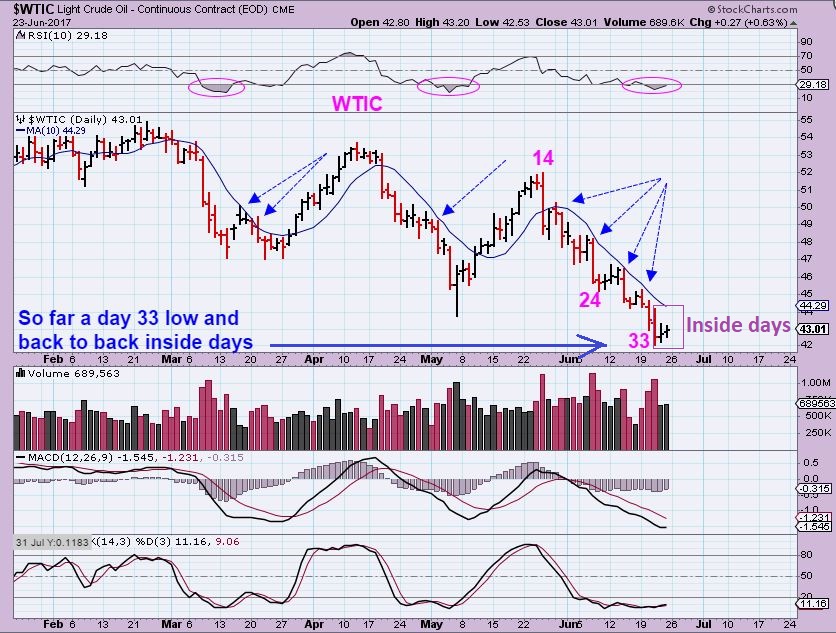
You can see that those back – to – back inside days at the lows did lead to a reversal at the lows. Selling dried up and Oil continues higher. (Remember that for future reference in this report please).
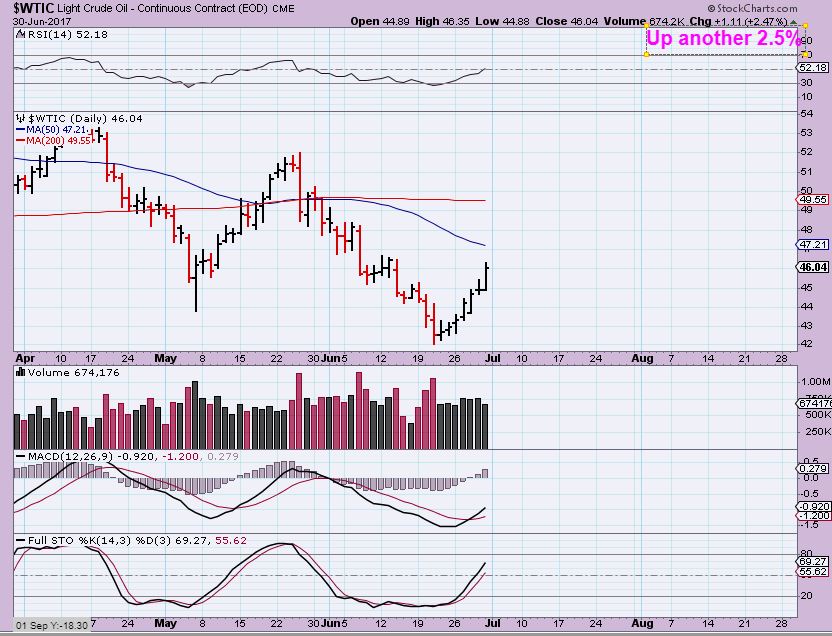
WTIC BIG PICTURE – the last 2 runs ran well, and give us a possible target near $50 eventually, with resistance along the way.
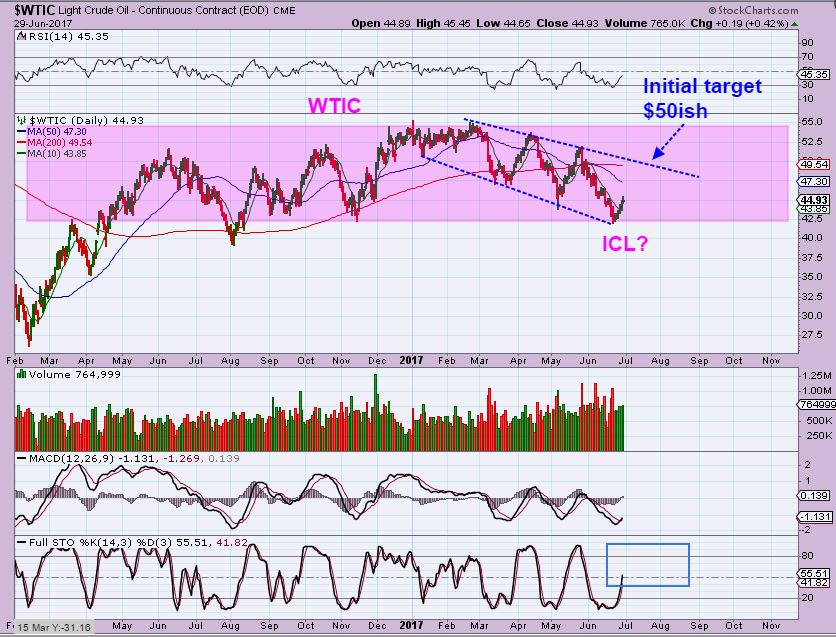
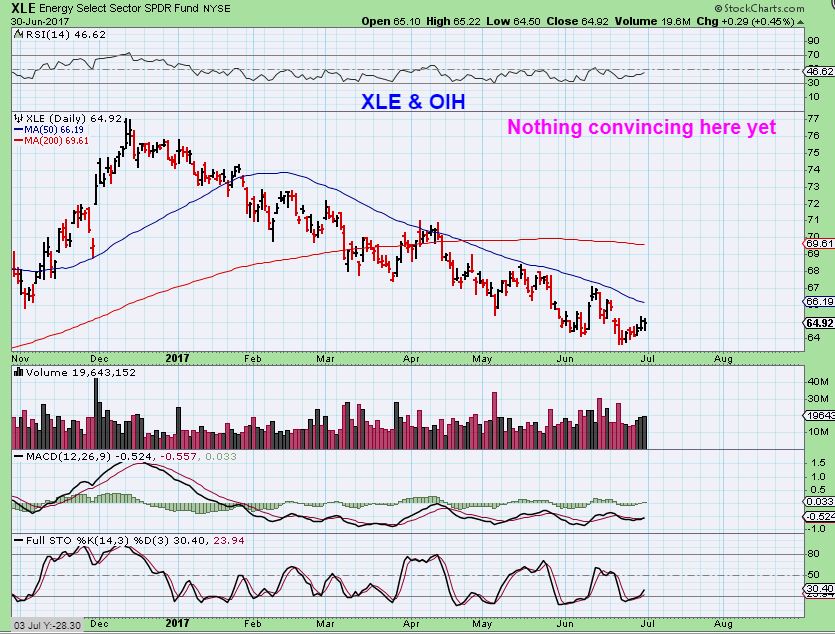
Surprisingly, I am still not seeing XLE & OIH confirm these lows in a strong bullish manner. Oil was up 2.5%. Do we have ANOTHER drop ahead after this run? If Energy stocks act continue to like they did on Oils last 2 runs higher, we need to be cautious and unbiased. I will continue to monitor this for us, but this still may just break out too.
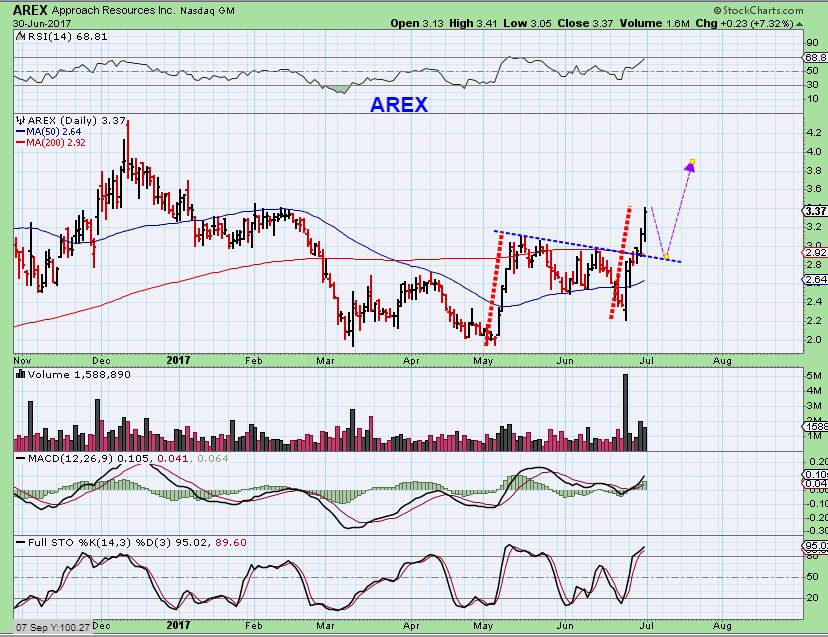
I did point out last week that some of the leading energy stocks were doing well…
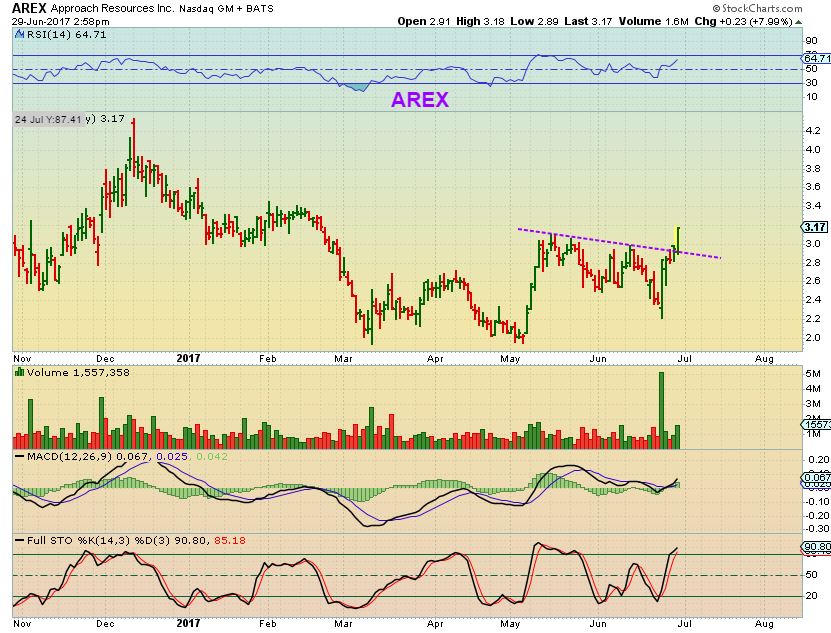
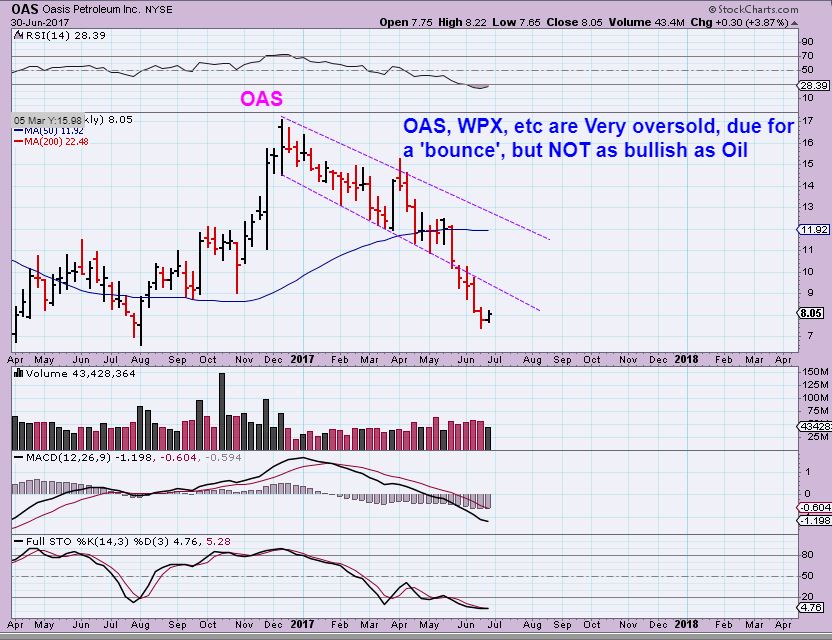
AREX– And AREX did continue to have nice bullish follow through, so I am watching for others to either start to catch up or continue to stall and send out a more bearish signal ( XLE, OIH, OAS, WPX, etc.) .
OAS ( WPX AN OTHERS) are just not acting like Oils lows are in place, are they? Again, Oil was up 7 days in a row & 2.5% Friday. This is weak.
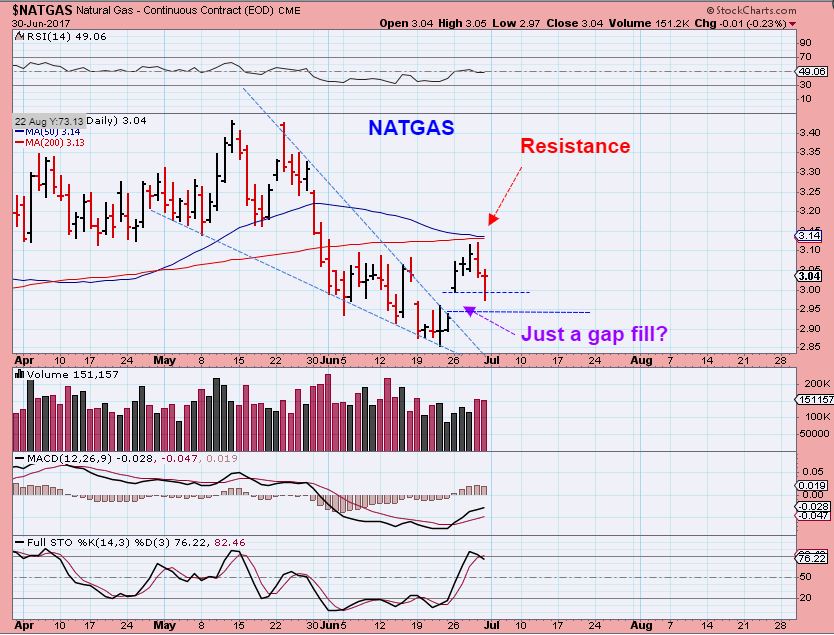
NATGAS – NATGAS failed at resistance as expected and I mentioned that if you took a leveraged position at the low ( Boil, UGAZ, for example) , it was time to let it go and see how this plays out. We saw a decent reversal on Friday after attempting to fill the gap. I want to see what Monday brings. A break out above resistance shown in the future would be quite bullish.
NATGAS – The warning is that if that low at $2.85 breaks, and then this trend line ( neck line) the downside could get serious. Serious enough to then short. That is why I find it best to go 1 step at a time.
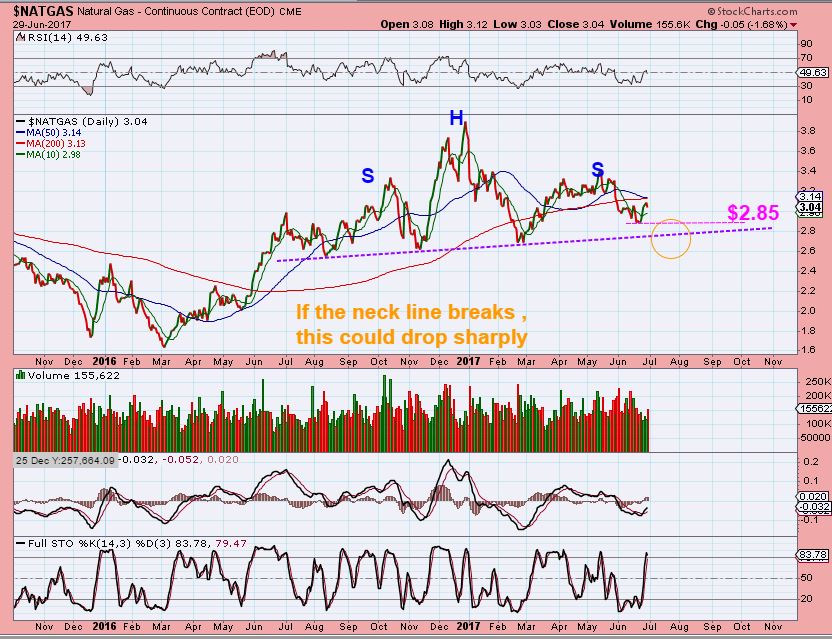
Reminder : This was from June 27 – it is showing that pop or run to resistance an a possible roll over would form a double shoulder H&S.

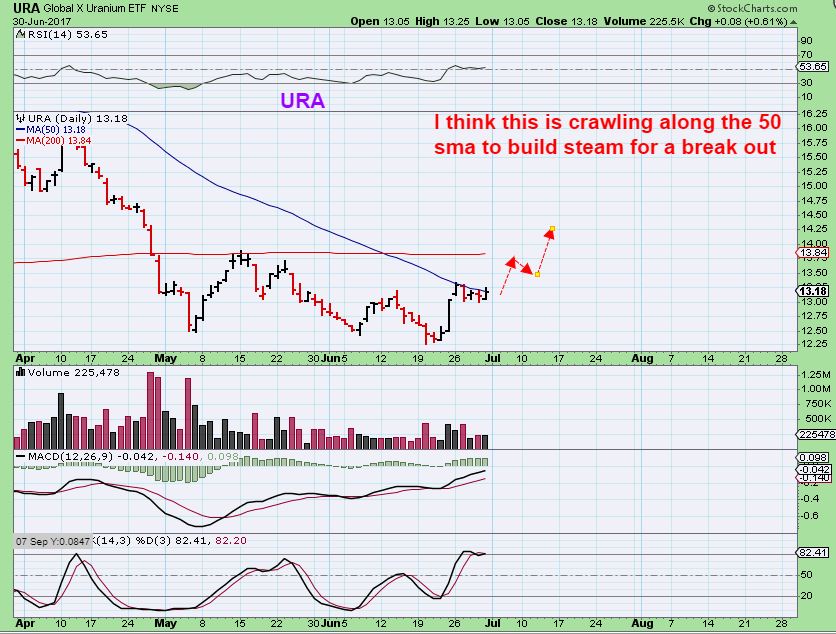
URA – URA is still crawling along that 50 sma , and still looks bullish to me. I pointed out in past reports charts like UEC, URG, DNN, UUUU, etc.
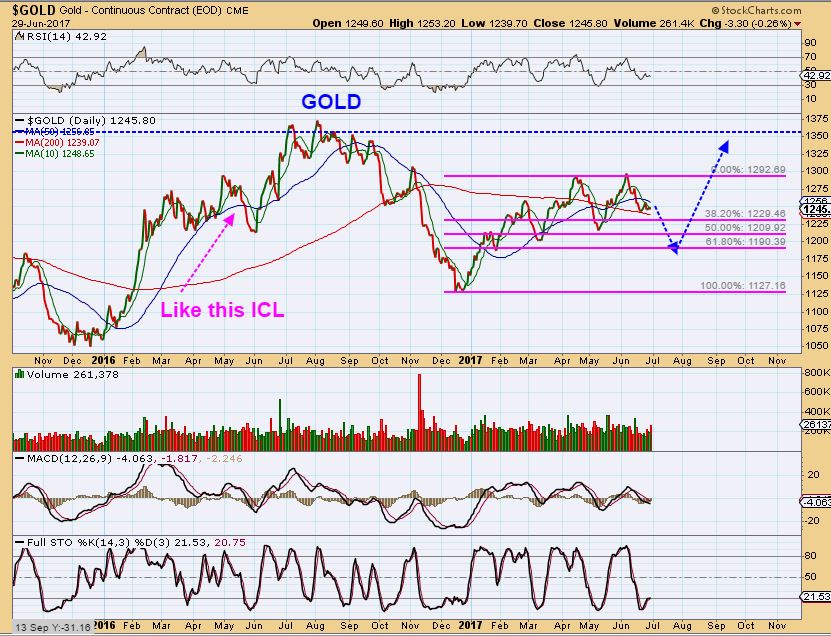
GOLD, SILVER, & MINERS
Right now, being patient has been the best trade in many ways, like avoiding frustration. I have been rather neutral, looking for signs of a directional move while the Miners move through a triangular formation. Some Miners are moving higher , others are again near the lows. The May sell off looked somewhat similar to May 2016 in Gold, Silver & Miners , but so far we have no upside burst higher. I am asked “Which way do you currently lean short term? Bullish or Bearish?” SO far time is moving on, and we do not have a big break higher out of an ICL, so…
GOLD – This is what I am leaning toward for the bigger picture, based on recent activity. A flush out drop into a low. I obviously check how things are playing out day by day and will keep us informed if things change.
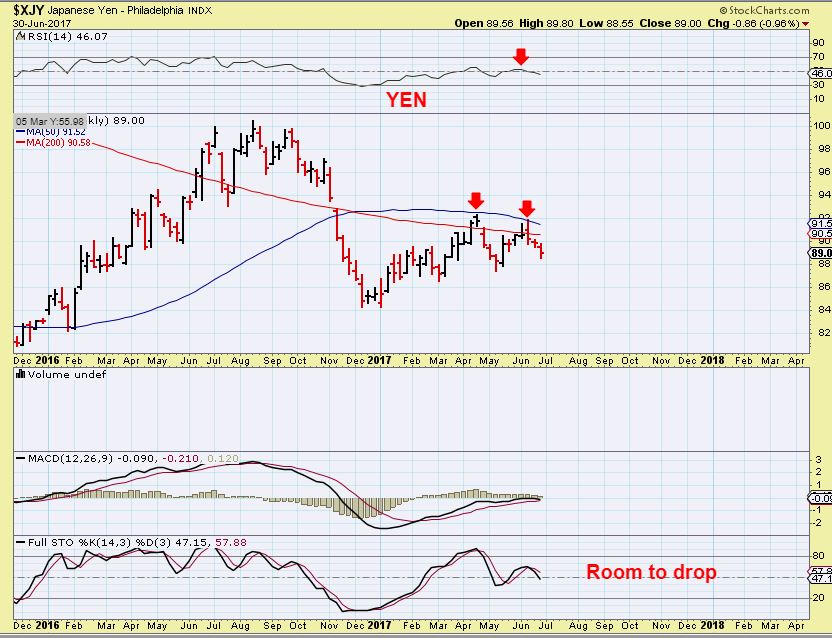
YEN– The YEN is often strongly correlated to Gold. I have written a prior report about it and showed with many charts that they usually follow each other quite remarkably. That said, the YEN Weekly has failure at resistance so far. If it cannot burst higher, it looks ready to roll over further.
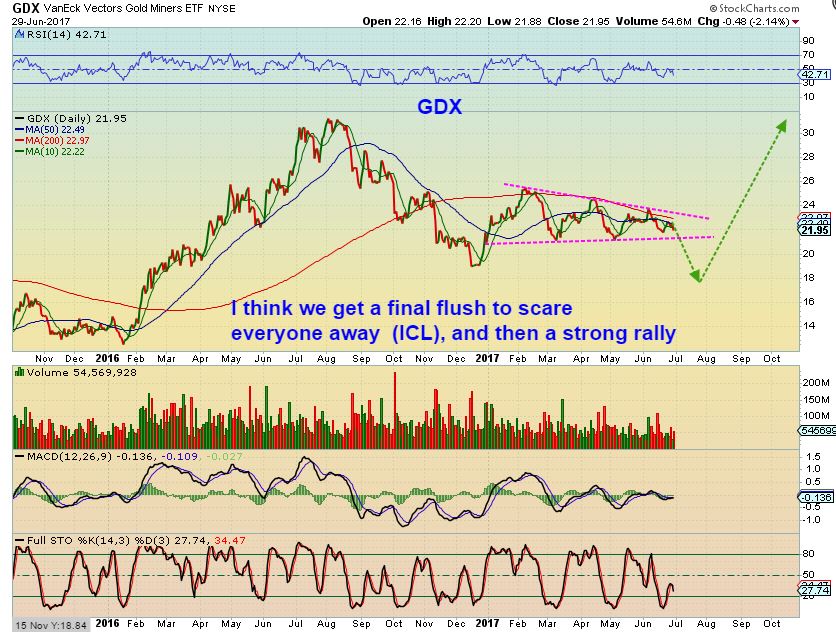
GDX _ That triangle. At one point I expected that it might just break out higher & Run ( it still could), but if Gold drops like the above chart showed, then GDX may do a false break down and then a strong run, as shown. Again, I monitor it day after day, and I will adjust if necessary.
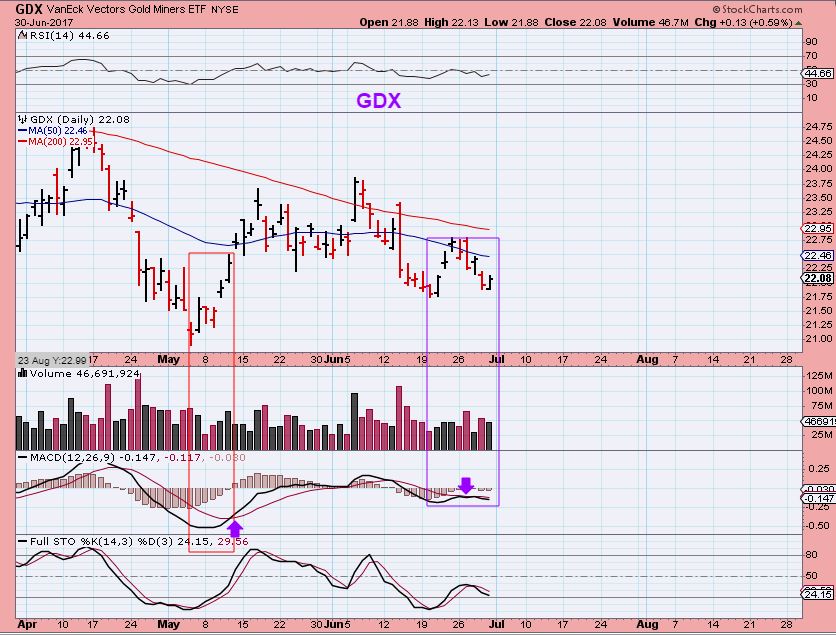
GDX – Notice that in May it took 5 days to cross that MACD from severely under to over. currently on day 8, it lacks strength.
I want to add this next statement to that opening sentence : Often during light holiday trading, like we should see on that 1/2 day Monday, it is very easy to ‘push the markets around’. Buyers may lack selling resistance. Sellers may lack Buy the dippers, and at times we get a whole lot of movement that may mean absolutely nothing on days like that. We can actually get big moves on light volume, because the markets are easier to push around, and then they can flip & do the opposite on the next real trading day. That said, Mondays 1/2 day of trading may not mean a whole lot to the Big Picture.
.
~ALEX
.
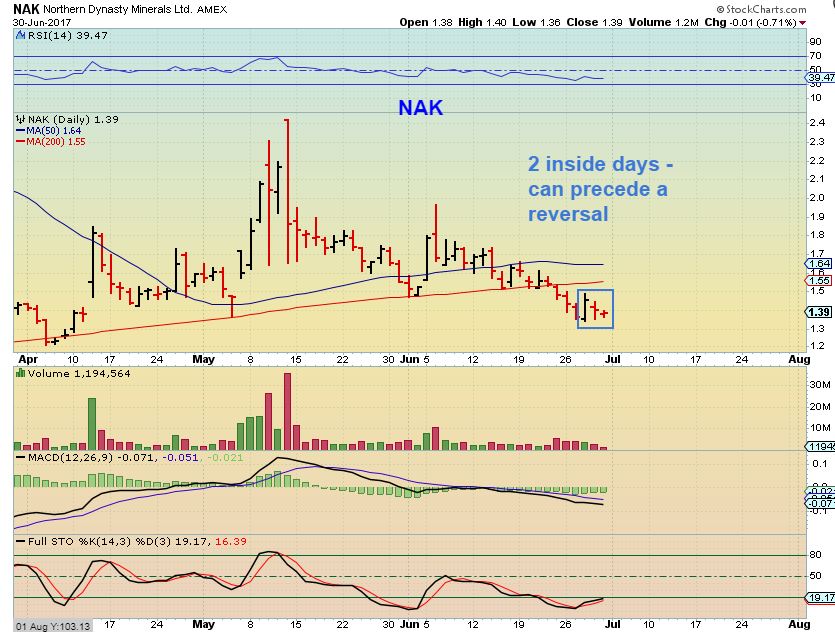
Remember when I asked you to keep in mind those 2 ‘Inside Trading Days’ that I pointed out on Oil in the chart below?
They often indicate that the sellers are losing control and buyers are holding up price above the lows. If sellers close shorts or stop selling, buyer can push price higher. Those lows are not able to be broken for the last 2 days and buyers may step in.
Guess what I saw on Nak as of Friday? 🙂 I see 2 inside days at recent lows too. If the sellers have lost control and Buyers can push this back above the 200sma, we may be seeing a “Shake out”. I look forward to seeing if this plays out.


Thanks Alex. I’ll be heading to Florida in about a week and probably won’t be able to trade until around the 20th. I’m hoping I’m around for the next ICL in gold.
I think we’re all hoping to be around for that! 🙂
Safe travels!
You bet!
I send an early welcome to Florida!
Thanks Nancy!
Alex have you noticed the drug sector breakout $DRG, PPH, CURE etc and individual stocks like CELG
Hi Manny
Yes, PPH is pharma and Cure is health care. They kind of go hand and hand with XBI & IBB, which I have mentioned in recent reports. PPH has only moved from $50 to $60 in 2017, so I haven’t mentioned it.
I have a list of many stocks in this sector however, some are doing well, others not quite as well.
PZE- the chart looks really good on a 3 year weekly, it looks like it may break out. If you look at a daily though, in January it was $33 and it is $33 now, even though it just ran from $32 to $34. The chart does look to be shaping up.
CELG ( refresh for chart below) may have topped for now. Really nice move in the past couple of weeks
SO I have seen some really good moves in this sector and some seem to still be setting up nicely.
https://uploads.disquscdn.com/images/efd6772319a1be1e075d77b6e73984769696d3884569adc164715fb2aa03d8a7.jpg
Oil rigs dropped last week for first time after 23 straight weeks up. Usually a lagging indicator, but crude may have hit an important low. If so, why is the energy sector dragging?
Gold starting another drop. Looks like I’ll be stopped out of JNUG by the time I wake up tomorrow??
Well i think a person wants to add to miner shorts here. What`ch thinking guys any advantage between DUST and JDST ? Thanx
the bottom is nigh. I’m seeing lots on the 5 min that dropped and are coming right back.
Thanx Rob. Im eye balling that as well. Volume holding up like a normal day so far . Added a 1/2 to Dust @ the open so not getting all jiggy with it just yet.
The only thing about that is that in a sell off, a 5 minute chart can give you a 15 minute bounce, become oversold, and then start selling off again if the selling pressure is real.
Gold getting hit hard ….. ICL coming soon ?
I wanted to see it break below the 200sma in this sell off, and that is what we have today.
Im slow chanting… TGB.. TGB..
nvm.. nvm lol
I own TGB too. I’m chanting TGB & SPWR, UEC.
URA broke out
URRE. 🙁
Great report Alex. Really like the yen chart added to the mix.
Thanks Jeff- I always watch it and a few other things, but I figured I’d throw it in there since it has been rejected twice now at resistance on that weekly chart.
ditto….what he said.. excellent charts… i loved that GDX chart where u showed MACD took 5 days to cross… i had not noticed that.. :o) very cool analysis today…..
Thx Maria
D. N. R. – thanks !
🙂 paid for my month vaca in Jan ;o)
arex has been no slouch either….
Wow – I didnt see arex lol – lucky u… Im making a few pennies per play and youre over here booking flights for 6 months.
Yeah, so I’m also just making pennies. Have to cover my fees for the JNUG slot machine. :O
Thats actually my plan as well LOL. However I got lucky, I bitched and moaned to schwab about a few things and was blessed with 25 free trades in both of my accounts. Better make em count….
ALO sure pulled off that financing at the wrong moment.
SO even though many of the energy stocks that I watch ( OAS, WPX, etc) have been crawling along the bottom last week, they are breaking down trend lines finally
refresh for OAS , this is the same in WPX too.
https://uploads.disquscdn.com/images/bbd8132a73e4338d9b5f78948086c9a2a9ab8deefefde65d20cc0a401f297c80.jpg
are you recommending to start building a small position in WPX?
If you were looking to build a position in Energy you could, watch the 10 sma. They tend to climb along the 10sma for a bit
Solid day in energy. Finally!!
Too bad miners got their butts kicked. Did you see AG? OH MY!! As soon as we find bottom I’m picking that one back up again for sure.
I just want to mention again, todays trading may or may not amount to anything in the big picture.
It is a 1/2 day in the U.S. before a closed Tuesday, and most are away on vacation.
Light volume markets can get easily pushed around.
Using the URA chart in the report- URA broke out today 🙂
URG did too, and UUUU is pushing on the 50sma. DNN looks good too
NXE breaking out
I still like this sector
Interesting gap fill on UGAZ & BOIL so far.
NATGAS was down almost 10 cents when I woke up this a.m.
I am not really doing any buying today – I am just watching the 1/2 day trading for now.
Nat gas down I think it will be a toss up between gold and nat gas which breakers their lows into ICL.. both will be compelling buys . I think dollar is dropping does not bode well for gold…
it looks to me GDX made a lower low than in may, could this be a very elongated 4th dc?
I’m not seeing a lower low than May
I maybe wrong, the low in may was 20.89 may 4th
Yes, that is correct. I am seeing $21.50 low today, unless I am on delayed time.
I am not in front of my home screens
I used to trade PRAN, OPXA, IDRA, ZIOP, CGIX, VSTM, BEAT, EYES, etc
Never saw that coming in PRAN & OPXA ( Kind of saw EYES perking up lately – Maria mentioned it).
EYES – actually a nice volume POP and gap fill on a light volume trading day. EYES may be a good one to own here, though it may also consolidate for a few days, hard to tell.
My refinery trade in PARR and REGI are both moving well. DK was held back a bit.
Those have both been acting very nicely, and the volume is even solid on a day like today .
Do you own both? I remember you mentioning them a couple of weeks ago. They have consolidated each gain nicely, and that is good for a longer term trend.
Yep I have them both.
ok – 3rd times the charm? UEC 1.62…
Boom… There we go
SOXX printed a lower low and it looks like the Q’s might do the same thing. Am I correct that this is day number 16 would make these Left Translated?
Alex, your RGSE looks like its about to make a move one way or the other as its getting squeezed in a triangle and/ or aflag, and/ or a coil, and /or the 10 & 50. And/or the trend lines .Sheesh, Now, if we could just figure what direction?
Yes, The Solars are doing well for now, so I am hoping that it is a bit of a bull flag pinched between that 10 sma &50sma.
Support at the 10, resistance at the 50. I’d love to see a break out & would add if we get one.
I like this look ( refresh)
https://uploads.disquscdn.com/images/8ea1b7cb4fe3b22f557facd92dd41a9c11e3544820ba4c5ab5069354c2c3aac7.jpg
And Trump says he’s going to put solar panels on the Mexico wall! LOL
gulp… TRTC
AKS!? what happened here
Alex does your crystal ball still show a good future for AMD? or is this drop getting to be overdone?
I dont understand… Goro… Lol this thing pays no mind to gold or miners huh?
lots of hammers on the gold miners. I can play this tomorrow on the TSX.
ru taunting? 😉
drooling!
Meaningless Info Dept: Last week somebody asked if I thought TQQQ would drop to $88, which would fill the gap from April. I said I HOPE so, but I have no idea if it will happen. I just noticed that the P&F chart for TQQQ currently has a bearish target price of $81. So it may get even lower! 🙂 However, QQQ has been lagging SPY lately so I’ll probably switch to UPRO if/when I get back into the general stock market.
Agreed on the lag. But if we get a real ICL, NAZ could take the lead again?!
Still waiting for bottom channel to be reached to try long.
Need to improve on timing of levels. The bottom should now be approx 1205ish.
https://uploads.disquscdn.com/images/d675bbde0bb566a9003ad50d302b0084fefa595f1cb04e91ad23b9dc6e11045c.png
Still some bull sentiment that needs to be washed away. Too many have positioned themselves in “waiting for breakout”. This would be panic sell day 1. Maybe a bounce then day 2 and perhaps 3? Lets see how long this will go.
Nord…..THANKS!!! Let us know how you see Gold developed this week as low it probably will go. Great work Nord.
Again… thank-you !!!
This has been very interesting but also very confusing. Gold has been sooo strong through 4 daily cycles and now on this one it’s just total crap. I’m really annoyed. I went short in the 4th DC which was L.T. and now this time I did not so, of course, gold sinks like the Titanic.
Anyway, very very impatiently awaiting the trendline touch, bounce, sentiment cleanse, and ACTUAL COL. Cannot. Come. Soon. Enough.
I’m starting to think we get there around Aug. now at 1160-70 or so.
That may be the scenario if the channel fails to hold. Then I have as low as 1150. But main scenario is that channel holds
There seems to be a problem with the stock market. Does anyone know what’s happening? I read that
NAZ has issued a system wide trading halt. Thanks, John
Hi John,
No, I didn’t hear anything and I’m not sure where you heard it, but I couldnt find anything at all in a search.
The NASDAQ Futures are currently trading
see the link
http://www.finviz.com/futures_charts.ashx?t=NQ&p=m5
CF, I read it on http://www.zerohedge.com but it is no longer there and everything is working fine now.