
Friday July 14
We traded LABU ( XBI, IBB) in June and made some quick gains. I believe that it may be time to go biotech again.
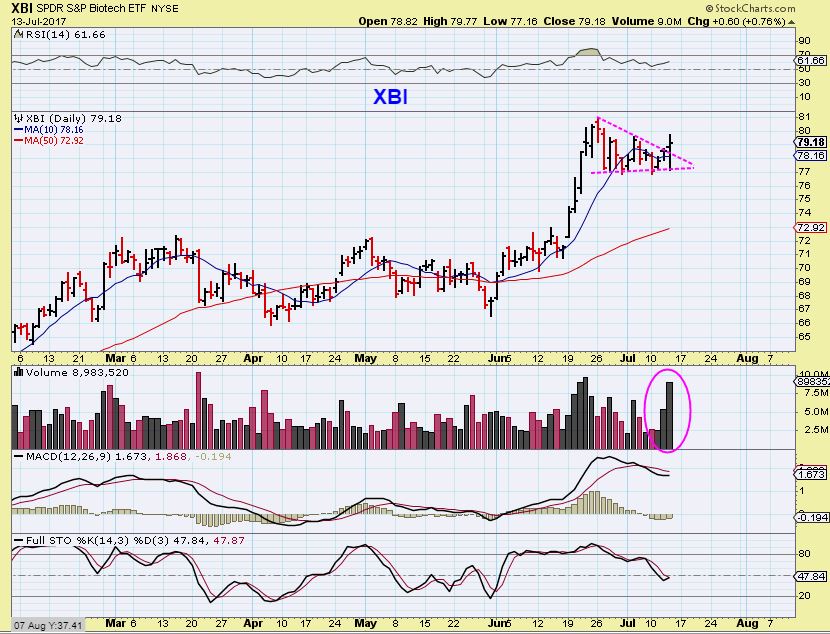
XBI – After a solid run higher from a bullish W pattern consolidation, the XBI & IBB has formed a bull flag. Both broke higher with increasing volume yesterday. This can be bought here with a stop under the bottom of the flag. I want to point out that this Flag MIGHT turn into a longer consolidation pattern too. See the next chart…
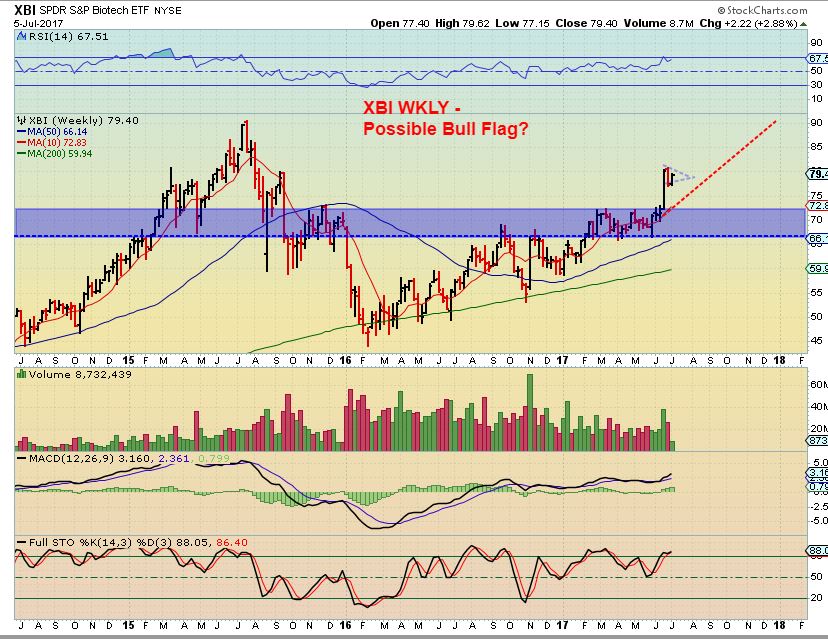
XBI JULY 5th – I noticed that some readers were shorting XBI & IBB in early July, so this was my chart from July 5th showing that a bull flag could form, not making it a profitable short. It could run sideways for weeks until the 10ma on a weekly basis catches up. My target has been the former highs around 90 .
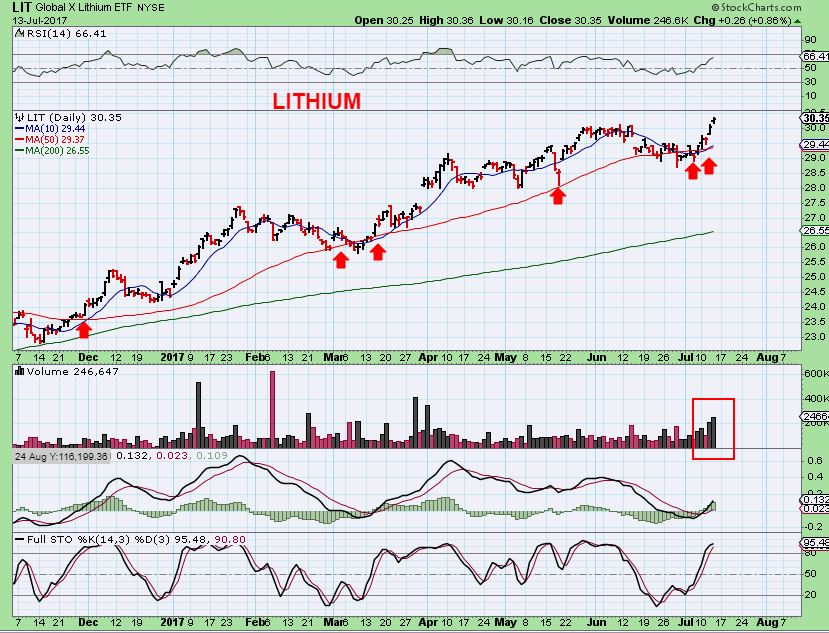
LIT ETF – The LITHIUM ETF has been bullish for a while. After dropping to the 50sma, it consolidated and recently started breaking higher again. Lithium is in a bullish uptrend. Longer term traders may appreciate this, but it is a gradual bull rise, possibly a bit too slow for some here. ( It ran $24.50 to $30 this year, not bad, but you can see that it was slow & steady).
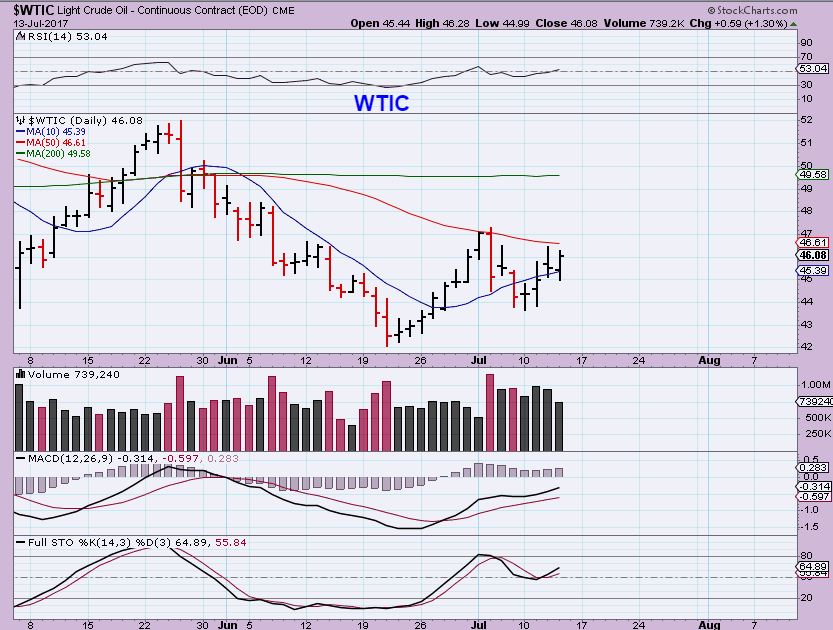
WTIC – On JULY 11 the OIL chart continues to show that a bottom is likely in place. We do have resistance overhead.
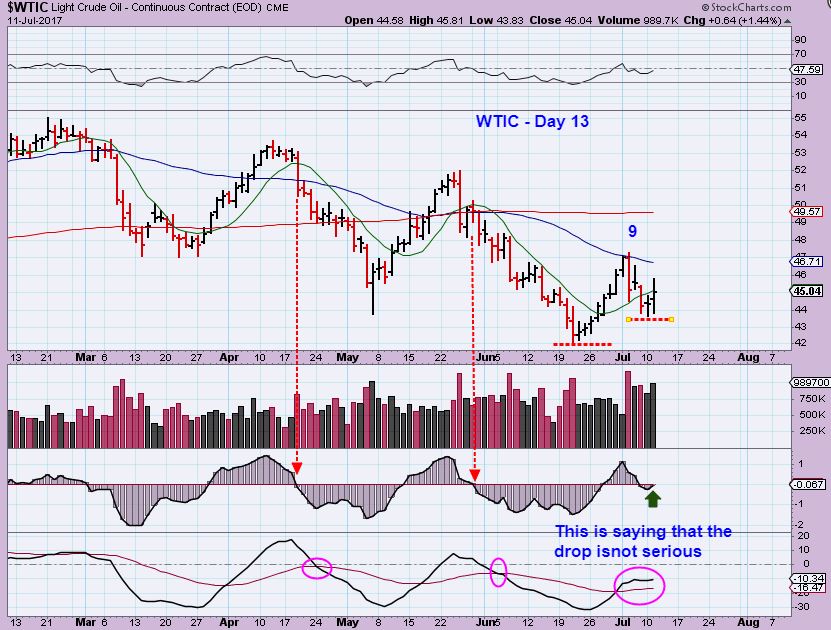
WTIC – Oil is pushing against that resistance again. The set up looks bullish and Oil should be able to break through and move higher, at least to the 200sma.
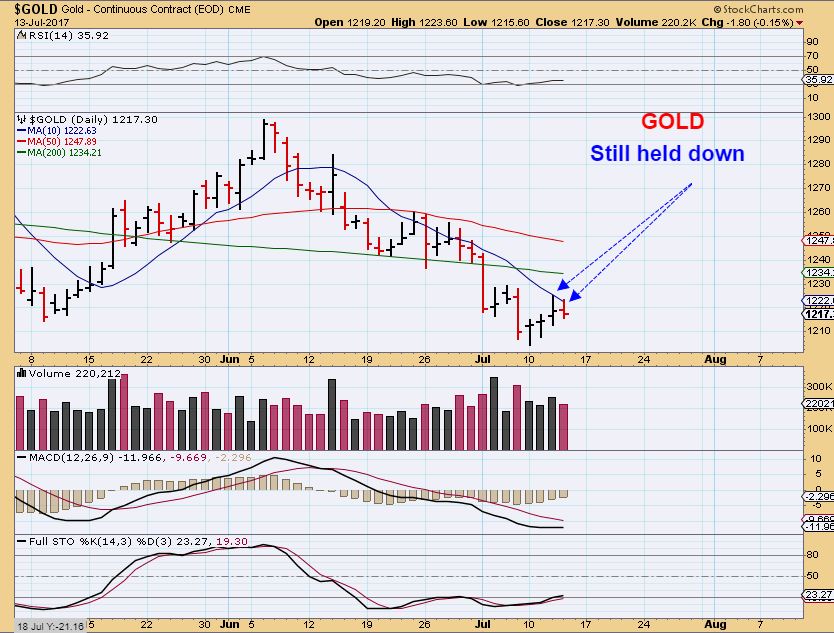
GOLD – GOLD was rejected again at the 10sma. This is an unconfirmed swing low and I continue to watch and see if GOLD can break above that 10sma, or will it roll over again, like it did at the end of June?
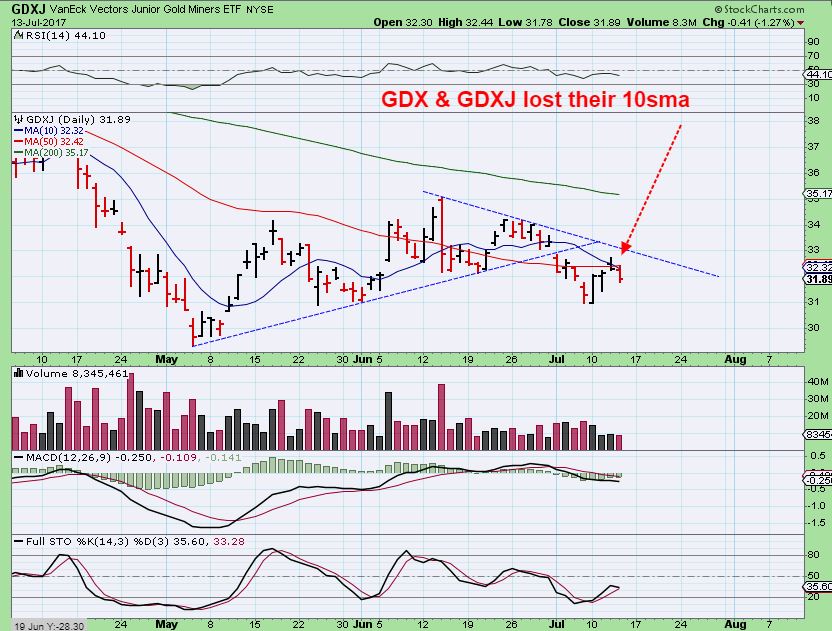
GDXJ – GDX & GDXJ lost their 10sma. This is not a great sign, it shows weakness to me.
It is Friday, the last trading day of the week, and not much has changed in my expectations. The General markets have continued to move up out of the lows, Oil & Energy seem to be shaping up, NATGAS needs time, and precious Metals need to be watched since moving off of their lows. Read yesterdays report for more details if necessary. So far , things are playing out as expected. Enjoy your last day of trading for the week, and I’ll discuss some of the recent trades and newer set ups too, in the following part of this report.
~ALEX
.
COMMODITIES ARE STILL PERFORMING WELL
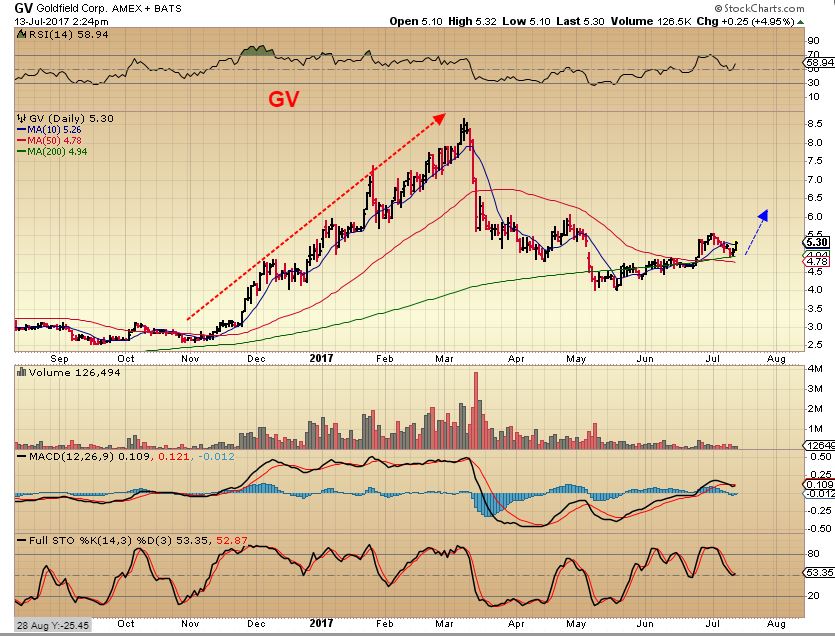
GV – I like this set up, with price steadily rising since the May lows. This could be bought anywhere here, after it successfully tested the 50 & 200sma.
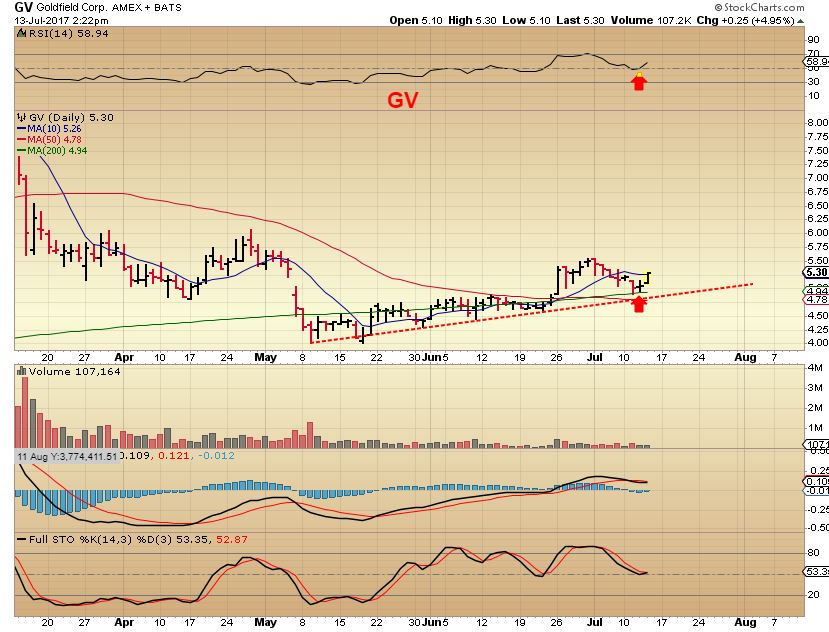
GV – Bigger picture. This had a great run at the end of last year above that 200sma.
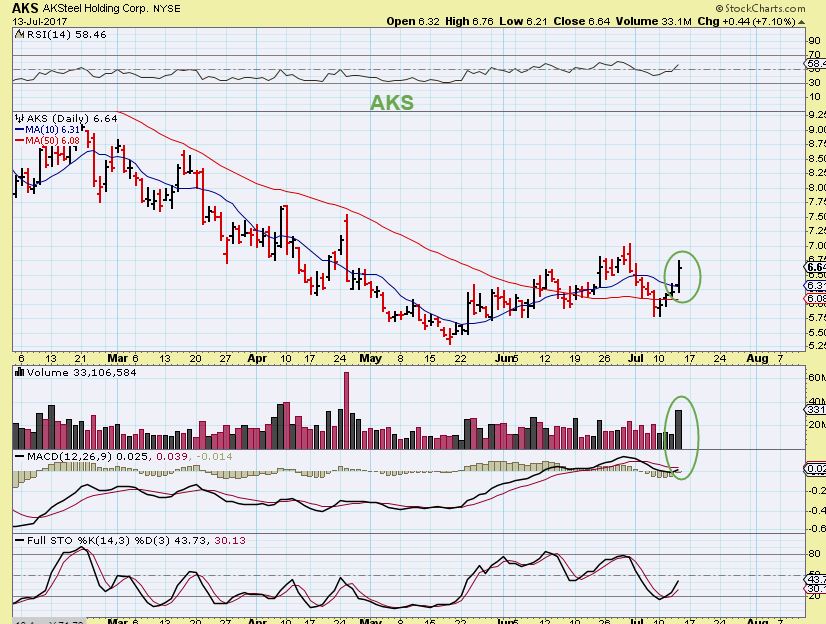
AKS – Steel stocks reversed higher yesterday. AKS regained the 50sma 2 days ago and is now accelerating.
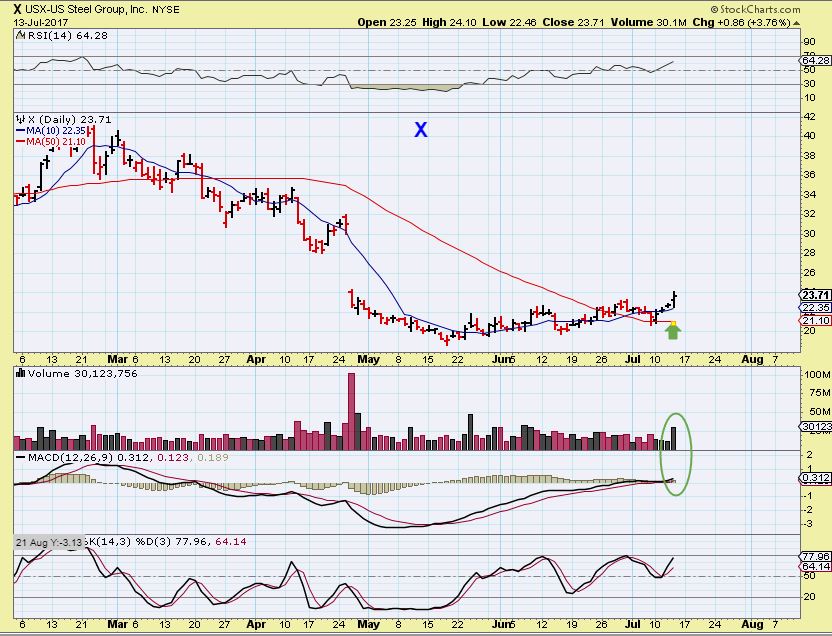
X – US STEEL is also continuing to move up higher out of its base. Moving out of a base can be a bit of a slow process, but gains are adding up. The rise higher can accelerate as buyers step in over time too. Notice that X tagged the 10sma almost every day recently ( with a quick drop & tag the 50sma). It could be bought anywhere here, it is entering ‘overbought’ in the stochastics soon, but it is not ‘over extended’.
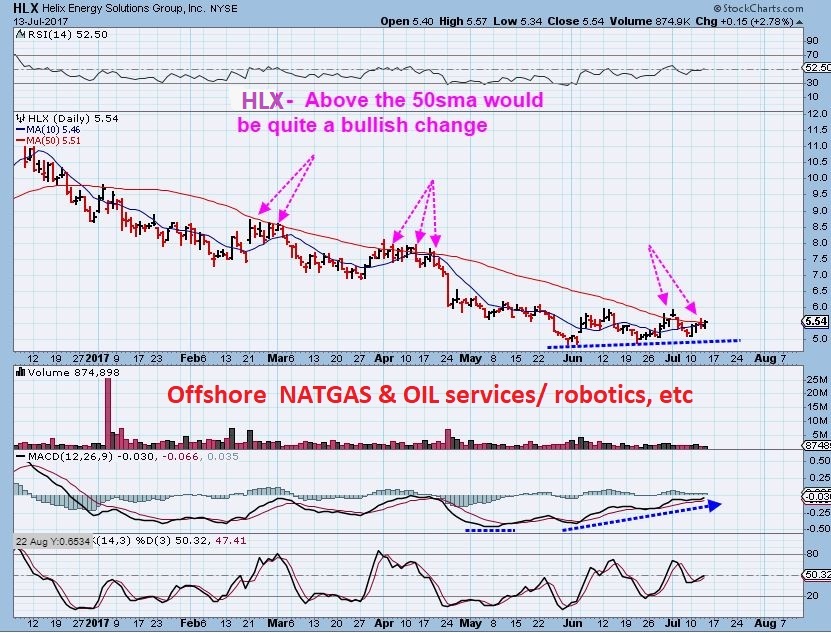
BAY TRADER from the comments section emailed me about a few of these yesterday, so I said that I would cover a few in the report Friday ( SPN, ICD, and HLX). I too have been watching HLX as an energy play, but I lost track of SPN, and I never knew ICD, so let’s take a look, I do like their charts.
HLX (ENERGY) – I have been watching HLX for a break above the 50sma. I think I am going to buy it there. I did not draw it, but it appears to be in the APEX of a triangle or wedge. The 2 year weekly actually looks like a buy right here to me.
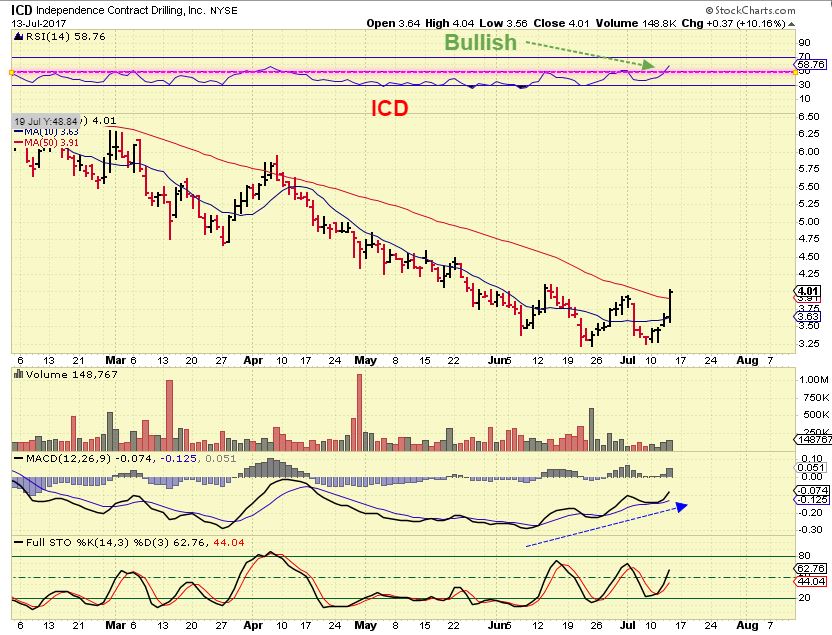
ICD – A set up like this is a bit tricky. It shows up on a %-Gaining screen, and day traders try to hop on & grab some gains, but will it keep running ? Or will it continue bottoming? I have seen both things occur, because the base is somewhat small after an extended sell off. That said, I do not buy this initial break out, but it goes on my watch list. ( As a quick day trade, it could be bought as a ‘break out’ , but it will most likely drop back to back test that 50sma sooner or later).
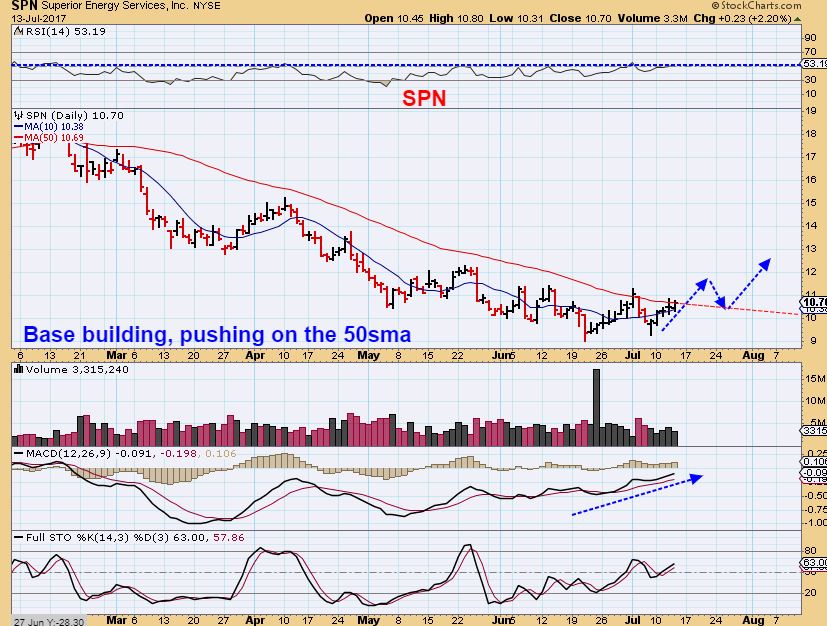
SPN (Energy) – I can see something like this happening in SPN (Energy), it may break out , it may continue this bottoming process. ** THE SECTOR has a lot to do with the success of an attempt to break out & run. I do like the set up and I would buy the break out for a quick trade, but it is still in a down trend like most energy stocks.
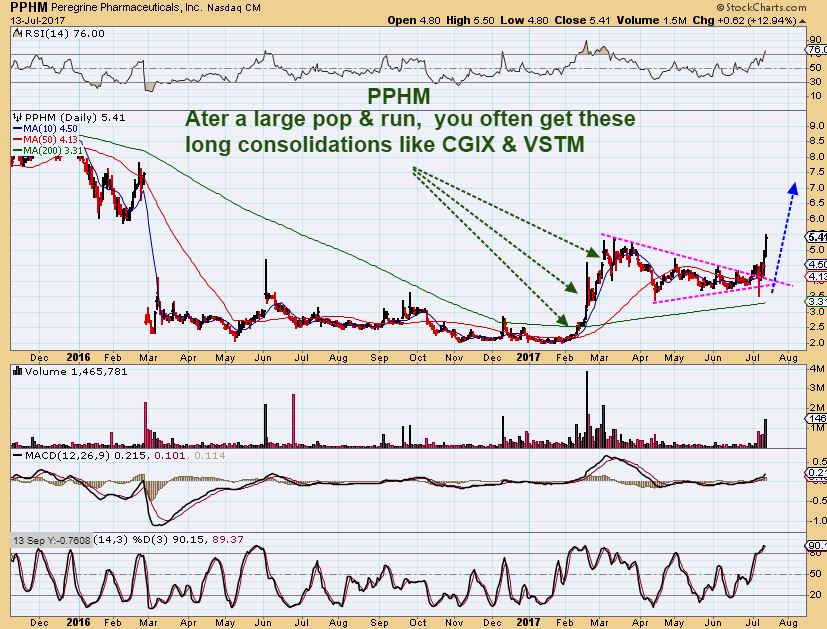
PPHM- I missed this one earlier this week when it broke out from a solid bullish consolidation triangle. Pharmaceuticals, Biotech, etc continue to base & pop and run. Then they consolidate , Pop, and run. ( This is why I was watching CGIX & VSTM SO CLOSELY).
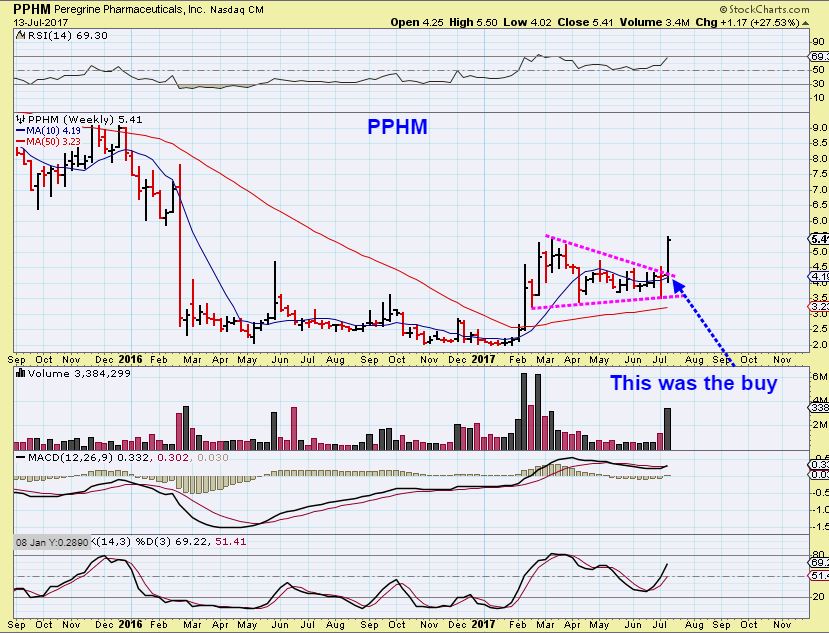
PPHM WKLY – This actually looks like it wants to run to $7, maybe $8, but I can’t chase it knowing that it can also drop to the 10sma on a daily chart, before continuing higher. If you like it, put it on your active watchlist and see if it dips down for a lower risk entry.
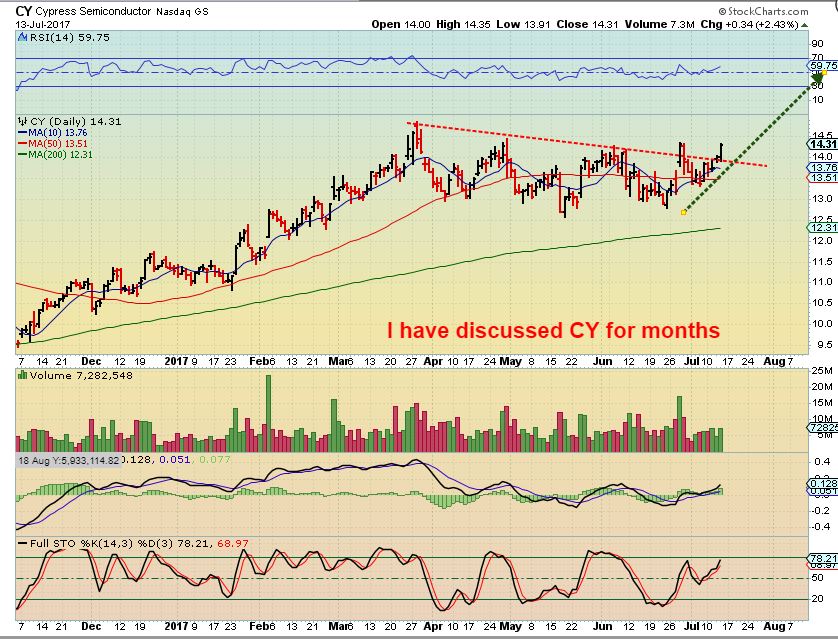
CY – I have been discussing and stalking CY for a long term buy & hold run higher. This could have been bought at $13.50, but it can also still be bought here . I think that the consolidation phase may be ending. This should run into the $20’s if it breaks out and continues higher.
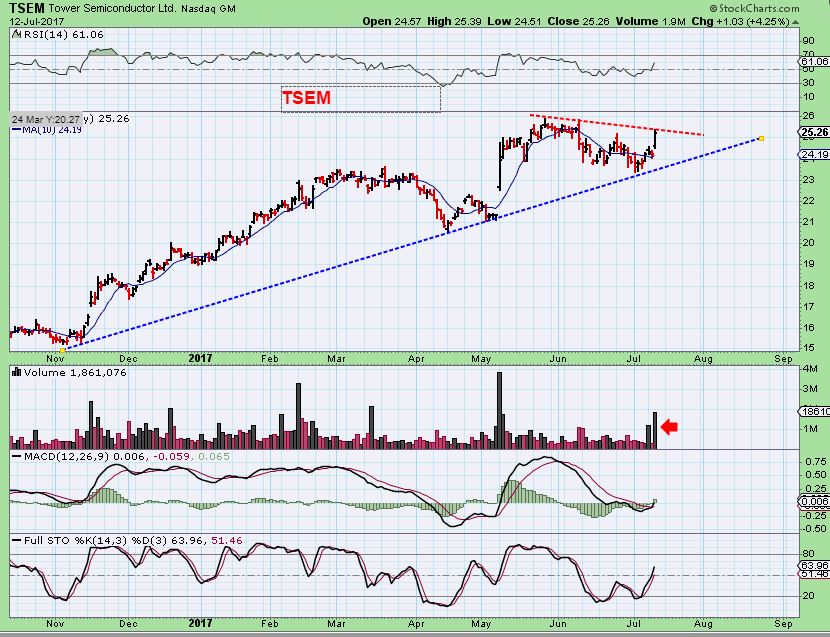
TSEM – I pointed out TSEM here, and it broke out yesterday. It remains a buy.
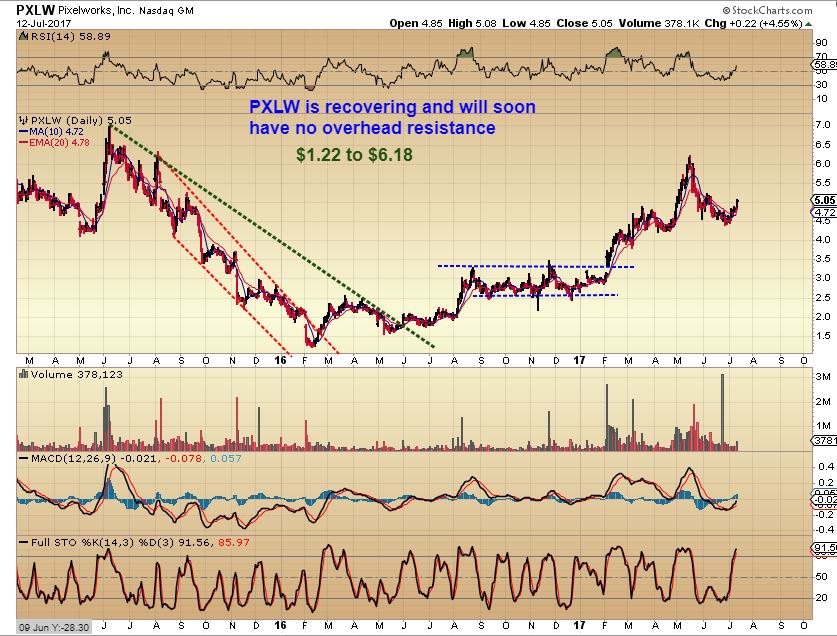
PXLW – PXLW runs higher, consolidates, runs higher, consolidates, etc. It is now moving out from a descending wedge type sell off and could eventually run higher to the recent May highs again, forming a cup. Currently it hs hot overbought in the stochastics, but they can stay that way.
So we have had MANY trade set ups and trade ideas. You CANNOT possibly buy all of them, but a variety of reader like a variety of trade ideas. Choose 1 or 2? You will have more chance of success trading a set up in a sector that is already bullish, but if a sector is attempting to bottom, you also can get more of a bang %-Wise with a trade coming out of the lows and experiencing ‘short covering’, so we have many choices for different levels of experienced traders.
Some are just patiently waiting for he Precious Metals to have a confirmed bottom in place, they want Miners set ups in a bull market run. Others are also waiting for a confirmed bottom to be in place in Oil & Energy stocks. Some may want to just ride or trade longer term bullish set ups in the semiconductor or general markets in an ongoing bull market ( maybe grabbing an ETF like TQQQ or UPRO when they regained their 50sma after the recent sell off) . Biotech trading has been successful too, since many have also been bottoming & turned bullish since 2016.
Enjoy your Friday trading and have a great weekend! 


Based on your reports, OIL, GOLD, GAS are higher risk right now, and may not be ready to move higher. You think pharma, HLX and CY are low risk setups right now. Probably so good safe plays in the general markets too, as Sp500 looks like its taking off again.
CF, 2 long term hold stocks, that I would like to buy are PYPL and OLED. How do the charts look to you currently. Good to enter or wait?
Here is my thoughts on OLED. PYPL seems so extended, but I wouldn’t be surprised if it goes parabolic.
https://www.tradingview.com/chart/OLED/MJOPiEsr-OLED-Long-Idea/
OLED could be entered here, it i just recovering the 50sma
I tried to actually buy PYPL back when it was in the 30’s – it POPPED and dropped like WTW, and the sell off seemed too deep, so I never owned it. and when it broke that consolidation, it has just run higher rather nicely.
I think it may be a bit extended and so entering here would risk some back testing the recent break out.
You could watch for a back test and buy that.
Thanks for the help. I bought OLED, love the product. PYPL I’ll wait on. Thanks
XGTI, I just noticed the day it had Yesterday 23%! Its on my watch list, not sure why? Did you mention it here before? One of those long bases CF likes.
That is not one of mine, it is not on my watch list, but it does look constructive.
hmm.. is that an I H&S Gold breakout or fakeout
Exactly?
Well that was timely
Don’t want to poop on the PM punch bowl, but I just saw long tail down candles in GLD and GDX, so be careful. The “target” price of these candles points near yesterday’s LOD.
Meanwhile, my TQQQ jumped higher this morning too, but I don’t see a long tail candle in SPY or QQQ.
https://uploads.disquscdn.com/images/9c7c4b87b2a81a9692ce82c20b2622072aa7ea2c864e0bb225a3d2eb44236c7b.png https://uploads.disquscdn.com/images/f8265a92d212ecaa91294f5114573f445b264999e32a9a418792ad62323dd185.png
Thanks Steve
Interesting….thanks for posting your observation.
Does anyone else see these? What trading platform Steve?
I use Schwab StreetSmartEdge trading platform. The light shaded area is AH and pre-market trading.
Some others here do see them ( SOG I think has mentioned them).
I have also seen them, but at times the disappear shortly after, so they are tough to catch at the right time.
I see them too – same platform as steve
https://uploads.disquscdn.com/images/b7f3dfbf9ad3e676c5ac7189e8a2fc9312db66c33d93fd42eb72b1df74b1be31.png
Somebody just cut the line on the gold anchor and tied it on the US dollar
RTTR – smaller play
broke above its 50sma, looking to start a nice little move up
Giving AG another shot, I bot back the AG I sold a couple days ago at about same price where I sold.
system is cracking – central banks so bankrupt – countries bankrupt – peak credit –
regulation corrections will continue to be introduced even though slowly – it has been time
to be positioned in miners the past weeks, imo.
I agree … though I see a final drop for miners come in December before a continuous yearly rally in 2018-19
Hmm I like this company as a
Lithium play….. Do your own DD though 🙂 http://www.arotech.com
ARTX – might be good for a short squeeze
Thanks, I forgot about that one.
See also ALB, FMC
cnbx… c’mon volume…
Love that 1 year chart
rlog dropped after earnings. reeled off 75% this morning.
100%+
+115%.. Feel like a chump selling after 70%
+ 140% *covers eyes*
CEI just put in a 12%+ hammer
If we are at an ICL would UGLD be a buy?
Hi Murphy
When I look at the chart ( say 6 month), even Gold at a dcl has pushed UGLD Roughly $9 to $12.50, so if we were at an ICL, I would say definitely.
trouble with right this minute is simply the GAP UP over the 10sma in GLD, GDX, GDXJ – I cant tell if these gaps want to fill sooner than later or will this just move higher.
AND – I think that we have our DCL with the 10sma being broken on this swing low , can’t know for sure if it is an ICL though. I am still holding my Miners though.
Thanks
This DC in gold holds a lot of important information.
Alex, if gold closes above the 50sma would you be leaning towards a new IC being in play? I think that cycles are still very muddy at this point, and your TA has much more value here.
I always buy the DCL just in case it is an ICL, because the ICL takes longer to confirm.
I also have specific indicators that I developed to help me, but they take time to trigger if price lingers near the lows for the first few days.
So for now I use T/A, C.O.T., Miners out performing, some bottoming in May ( NG & RGLD for example), etc etc to give me the reason why I would buy the DCL…And I wait.
Closing over the 50sma would be a bullish sign for sure
If we are at a DCL instead of an ICL would GDX go up for a week or two and then top?
HLX doing well!
I took a position in CY and then bailed for break-even. If it actually makes it through resistance I might take another stab, but volume is light and it is at the top of the trading range.
yuma again…..lol wow
was just about to post this. wow quite the chart
JO broke major TL…..finally. 🙂
Yeee
ha, don’t forget the ha yeeeeeee haaaaa. like that.
hahahaha
I have a Canadian list oil producer PXT.TO doing well today. This is a Columbia producer with excellent fundamentals
Gold (GLD) also broke it’s TL this morning…. 🙂
RGLD might be too boring for some of you, but I’m pretty happy with boring if it keeps doin what it’s doin
Ill take a slow 5% over a few days vs a quick heart attack 10% any day
however – I play both of them
I guess it honestly depends on where you bought it 🙂
Its a great looking chart longer term
FWIW …. I have pretty clear “buy” signals on miners today on my daily charts (GDX, GDXJ, etc) which is a price trend change because they have been a “sell” on my daily charts since the end of June. That’s why I chickened out of my AG and other miners on the pop on Wednesday because the overall price trend was still down. I’m not a cycles guy, but I hope this means that the DCL/ICL is in for the miners. Or it could be another pop and drop … don’t forget those long tail candles.
So? Signals or tails? Which way you going Mr.Nugt!
LOL, I just posted as a “heads up” for others to check their charts and make their own trading decisions. I already posted that I am back in AG. I’m very heavy in TQQQ, just letting that ride. Adding miners for a little extra pop and I think silver is the place to be this time around.
What about the tails?
I also posted those as a warning. Remember, they do NOT always hit but I keep an eye on them just in case. To me, it shows what the “Big Boyz” WANT to do, but they are not always able to get their way. Lots of traders are bearish on PM’s …. I’m actually bearish long term on PM’s myself, but they can be a good trade out of an ICL as Alex calls it.
Gold headed higher, maybe the tails are not going to fulfill
anybody is buying WTI here?
Refresh – Could break out in the future , may or may not be ready yet.
https://uploads.disquscdn.com/images/99a0a35c5fd16e4c0fde99bbc25fa4579d5f4820e351a2cd2c70904bfc0ffddf.jpg
RLGD breaking out.
BDSI has been a very sweet keeper:) and I think it’s solid for the long term based on its market niche and potential for growth. Seems like the opiod crisis is incredibly out of hand and their two products are unique http://www.bdsi.com/other_bema_products.aspx
And if LABU is about to break out then that’s more fuel for the fire!
Nice 3 yr weekly round bottom base too.
pleasant surprise getting back to my desk from summer break, Novo Resources (NSRPF) up 112% already and most of the move was just this week. I read they are finding nuggets of gold with metals detectors, so the grades must be sky high.
I ended up getting filled on a few miner buy orders over the last week or so as well, getting close to 50% invested and still looking to add into pullbacks when they occur.
awesome! let that be a prelude of things to come…………. 🙂 yah hear that GDX….;)
TSEM very heavy volume as it breaks out
Back in GDX…:)
Interesting, both gold and silver testing support from long term bull market that started in 2001.
http://www.zerohedge.com/news/2017-07-14/gold-silver-16-year-bull-market-support-test-play-says-joe-friday-0
Link did not work for me…but well done on going away and coming back to good progress in your account. It is sometimes hard for me to pull myself away!
JUst noticing a 4year rising indicator trendline for $silver 8day chart looks good..
Recently tested & remained intact…
https://uploads.disquscdn.com/images/92aef18e0d742e32c9183df6d7838eb6e35a14c7facffbcdd478f75e9931438c.jpg
Nice find. Could the lows be in for silver for now?
Stopped out of RGSE, of course then it takes off. Lol. Selling my NAK here to equalize and go into the weekend not feeling screwed. *bort*
Ric… nice ..
low vol … but takin on that 200day ..
Good looking : SPN ( energy) , SUNW ( Solar) , TSEM, PQ ( Energy getting ready?) , TRX? , NRP ( Frac, Oil, Natgas, etc) ) , HLX ( energy & wish it had more volume),
Interesting : BLRX, EYES, OMER, LCI , SQNS, ANFI,
SOLAR: SUNW mentioned a few days ago with the attached chart, looks ready to break out. , JKS, JASO , SPWR continues, CSIQ, etc
https://uploads.disquscdn.com/images/5bcf460cce4e06ccc5307d2cf677ee5b5ac0cab624ce96bf72ef8838ea791eca.jpg
nice…EYE have big plans for EYE… ;o)
wow nak
jinx?
https://www.tradingview.com/x/mIrqlpMb/
nice HPJ for you mama
Yes, Please!
Miners not acting like they really want to rally very hard, would have liked to see strong buying into the close. I keep telling myself to just put 100% of my money into TQQQ and just let it ride all year. I’m very heavy, but that quite THAT heavy (yet … LOL!)
I’m buying down here now.. VGZ MUX and GSV at eod
GL! Still a little early for me. I’m gonna hold off a little longer but I am tempted on a few names.
I like trading too much to drop it all in TQQQ and watch it.. However, I really want more TQQQ. I just dont see anywhere anytime soon I can add. Every time it looks like iI can add, it skips and keeps running.
It’s hard to get on the TQQQ train … you have to watch and move FAST when you see a buying opp. I jumped in HEAVY after it tagged its 100 day MA on July 6. It had a “double top breakout” on its P&F chart on July 10 and it was off to the races. I wish I had bot a day or two earlier but I was pretty much “all in” by July 11. I still see LOTS of smart traders that I know shorting QQQ … makes me nervous, but I stick with what MY charts say and I’m very bullish.
Yea I’m in with 100 shares at 97 and some change.. I want more but feel like I’m chasing… I leave and come back and it’s up another buck
Same! I can’t sit on my hands, even if the trade is going well!