
Friday And The Weekend
It is Friday, the last trading day of the week. Jobs numbers will be released, along with the Natgas Inventory numbers. I like to remind ‘traders’ and ‘investors’ that today is the last day to be positioned heading into the weekend. I am holding several trades through the weekend, but I have been over 50% cash for a while, waiting for a solid buy set up to form in the Precious Metals sector. Enjoy your weekend!
.
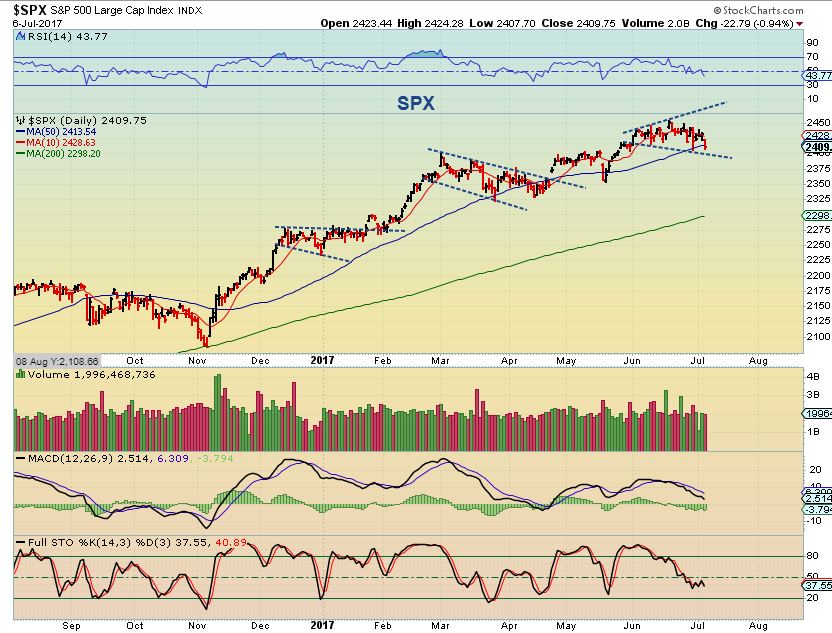
SPX – Closing below the 50sma could be a shake out. It was the last 3 times the SPX closed here. Either we sell down into the grips of a deeper ICL sell off, or look for a reversal and a close back above the 10sma ( not just the 50). Jobs numbers could affect the general markets.
I cut my hand last night and now I’m running late this morning. I had planned on a rather large Friday report, so please excuse any typos, I will not have time to review the report before I release it. I want to release this by 8:30 Eastern time. Thanks!
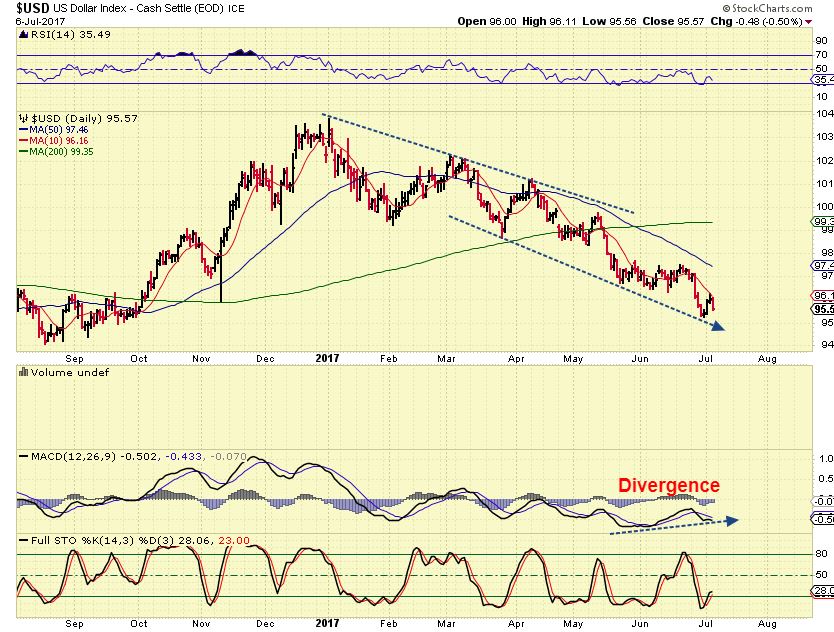
USD – We see divergence at the recent lows on the USD.
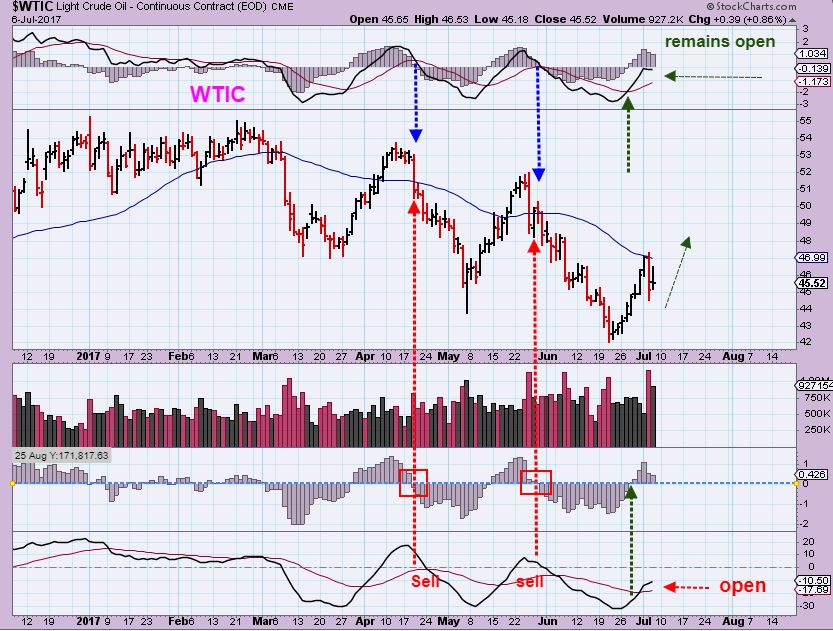
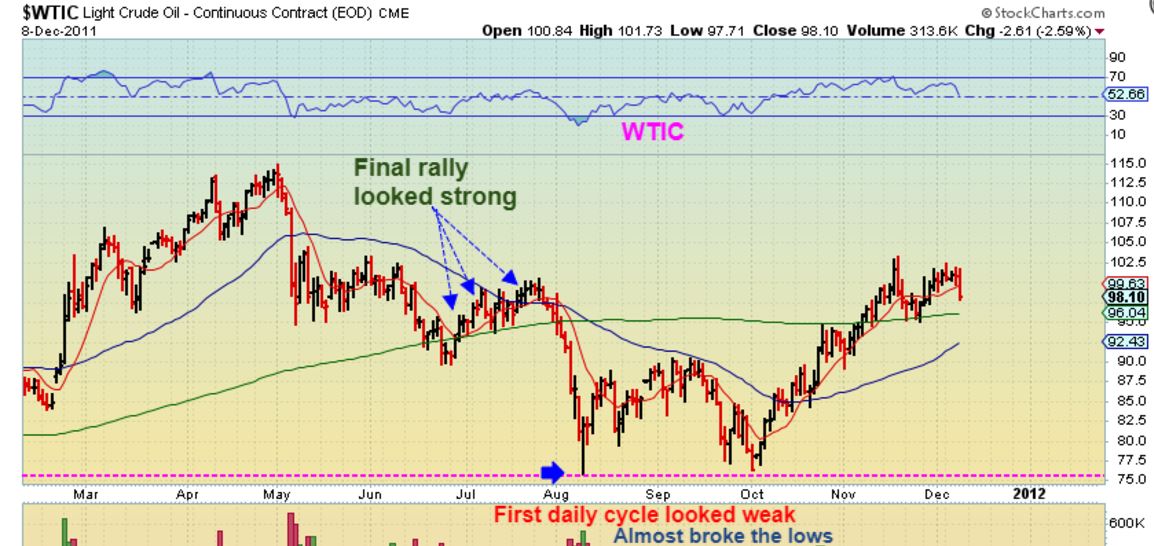
WTIC – I am expecting an ICL in oil at one of these lows. This chart is actually telling me that the recent sharp drop off of the top in Oil is a little different from the last few. These recent lows may just hold up. I’ll keep an eye on this chart.
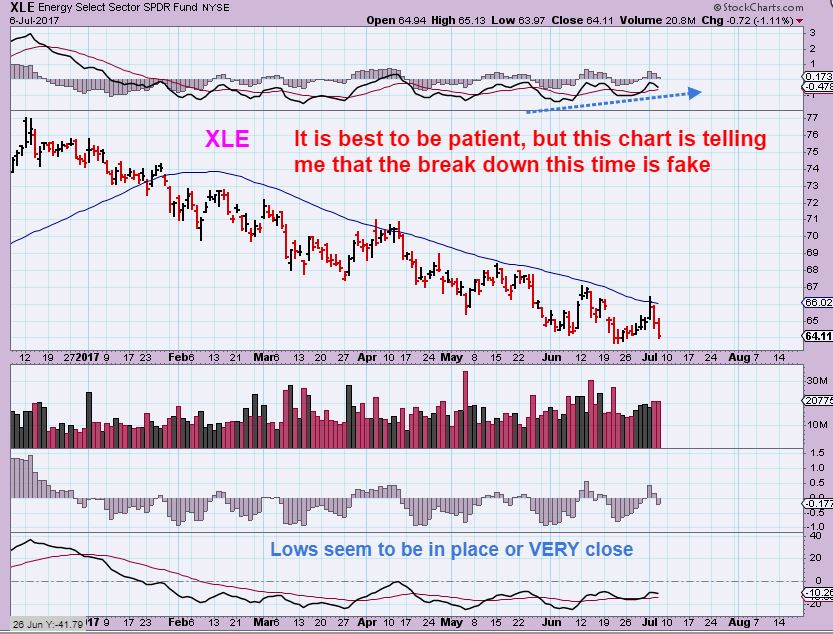
XLE– This chart also tells me that although the energy stocks are in a long term downtrend, this break down is different from the rest, so the lows in XLE should hold up too. A break above the 50sma would be bullish. Being patient with Energy stocks is still recommended, until we get some follow through. This has been a Choppy sector.
2 things that I am Pointing out here at the 2011 lows –
1. The final rally in June & July ( Final daily cycle) in OIL looked convincing, It moved higher for an entire month, but then rolled over. ( So the recent 7 day rally does not mean that THE LOWS are in place, we’ve seen the same convincing rally out of the lows at each of the last lows).
2. The final lows were almost broken again by pennies, so you could say that the ICL and then the first daily cycle looked weak. If this daily cycle drops to the recent lows, it doesn’t mean that it is weak.
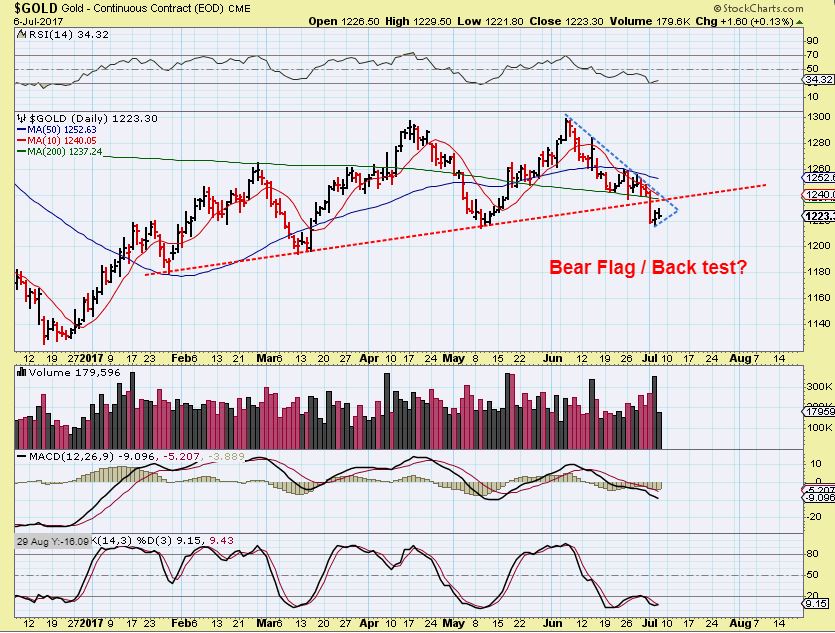
GOLD from Thursdays report– A run to $1240 doesn’t mean that the lows are in.
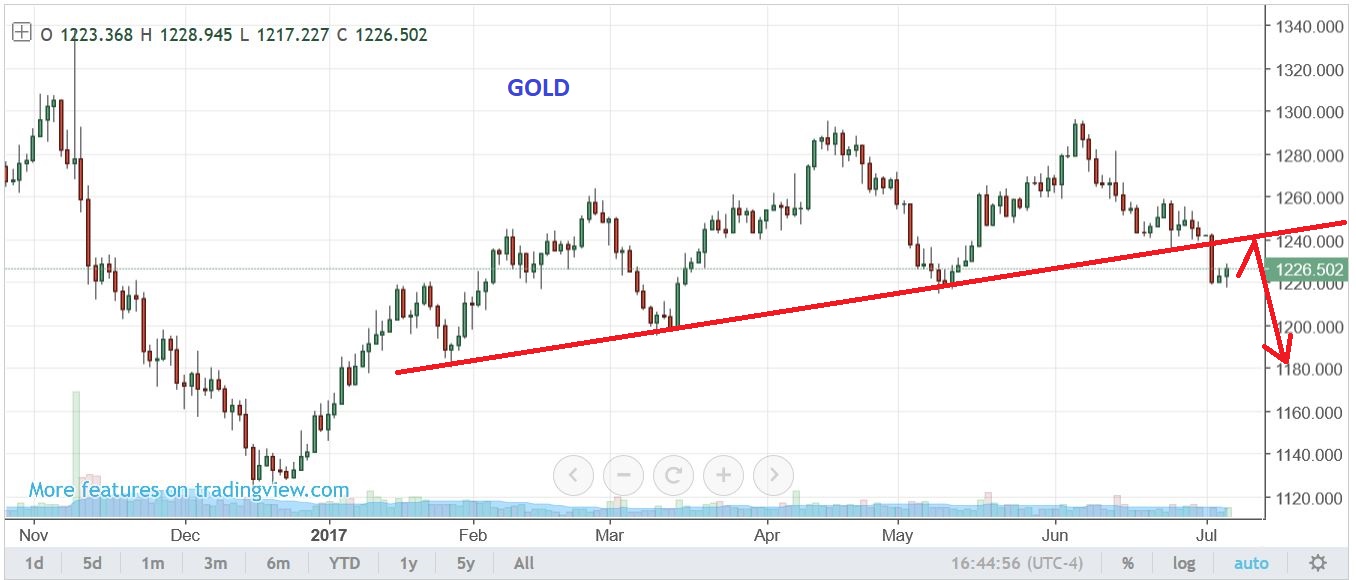
GOLD – We could be seeing a bear flag.
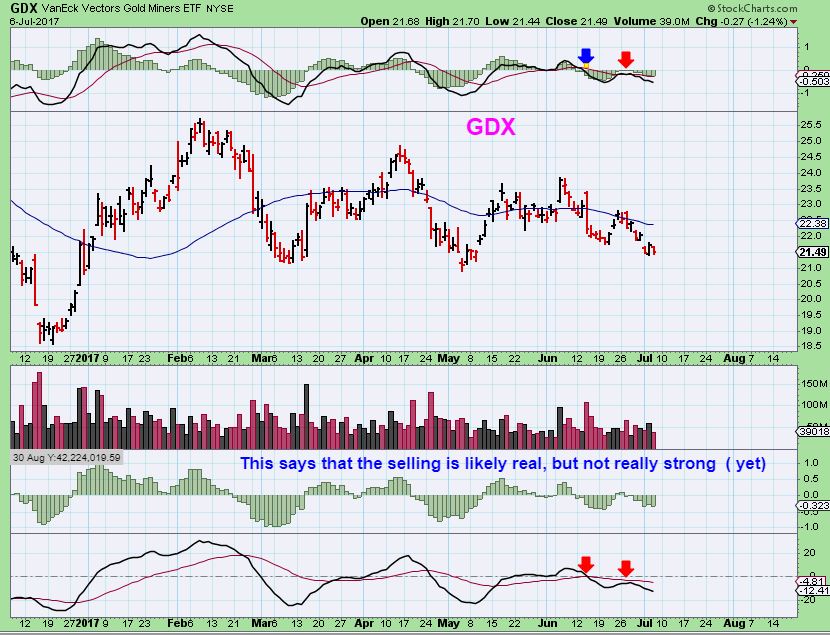
GDX – I’ve been expecting more of a drop , but Triangles do get tricky with false break outs and they also mess up cycle counts, so I will keep an eye on it.
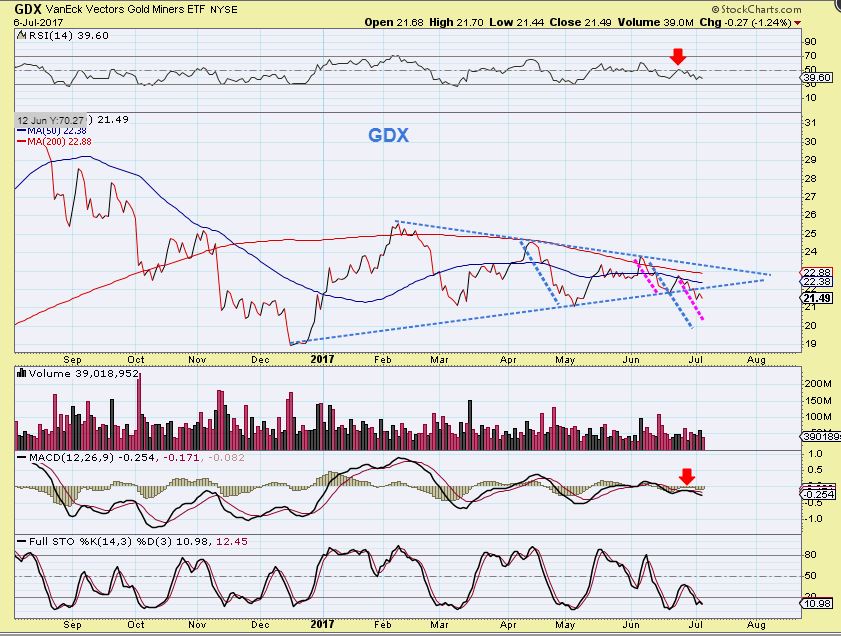
GDX – This chart tells me that the selling or break down is real so far.
I’m still recommending patience in the Energy and Precious Metals sector. It has saved many of us from the frustrating choppiness that has been found in those areas. The Miners will be setting up for what should be a very nice run higher soon enough, but for now the pain on the down side of an ICL type sell off is not advantageous.
Now just charts of Trade set ups
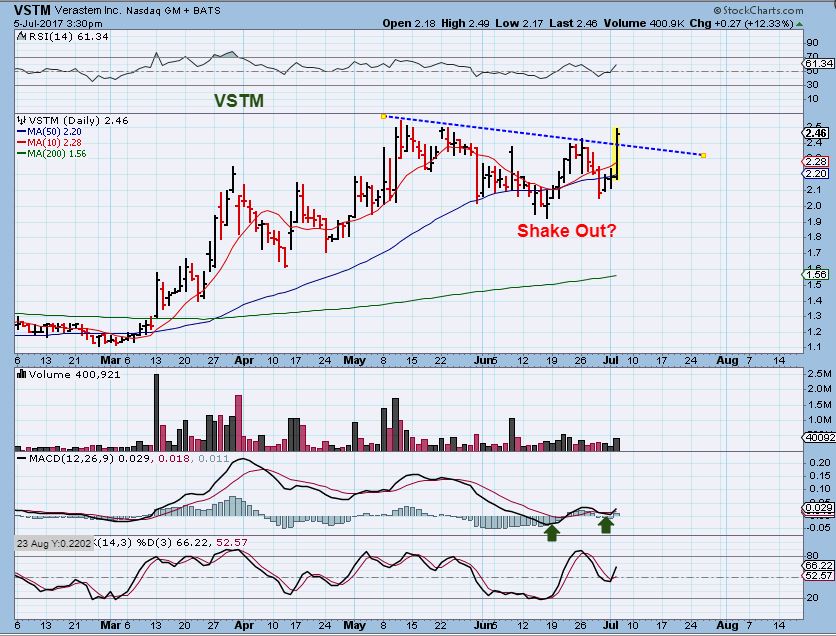
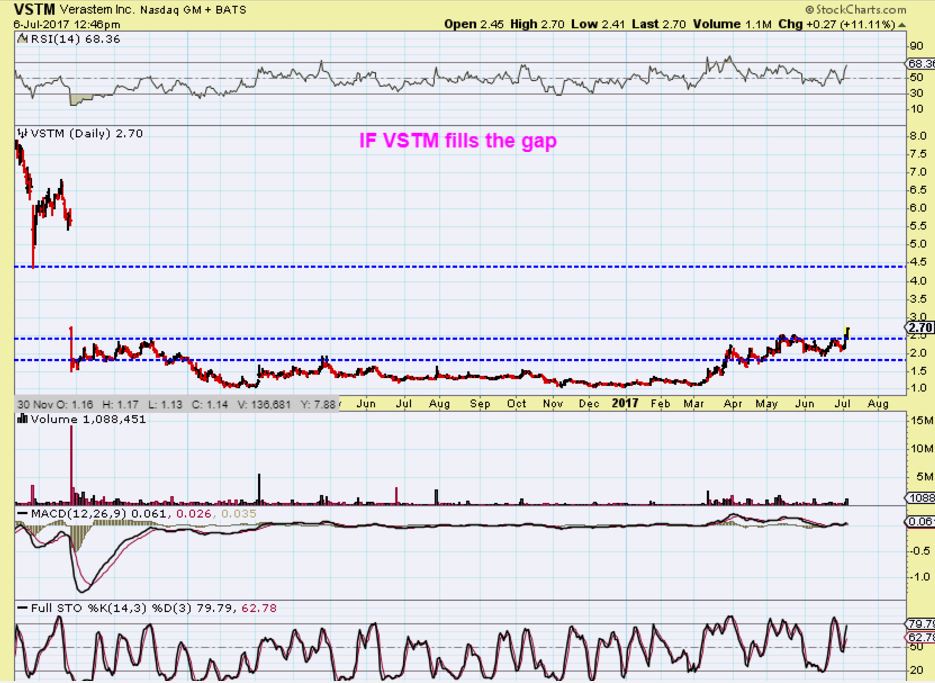
VSTM – From yesterdays report, I do like the consolidations in certain Biotech stocks like VSTM & CGIX. I traded these ones last spring & did well. It was breaking out & was a buy.
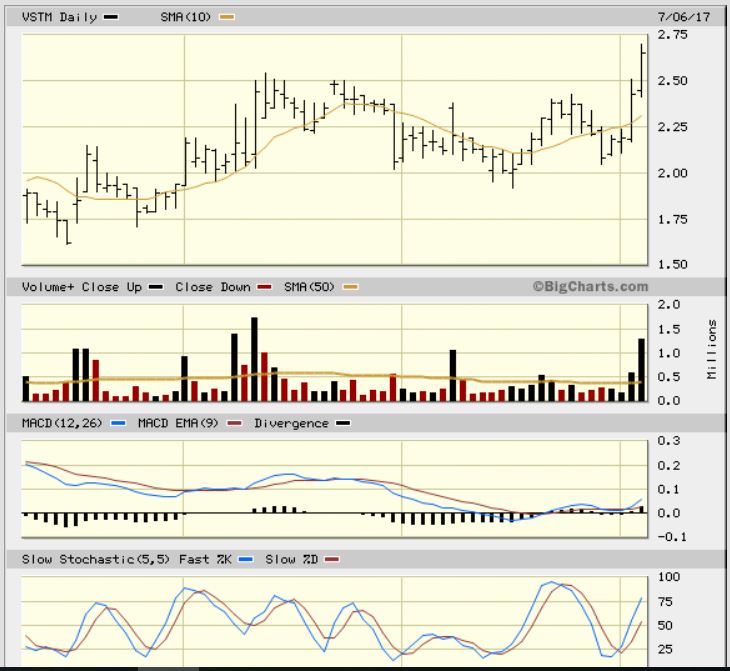
VSTM – During the morning I captured this chart of the break out & wanted to post it in the comments section, so I wrote that VSTM was up 14 cents and getting good follow through but…
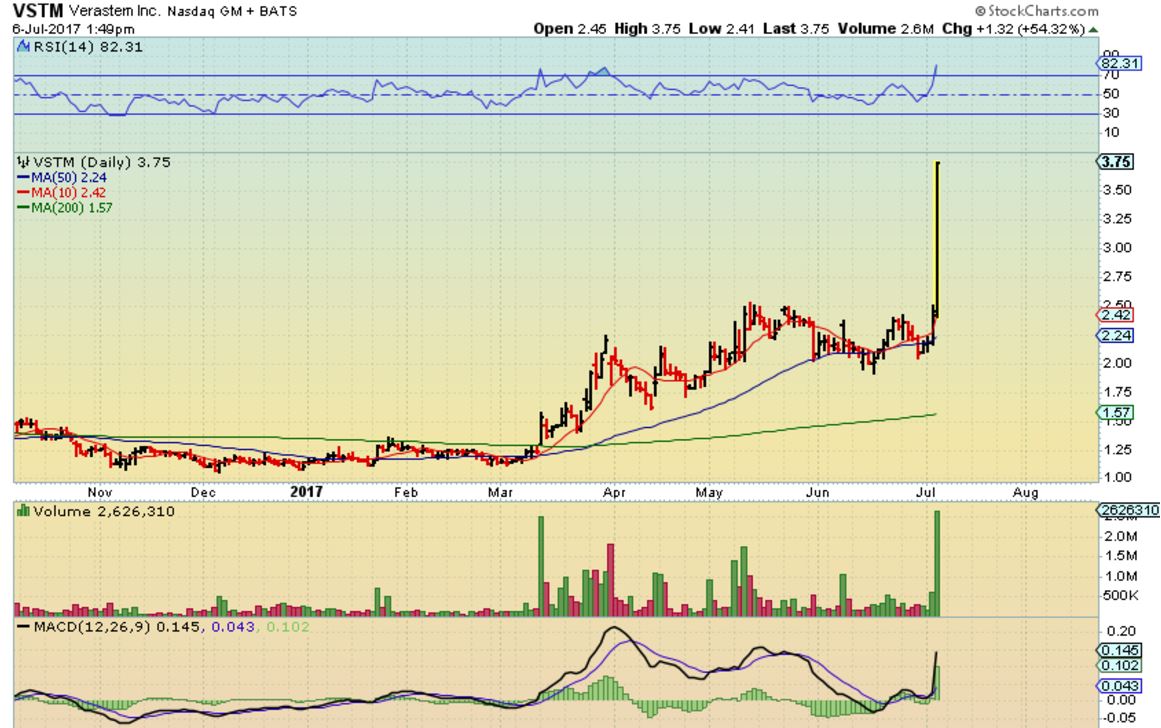
VSTM – It moved very quickly higher & higher, and suddenly we had this chart by 1.49 p.m..
VSTM – At 12:30 I captured this weekly chart showing a GAP that could fill up to $4.40ish over time. VSTM ran to almost $4 yesterday alone.
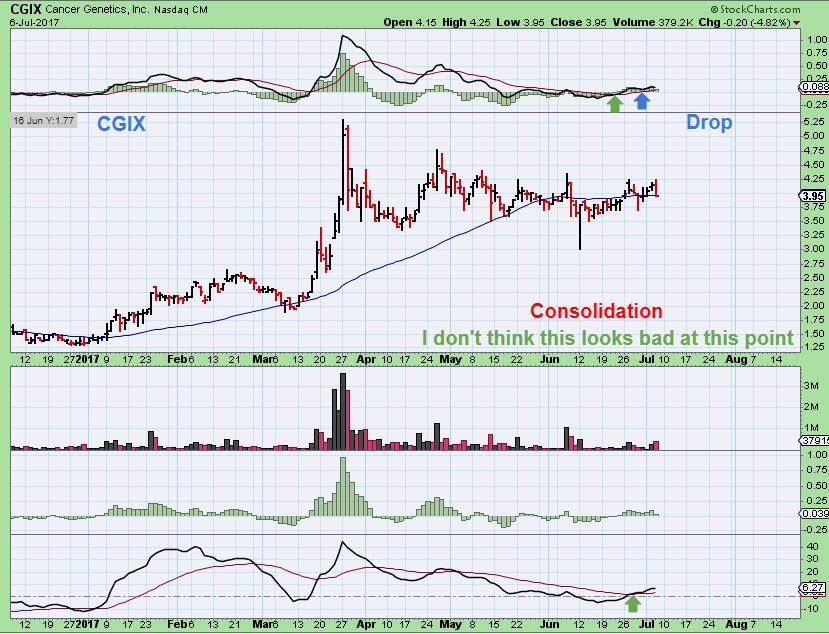
CGIX– I posted this chart in yesterdays report, but CGIX dropped …
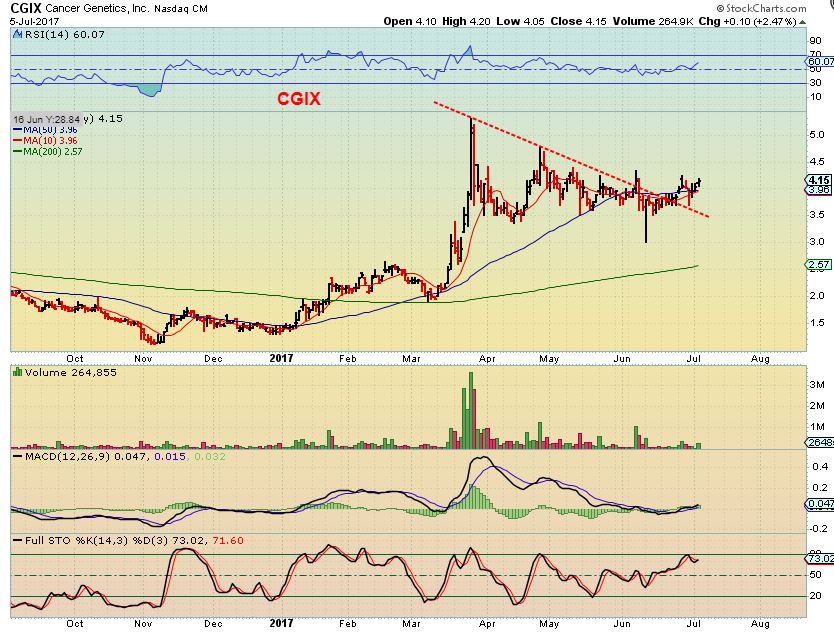
CGIX- Even with that drop, I’m keeping an eye on this one. It could still be in a long bullish consolidation that breaks out higher like VSTM did.
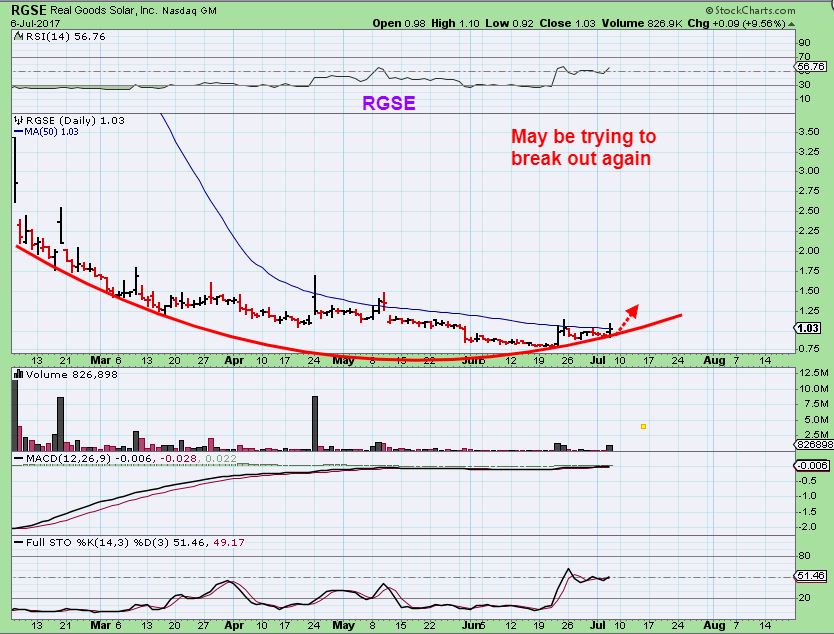
RGSE- From July 3 when the Solar stocks were popping higher. THis could be attempting to break out above that 50sma.
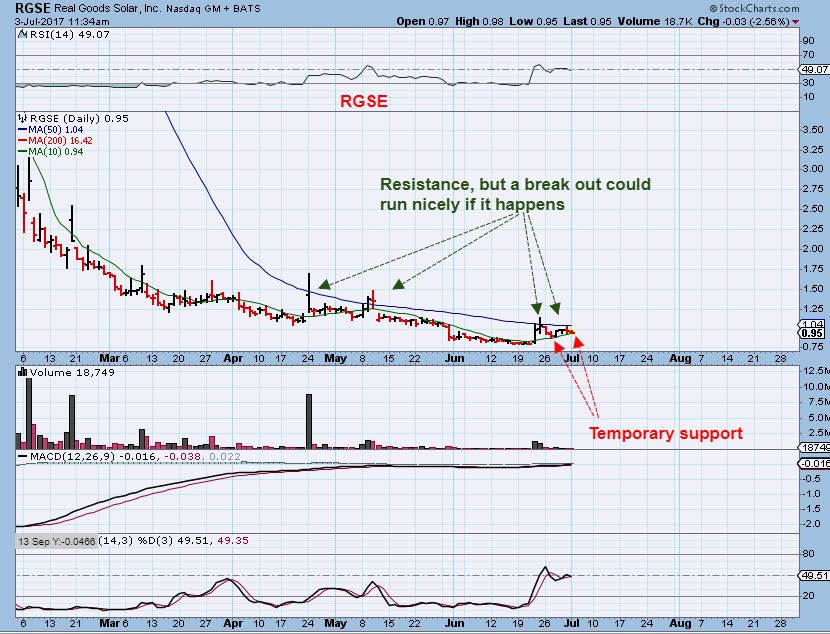
RGSE was up over 17% at one point, and closed up 9%, right at the 50sma. It may be trying to break out again now. I bought over a week ago & still hold it, hoping for that break out & run.
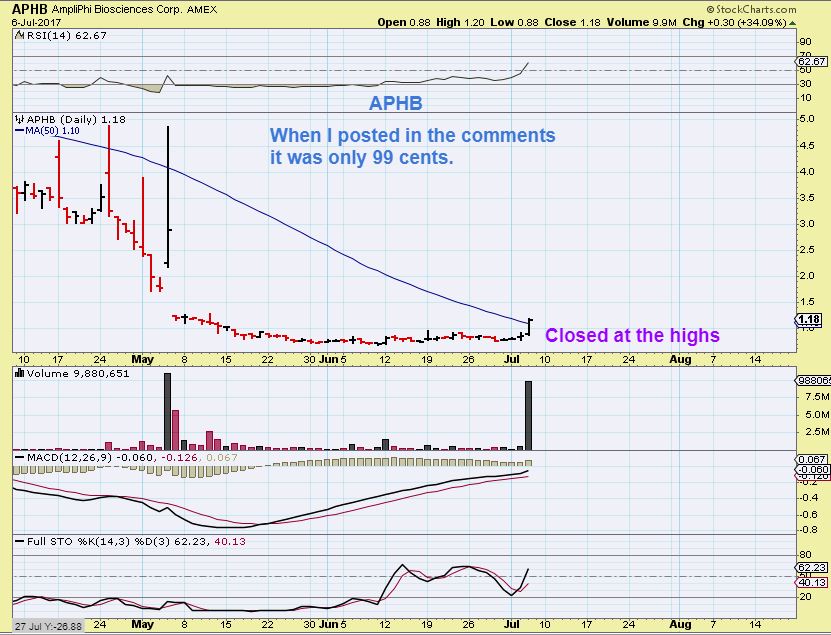
APHB- I pointed this out in the comments section yesterday when it was under $1. Volume is swelling and it is popping from a tight base. I DO NOT know the company, this is just a trade based on the chart. Usually the first attempt above a 50sma is a short pop & drop to back test it, but I thought that a quick gap fill overhead could be a $1 to $1.75 Pop. We’ll see if there is anymore upside left in this. It might be risky to jump in now, but I do have some ‘day traders’ that like to use intraday charts to scalp trades, this is probably only for them.
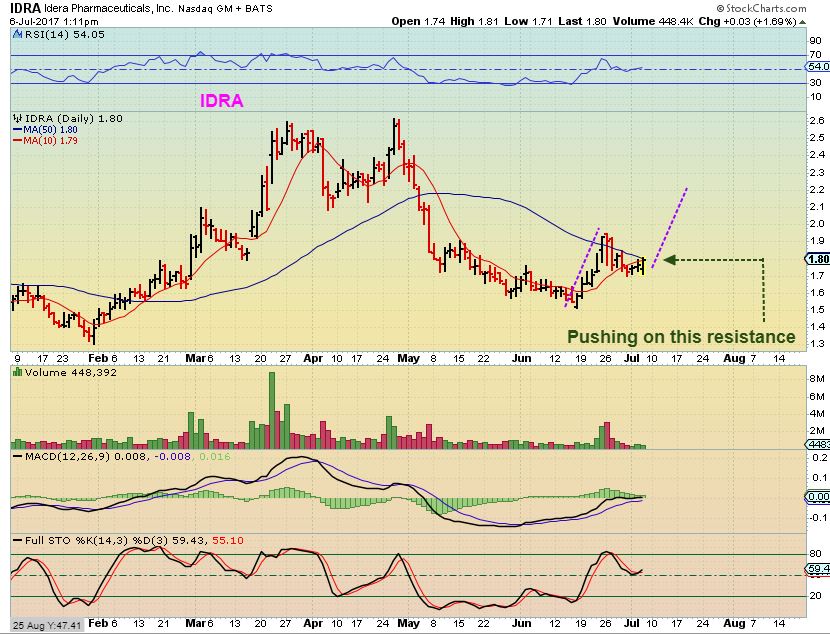
IDRA- Another Pharma stock that had a good run in the spring. This looks like it is pushing against resistance and getting ready to break out & run higher. I think that it could be a good trade here above the 50sma, with a stop below $1.70 once it breaks out.
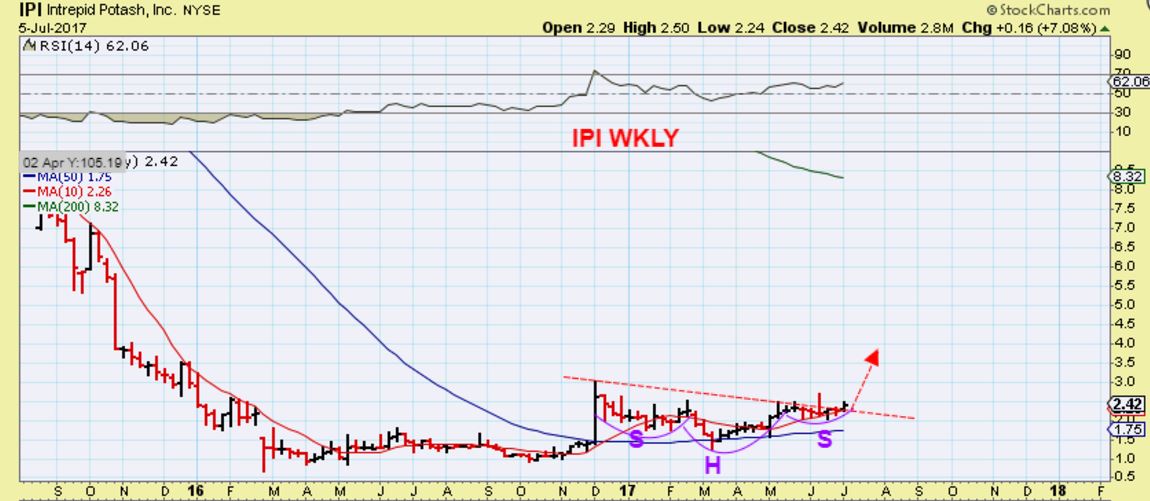
IPI – I bought IPI based on the weekly chart and this daily chart. My stop would be loosely under the 50sma.
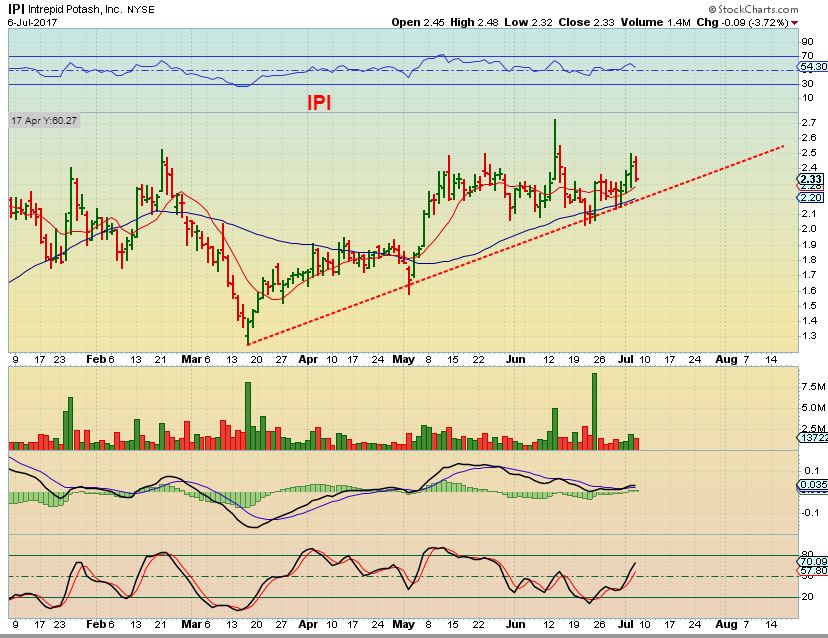
IPI – Weekly chart of an inverse H&S. This has been a long consolidation and could have good upside if this sector ever gets going. I may just be in it for a short term trade .
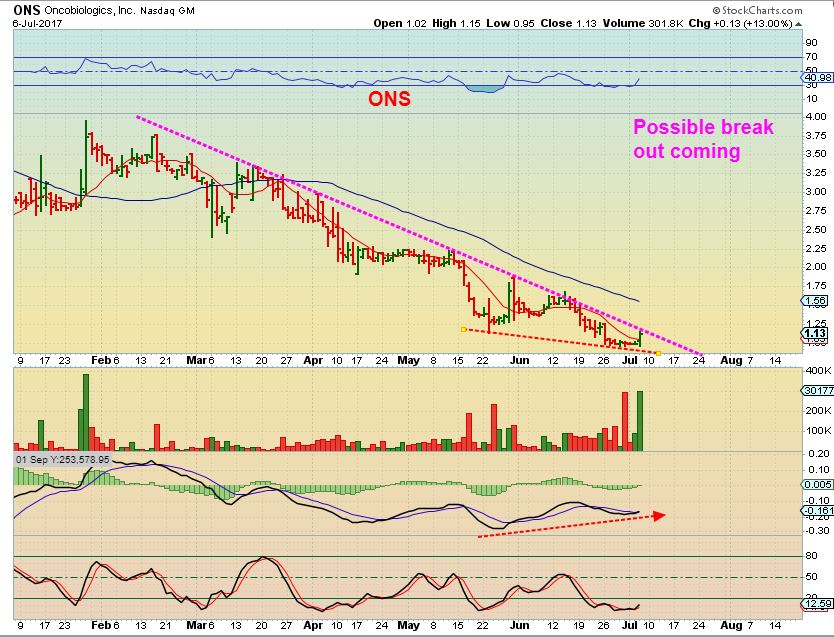
ONS – I do not know the company, but this looks pinched and ready to break out for a quick multi day trade. The blue line possible target is over $1.50, price was $0.95 to $1.15 yesterday.
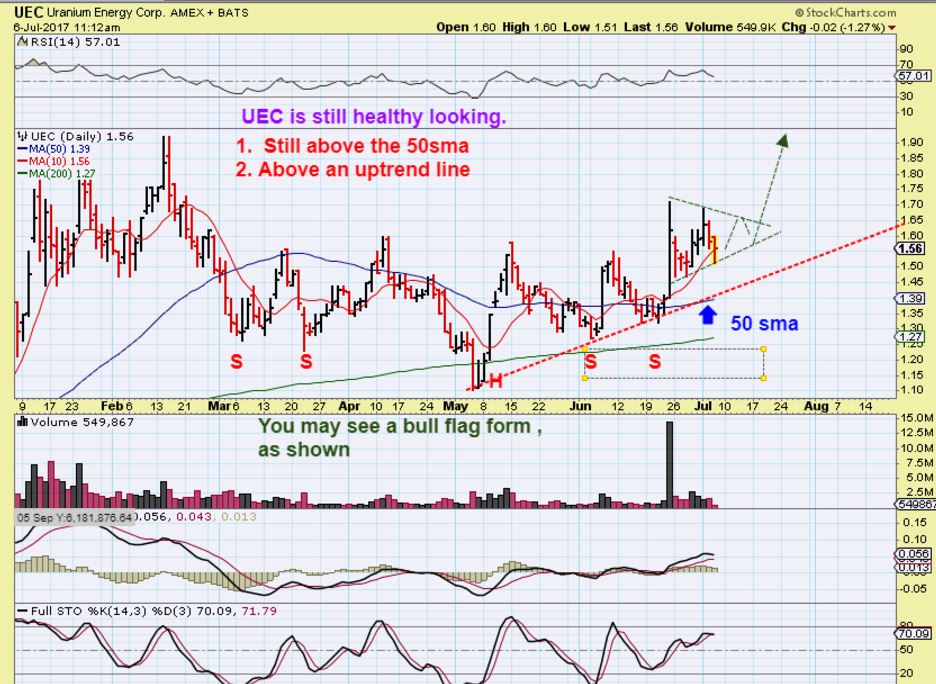
UEC – This is how I am looking at UEC since discussing the Uranium stocks. I own it above the red trend line.
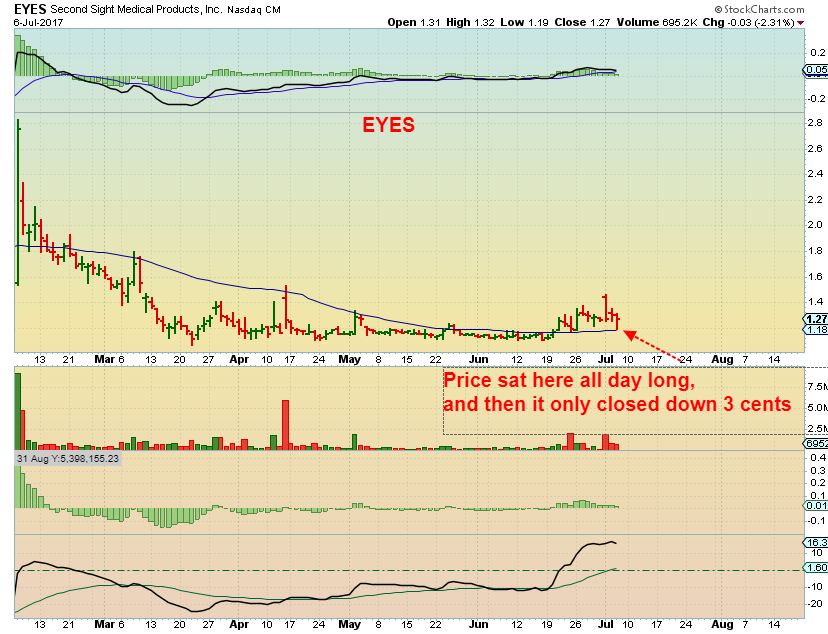
EYES JULY 3rd– I liked the POP in ‘EYES’.
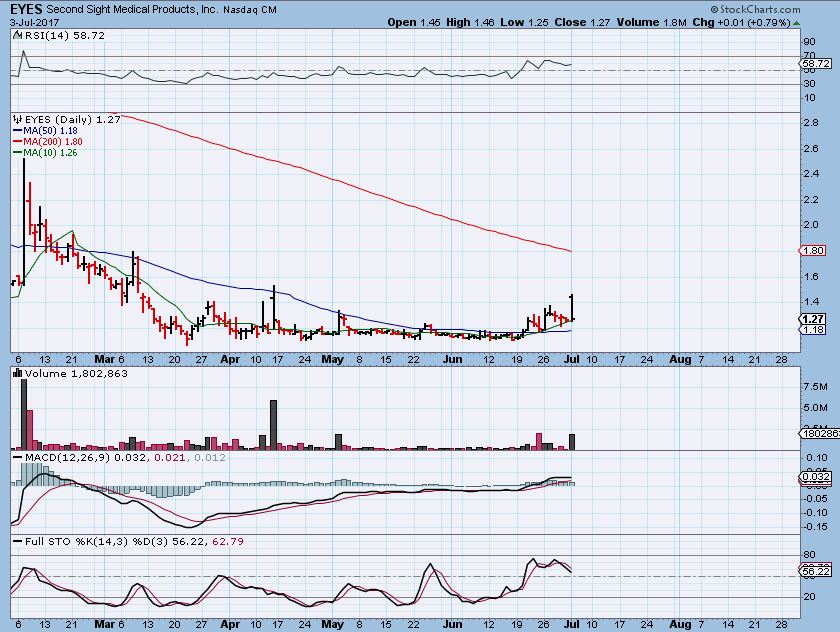
EYES – After a lONG BASE, it is still looking like it wants to make a run, and it tagged the 200sma yesterday and bounced higher. I do think that this will run higher once it breaks from this base, but exactly ‘when’ it will do that is hard to say. The recent moves do not look big, but the low yesterday was $1.19 and the recent high Monday was near $1.50, so this can move quickly.
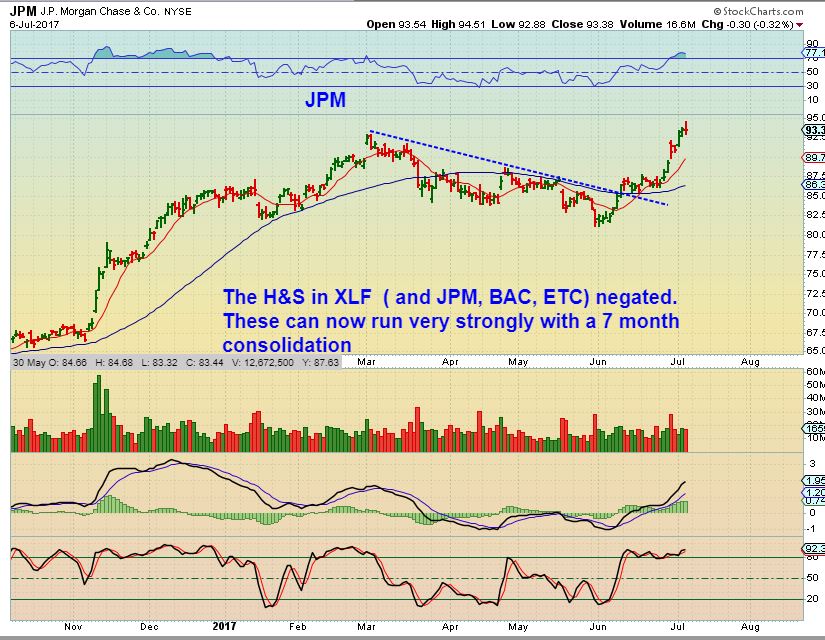
JPM- Look at the run from November through March. The BANK stocks ( And XLF) looked like H&S patterns. Now that they have negated that pattern, these can run again, similar to last Nov through March. I pointed these out as Bullish break outs in June when the H&S was negated. JPM is on the way higher, and…
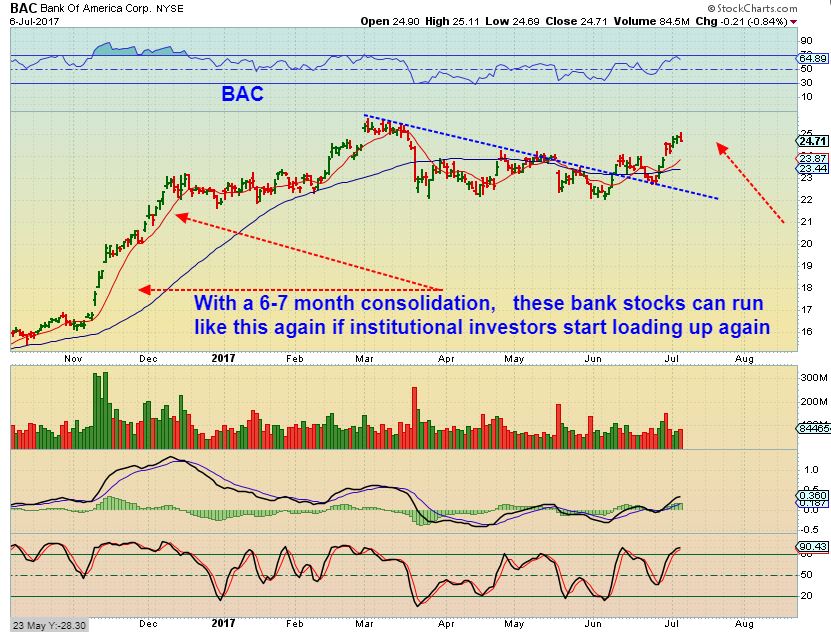
BAC – Bank Of America could do the same. Read the Chart please, and maybe wait and Buy a pull back.
MGXMF – Kind of a special story….MAYBE? I have followed this one for a while and they have invented a way to extract LITHIUM from waste Oil. They also purify water and other contaminated fluids, so… is this long consolidation ready to break into another run higher. This set up is not for everyone, I’m sure that this is a higher risk category, but the story is very interesting. a break above the 50sma could run in a big way, and…
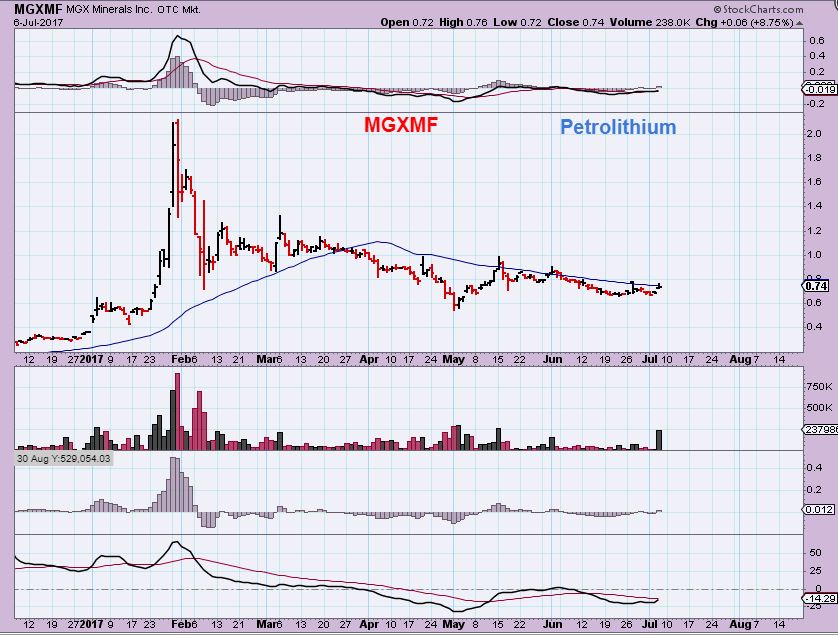
They just released this story. Buyer beware, but it is interesting, you can click the link below for the story, or I have copied and pasted the stand out part of the story. …
MGXMF is pleased to report that engineering partner PurLucid Treatment Solutions Inc. (“PurLucid”) has filed a new provisional patent related to the recovery of metals and minerals from produced wastewater brine in the oil and gas industry. Patent rights have been exclusively granted to MGX for the life of the patent and focus on concentrating metals and minerals such as lithium, magnesium and boron from produced oilfield brines.


Did you see that crazy “tail” up and down on gold?! Crazy couple of minutes!
when was that? I saw the one in silver last night….
Sorry…I answered above…wrong thread
I saw Silvers flash drop too. I’ve seen it before, but the real answer as to what caused it is hard to know.
though from a pure chart reading.. I know a red candle with a long downward tail at the top of a trend is a hanging man and is a bearish reversal, but in reading last night would the following be true:? that the long tail meant that sellers were trying to drive the price down but that buyers stepped in and pushed it back up? Just wondering if it could mean that bears were taking profits on short positions and then took positions at the bottom?
At the lows, a long wick at the lows usually does indicate that sellers were overcome by bulls, sellers could have covered shorts on the way down, etc – Usually it is a reversal candle, but I have seen those fail at tops & bottoms – especially if they come during a late daily cycle and the daily cycle is not finished yet
The other day I think you mentioned the down target for gold was about 1210 or possibly even 1190….what is your view now?
Well, I usually have initial targets ( And those usually get hit) , but..
In a sell off that could be ICL related, targets often get surpassed by the extremes of an ICL.
I use Time over price in that case, and watch for signs that the selling is finished. I begin to look for the lows, but finding that low can take time & patience.
I have found that if I give a target during a sell off, people try to start buying in that area, without confirmation of a low.
Yep, that’s exactly what I would do. Then post it on this board!
Good morning Alex.
Thank-you for your report, look always forwards to see it.
Small question, are you planning (or are) to go short Gold or the metals?
Have a good trading day!
I may or may not trade ‘Gold or Miners short’ as a trader in my own account ( I did a very small short term short this time so far) , but this recent selling has been very choppy , and recommending it here would have only been frustrating for the majority.
Triangle patterns are not easy to trade.
so sorry to hear about your hand – hope it isn’t serious. I posted last night about the strange action in silver. It was quite the flash crash. Not sure what to make of it …..
stoprun?
lots of guesses out there, computer glitch, hedge fund dumping, central bank shenanigans, cyber crash related to EU meeting, signal about jobs report numbers….
8:30 candle low 1217.63 then 8:35 candle 1228.70 high…on gold spot price live chart…I had the 5 min chart up and it was all on one candle!
Both silver and gold have already gone lower than there morning lows.
The jobs report was the perfect storm of bearish for PMs. I cannot believe I was too chicken to trade ahead of it. Boo!!!
Thx, Not too serious. I did see that Silver drop too.
Happy weekend everyone – short day for me so I can go hit a ball around. Hope your hand is OK Alex. I just noticed XLE printed a new low by 2 cents in the pre-market
Rob, going out for 18, where is the course of choice?
Gold or B-Ball? Either way, it beats sitting in front of the screen, so enjoy! 🙂
I think he left without us!
LOL – Yep
tx CF … hope ur BOO BOO is ok………. https://uploads.disquscdn.com/images/1a8551171cb7d9ce9ff925691f00013a742b8e9b3746af51342ff454a8dbd4c4.gif
Thx, If I can stop hitting it and re-opening it, I’ll be fine : )
Needed just a few stitches to hold it together while it heals , but I opted out.
#SuperGlue
Hey, thats funny, My wife does have some skin glue ( Dermabond), but it doesn’t work on this cut.
It’s across my thumb from one side to the other, and it tends to stretch a lot.
ooooo…. how’d u do that… ouchie
#DuctTAPE
GLBS Maria 🙂
yeah… im in that VSTM AVEO … ANNND babysitting 3 under 3 :-X
and CGIX (in my trading act)
was**
#ShitTheBed
Similar to what EYES did-
I have seen those pop-reversals ( after breaking out over the 50sma) do happen a lot. It then either
1. Closes that gap open and starts moving higher again that day or
2. Goes sideways to try to launch again sooner or later.
There is still hope later 🙂
VSAR is getting interesting … as is SPEX .. at the 61% retrace… hmmm
that MGXMF is too… TRUE…wow
I can’t tell you, you’d laugh
gutting a really big fish, right???
OK 🙂
Golfing today ?
real soon – at a little known course beside the rockies.
May you follow the path of the straight and narrow ( Except for Dog Legs). Have fun!
cleaning the knife….?
Trying to trade silver futures?
Sorry about your hand….heal well…maybe in your illustration above you should hand the flipper over to your honey and you take the wine instead!
I may just do that tonight, Thx nancy 😉
Thank you Alex for your dedication to us. Hope your injury heals quickly and fully. Kick back this weekend and rest if you are able.
Thanks Kenny, It’s not a major big deal,
just a nuisance ( and it hinders my typing – I cut my space bar thumb- lol)
Did anyone else see that flash drop in silver to $14.278?
Have you read any of the comments below yet today – lol
It was mentioned several times
Skim reading…..
Interested in seeing if Silver can break the Dec. 2016 low……
PRNT seeking a bottom……1st tranche.
VJET also….
GOOG looking good off it’s bottom…..
Starting to take profits on my TLT short….
Nice job taking profits when you did on oil! What was your tip off?
Look at $WTIC with a 50sma – that was mine
Sure was. IF we did get an ICL it will fight back passed it next week. If not, it could get rejected again.
Thanks Bill…..my short term indicators were all overbought. Stochs, CCM, RSI’s etc.
Shaking my head. My indicators were also overbought. Thought I could press one more day before oil inventory and the damn news out of Russia killed it before I got a chance.
Lesson: take all or at least some off the table when you see the overbought. It’s one thing to miss it but I checked and it stared me in the face!
X down almost 5%…not sure if I can buy it here
GLD broke the May 8 low now also…..
GDX will most likely follow…..
SLV double bottom ?
This is now getting interesting…..
Choppy Choppy market sectors lately…
Takes the fun out of trading medium to longer term
yup yup and yup!!! Especially for those of us who can’t be in front of a screen all day!
I am having no fun at all!!
CF….
Would you consider letting us know when you purchase a stock and why so that we all might follow the trade with you?
No entry price needed or where your stop is. Then let us know when you are scaling out?
I just think it would be a good learning experience for everyone in real time…….
I understand you explain “trade possibilities” in the Reports but it’s different once real money is on the line.
I have been doing that more in the comments section, I have posted in the comments when I have bought. When I have sold a partial position scaling out on the way up , when I have been out…but I do not & will not for every trade that I do.
I am a very active trader, you can not & should NOT follow all of my trades.
When I started this web site – In my reports, the purpose is to get people positioned in LOW RISK SET UPS at important turning points. Precious metals ICLs, ENERGY, etc,
This site teaches you what I look for when I trade, I explain many things in detail to teach people here how I trade, and it is a learning process,. When the time is right, I do give proper low risk buys at ICLs fro everyone, but I DO NOT think that everyone should trade the way that I do.
Sometimes, people should be more patient if they are not active traders or in front of the screen all day.
FEE and CY …. hmmm
I’ve had CY & AMD on my watchlist forever. I like the longer term charts and consolidations ( And AMD was recently a buy )
What is FEE though?
lol sorry … kids all over me… FEYE
G-MA? !!! x3? Hit the baby pool.
I believe recently in the comments I have mentioned that I was buying RGSE, SPWR, UEC, TGB, and IPI – I post charts with them at that time, then later that night I put them in my report as possible buy candidates.
I still own all of those, except that I posted I was stopped out of SPWR.
Maybe just a tad more clarity somehow?
Maybe a list of what you currently own on a daily basis ? It is hard to follow you sometimes because of your high trade activity.
Let me be clear here and this should help readjust your view of things.
When I opened this site, it was not to be a day trading site. It was not to have a comments section that I am glued to daily, but that is more of what it has leaned toward. The pay service is for the reports, and I do spend 4 hrs / day working tirelessly to provide good usable content at what is a fair price. The reports are designed to guide traders to avoid getting caught in major sell offs, to teach them to stop trying to catch the lows and get stopped out over & over & over again, and at ICLs, I provided a vast number of trade ideas that have been very profitable. Most of the time during the choppy sell off periods, I have recommended that it may be best for most people to patiently wait for the FAT PITCH, but we do have experienced traders here.
I opened the comments section as a provision to have people discuss their trade ideas, and I have added my ideas here too, as a bonus area. It is a trading community, but BEWARE who you follow- some traders & their trades I would not agree with. I add my thoughts from time to time, and rcently I have shared charts mid day of my trades that I have found in my trading. Example: “Hey, I see UEC breaking out. I bought it here, have a stop under the 50sma, and the whole sector seems to be lighting up”.
The main purpose of this site, howver, is not to day trade. Again, it was to help people avoid getting caught in major sell offs, avoid buying the lows all the way down, since their are many false bottoms that suck people in… and get into good trades once an ICL is in place. It was to help teach traders my methods of trading. At times thatt would be in Gold using cycles, or Oil/Energy, or other areas. THEN I offer trade set ups in miners stocks set ups, Energy stocks or etfs , and various sectors. When the ICL has been in place, I chart and show buy opportunity and set ups that have great potential, and we have done VERY WELL with some of those areas in the past at the ICLs.
On Average ICLs in Gold come only 2 times per year, so there are times when people should be patient and wait, switch to another sector like with Solars , ( or short into an ICL if that is their comfort).
AS A SIDE REQUEST – I had been receiving emails asking for ‘trade set ups’ for the more experienced traders to handle on their own while waiting for ICLs, etc. THAT IS NOT MY REASON FOR OPENING THE SITE, but I was asked to show chart set ups that I find possibly bullish, and experienced traders could decide to trade them or not. This was not what I originally purposed with this site, that is extra time consuming for me during the days, but I do that for my readers. I try to do my own trading & answer questions here to help the readers along. That is extra, the reports are what this site is for.
So I have mentioned that I would offer trade set ups for those with EXPERIENCE ENOUGH to try to trade these on their own while we wait for the FAT pitch. With your trading experience and some added help from me with these charts and my thoughts added in my reports, additional trades can be taken. I have repeatedly stated that in the past.
As you have seen, I am not always here in the comments, and I do want to be able to set stops and go away on some days, so I encourage my readers to understand themselves emotionally, their trades, understand risk, USE STOPS, do some due diligence, etc. to help themselves in their trading. Use my methods that I teach in the reports.
We are currently in choppy markets, so trading successfully has meant FAST turn around for most trades. It is difficult if you dont just jump in, take the money & run lately. Day trading has worked, but buy & hold has been choppy & 50/50 for holding on to the gains. This is where EXPERIENCED traders do well, but some at work trying to do a few trades a day can get burned.
Please know this from here on out- My purpose when I started this site was not to spend 3-4 hrs each night analyzing charts and writing reports, and then also spending 7-9 hrs a day trading in a chatroom. You signed up for the reports, and they should keep us balanced and alert to Market trends, sell offs, and buying opportunities.
I cannot tell you when I will or wont be in the chat area – as I have repeatedly said in the past. Summer is short in New England and I do want to go out and enjoy my days too. So I repeat what I have said in the past… PLEASE TAKE EACH TRADE AT YOUR OWN TRADING EXPERIENCE LEVEL, and know your own trading aptitude. Know where your stops are, and if you have learned anything from me, it would be that I often get into a low risk set up & Sell a little as it goes higher toward my target. Sell some on the way up and let the rest ride.
I’ve said all of this before, I hope this time it is understood that the reports are what you signed up for and that is mainly where I work for you, the rest in the chat area is where traders share ideas.
I am NOT asking you for day trading…..I got that covered…..It would be nice to know your open positions is all maybe at the bottom or top of each report, Nothing more….if you are not willing to do that I understand.
Send me a private email
Uh-oh! What’s really going on now! 😛
I am glad you clarified this. I am not a day trader and don’t want to be….and I sometimes feel the pace too fast for my style. I appreciated all your guidance and comments, on the fast trade set ups too, as I am learning from observing. I really appreciate your insights and expertise in the area of cycles as well as charting. Thanks.
#TeachersPet https://uploads.disquscdn.com/images/eb26c5f6b75ecb2db40f60fedbc75c70cef5dd8745e2906538386499dc3550a4.jpg
That’s me! Say….what’s with the post up top of the thread?….where you gave the best info ever….nothing! [Just teasing!] Oh, just reopened and now it says Solars instead of just your pic and no words! ….sorry…I take back my tease.
Thank You Nancy – and I agree with you . In choppy markets recently even some of my favorite set ups still only quickly bounce and then end up dropping shortly afterward. If I dont sell the POP ( And I dont usually) they start dropping and end up stopping me out- so at times, I dont want to be a day trader either. 🙂
I was hoping for more buy & hold with UEC, SPWR, RGSE, etc – so far I’m stopped out of SPWR, still holding the others and they are choppy, giving back gains. I was leaning more toward a possible trend higher starting, but so far the trends are elusive.
https://uploads.disquscdn.com/images/ed8b2fd0346320ac7e14d8b721342ee27445ca193be1ff1ba0a2ef198b2a248d.jpg
The issue recently is that the market is only giving us very short-term trades! So, I am with you, I want at least a few weeks and maybe longer but each time I try that last few months it turns out badly. Hope we get some solid trending moves shortly!!
I subscribe to this site specifically because I am NOT a day trader! Lots of sites provide buy/sell signals for day traders. A good friend of mine (and Alex) runs a good day trading site, but I can’t follow his trades because they are much too fast for my retirement accounts where I do most of my trading. I like to get into swing trades that I can ride for weeks or months and Alex is excellent at pointing out the “ICL” buying opps. In the meantime, I skip over all the trade set-up charts and wait for the next great buying opp. I’m still 100% in cash right now.
I have followed a number of sites that give you each trade. Buy, stop, and target points all spoonfed. And you know What? I’ve lost money on all of them and done much worse than I have with CF!!
I have always traded for myself that is not the point.
Oh hey, Ken, I was just sharing with CF. To spt some of what he was saying, not to dispel your comments. Don’t take offense.
I gotta get to work so was gonna post this later (when no one reads it). Basically, agree with what he said and his reasons, but full up comments on say 2 trades as a learning exercise with full understanding of no future commitment. Maybe he’d go for that.
No worries Cason….
lol…ummm err … i guess that’s https://uploads.disquscdn.com/images/2ea239d3eac3f573b5385dbeafc0ec38cf2fb8fca84db0b344dbae42bcd65d7b.jpg a compliment
I agree with Ken! Id like to see more of your trades, just to learn more about why you think the trades are good. I appreciate that you have been listing more of your trades in the comments; keep up the good work. I completely understand that not all of your trades are for everyone. I am in front of the screen all day and still get burnt. BTW, I still don’t know if you got out of OWCP after you bought it.
Do you remember what I said about OWCP when you asked?
I said that I am watching the 200sma and would mentally stop out loosely under that. It has just passed under it, so I am close to selling, but I give it a little time
Oil down big, under 44
Yep, OAS new lows, XLE/ OIH new lows, RES & ERF broke the 50sma ( But still inside of a consolidation pattern).
Pretty ugly sector lately
Thanks, Alex. Please let us know when it’s safe to get into XLE or WTI (the stock) again.
I have no idea of the cycle count in Crude….I was at a 9 mo. ICL’s but…..
Waiting for 38 🙂
thanks Nord.
Took a speculative position in AG Aug calls
https://uploads.disquscdn.com/images/ffa8280e75ed806941dc0190e48f83b85b98e48688fcbbc7925c442d30792c85.png
Yea….nice trade set up Nord…I do that often myself, very controlable risk.
https://uploads.disquscdn.com/images/08d5a00c28b4a695b1fad0df7513f579e891a1f8e86d1bd69d2bbfc62817cd75.png When everybody is bearish…
gdx needs to hold that 20.89 ….. 😉
At this point I think that is “unlikely”….. so much for the May 8 low being an ICL. 😉
yea the gold bull perplexed me …..;)
Well we both know that this was certainly a possibility…….lol
I do see it now being in a wave 2 A B C corrective wave from Dec. 2015 low…..will “that” hold ?
I like the long consolidations in both CDE & AG, but I’m not buying at this point.
I hope it goes well for you, I do see some Miners bucking the selling.
Has anyone mentioned that $gold has just broken May’s low? $GOLD is now in a confirmed move to its ICL.
https://uploads.disquscdn.com/images/42801e0262b5014d25e672098396c783c5c2f761978e609ec75aecdee399aaa7.jpg
Saw that. But I interpret it a bit different. We also made a higher high in the cycle, now we made a slight lower low. In my universe that is called symmetry.
I am not a cycle-expert, but I do believe we had what the cycle-guys call “swing low” a bit higher and hence already had a failed daily cycle.
Pardon my ignorance, but does that mean higher or lower for gold? Thanks, John
Much lower, per Nord.
Thanks, Carson
Sorry John, I missed this post – Yes, I am thinking lower prices into an ICL. Working on the Weekend report now.
That is how I viewed it Nord, as a failed daily cycle and if that proves true- I would expect more downside time wise.
Yes, might happen. If my consolidation inverse HS scenario is off, then I expect 1150 ext to 950.
I agree …. which icl will be more compelling to buy NG or Miners in a few weeks time?
Imho both should be good
I am “very interested” @ 1202.50 with a stop below the March lows
horrible for silver
Silver:
Since it broke the Dec. 2016 lows it is now in a Corrective Wave 2 with the Dec. 2015 now THE Low….how deep will she go is the question >>>
So we’re still in C of 2 and 1 of 3 never began, is that correct?
Back in Dec/Jan we all thought this was 1 of 3. My thinking in Feb was of course, WTF, that kind of wipeout should not happen in a wave 3. That also pushes the magical 3 of 3 out until 2018. Anyway, I like how you are thinking, Ken!
May 8 low was the key for me once broken changed the EW Count …….
Yes now in a corrective wave C of 2….Wave 3 is coming. 🙂
Entered first LONG gold position in late Aug calls @ 1209.X.
Close to my intitial target zone of 1207 which may be as low as 1205 ish due to time distortion.
A tad early for me…..
Last long entered 1207.9. 1207 was a target I had from June 6th. So have to stick to my plan. 🙂
solars….. hmmm
You mean like SPWR for example, just about where I got stopped out earlier this week 🙂
https://uploads.disquscdn.com/images/ddf5b40e7df3b3b13f3f54527e711f3b2fe7f9365413ac7acff73fe12ce9fddc.gif
Some Miners selling down at lows again ( CDE , AG selling near lows, EGO breaks below all lows ) and others really seem less affected by Gold being down $16 & Silver gown $0.65
See NG, BTG, GORO, not so bad….KGC just bounced off of the 200sma, but only about 50% from the My lows to June highs. IAG selling today, but still up near June highs too.
Quite a mixed bag.
NASDAQ lookin good //// looking to enter long.
ZN killing it, again..
yes, that is a 4 year long base. Nice little rocket there
SO this is the chart that I posted when I bought TGB. I expected a break & run to former highs, forming the complete inverse H&S pattern. TGB is moving higher now, but I did want to mention this observation too…
It could continue to stall sideways because ( unfortunately) when you get these inverse H&S or even regular H&S patterns, they often form symmetrically and that said, this right shoulder could take more time to finish forming. In fact, we could see TGB continue sideways until it finally reaches the 50sma.
At this point, I am still holding it and there is also the original idea – that it will form the symmetrically matched other shoulder on the way higher to the $1.50 area.
https://uploads.disquscdn.com/images/ae8391b9b784479be73e6553e1ecfde7facd739e91abb9cedfc46dd45763f003.jpg
CF: SMH any thoughts?
lol
Disgusted I missed the PM short. I was WAY too early in 4th DC when I started at day 8-11 and we went right translated (WHAT?!!). So this time I went cautious in case it slid late and now I missed the trade. Ugh!!
Btw, here is the silver COT from LAST Week. This is starting to be CRAZY bullish. So this is as of LAST Tuesday. The new one will be released here in about 3-4 yours. I can post late (overnight to most of you). Word. https://uploads.disquscdn.com/images/34d6b59ff658735efb39f5ad66c721c9f4bca571376d73c1ca039754120ad9bc.png
Cason, I got stopped out on the 23rd, it wasn’t easy. Should have made good money, didn’t! I used JDST to play the gold short. Wasn’t as easy in JDST as it was looking at gold.
Yeah, I hear you. I got stopped out of JDST as we hit the DCL a couple of weeks ago then went long JNUG. Got stopped out of both for a moderate loss. JDST wasn’t a great play until just the last couple of days. So, I definitely understand. Here is very specifically where I am annoyed. Usually we break down btw day 8-11 on the final daily cycle. The 4th cycle wasn’t the final and held up into the 20’s (too lazy to go back for exact count). But I started scaling in on day 10. This time I was waiting longer b/c I didn’t want to get in too early and we finally wiped out right at day 8 when we were supposed to but I was not in the trade. ARGH!!!
If I’m reading that COT report correctly its now in a more bullish set-up than Jan ’16 when silver started a 50% rally!!! I’m sure Alex will confirm and also as he has mentioned many times NOT a timing tool but potentially VERY useful even so. Thanks Cason. Nice ‘heads up’.
You are correct, Sir. Good to hear from you. Posting this week’s update now and it’s more bullish. Would I buy on Monday? Heck no. But in the next couple of weeks I will.
COT cutoff are the Tuesday before …. so most likely commercials are going long now.
I don’t know about going long, but MAN, I am sure there is a lot of covering. When this snapshot was taken, gold was still over $1250!!
Yes, I was looking at the C.O.T. for Gold last week too, and it is close to the Dec 2016 lows also .
But as a cautionary note – I have seen it much lower
refresh
https://uploads.disquscdn.com/images/2bb5b640b30b303c242b0f4145bc207f739127b487bba4b6a72aa7ac54620ca0.jpg
Yeah, you got that right. Not a timing tool, right, CF? BUT, I think that we are starting to line up bullish here before too long.
SMH looking better than the NASDAQ ….imo…. short term overbght. waiting for a lower entry most likely next week.
Stockcharts.com now offering seasonal history…..fyi
URA I am out basically break even trade …. too overbought imo….if I miss a pop so be it, not worth the risk. I will wait till the next set up…..
UEC looks somewhat better though…..
Alex, it looks to me GDX is its 5th cycle 12 days in it and peaked on day 3. Given that the 4th dc was 31 days and peaked on day 19th making it right translated do you expect a short LT cycle to finish the ICL?
I have tossed that idea around in my mind, and if it was to be short, I would expect it to be possibly violent at then sell off bottom.
Currently I see people still posting on Twitter or S.T. under the GDX thread or JNUG thread ” Buy the dip is the way to go” and ” Bears are going to get their faces ripped off next week with this false sell off”.
Usually when I am reading that under a GDX thread, we are not at lows, so at this point , I do expect more downside.
Note: The one thing that I am concerned with is that in the past, I have seen triangle patterns obscure the true cycle count, and GDX has traded in a triangle for a while. With that, I am just going to watch and see how things play out during the selling without being overly cycle oriented, if possible.
Have the same count, btw. I haven’t seen them too short yet, but I wouldn’t be surprised if we cut 5-6 days off of it. I can’t imagine that we go another 30-35 day cycle at this point. 20-25 days could be in play. I still feel it’s too early to start longs yet.
COST (COSTCO) stopped out below the 200 sma.
BONDS: might hit the 200 currently below price, if so I will sell my remaining shorts….
YEN: also looking for its bottom….
Until both find there bottoms Metals will be under pressure….. imo
Since when did DPZ become such a bullish company?
The 3 year chart is amazing, though not an easy ride with some weeks of selling off here & there, like any Bull Run.
Man I had no idea…..
Nothing bad
My theory of flashcrash in Silver. Just lost it footing on a gann-degree.
950 days ago there was also some similar event. Got nicely bought after. 88.6 retrace of 2015 low. Bought heaps of aug SLV out of money calls.
https://uploads.disquscdn.com/images/938558d570d72dbce3a564e9a2c21b34d9f3311810bbc32e4f26e2ffe43be26b.png
I would like to see a repeat…
Thanks Nord
Thanks Nord
At least 2 of us…
Feck.. 950 days ago..time flies… i remember that, just after i joined Alex here.
Was that flash crash something to do with the Swiss?.
Check out MACK.
One of our readers ( Thanks Chuck) just mentioned MACK crossed the 15 ema and he looks for that.
So I just took a look and yes, I hate to say it, but that does look good and I even see what looks like an inverse H&S at the lows.
( It may only get to that 50sma)
am still in that baby.. fortunately i had added more at 1.13
I chucked that bad boy $2 ago. Barf!
I bought soybean a few weeks ago . SOYB etf…. like wheat also. They are heavily short ..with bad weather and less planted acreage for crops….. some upside here.
https://uploads.disquscdn.com/images/a259e9bcd37dec315219352c7cbf09d9e22c4f5c71be3f332ca39f326f208e6e.png
Gold and Silver COT as of this week, 7-4. More bullish than what I had posted below earlier on Friday. This is NOT a timing tool. Better for confirmation that an ICL is in later. But once we get the signal from CF this could be good. The COT as well as the chance for a potential change to the Elliott Wave Structure (thanks Ken) has me excited about long PMs for the first time since the completely unexpected Feb Crash.
Go back and look at Silver in Dec/Jan 2016-2017 on the COT chart and notice that we didn’t really dip like we do now (and we had a crap ICL in Silver as well b/c it turns out we were still in Wave 2 and just didn’t know it).
https://uploads.disquscdn.com/images/1d0090d7d9025ec60bb8d96a82c35559f756e952f646a95fb15ecd6c20960f62.png https://uploads.disquscdn.com/images/098a91839e181035569418e0280dd184169f7694da3b87478f52757ccef8a2d4.png