We have seen an increase in trade set ups and patterns following through the past couple of weeks, and it actually looks like this may continue for a while. Let’s review the markets and then we can discuss that…
SPX – Fridays report – We could dip down and back test the break out.
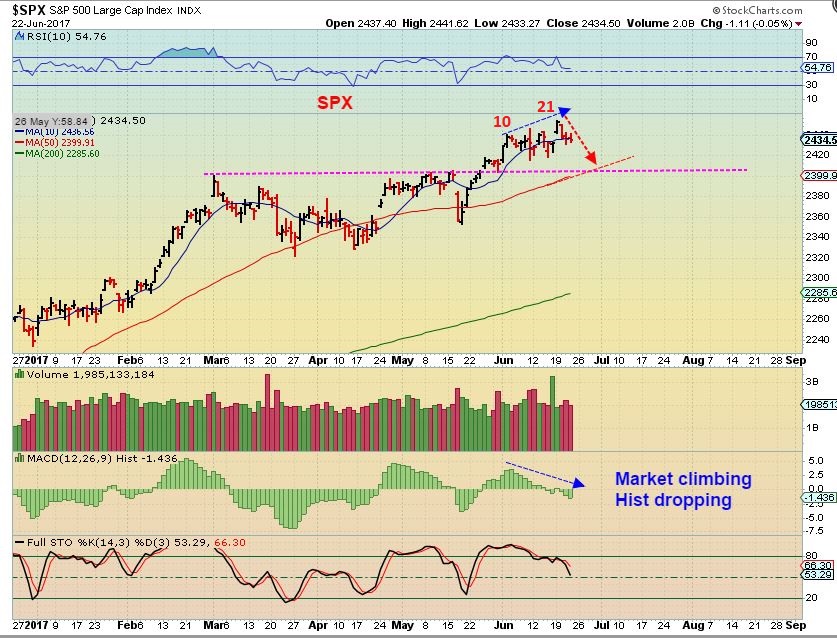
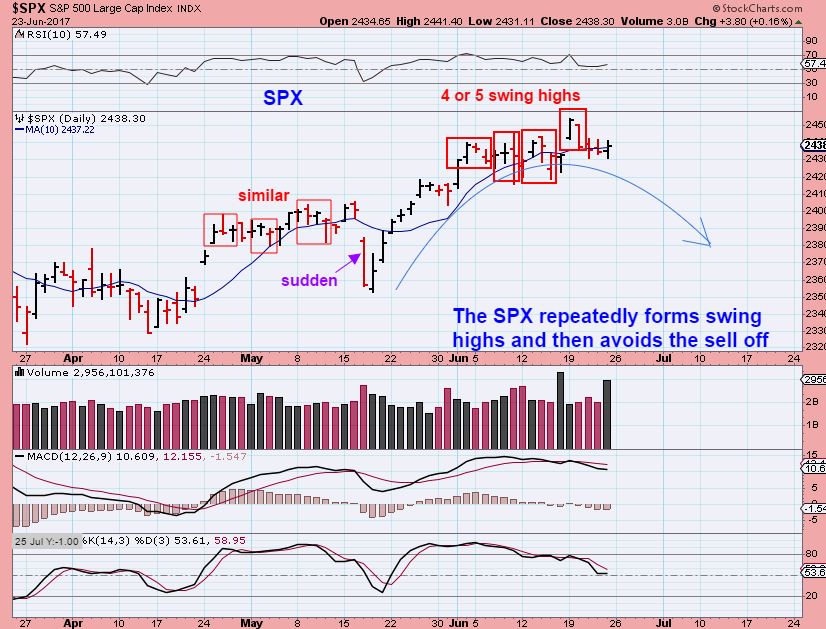
SPX – We do have a swing high in place, but that has happened a lot lately. We closed below the 10sma, but then recovered it. The bears take control and the Bulls buy it back.
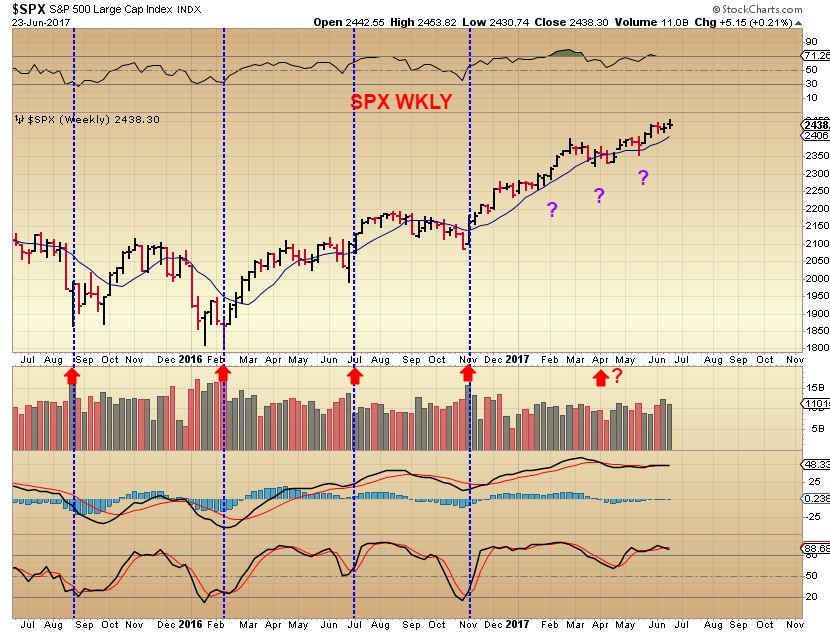
SPX WEEKLY – The weekly chart bullishly climbs along the 10ma.
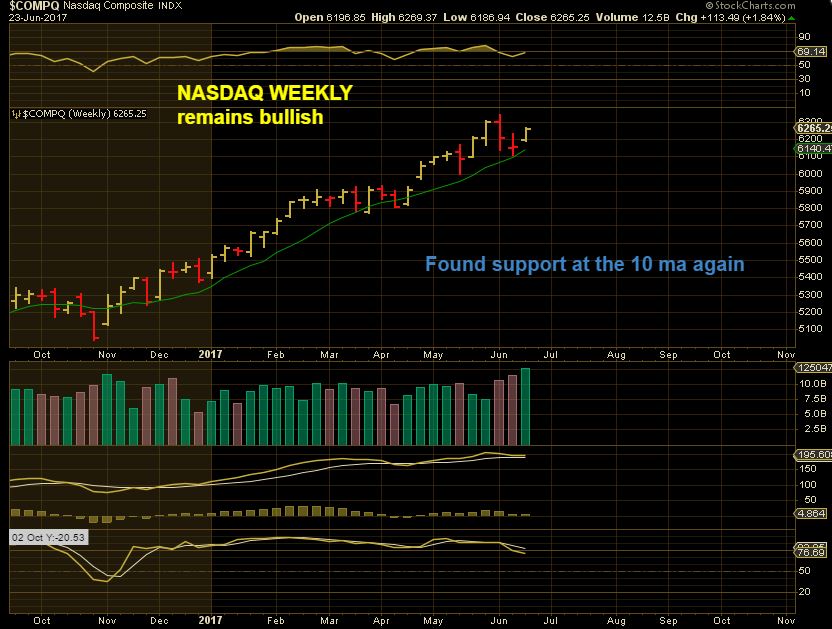
I pointed out on this chart last week that the NASDAQ is in a steep channel and does not seem to show that a deeper sell off into an ICL has occurred lately. We are due, but the Bulls keep stepping in.
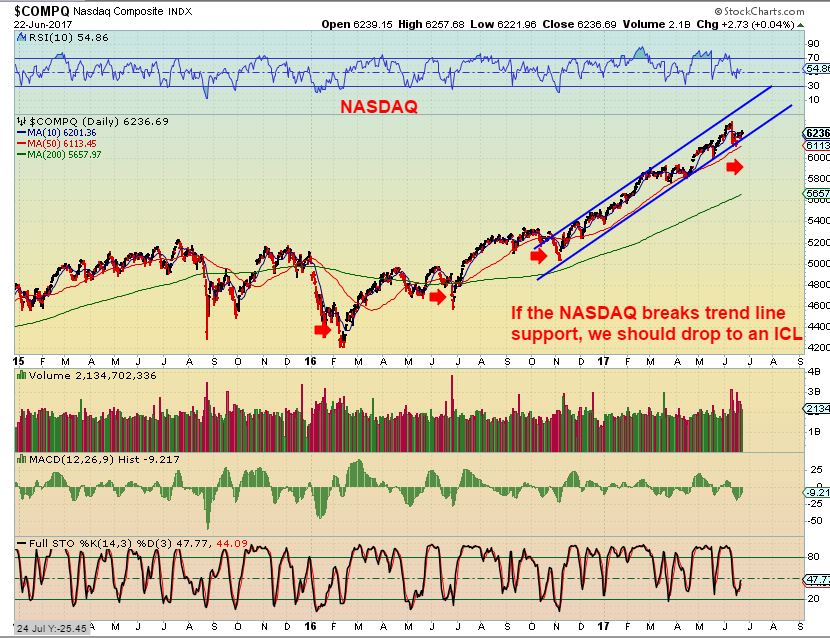
NASDAQ dropped to the 10 weekly ma and turned back up too.
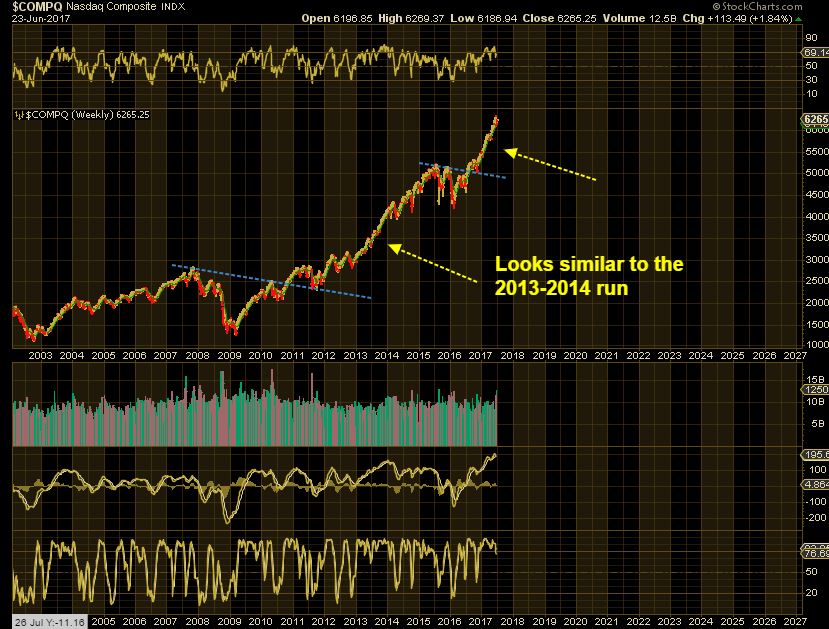
On a very large Big Picture, this looks similar to the run higher that took place in 2013 – 2014, but it did eventually put in a big consolidation, so we should expect that can come at anytime.
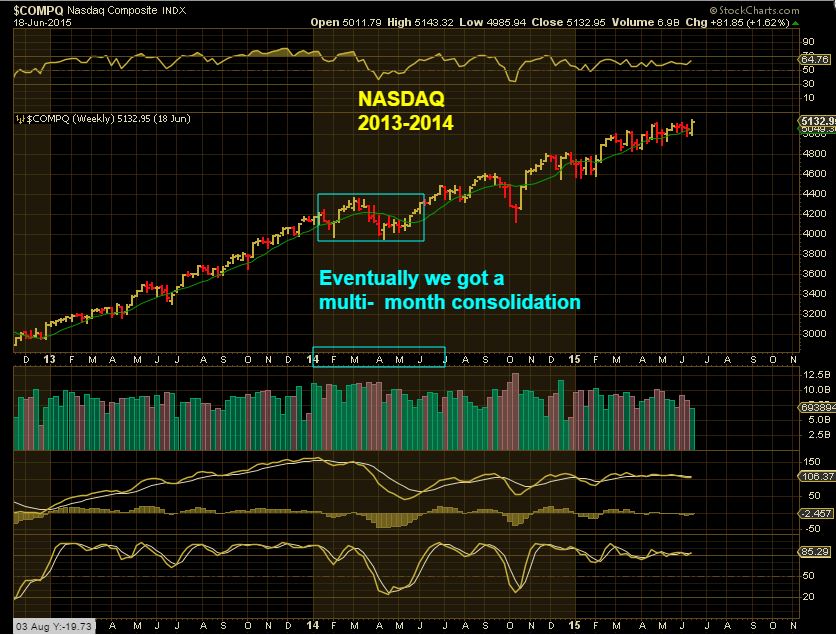
This is the weekly chart of 2013-2014 . Eventually the markets went sideways for months to give it a rest, and we are due for an ICL. Trailing stops have worked best. I have also mentioned that parabolic blow off top scenario as a possibility in the making.
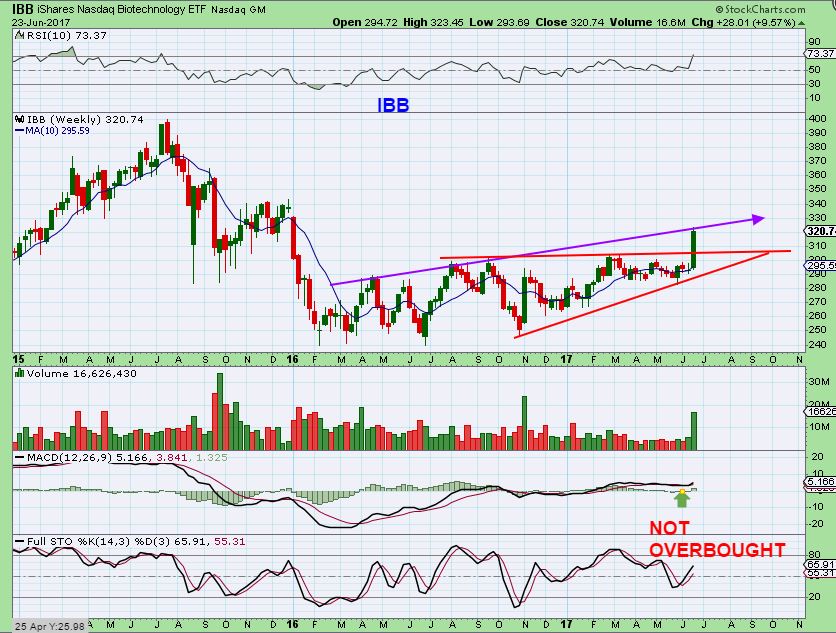
IBB – This sector is perking up and had a nice run recently. It could be short term peaking, but…
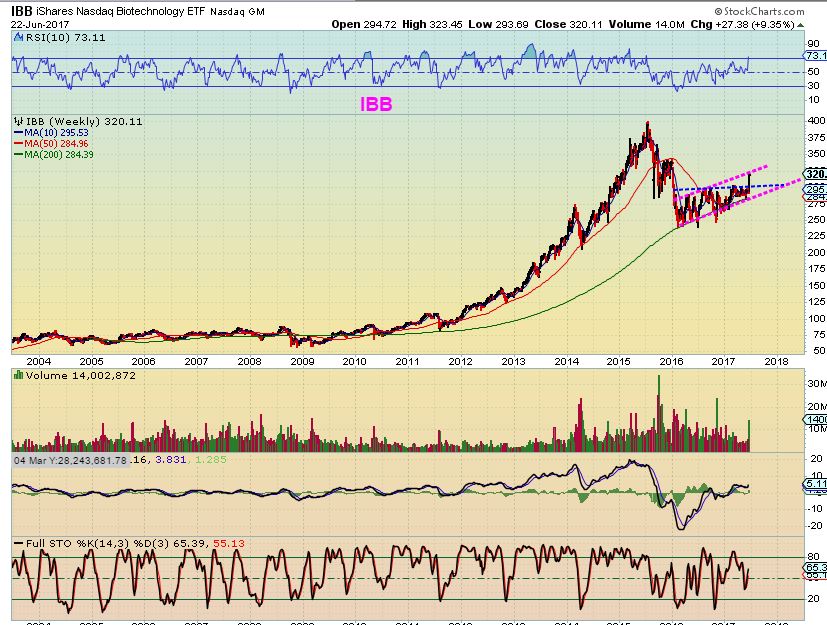
IBB WEEKLY – For my readers I do NOT recommend trying to short this. It is a bullish set up in my opinion and could just continue higher ( The weekly chart is not overbought), or it might just back test the recent break out.
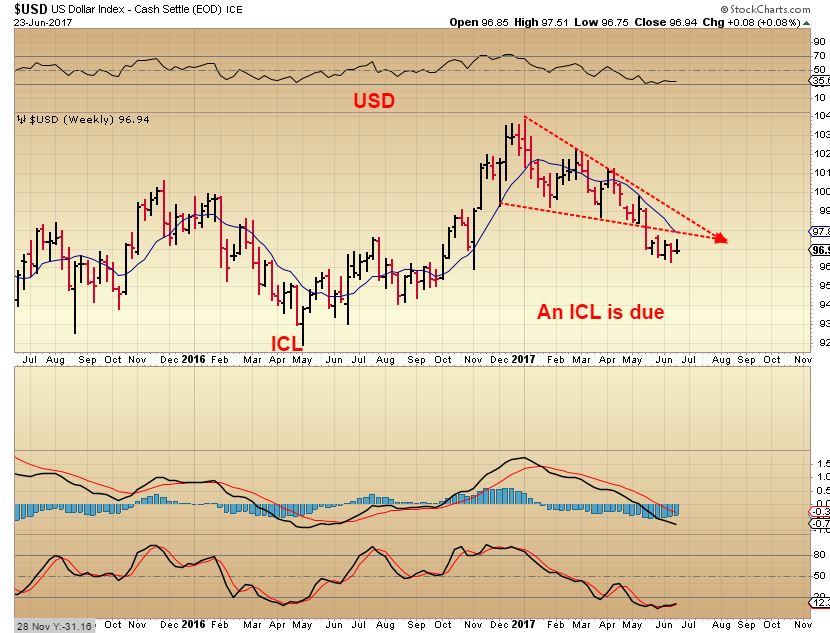
USD – A weekly swing low is in place. If we had solid follow through higher, I would expect the Precious Metals to drop, but oddly, the Precious Metals look short term bullish, I’ll discuss that below.
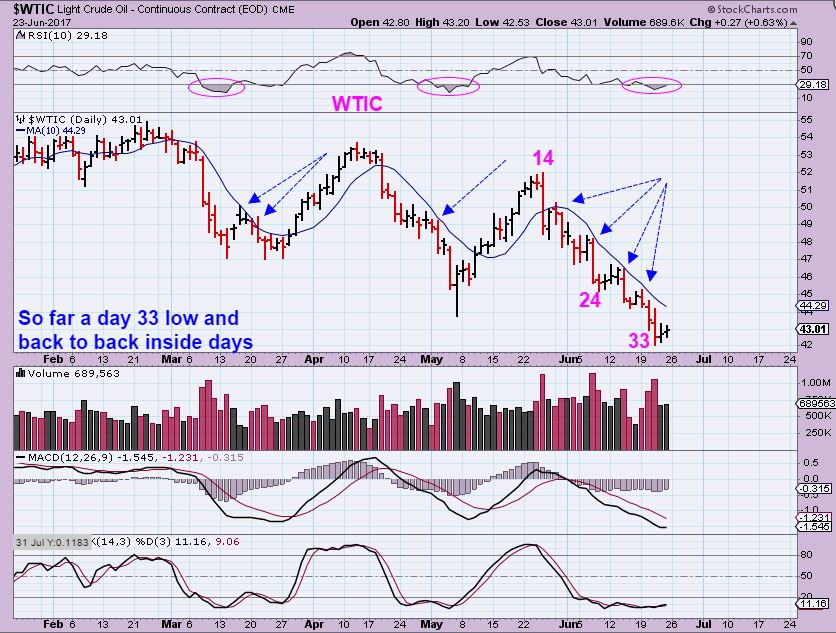
WTIC – I feel like Oil wants to bottom, with 2 ‘inside days’ in a row, this could be pointing to a reversal. That said, it could also be a bear flag until it POPS higher, and Oils daily cycle can continue down time wise, so Patience will reveal the answer.
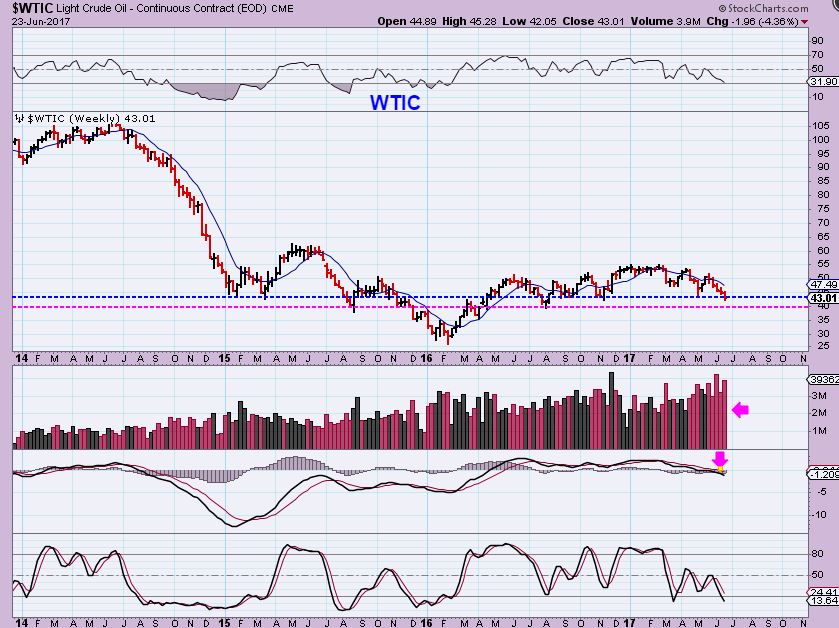
WTIC WEEKLY – Support zone if it can hold up.
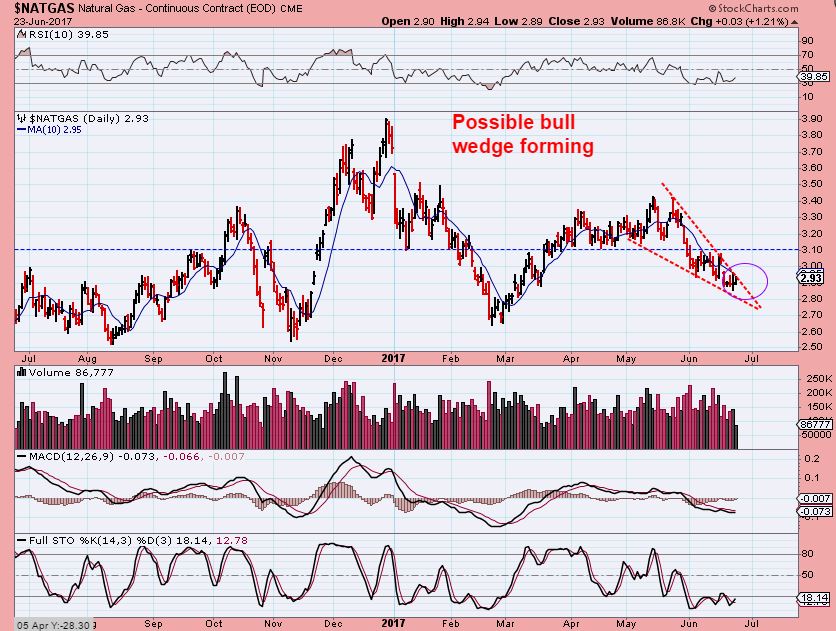
NATGAS –
The last time I discussed NATGAS, I pointed out a bullish falling wedge possibility. SO far it remains in tact. A break higher is at least short term bullish.
GOLD, SILVER, & MINERS
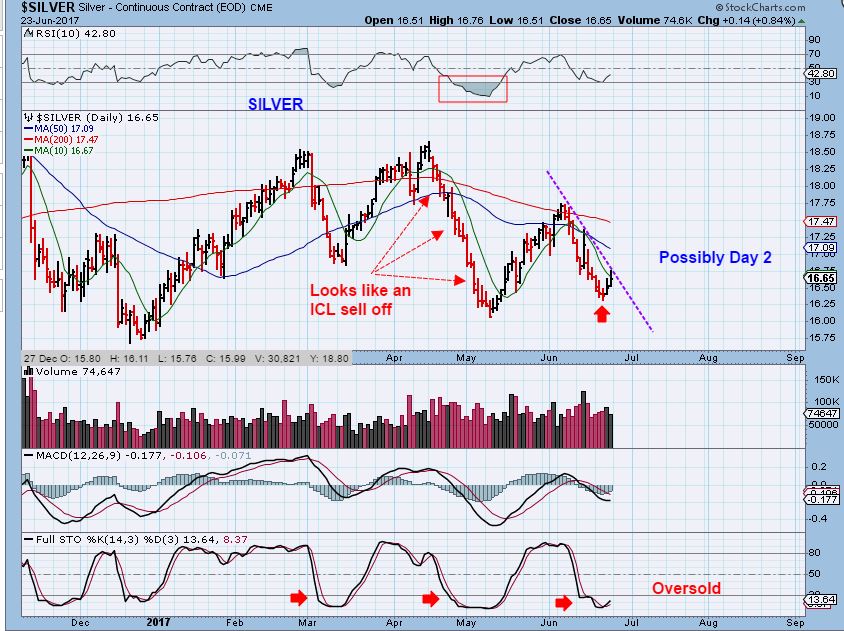
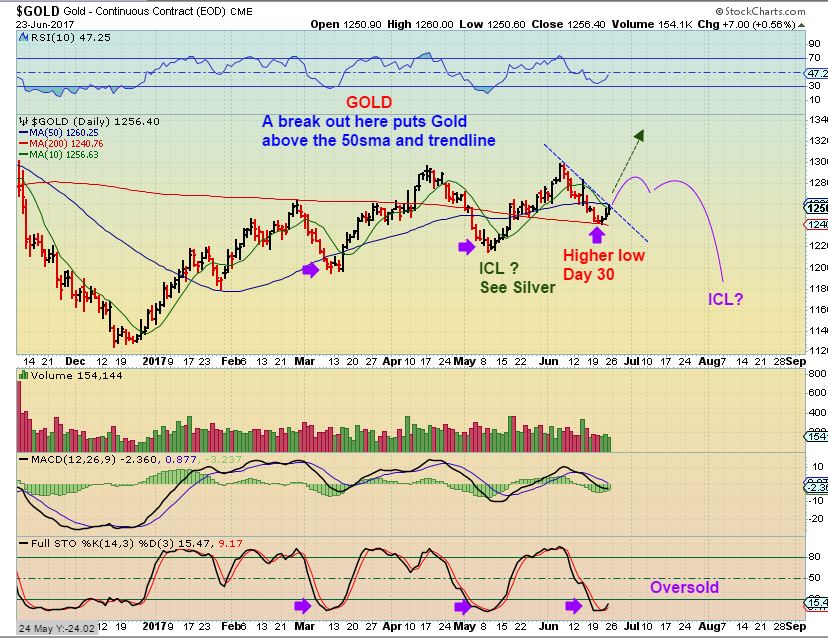
TODAY I WANT TO START WITH SILVER, just to once again show that SILVER does look like it had a drop into an ICL, and it had a L.T. Daily cycle, it broke prior daily cycle lows, and look at that huge drop. That looks like an ICL. Gold did NOT have these characteristics, and this gives us most of the mixed signals.
Now we see a swing low formed after day 30. A break out here indicates a new daily cycle and it is very oversold. That is short term Bullish to me.
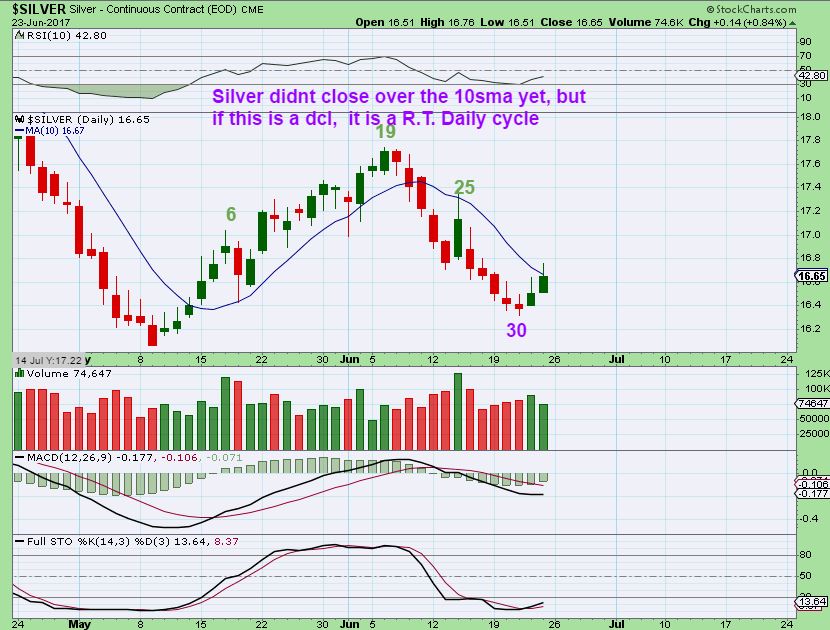
DID YOU NOTICE that SILVER just put in a nice run and a R.T. daily cycle if this is a swing low dcl? That shouldn’t happen on a 4th daily cycle, but it does happen on a first daily cycle. THIS looked like a 1st daily cycle after an ICL, to be honest. If so, a 2nd daily cycle could really be a big run and you didn’t miss anything because Silver is back at May lows and silver stocks are too for the most part.
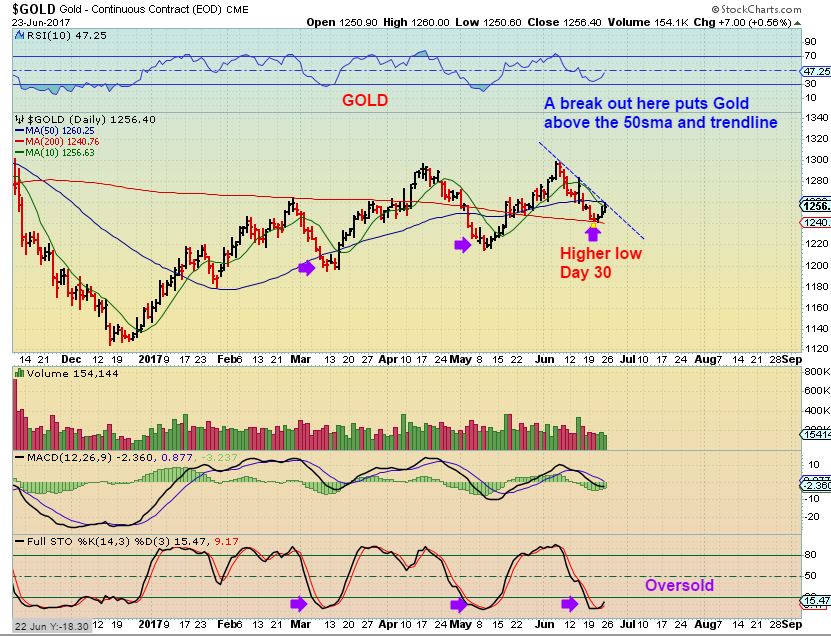
Now to GOLD – Another Higher low? A swing low at the 200sma after 4 daily cycles? Another R.T. Daily cycles? THIS IS ABNORMAL, since SILVER had such a large sell off in May. Normally we would expect this to be a L.T. Daily cycle and a drop into an ICL maybe below $1200, but was May a stealth ICL? This is what I have been debating, putting in my reports for a couple of weeks, and searching for clues. As time moves forward, it just seems that this could be a bullish consolidation. We are now quite oversold. I expect a break out here above the blue dotted line & that is also short term bullish.
I took a smaller than normal position in Miners last week, and want to watch it play out as a cautious entry. 2 scenarios are shown on this chart again in purple or green arrows.
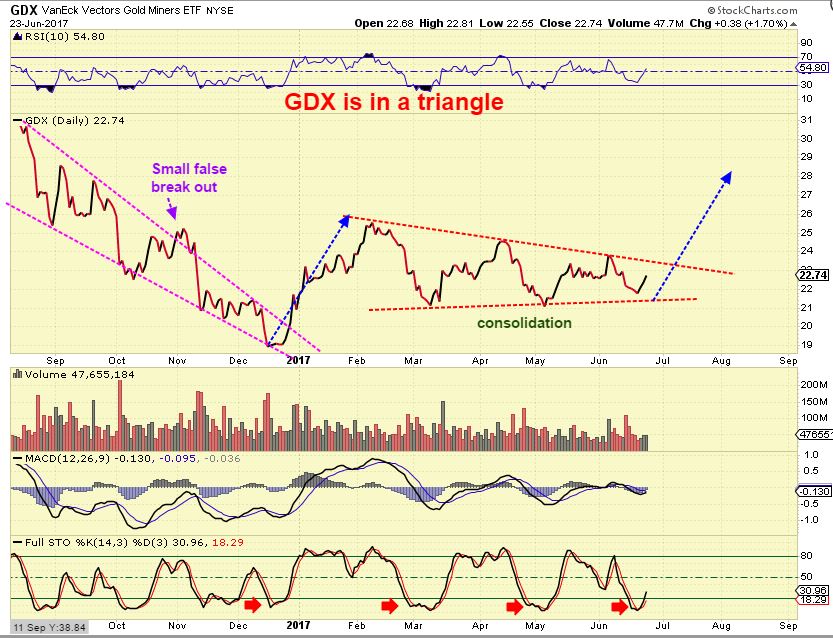
GOLD AND A TRIANGLE – A story worth noting at this time.
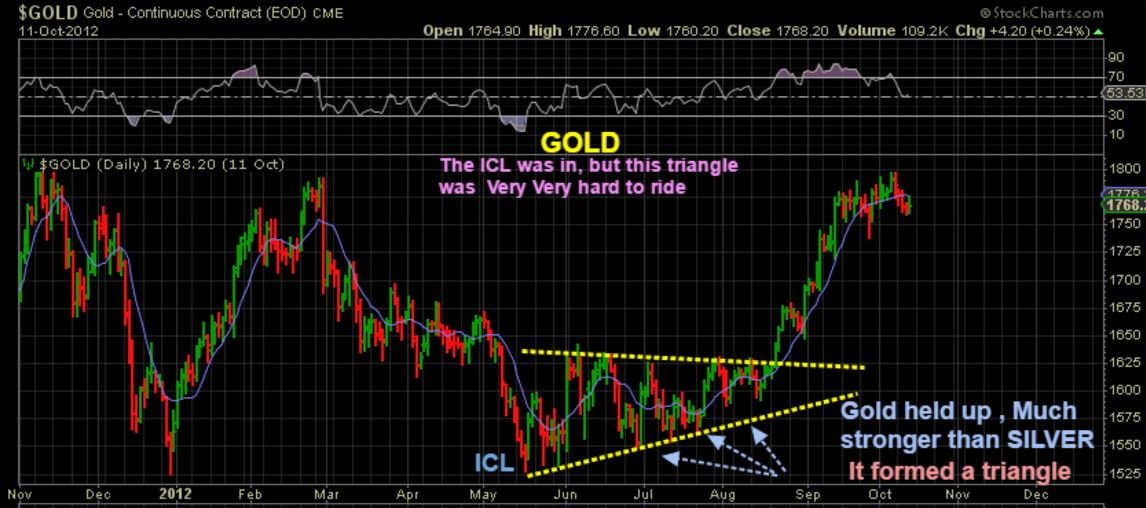
GOLD IN 2012 WAS IN A TRIANGLE AND IT WAS PERPLEXING MANY ANALYSTS, MYSELF INCLUDED. GOLD DID NOT MATCH SILVER THEN EITHER, SO LETS DISCUSS THIS.
-GOLD SOLD OFF SHARPLY INTO WHAT LOOKED LIKE AN ICL IN MAY IN 2012.
-IT HAD NO UPSIDE FOLLOW THROUGH IN THE FIRST DAILY CYCLE, LIKE WE JUST HAD IN MINERS.
-VERY VERY HARD TO RIDE CONFIDENTLY, BUT I SAW IT AS AN ICL. AND MORE PERPLEXING THAN ANY OF THAT? Read the chart and we’ll continue …
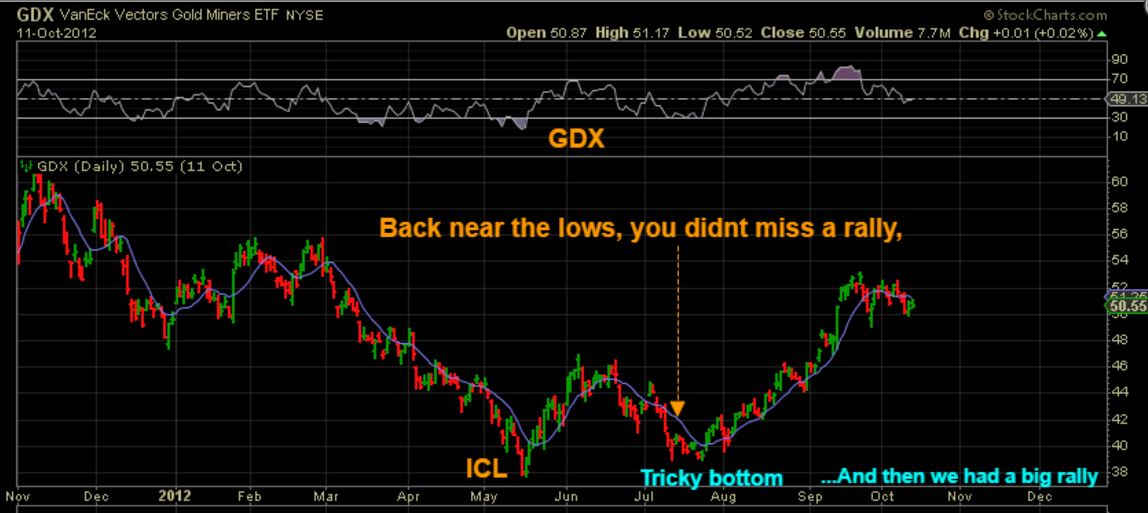
WHILE GOLD FORMED A TRIANGLE , MINERS WENT HIGHER AND THEN ALL THE WAY BACK TO THE LOWS, THREATENING TO BREAK TO NEW LOWS. THAT 1st DAILY CYCLE WAS A WASTE OF TIME.
SILVER HAD THE SAME ICL LOOK IN MAY, BUT IT BROKE TO A NEW LOW 1 MONTH LATER? DID THAT MEAN GOLD & MINERS WOULD FOLLOW SILVER? WE FEARED THAT TIME. WE HAD TO BE CAUTIOUS. LOOK AT THE CHARTS, ALL 3 EVENTUALLY SHOT STRAIGHT UP IN AUGUST.
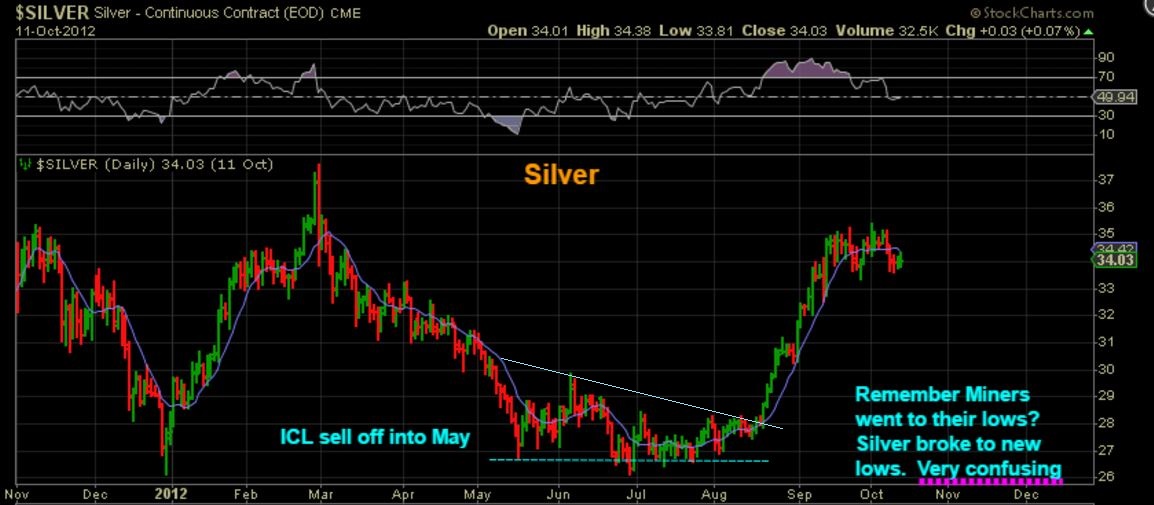
SO BASICALLY MY POINT IS THAT IT WAS VERY UNCLEAR WHETHER GOLD PUT IN AN ICL IN MAY 2012, SINCE SILVER SEEMED TO NEGATE THAT WITH NEW LOWS & MINERS DROPPED BACK TO THE LOWS TOO. MIXED SIGNALS JUST LIKE WE HAVE NOW. I EXPECTED THINGS TO POSSIBLY BREAK DOWN WHEN SILVER DID, BUT GOLDS TRIANGLE EVENTUALLY BURST HIGHER AND EVERYTHING WENT HIGHER WITH IT. I JUMPED IN ON THAT BREAK OUT & THE RUN WAS EXCEPTIONAL. I DIDNT MISS A THING DURING THE MORE CAUTIOUS TIMES, EXCEPT FOR MAYBE SLEEPLESS NIGHTS. 🙂
AT TIMES, THINGS ARE NOT IN SYNC, AND THEREFORE A MIXED PICTURE DEVELOPS. WE HAVE THAT NOW, BUT WE HAVE NOT MISSED A HUGE RUN IN MINERS. EVENTUALLY THE BULLISHNESS OR BEARISHNESS SYNCS THEM ALL TOGETHER IN A DIRECTIONAL MOVE. A BULLISH BREAK OF A TRIANGLE CAN LEAD TO A LOW RISK ENTRY & GREAT GAINS. I AM HERE TO CONTINUE TO INVESTIGATE, DO RESEARCH, SHARE MY FINDINGS AND IDEAS, MY EXPERIENCES AND TRY TO GUIDE US THROUGH THIS WITHOUT GETTING EMOTIONALLY HIGH OR LOW. EMOTIONS WILL MESS UP YOUR TRADING ABILITY. SO FAR, EVERYTHING IS FINE, BECAUSE WE ARE BEING PATIENT, SO …
MORE ANALYSES TO ADD TO THINGS
GDX _ Miners have formed their own little triangle right now, and this is what I said GOLD did in 2012. Marched to its own beat. . IF this breaks out, the MAY lows seem to be The Lows, despite Gold acting differently from Silver. Notice that Miners are still quite oversold. We may break out & be in Daily Cycle #2 & run higher here. Stay tuned, I took a small position to front run a possible break out. Many miners are still at lows, and could have plenty of upside for you to capture if it breaks. GDX DAILY IS OVERSOLD.
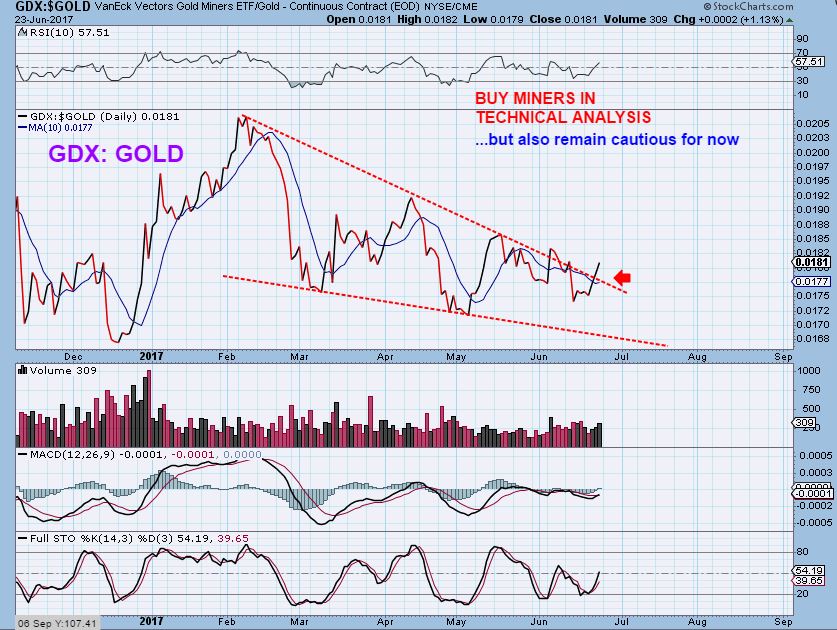
GDX :GOLD – This actually formed its own triangle too, but this one broke out already. This seems to say that Miners are a buy & leading Gold. I took a position last week, but I’m not comfortable being very heavy under these circumstances yet.
GDX CURRENTLY– So basically, similar to Miners ICL in May 2012, they ran up & came all the way back after an ICL type sell off in MAY. Remember that I noted that it is odd that after L.T. Daily cycles, we now have a R.T. Daily Cycle. I questioned that and had to do research to see what I could find. SO after Day 30, Miners put in a swing low, as mentioned in Fridays report, and remain oversold.
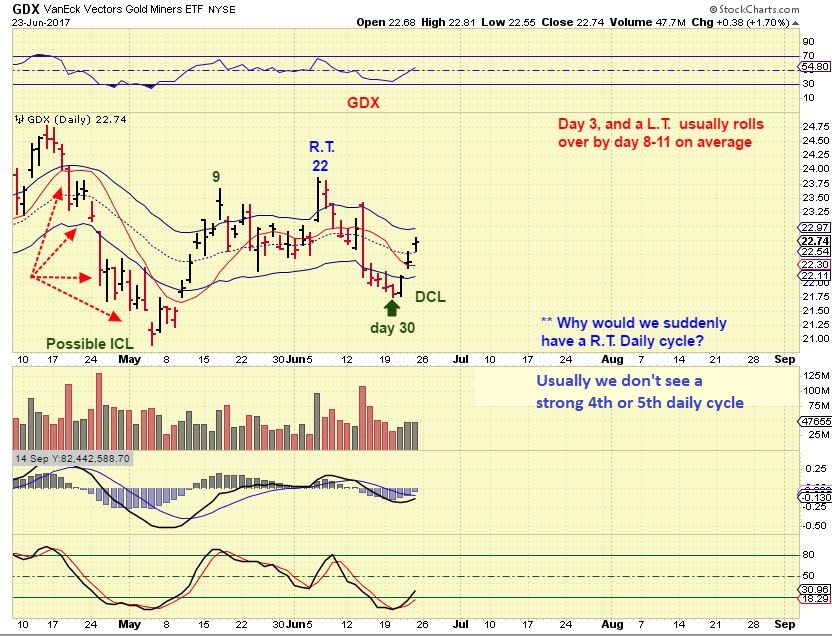
Miners are in a long sideways consolidation that formed a triangle. We are 6 months from the last ICL. Gold has been so strong that it has put in a series of R.T. daily cycles with higher highs and higher lows for 6 months. Silver & Miners slammed down into MAY in what seemed like an ICL move, breaking the prior lows. Stealth ICL in Gold in MAY? Possible.
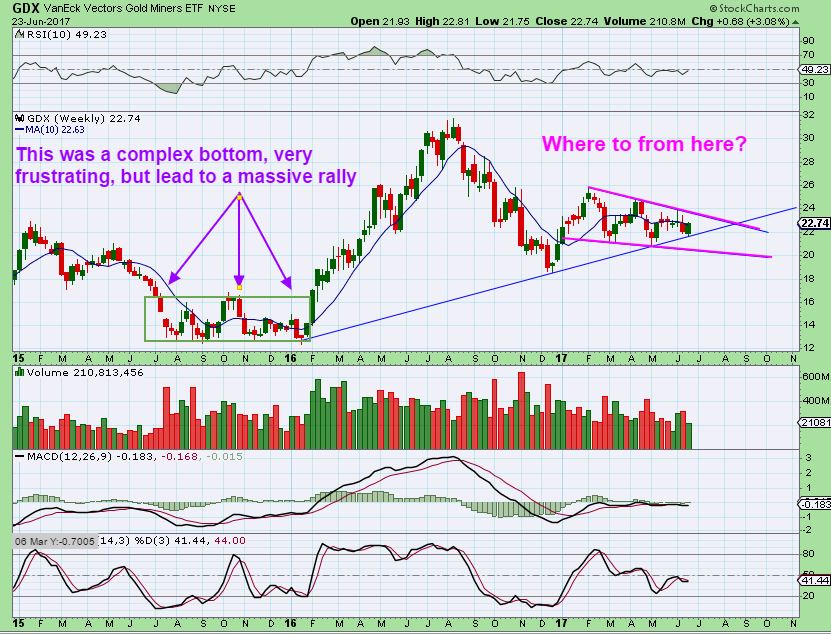
GDX WKLY – The set up is one that we should find out soon enough whether we are going to break higher or lower in this daily cycle. If it is daily cycle # 2 , it should break out higher above $24 & run, we will be loading up. If it is a final daily cycle that drops into a deeper low, an ICL, it should roll over within this framework and break recent lows.
Conclusion: We still have 2 valid scenarios due to the mixed set ups in Gold, Silver, & Miners, but it should resolve soon, with all of them joining in on a directional move. As I have been saying for a little while now, we didn’t see a textbook ICL low in Gold, but Silver & Miners did have the hallmarks of an ICL.
A) I can see a Bullish set up , where a break out here by the Miners may be the start of the 2nd daily cycle in a new Intermediate Cycle, and a break out from the above triangle could make a nice run after such a long consolidation.
B) If GOLD wants to put in a L.T. Daily cycle and drop into an ICL soon, the Miners won’t escape that drop. This is why for now, I took a small position, and some caution is warranted before the break out .
In the mean time, we have had some very good trading over the last 2 weeks, and especially last week. I like what I am seeing in the variety of set ups. The sell offs and bottoming processes seem to be producing good trade set ups in Metals like Steel Copper, & Aluminum, , Biotechs have been popping for a while, Solars are active, maybe Uraniums now, and possibly even the Miners could join in. I will continue to discuss these going forward. See the last few reports for some ideas if necessary, we looked at Commodities, Solar stocks, Biotecks, now Uranium, even TWTR, AMD, CY, and now possibly Miners and more. Let the trading begin 🙂
Enjoy the rest of your weekend, see you on Monday!
~ALEX
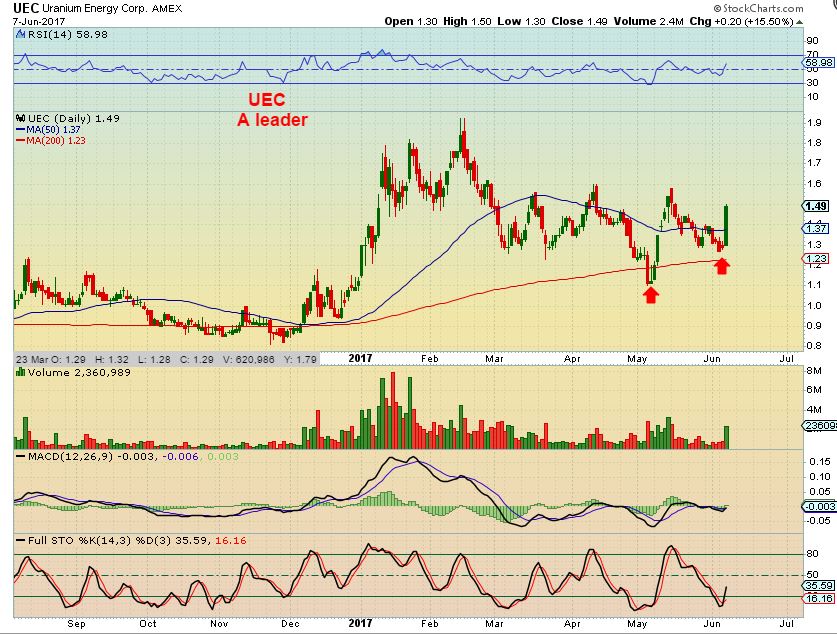
SAMPLE TRADE: On JUNE 8 I had this chart of UEC in a report. It looked to be about ready to break out & run as an inverse H&S.
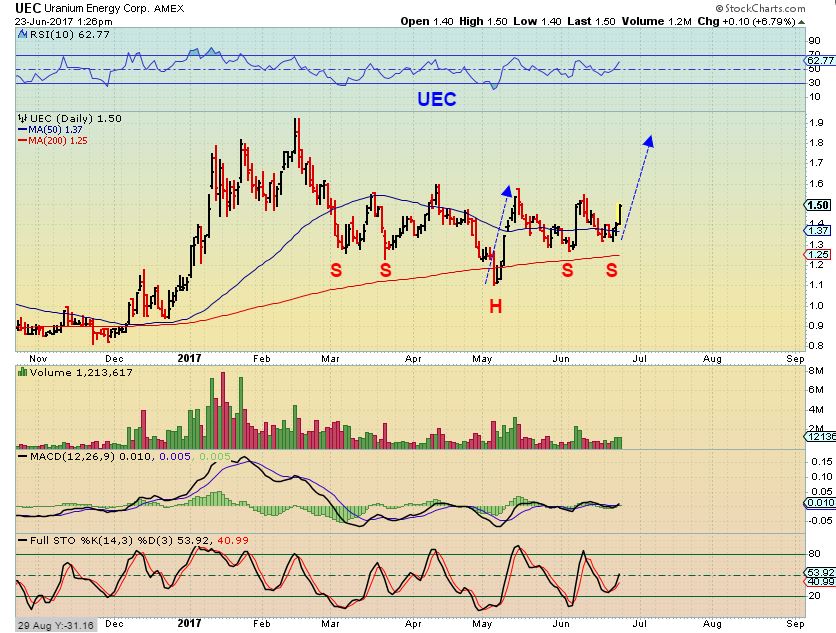
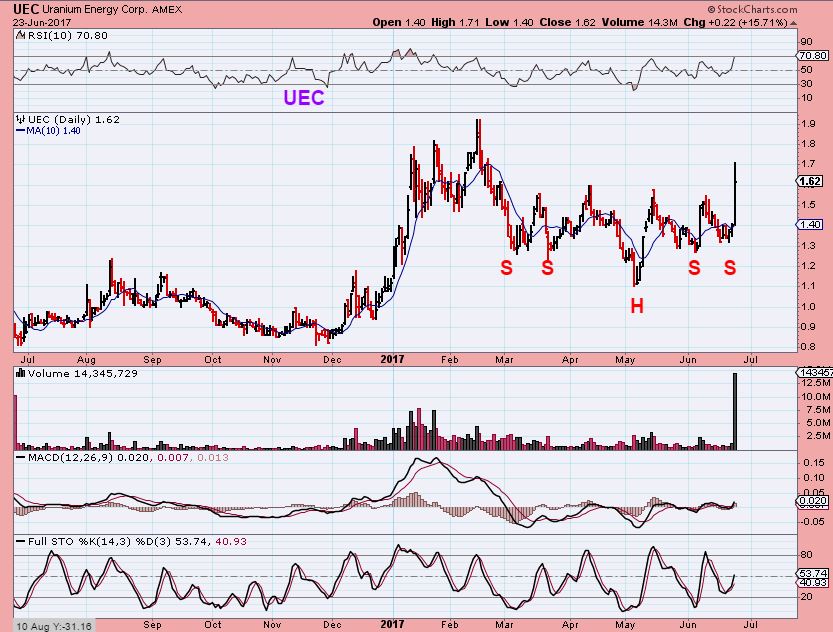
You can see that it actually fell back & consolidated further, but I posted in the comments section Friday that UEC looked ready to go, it had a very nice double shoulder inverse H&S pattern and moved back above the 50 sma. I bought it and drew up this chart. Other Uraniums look to be setting up too.
By the end of the day it was up about 16% and it still has further to go in my opinion.
‘BOUNCE’ – a subscriber here – mentioned RNVA & RLOG in the comments Friday. I looked at the charts and I do like those set ups, but I haven’t had time this weekend to look up what type of companies they are and do a little research on them yet, so no charts yet. Since they may appear in future reports for ‘traders’, you could have a look at the charts and see what you think too.
Friday June 23 
 Tuesday June 27th
Scroll to top

Great report Alex
Thanks Nord
You’re right, gold is stealthy at times. Look here, sneaking downwards a channel before breaking down 360 bucks. https://uploads.disquscdn.com/images/2a42b5b10117725763ea79ff5f8eb81e0bd2edb65e2a48d362e6ea6d656c3b51.png
Boy, that 5 rally expectation was a real let down.
I can imagine. But it could be a nice short! A shame I wasn’t around in the markets back then 🙂
Heatmap https://uploads.disquscdn.com/images/21ead35e8717aa5c878745486240a7be849c8e485e89766c56a22fa51892932d.png
Thanks. Again!
Ur welcome H50 🙂
Nice one Alex. That comparison to 2012 really wa helpful.
Some things really stick in your mind.
That year was a summer triangle that took Forever at the lows, quite frustrating, and Silver broke the lows.
Then the markets rallied very strongly into Sept / Oct and…
That was the top! Done…start of the bear market for the next few years. Ouch.
But yes, the point was that Gold & Silver & Miners were not in sync, making the real time view difficult – but eventually they all rallied in sync when the break out took place and they all rallied.
SO I forgot this in the report.
GOLD SMART MONEY SHORTS – Smart money was closing shorts in the recent dip and they are almost back at Mays level.
Same with Silver.
refresh
https://uploads.disquscdn.com/images/8bb857c150126f0ab7a2cae33a515d3acd34c7abe35ad842a34a93cef422dc43.jpg
HUGE slam in gold at the London open. Maybe that was SOG? We could also blame me for finally closing all of my shorts last week. Ugh!!
Never too late to open new onew for 1210 ☺
I’m going with the latter.
UNG started to move up now.. looking for a pullback entry of some degree (into BOIL/UGAZ)
Price now left the upsloping channel and tested mid-range of the other channel. Let’s get price all the way to the lower part now going into GDP…
https://uploads.disquscdn.com/images/8ee746a0c3f777a2c4d397b3d50cc6bb36d554d01ee9aae6eacc6a0a73e96dbf.png
Long-term I am very bullish on XBI. But I expect soon it to complete its uprising this week and head down into end July/first part of August.
https://uploads.disquscdn.com/images/99dccdee778e8f97fb7b8c63d24958bb26de3b193e688c1a59aeef2fc329ef0f.png
Re-shorted NatGas on gap-fill.
Retail buying hope when they have heard news about heatwaves presumably. If i’m right on this one, the fall can get quite ugly. Let’s hope it will, because after it can present a very good buy opportunity
https://uploads.disquscdn.com/images/85726b35dcfa0ee95048e0af6f1257607dd5ad9e2b5a307d8224930946dfd1f9.png
Just a heads up – I have this going higher ( COT also showed smart money shorts were closed).
Being careful as always 😉
Well, the last swing low did fail, and that was even after it crossed the 10sma, so that could happen again. Using UNG chart, it is at a resistance area, a break out higher would be bullish I.M.O., so you could put a stop there.
I see divergence on the last low and it did get oversold, so we’ll see if it is just a Pop/ Bounce or will a move higher start.
Refresh
https://uploads.disquscdn.com/images/22acc1c1126b0183480d537ed549f55871bb75e1f7ae74f6444eca105f0724b8.jpg
Im always a bit sceptical to COT reports. E.g. gold; numbers are to be reported on Tuesdays, so they can re-position themselves early in the week to mislead and re-enter after reporting positions.
But yes, NatGas is on oversold conditions. But I have to trade here what i see and exit if I am wrong.
I read somewhere that some of those positions are 6 months long and they close at end of the month so it may be extra volatile…true?
Great report, CF. Gold & silver sure are tricky but you are so helpful in your analysis:) I missed the solar move. Thinking off legging into a bit today. I’ve been very, very busy lately.
Thanks Kathleen, Some solars seem a bit extended , so it might be hard to find a low risk entry without a bit of a pull back. And some do look ready to possibly bull flag or pullback.
liking SOL. (bot some Friday)..
daily but RGSE distorts my chart graphics so much for some reason.. i can’t even see whats going on..
Good morning – looking forward to what this week holds 🙂 One stock that has come on my radar is BDSI (please don’t blindly follow- do your own DD) BUT that said, I am looking at it not for a trade but for a long term hold. It has two drugs for pain management and they are also used for opioid dependence problems. I like the long term chart and “the story”
http://www.bizjournals.com/triangle/news/2017/06/21/raleighs-bdsi-lands-cvs-caremark-contract.html
“ALL IN!!” 🙂
J/K/ – Chart looks good though
no comprende – all in to what?
It was a joke, she said not to follow her into this trade just because she is in it, so I said I’m all in ( Like I’m using all my funds for her pick, just because she mentioned it) …..AND THEN I SAID J/K most importantly.
thou shalt be taken literally
The danger of trying to be funny 🙂
need a glossary of terms & abbreviations in a permanent sidebar 🙂
just want to be sure!
Yes please…here is an admission…years ago when my kids sent LOL…I thought they meant lots of lovre not laughing out loud! Wishful thinking on my part..LOL!
thats what we all mean when we say that to you Nancy!
Awww…thanks. Actually, either is OK with me. I think laughter is a good thing in most cases.
My mother used to think that too, so when she would txt it to me, it wouldnt make sense and I had to ask her. She would write …
“You kids mean a lot to me, I just want you to know that – LOL!”
So think about LOL as “lot’s of love” coming from here, but we were thinking ” Laugh Out Loud? Whats so funny about that Ma?”
I know! It lead to much confusion! And laughs when I learned the lingo! I am kind of glad it happened to someone else! Maybe it is a “Mom” thing!
yeah …. stick to charting….
😉
Are you home yet?
#Gojumpinalake 🙂
LOL…the laugh one!
lol…. yeahhhh .. .working diligently…
Maria,
What lake are you on in NY? Headed up to the mighty Seneca at the end of the week.
oh wow … very nice .. you lucky duck
I am home now, but was in Lake Placid for the week for a work conference. My hotel/balcony was on lovely Mirror Lake…. just gorgeous.
Have a wonderful time…. it is sooooo peaceful – I love being by the water …
Little River Band knew what they were singing … “… I was born in the sign of water
And it’s there that I feel my best …”
My GF family lives on a cliff on Seneca. It is more like vacation than “visiting in-laws.” For some reason I thought upstate NY was your ‘home.’
wow… verrrry nice…
EYES and GBLS…perky
Thanks – I wasn’t paying attention. EYES looks pretty good, especially a 6 moth chart
Check out CRMD 3 month chart- that is what I was watching
TENX on a 6 month chart. ( I do not like this light volume however)
These types of set ups are happening a lot now
wow…. SWEETNESS!! dang that setup is sooooo s e x y…. phew (me wiping the sweat from my brow)
u sure know how to find those…..damn
They look like they couldve been canaries-in-the-coalmine to that MACK drop
I havent looked at MACK in a long time ( I actually sold mine before the drop, and I did post that here, so it is not “dead to me” )
ANYWAY
Inverse H&S Around the 10sma right now ? I’m not buying, but it looks like a recovery possibility?
i sold before drop too.
Have since been buying small-ly, just for the lulz :).. am about breakeven at these current prices ($1.35)
I have not heard the term lulz in YEARS : – )
I used to chat with a girl that called herself lulz maybe 15 years ago 🙂
#I THINK IT WAS A GIRL – lol
as Murrhoea will gladly inform you,.. apparently i’m an old git (relatively speakin)…
its a good word though 🙂
hey now….. https://uploads.disquscdn.com/images/68ea0893071b1de9b68bc4704f080a1e45051d0285a92012e0f8f13b63d012d5.png
LoL.. you axxing for trouble posting that again 😀
ha! dont u dare….
but speaking of blunts… isnt LV NV voting on recreational pot soon.. like 1st week in July …
hmmmm …. some of the pot stocks are getting happy feet…. 😉
.. https://uploads.disquscdn.com/images/4a7e2485e5c3b167f334ccaafde4121cbdb5f03c3f0dea7e2101c0abafefcdd2.jpg
LOL
hehe.. you remember the rest of it?
NWGFF & PURA … ind of interesting here
WHOA – That really took off after I posted that ( NWGFF)- did someone here jump in? It’s up almost 40% now
I read up on PURA’s story, liked it, and bought a little of that lotto ticket.
VATE — now that’s a coffee I’d like to try…. giggle
http://elev8hemp.com/
Hmmmm , EDXC is doing Tea now too.
mmmm….tea with ‘honey’ 😉
perkier ….
Ha! Though – just thinking about the horrible fall that Chris took- and a recent injury that my Father incurred when an old convertible that he was restoring slipped out of gear and ran over him, breaking 7 ribs – anyway this came across my radar and it’s kind of a moral investment – pain sucks after a serious injury, but having an opioid addiction because the Dr. Prescribed OXY…. Anyway. It’s worth more than $3 a share in my book ….
Bot some JNUG in the pre-market and right after the open. Miners are a “buy” on my 15 min chart, so this may be a good buying opp.
What does your 15 min. say now, Steve? TIA
To be clear, I’m heavily loaded in TQQQ. The JNUG is a just small starter position in miners because as Alex has indicated the PM trend is not clear yet.
Have you seen any tails on JNUG, GDXJ, GDX etc. lately?
i got this longtail on $SILVER last night… make of it what you will
https://uploads.disquscdn.com/images/cf14c7c73d18317eb2bc0b5883c7e75c210cf6cbbffa6bb656a37e42aeadbf82.jpg
daily chart .. that is
It looks like Gold today in a way- thx
Thanks SOG
Funny you should ask … I saw a long tail UP on GDX this morning in the pre-market and that’s one of the reasons I decided to take a shot at some JNUG. I didn’t post it earlier because I thought most here were sick of me talking about long tail “signal candles.” 🙂
Notice that the “target price” is close to Friday’s closing price. GDX is still a “buy” on my 15 min chart so it may get there by EOD.
https://uploads.disquscdn.com/images/f440535f2dad28413e98c817aa758e2dba35f40cc1c128edc7ad44eb97c816c4.png
Thanks. I find these interesting.
Yes Steve, continue posting them, very interesting…….
Looks like GDX will probably hit that $2.74 “target price” of the long tail candle today, still a “buy” on my 15 min chart and now only 10 cents away.
Thanks for the update.
today resets the count for the gold cycle since it had a lower low than Wednesday. Unless it is a very short cycle peaking on day 2. I think today is day 33.
That is how I would be viewing it.
The question now is, ” Was that a bear flag, 1/2 cycle on gold”?
1/2 cycle low on day 33 would be ………..very unconventional.
I would think that it is most likely a shake out low today to the real low for Gold – day 33 ( Silver & Miners didnt follow to new lows).
Consider this. A new 5th (day 4) cycle that is LT. This would bring us to the ICL.
The story doing the rounds in the UK is that it was a ‘fat finger’ trade and 1.8m ounces were sold in one minute! I doubt that was for physical delivery!! Lol So if it was a genuine mistake would you discount that as false price action!!?
It would still count if it shows up on the chart, so today would likely go to day 33.
If it happened much later, it wouldn’t break the low, but if it happens close to a low & shows on the chart, I accept it as price action in that time period.
Thanks for the 1.8 M Oz info, I hadn”t heard it yet – might explain why Silver & Miners didn’t drop as much
I got the info from an old work colleague still in the finance industry so he will have almost certainly got that from a news screen, most likely Bloomberg. I guess price action is price action regardless of how it’s generated unless of course the trades were actually cancelled, which I doubt will be the case here even if it was a mistake on the trader’s part.
True, because most fat finger mistakes will not alter a chart. When they occur near turning points ( Like todaus did), it is usually still close enough to a low or high that it only adds to a cycles count a little.
When they happen in the middle of a run higher or lower, they rarely change anything ( they can cause shake outs at moving averages at times).
Thanks. That all makes sense. 🙂
I doubt it was a “fat finger”………it occurred in the futures market, stops being hit.
Yeah, I was looking at it last night, it was all at once and on just HUGE volume. Your story makes sense, doesn’t usually drop in one single trade like that .
GDX and SLV still in their triangles.
GLD on the other hand broke it’s lower triangle this morning, possible stop run, it will be interesting to see if it will close back inside in the next few days……….
Statoil, Norway’s biggest company, nothing more than a… Pyramid 🙂
https://uploads.disquscdn.com/images/f24f64ad0cb7d48e2dd2bf42bda0da2f2f1b3364f0734521e27d31f298347ba7.png
I call it a H&S to keep it simple : )
When you know the angles, you can predict the tops and resistances in advance, this is what fascinates me 😀
Plus… it is so pretty! LOL…looks like a diamond and you know those are a girls best friend!
FWIW … I’m starting to see some possible “topping” signals for TQQQ. It is currently a “sell” on my 15 min chart so I have tightened my stops to lock in profits if it keeps dropping. I always say I should just “buy and hold” TQQQ … but I never do! LOL
Anyone in PLG here?
ECR Inverse head and shoulders? Look at that weekly candle in May!
Well – today’s gold slam will certainly paint the tape. Gold and GDX seem to be holding up pretty well. Sold out of my NAK today – which likely means it will rally on from here. Just could not take the grind lower any more, and below many important measures. It is oversold, however.
I sold a bunch of NAK last week and posted it here too.
I don’t think that it is necessarily bad, but the consolidation and move higher with higher highs, higher lows, moving off of the 200sma changed its patter, so it becomes less reliable for now. I still own some since I bought it lower, but it was time to cash in and lock in profit before it drops down too much.
stepped aside from UEC for now at break even
SOXX seems to reliably lead the way
I agree. NVDA is really the leader.
CGIX & VSTM, though consolidating their recent run up gains, are still acting correctly.
There goes RNVA and RLOG
Anyone know anything about warrants? Not interested in trading them, but RNVAZ are going nuts.. from sub-penny to 15 cents today…
COST…….beat down on the Amazon purchase of WF trying to find a bottom….very close.
WPX…………
A different way about thinking of cycles. I refined a bit the Coffee-chart.
We can see it covers a period of about 40 years. The structure on the bottom part is approx 100 % symmetrical.
I think of a pentagonic type of pattern.
The question now is…. Will it continue in this way.. OR will we get a shift? Food for thought.
https://uploads.disquscdn.com/images/c6e32453c96260051670a93cb8fe854325d312f131f4b03e71c8b7ee7e0de22b.png
I see a 3 mast schooner
That’s how they import the coffee
🙂
oh viking.. pls dont become BK3
😉
That BK4, since You’re BK1
Nevvvvvvvvvvvvvvvvvvvvvverrrrrrrrrrrrrrrrrrrrrrrrrrrrrrrrrrr
What?? 😀
Since I mentioned that TQQQ was a “sell” on my 15 min chart earlier today, I thought I’d mention it is now a “buy” on my 15 min chart. Once again, the bears try to drive it down but the bulls BTFD.
BTW WTF is BTFD PLS IYDM?
Sorry, I should stop using that term. It means “Buy the F***ing Dip!” It was popular among my old “silver stacker” buddies. Old PM traders use it a lot.
Thanks, the acronyms are hilarious
Alex, thanks for pointing out the 34 day SMA as support on the stock market charts. I added that MA to my charts a while back and I just noticed that QQQ and TQQQ both bounced near their 34 day SMA today. I had my first stops set just a little below that MA and luckily (I hope) the stops did not hit.
Heres a better tip
look at QQQ with a 13 & 34 sma. I used to use that combo a lot in bull markets
Yes, the 13/34 MA cross is a classic and it’s on my long term charts. I know I’m over-trading TQQQ and should just “let it ride” in this long-term bull market but I have a hard time watching my gains disappear so I tend to sell some or all when it gets “toppy” but the bull has been so strong and the market bounces back so fast I usually end up buying back in later at a little higher price.
I don’t blame you – it is a magnified trading instrument. Even bulls get some pretty big corrections at times. Look at that drop 2 weeks ago. No fun
Long tail “single trade” update, the $2.74 high for GDX has been hit.
https://uploads.disquscdn.com/images/c6ce6e91dc2653a35db62134cb620a5e2c7f284d06b0f9c7549691076ba082a1.png
hi Steve,
what happens when the target is hit? it looks like it is rejecting a further advance. Is it the same phantom price of miyagi on poly’s board?
Yes, “Mr Miyagi” was the first to point out these “phantom trades” on BBT years ago. I started noticing them on my trading platform and I watch them and post them here occasionally. SPY is one of the best ETF’s to watch for these kind of long-tail candles.
Please understand that they do NOT always hit … but they hit often enough to get my attention.
The theory is that some people think these long tail candles are used by the “Big Boyz” to send signals to their trading buddies to let them know which way they are trying to take the market short-term. That may or may not be true, but these “hit” often enough that it seems to be more than coincidence. But it may just be “tin foil hat” stuff. Who knows?
https://uploads.disquscdn.com/images/c0f7487c1efeae45c66236a4def50fcae9df4597fa8130412bdb6d786ec08a3a.gif
ssys down 11%
Thx, I didnt notice …. and Interesting ( Ugly actually, heavy volume).
I was actually watching VJET, DDD, SSYS, XONE for an entry on the pullback, but I’ll have to look & see what is going on.
I am expecting a possible ICL in the General Markets too, so have been a bit hesitant in the tech sector
Alex, can UNG get any more bullish? Island reversal, price broke above your wedge, MACD crossover, RSI close to cross back above 50. I’m trying to find a reason not to go long…
I actually mentioned below earlier this morning…. that I am expecting higher price.
I think that it is bullish and posted a chart below .
Breaking above that resistance line is obviously bullish. COTs show that Smart Money closed up a lot of their heavy short positions.
China (KBA) looks to be trying to finish Wave1 of (3)………I have trying to buy this sector, soon at the bottom of wave 2 I will enter.
I look at this on a 3 yr weekly and it looks like a long base that is breaking out. It is a bullish set up.
The Dec 2015 low stands out – so you dont see it as possibly a Low Dec 2015 to 1 this spring.
1 – 2 in May? Now in 3?
I am sticking with the Dec. 2016 was the ICL.
Oh , your using cycles. Interesting
Indeed…… 🙂
SU
Suncor ?
no… suckUp
;p
Oh,,,,lol
Suncor actually is a nice little set up at the moment…. lol
I KNOWWWW …. i JUST looked at it … that is freekn hilarious… omg… 2funny
LOL…..
possibly – yes… 3 of 3 i see ……. the gap in the 3of3 is a giveaway
GGB rocking – closed out of my BOIL position with a bit of green. Not touching 2x or 3x Natty for a while
MTL looking good also……same sector.
Now China and India troops in a tense stand off along the border of Sikkim…….
RUN continues to ‘run’
GRNH trying to break above the 50sma
NWGFF – crazy, was up over 50% at one point.
lol u took my line… my Eyes Adore Eyes…. 😉
DON”T GET DRAWN IN CF !!!!!
LOL ………………………………………. I didnt say my “beautiful brown eyes”
https://uploads.disquscdn.com/images/cb7ca5f62688ea409c130af0d6e85cddbd8e0d7d2bc652a2f8272d60be562a08.png
glbs just got a smack down at 1.35 …giggle
actually GBLS and EYES are kinda freakin me out… running together… i keep mixing them up… :-/
You’re the one! I keep looking up GBLS, and it is GLBS.
Cut it out!
hahah.. my eye is twitching..
*blame Thelma
*and the lake air
Crude Oil (USO):
Looking to go long…………..ITM Calls.
interesting NAK.
8day chart… stair-stepping nicely up the brown chn.
I havent sold yet because of this pattern, supported at the top of the brown
(if it fails, i think it could make its way down to the MAs at around $0.80)
https://uploads.disquscdn.com/images/be5a86180be41f9fa306a35f003a32d100d00b83d581ac356b6d83acf0f79c0d.jpg
Nice chart SOG…..I am holding also.
Me too….please lets not drop to .80! Love these channel charts. Please keep us updated on NAK.
top of chn is at 1.40.. low of the day as at 1.39, fortunately closing above… but i think im gonna have failure of that level as my sell
Thanks
SOG: I think USO at the 8.65 low is close enuf for me……wutcha thinking?
hang about, im gonna run it thru my 8day.. brb 🙂
Waiting patiently…… 🙂
looks pretty fuggin good to me ..
compare back to 2010 chans again…
https://uploads.disquscdn.com/images/753c048d5fd98e55d0dd85b61a0640d6f1af64c56e006ae29b77da85dc26c75f.jpg
Yep….Nice !
Thanks SOG ……
considering the original ‘red chn’ target was around 8.50.. that got pretty close
Yea agree……worth the shot, possible ICL. ?
my only reservation looking at this on the 8day.. is that it never entered the brown chn this time around, as it did back in 2010.
hope that doesnt mean something bearish.
Well if she breaks that low …. we will know something else is happening ?
Based on what I am seeing, I believe that we are at the next Low for Oil too.
I still would advice waiting for confirmation, but the set up look correct in many ways.
AND a few of the Oil stocks are setting up nicely to boot 🙂
am already in TRCH.. got bumped out of LGCY when it tumbled.. but may get back in soon for another dopamine hit 🙂
I’m going to put it in the report tonight, but there is something about WTI that looks sweet too.
I captured this basic chart on the weekend.
A break out could be bought, but I often front run that safer method 🙂
https://uploads.disquscdn.com/images/3fe59af6e90af881bbce7f00239adc712aa5636d72ef93dc44fbb996ea77ba49.jpg
DNR……
mommys little girl behaving nicely…. so far..
OAS too……
REGI and she actually has pedigree + volume
You had a list of 3 that looked good – That was one of them. Nice volume on the continuation higher
Nice Operating Margins also…..
Interesting stock….
DNN is moving. I did a detailed analysis of it over the weekend. There are striking resemblances to NAK.
Here is a comment from NAK: “Pepple is the World’s largest undeveloped Copper and Gold resource”
And from DNN: “Phoenix Deposit is the highest grade undeveloped uranium deposit in the world”
Their balance sheets have a lot of similarity except DNN has burned twice as much cash. But they are both debt free and hold lots of cash.
DNN has 22 days of Short Interest – yummy!
Thanks Ron – Appreciate you sharing your research.
CLD – can it hold this break out over the 50sma?
WRN, can it make one?
Lot’s of pretty good chart s in metals / Uraniums / Solars / still setting up.
LGCY …lol
I know just looked at that one…..
CF……. any Oil Jrs. shouting out to you to buy ?
Underwater, but still holding JASO. It seems to be walking up the up trend line.
Did you guys see AREX Friday? It finally lost the 50sma – FAKE OUT!
Similar with RES, ERF never lost it.
REN …….
STIMPY
????
Refresh
https://uploads.disquscdn.com/images/83d3b6a5075126ca8ddb9a580a6f5da30c978cd9d8b9078b70583093e92d9d6e.jpg
LoL
Oh…lol…before my time. 😉
Might be after your time.
!990’s
LOL…..Yea your right !
Ken, how old are you lol? I only ask because my mother wouldnt allow R&S in the house.
Really ….. I am old enuf to remember watching it. born 1960 🙂
You got me beat by a few years
damn 😉
Alex
.. ooops… i thot that said stumpy
I am focusing on OAS ……. and PACD
PACD Filled…..tight leash
holding off on USO calls
One more long tail candle chart of note … I just noticed that GLD had 3 long tail candles UP in the pre-market today.
The “target price” is exactly $119.43 for all three candles and that also happens to be last Friday’s closing price.
Makes you go “hmmm…. ”
https://uploads.disquscdn.com/images/5705e3fdf6112fde1340f98752e6080aca116573a2cd5fa5eff50d01d7b4565b.png
Cool…….
OK … this is the last one today, I promise. I could not resist posting this long-tail candle for SPY that I just saw. You may remember that I said SPY is the best ETF to watch for these candles IMO. Check out this scary candle for SPY that I just saw in the AH today. It shows a “target price” of $238.08
Yikes! That would be a BIG drop!
https://uploads.disquscdn.com/images/0df9726831cb565252e25dacedcae89cd8a5598f0231f02bc0c8c4e47591852c.png
Yikes is right !
Any Tails in Crude Oil ?
Thanks for this and GLD.
Natty, consolidating on the bottom of the channel. Hoping for a nice waterfall to wash out bulls, but so far they fight decent. Sentiment could have more room for drop, but bulls may reverse trend here unfortunately. Let’s see. Keeping stops tight here, if they break above current downchannel (not on chart) position get closed.
https://uploads.disquscdn.com/images/f01db8065411b9bc3f28af96aa0754c3ff158a1e271c382c6bd68751e485462c.png
https://uploads.disquscdn.com/images/ca414abf8463ebd977a3b8056f2e73d2dd99f100479eab0218003facfec9fba2.png
Draghi and Yellen both Yellin’ on Tuesday!!