
Weekend June 17
On Friday we saw some nice follow through on a few of the recent trade set ups, but Let’s start by discussing the markets after the Fed decision on Wednesday.
NOTE: There has been a bit of a medical situation that has called me away from my computer from Friday morning through most of the weekend. I do not have time to proof read for typos, I just spent 5 hrs charting & writing and I do want to release this mid day Sunday (Now) , since I will be tied up for the rest of the day. Thanks for ignoring any typos. I will return tonight to fix and clarify anything. Thanks.
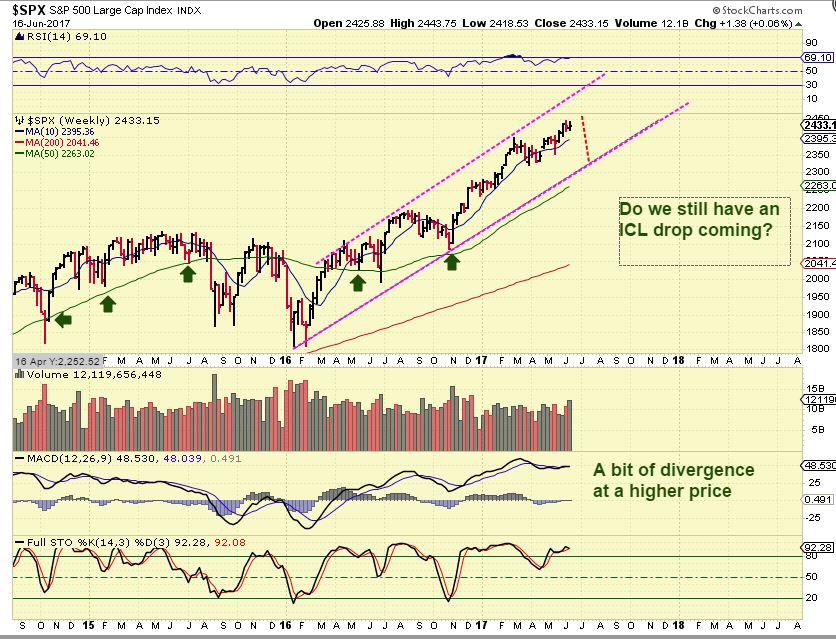
SPX WEEKLY – The markets have stalled a bit in their recent climb. We do not see a clear cut dip into a normal ICL, so I am alert to the idea that this could be coming soon. There is a little divergence on the weekly chart, but this can climb higher as the divergence increases too.
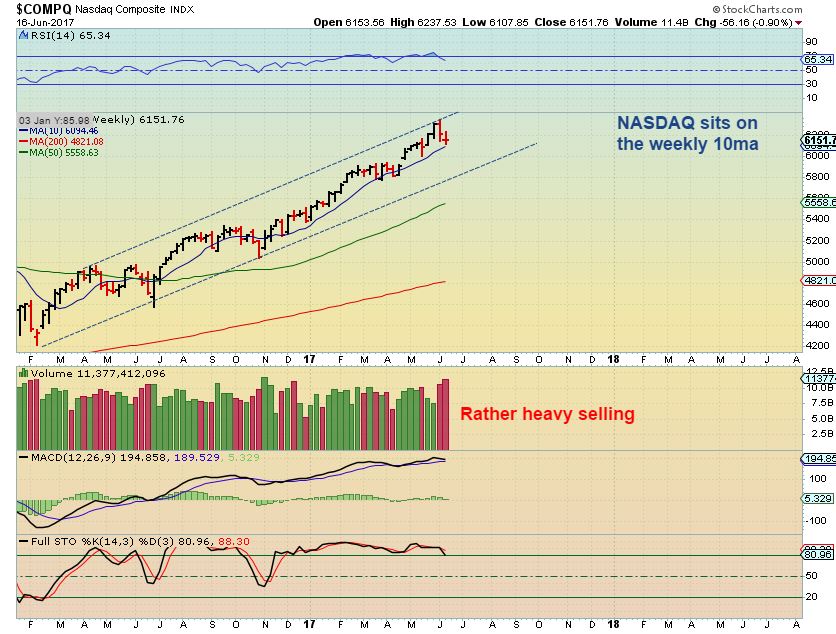
NASDAQ WEEKLY – The NASDAQ went no where this week. It rests on the 10sma , and that is usually considered ‘support’ on a weekly chart. Volume was quite heavy, it could be distribution. The lower channel line is the next support of this breaks down.
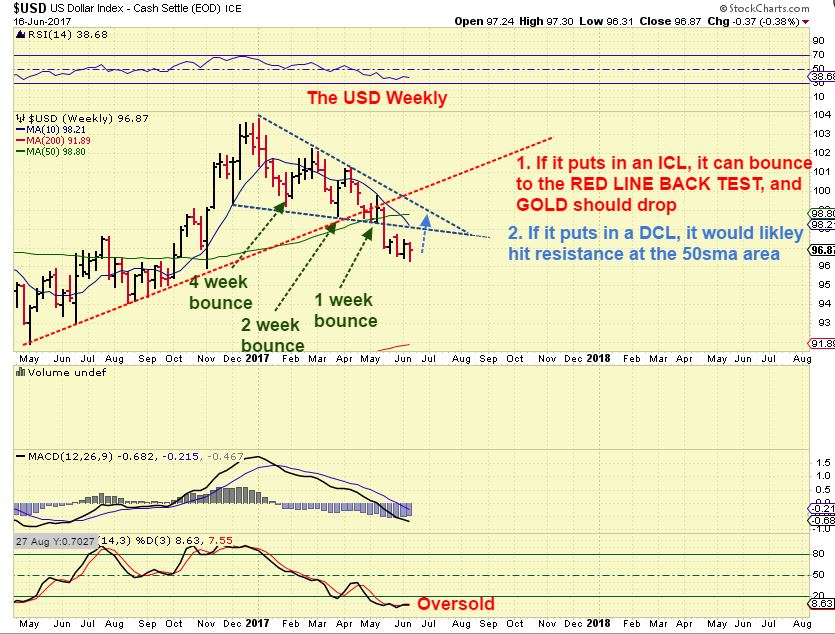
USD WEEKLY – I think the chart was supposed to say ‘View’. The dollar i due for a bounce, a DCL . AT this point, it is broken in several ways, but if it bounces, that could send Gold Lower. More on that on the next chart…
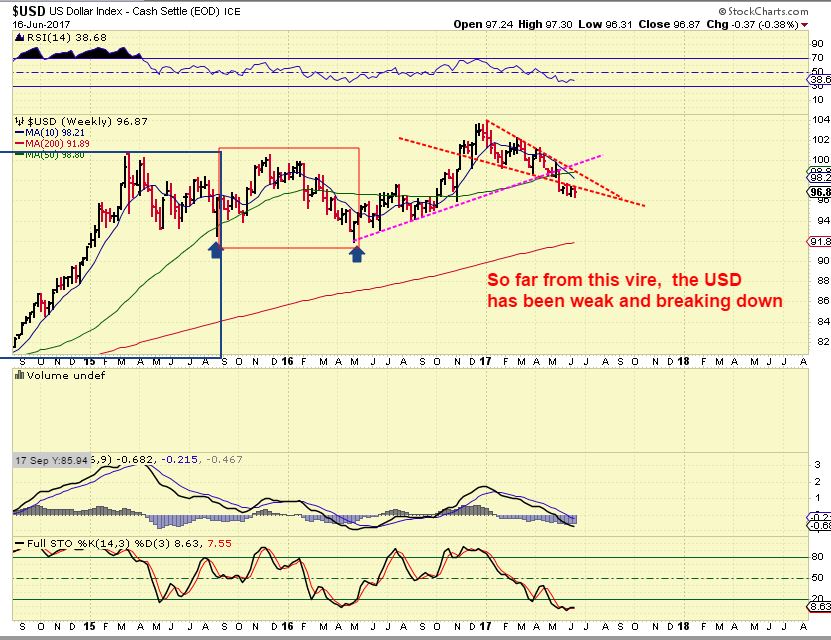
USD –
WTIC – Oil has been drop, bounce, drop to lower lows, bounce, lower lows, etc. Oil can be bought if it crosses above the 10sma ( or safer if it Closes above).
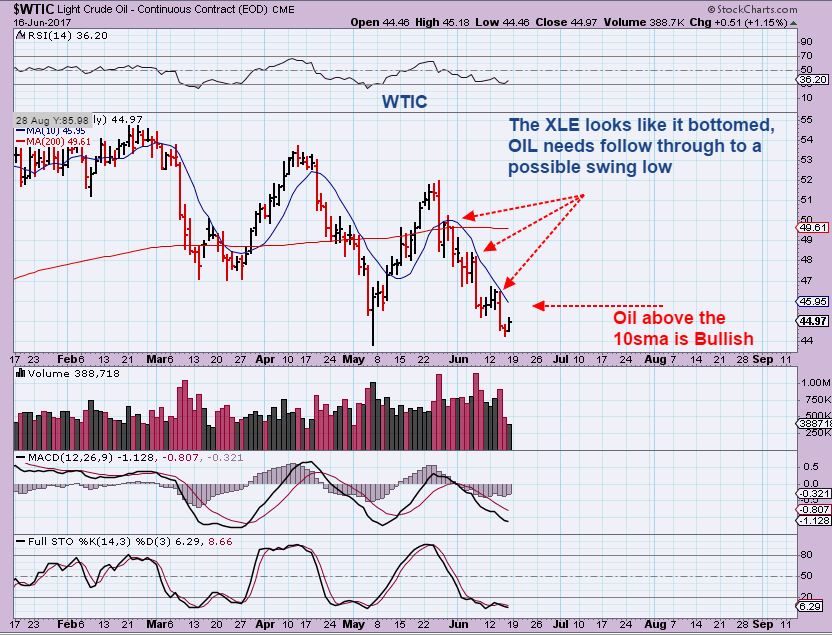
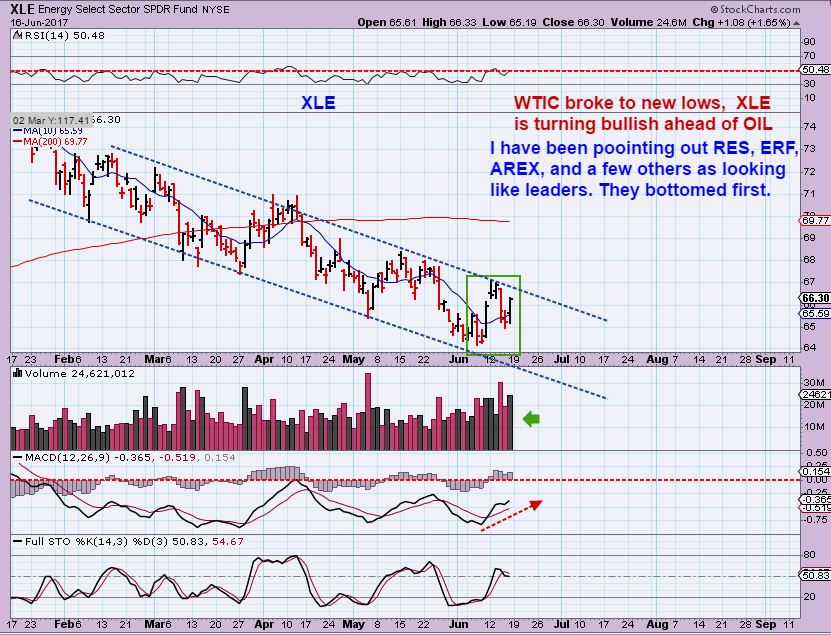
XLE – Oil may be close to a bottom, because as I have pointed out, some energy stocks are leading , and lows seem to be in ( ERF, AREX, RES, and more). Now we have the XLE with a low and a higher low in place. Many things about this set up looks bullish, and I think that it may break out soon.
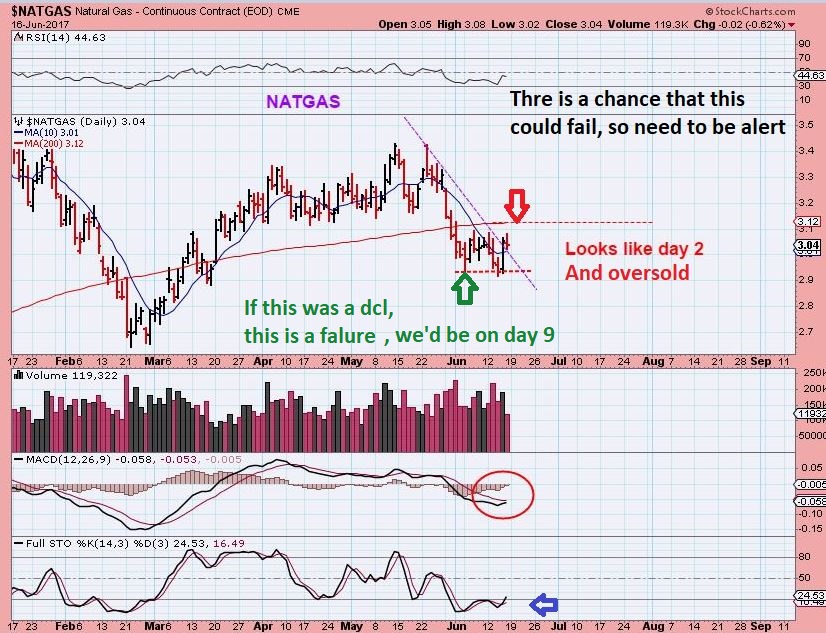
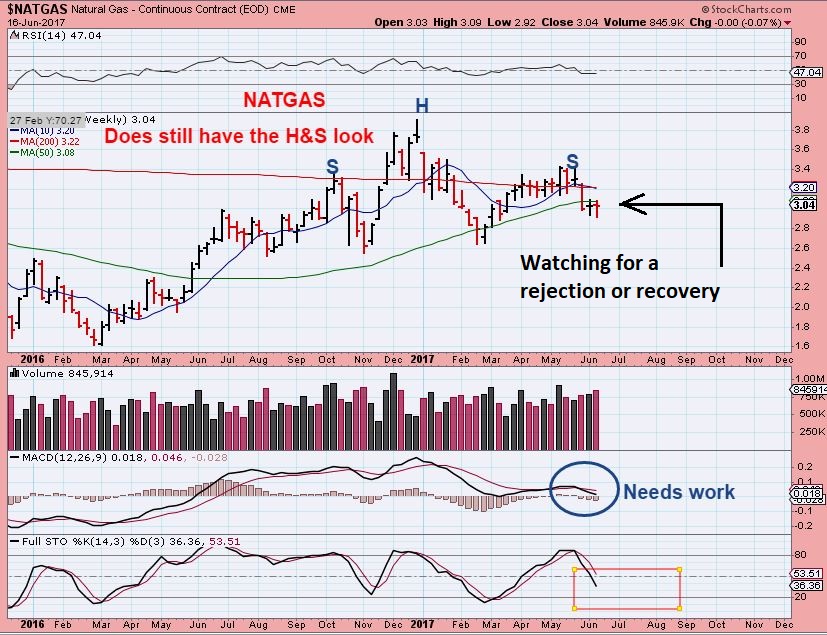
NATGAS – I went long NATGAS on Thursday after the inventory report caused a strong reversal higher, and was viewing that the recent slight undercut could be a dcl. In THAT case, this would be day 2. I am watching this closely, and my stop is below Thursdays lows, because…
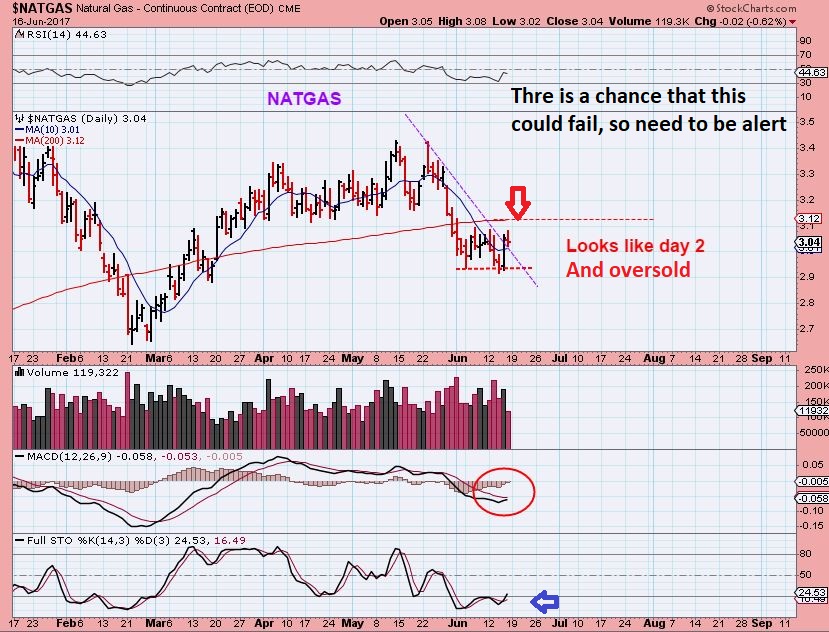
If the dcl was in early June and this is day 9 , then that recent undercut is a failure of the dcl. Energy stocks look to be bottoming ( XLE) and NATGAS had a strong reversal , sign of strength last Thursday, so I took the trade as though we are on day 2. We will know very soon.
As pointed out before, this certainly does look like a H&S on the weekly chart, as it struggles under the 50 ma weekly. The weekly MACD is breaking down, with room to run.
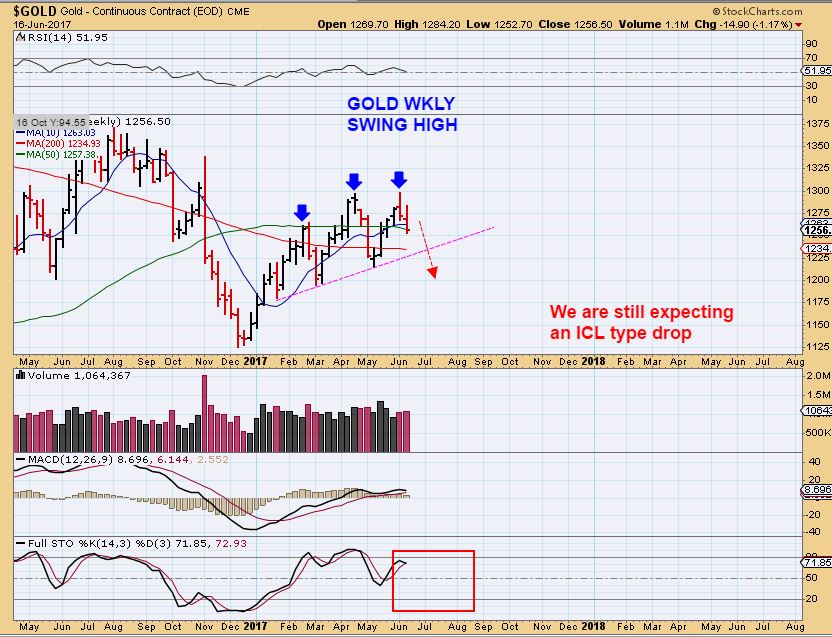
GOLD WEEKLY – We do have a swing high on the weekly after the Fed Meeting. This looks bearish.
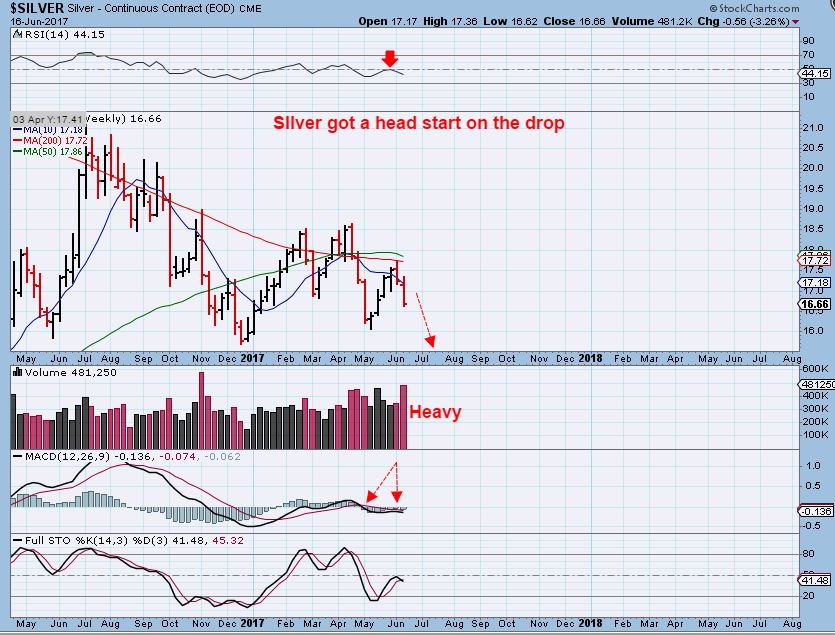
SILVER WEEKLY – Silver certainly doesn’t look like it is moving higher after the Fed mtg Wed, as it closed near the weeks lows.
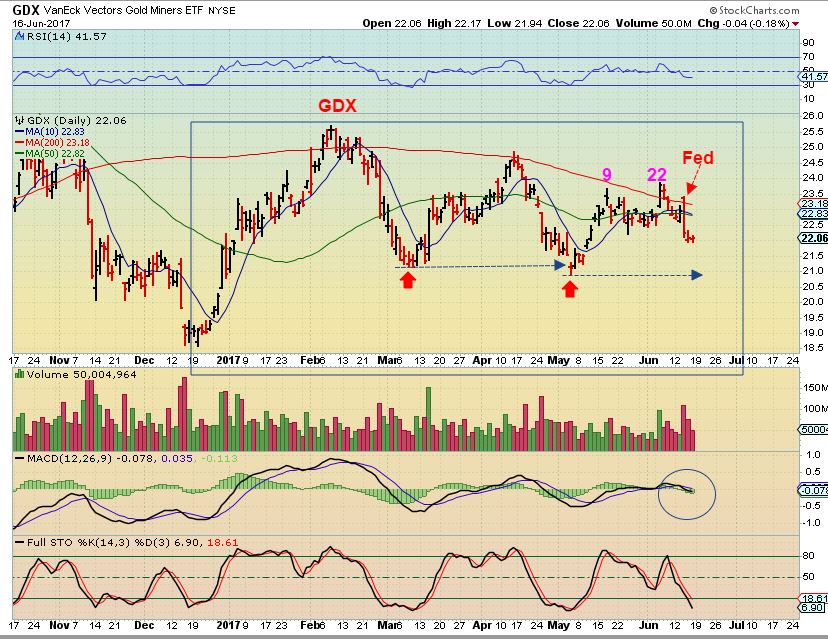
GDX – Miners dropped sharply on the FED WEDNESDAY, rejected again at the 200sma.
GDX WEEKLY – This is a swing high and also looks like we can expect more downside.
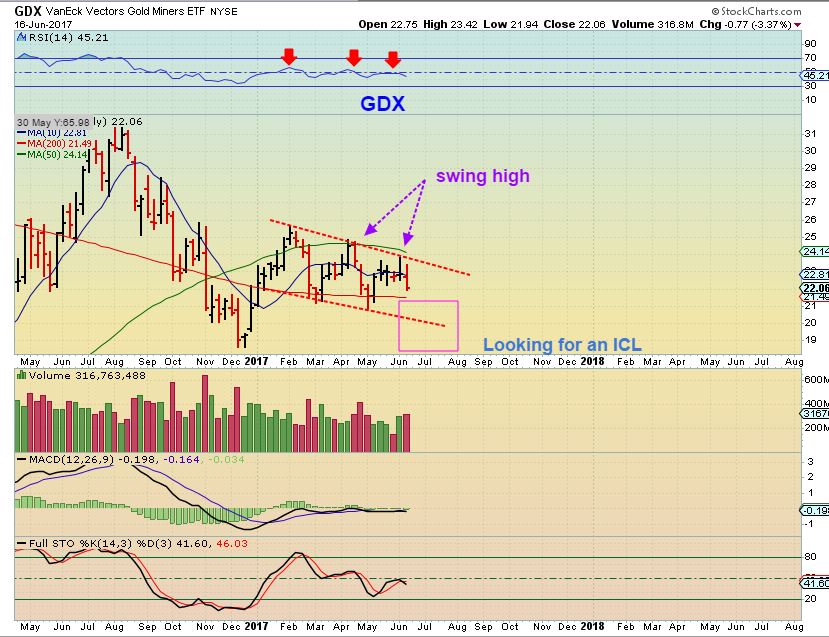
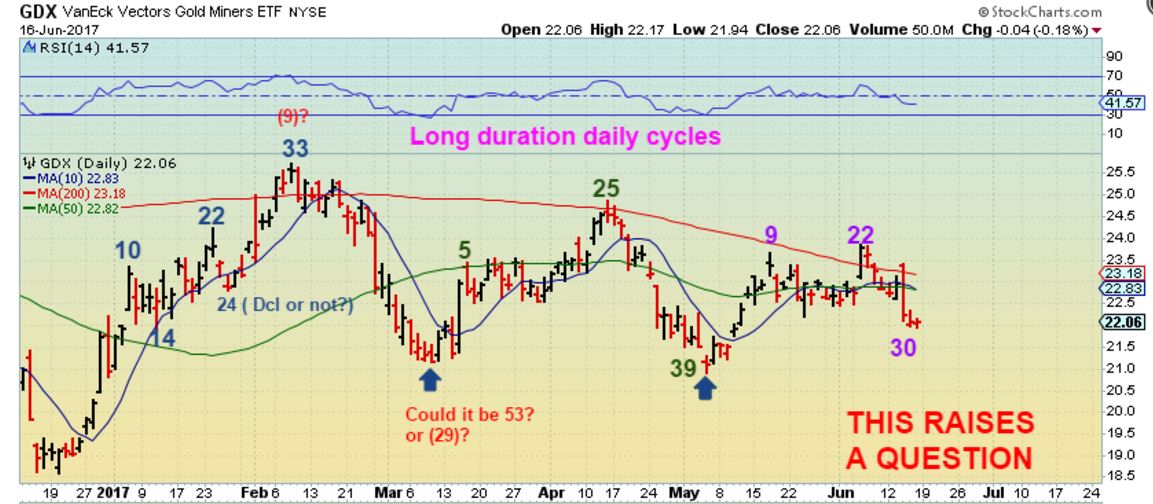
NOW FOR A SERIES OF 4 CHARTS WITH A QUESTION:
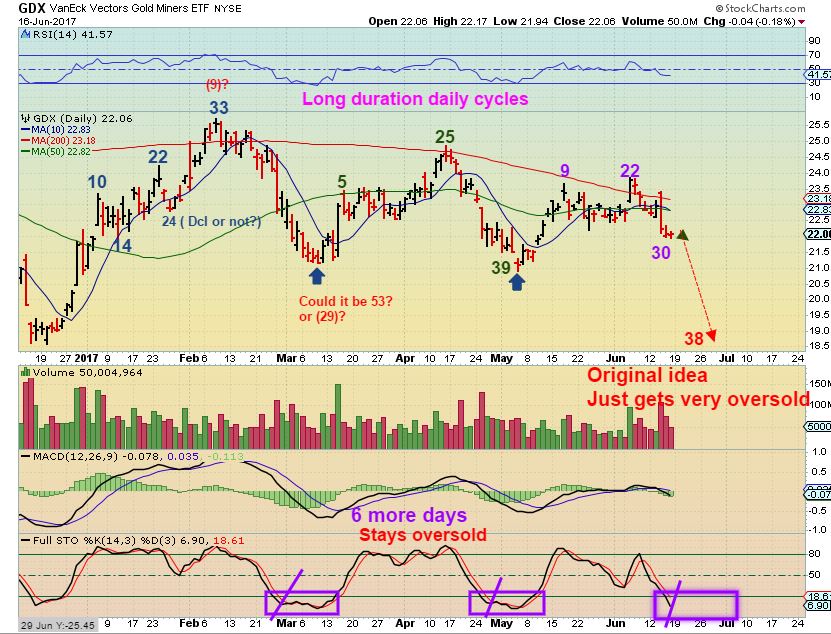
GDX #1 – The daily cycles have been rather long and stretched out recently. The last daily cycle was actually 39 days long. We are on day 30, so…?
GDX #2 – Do Miners just drop for another 5- 10 days or so? That would probably be a great buying opportunity if it does.
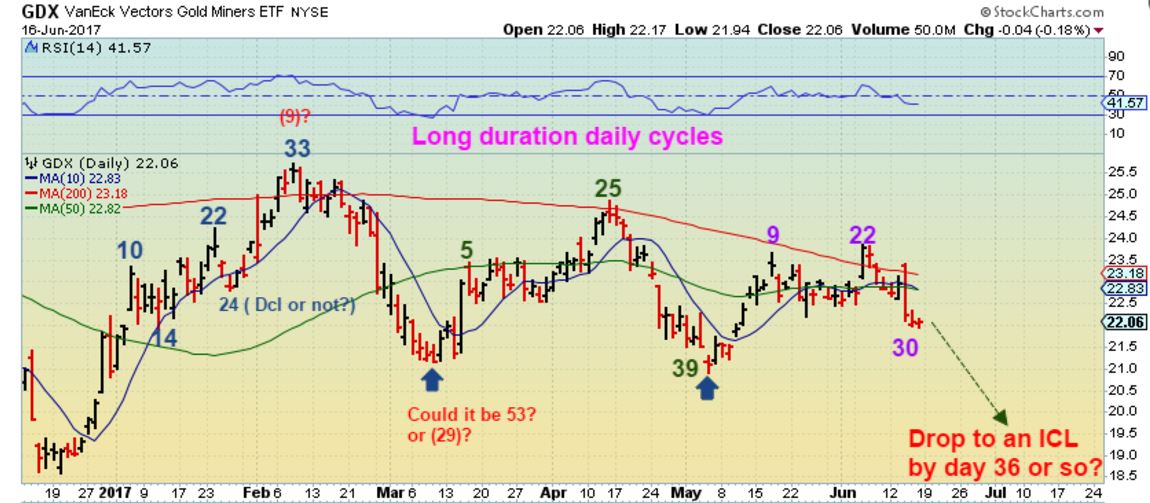
GDX #3 – Or will we get a dcl shortly and even 1 more daily cycle to drop into the ICL?
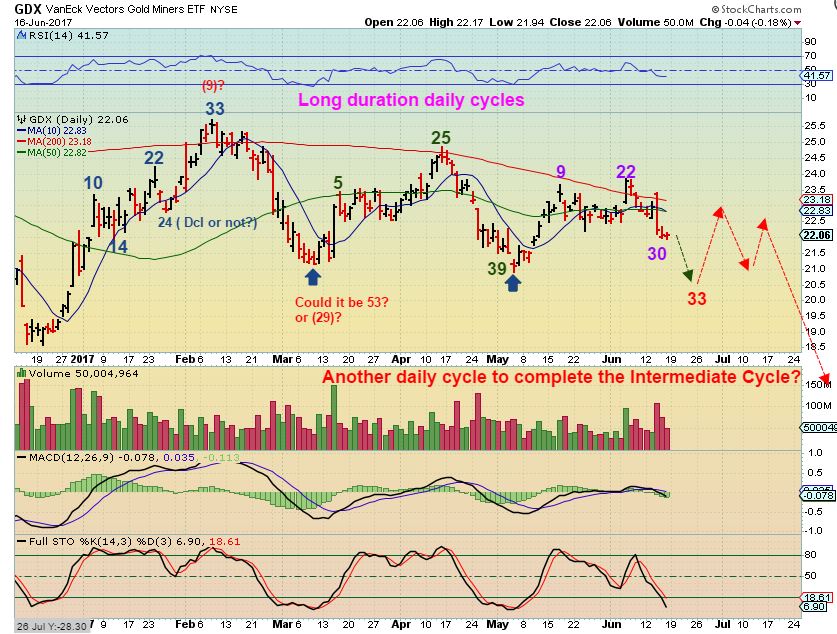
GDX #4 – With the recent long duration daily cycles, I think we may just get a flush down from here, but time will tell.
We look forward to next week to see how things play out. It looks like some parts of Energy MIGHT be stabilizing, and Precious Metals may just have a little more downside. Enjoy the rest of your weekend, rest up, and we’ll see what Monday have to offer to help us to navigate this time period. Thanks for being here!
.
~ALEX
.
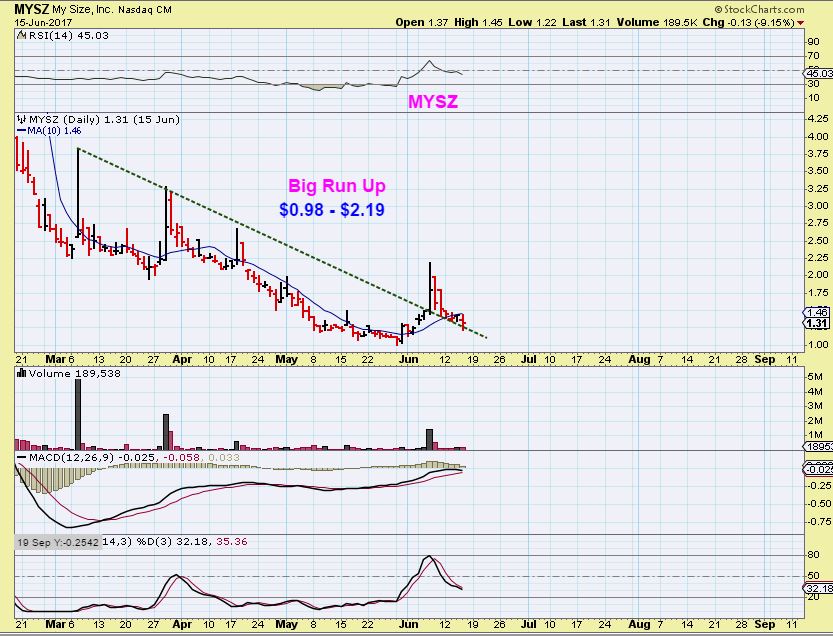
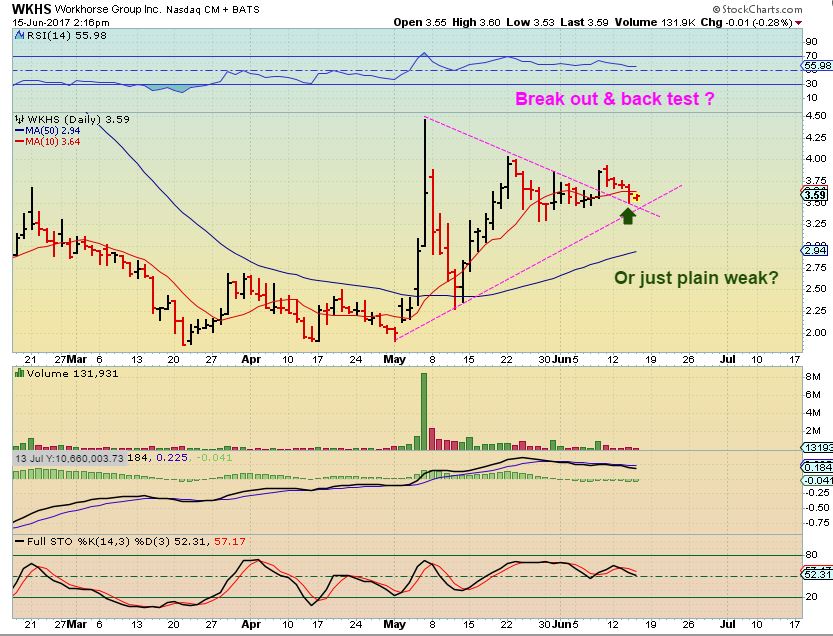
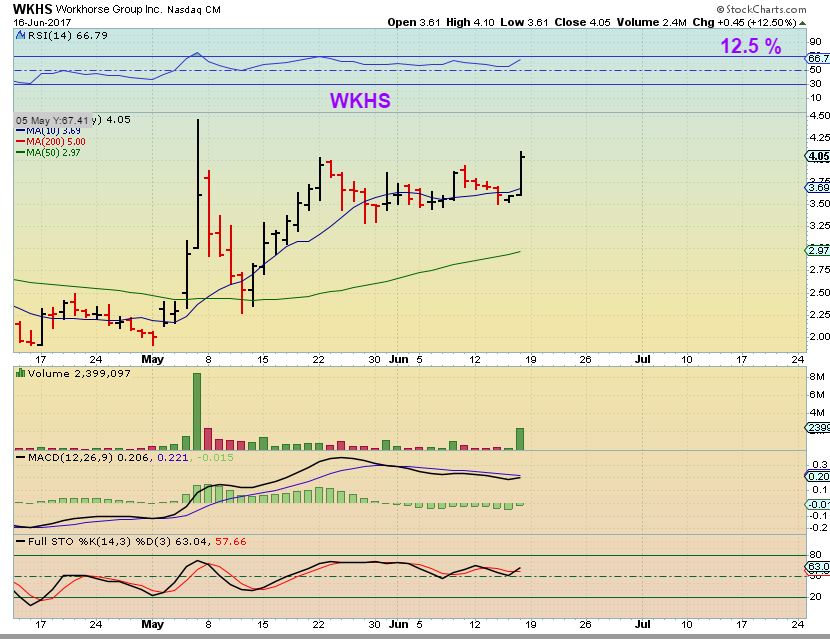
CHARTS – I mentioned the action in MYSZ as being bullish. I then got stopped out, but it looks like ti may just being a back test of a break out, so I am keeping this on my watch list. When this ran higher, it went from $1 to $2.25 in days. It could really get going if it remains bullish.
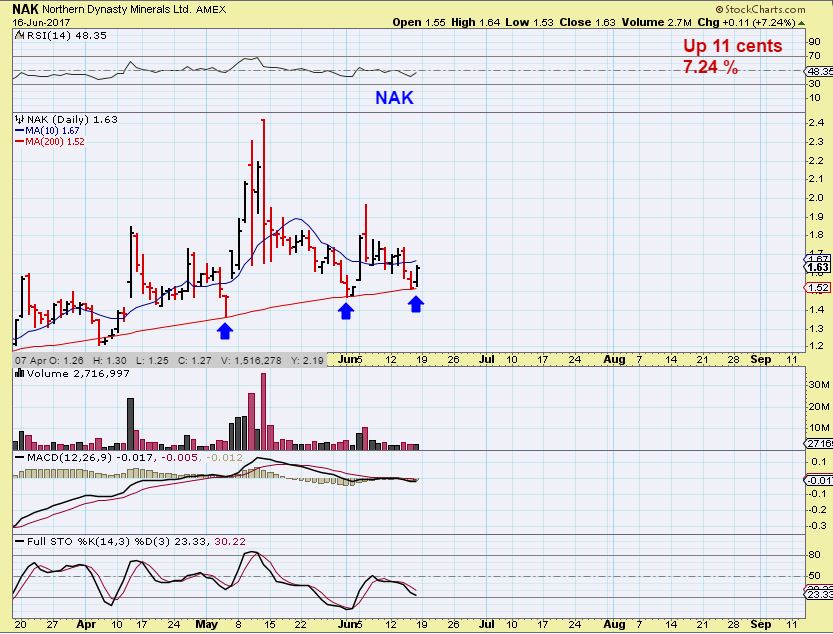
NAK from Fridays report. It landed on the 200sma, and this has acted as support & a BUY point.
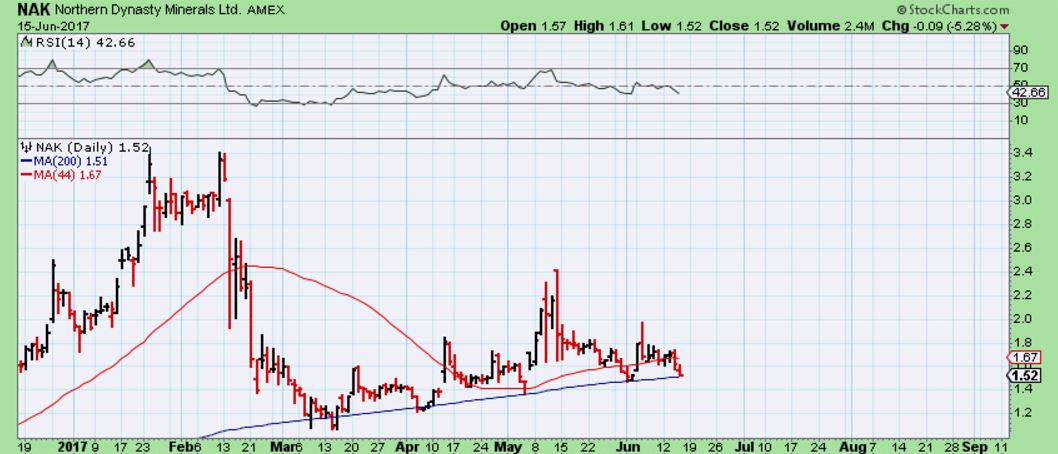
NAK – And there it is again, right up off of the 200sma Friday.
In Fridays report I posted this set up.


Thanks Alex! Great report once again.
Nice one Alex. Next week should be interesting.
Yes great report …. might be one more daily cycle before ICL… next week should be telling. On NG I am getting first week of July for ICL ycl and great buying opportunity based upon EW and cycles.
The Natgas trade does look like more downside is possible on that weekly chart. I am long, but I’m watching it like a hawk.
Thinking of you…
Thanks You Mark, Appreciate that. Things are shaping up.
Good to hear and thanks above.
What are the chances we don’t see an ICL for the PMs until the fourth quarter?
Hope not! Can’t wait any longer!!! I’d hate to get chopped up in a final daily cycle one more time! Ugh! I’m definitely ready to buy here any day now.
4th quarter, hmmm. Never say never, but we had an ICL in Dec 2016 and they usually run for 6 months give or take a month ( at times, give or take 2). At this point I would think an ICL is closer than that.
Don’t worry about the typos Alex! Hope all is well!
Thanks Zoli – I think I found 4 while proof reading on my phone, but didnt correct them- It’s a hassle on the phone.
And all is going to be fine, tough start to the weekend, but all s good, thanks.
Posted this last night but wanted to put it on the current report in case anyone wants to take a look.
XBI – back in the channel but the pattern certainly is not invalidated at this point. May make another run? OR do we get a false b/o (throwover) and then it follows as the general markets start a more contracted pullback. Wave wise expecting market pullback (likely still fairly gentle) before too long. https://uploads.disquscdn.com/images/ab2a0701723a136b36f4dc6bdbee9a52242d53f277f95200978e99cc832f8355.png
I don’t use cycles on XBI or IBB, so I dont know what the timing should be, but I do like the 3 month chart of XBI. If it breaks out & runs, it could put in a decent run. ( LABU, right? ) 🙂
Shouldnt you be out walking that beautiful beach? Nice pics
I did my chart updates last night. Yes, LABU. I have a small position right now in case of breakout but tight stop.
Btw, I took your advice and went out for a long stroll!
Well at 4AM the NAZ futures are up 1/2% with oil and gold down modestly with the $$ up a smidge despite a decent bump in Sterling.
I like the way energy is starting to carve out these lows. Huge volatility in some of the small cap names, almost always signals an impending low. We’ll see!
Alex . I’m toying around with LLEX as an oily stock. If you have a moment could you have a peak at it? (I’m having trouble figuring out how to load the chart)
Hi Ron,
It has been climbing rather steadily , so it has avoided becoming a casualty. That is good.
I feel as though the MACD is warning of possible weakness at this point. It may need a little time?
Use a stop if you are in it.
Ehh..? Where is everybody? Is my Disqus just not loading. Eirey…
I released a 2nd report before the market opened.
I had no idea. I guess that’s what I get for sleeping through the open again! I thought my Disqus was broken. It was like the Twilight Zone in here!
No email alert?
No. Only for the weekend report. At least I have some reading to look forward to tonight.
Ended up selling LABU today on the big breakout of XBI. If it backtests the breakout, there is your next buy. Just taking profits based on 3x ETF moving so much in 1 day.