I posted the following 2 charts in the weekend report as a reminder of a few trade ideas that we are currently watching. I have a few more that I wanted to add before the market opens…
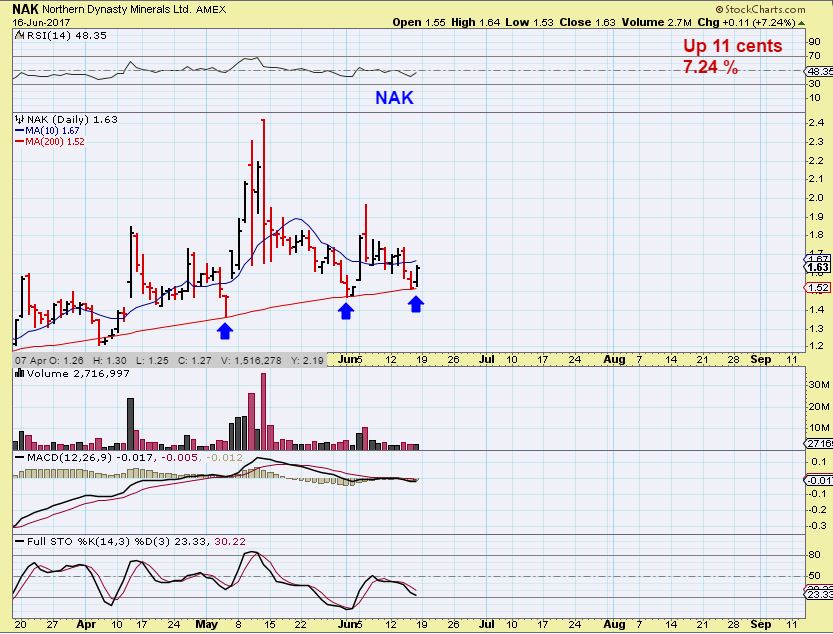
NAK – we have been accumulating this on and around the 200sma for months. Friday mornings report showed that NAK was back on the 200sma, and it popped Friday…
We also looked at this chart again…
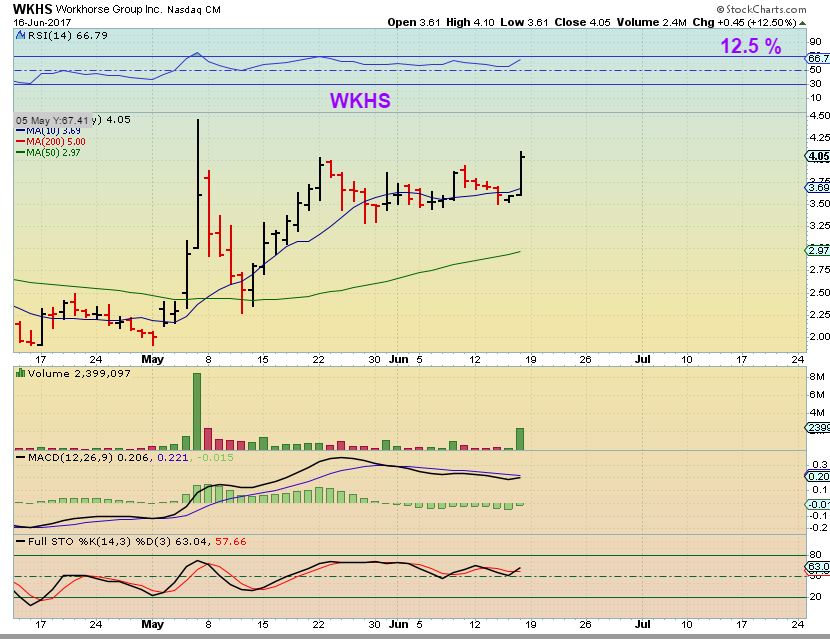
WKHS is starting to break out, I’m hoping for some follow through.
I was away from my computer for most of Friday and Saturday, so I didn’t have the time to go through my usual routine and see if there was any ‘activity’ that could be worth noting. As I was doing that this morning, something really popped out. It was the Medical Marijuana Sector.
Medical Marijuana
Let me start by saying that this next sector that I am going to discuss again is not for everyone, but I know that plenty of my readers have shown an interest in this sector. I did a write up last December on this sector ( The Link is below) , you can reference that article for more names to follow too. These can move VERY quickly, so position size is important. Some of the gains are 20% – 50 % in a day , even 100% at times, but it also can drop 20% , 30% , etc, SO CAUTION AND BEING REASONABLE is the key. With the legal system accepting the use of Medicinal Marijuana ( And recreational use in some areas), this sector is likely poised to grow in a big way over time, but some of these companies also may just go away. Personally I have accumulated 2 positions in a buy & hold and see where they are in 10 years type of investment. I also traded a few last year, like CNBX, CANN, OWCP . Again, they move FAST in both directions, keep position size reasonable if you are considering this sector. Reviewing my December article below may give you a few more names to add to your list. I would just Skip it for now and continue with this report.
This Picture is a link to my Dec report if you want to read it after reading this mornings update.
AS OF FRIDAY JUNE 16th
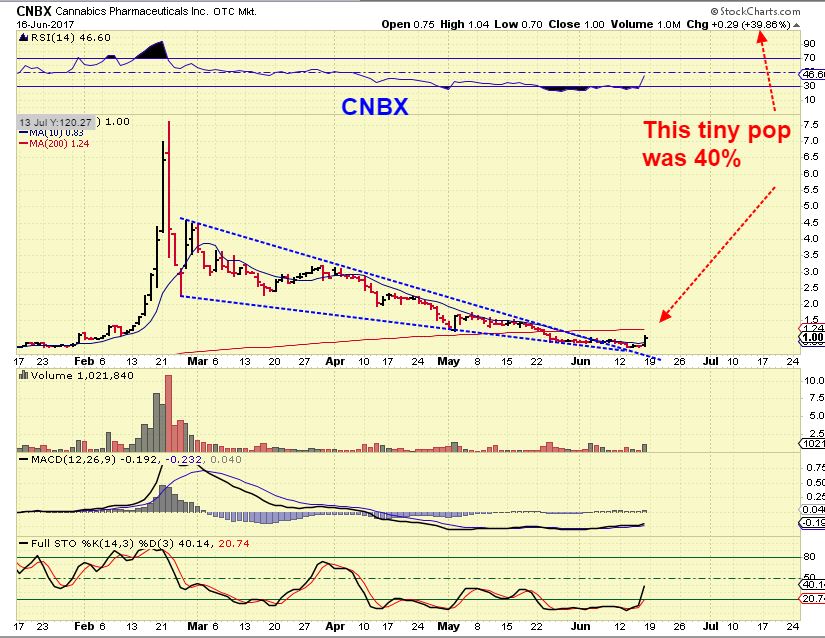
CNBX – Not a bad day on Friday, popping up 40% and it hardly looks noticeable on this chart. Obviously the upside potential is extremely good if this gets going like it did last February. Since this is at the lows, it could just continue to bottom and consolidate, but I did notice this…
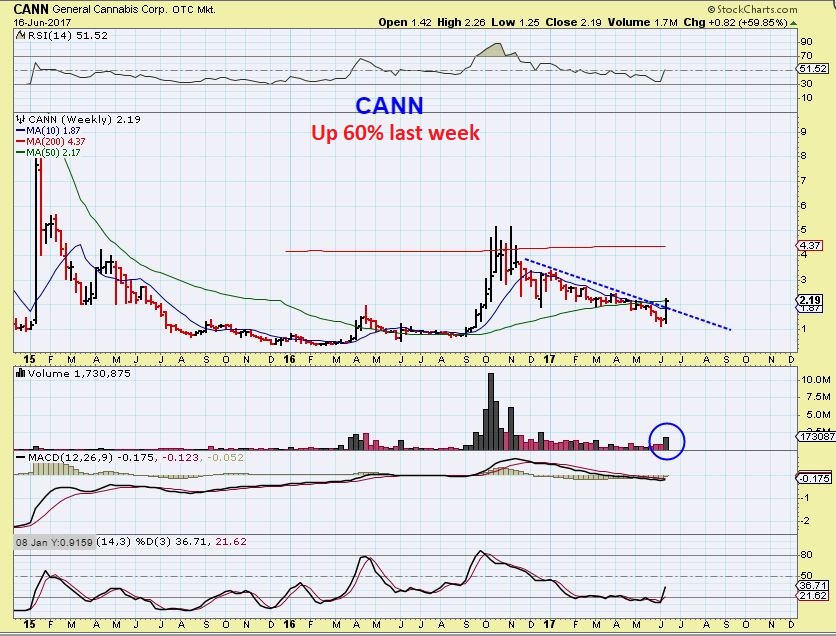
CANN – This was not a 1 day wonder, it is actually up 100% off of its lows.
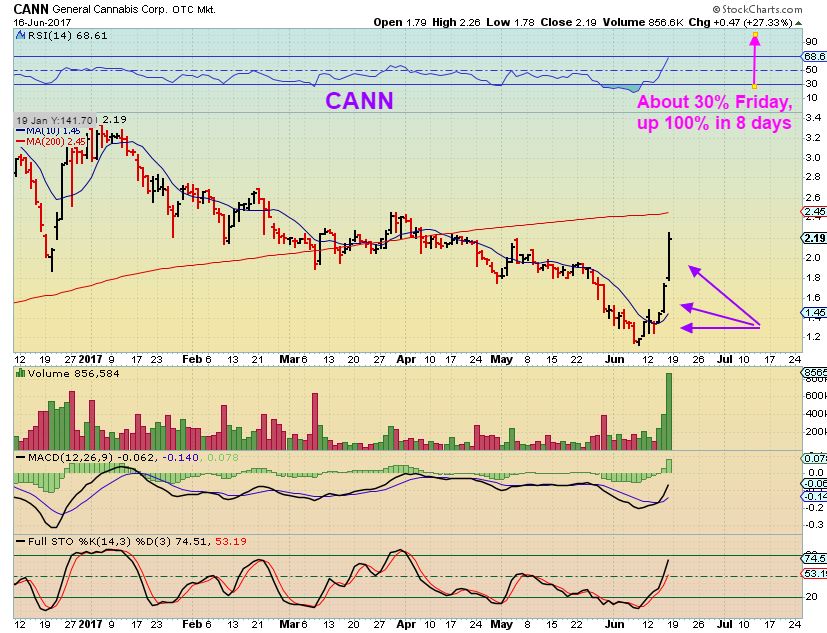
CANN WEEKLY – Breaking a downtrend.
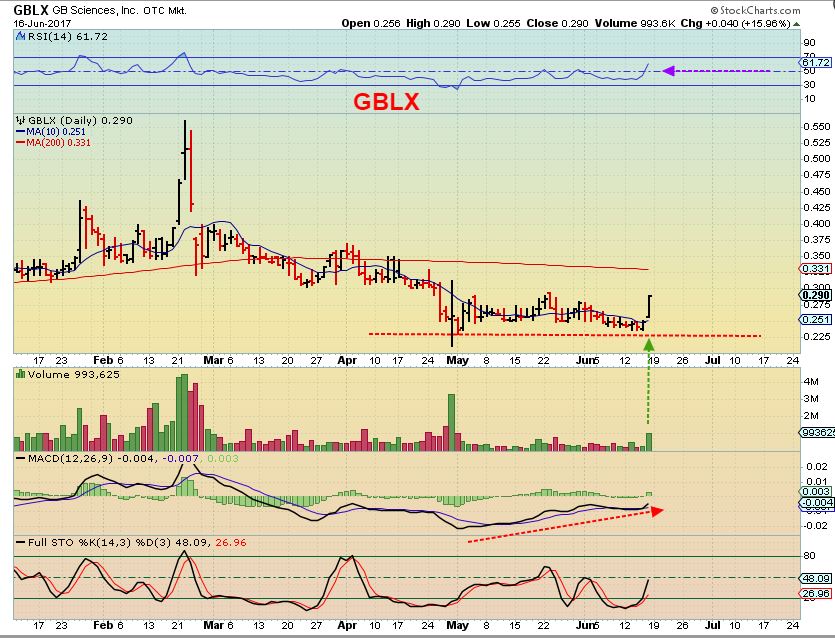
GBLX – Another POP out of a double bottom base, GBLX was up 16% on Friday.
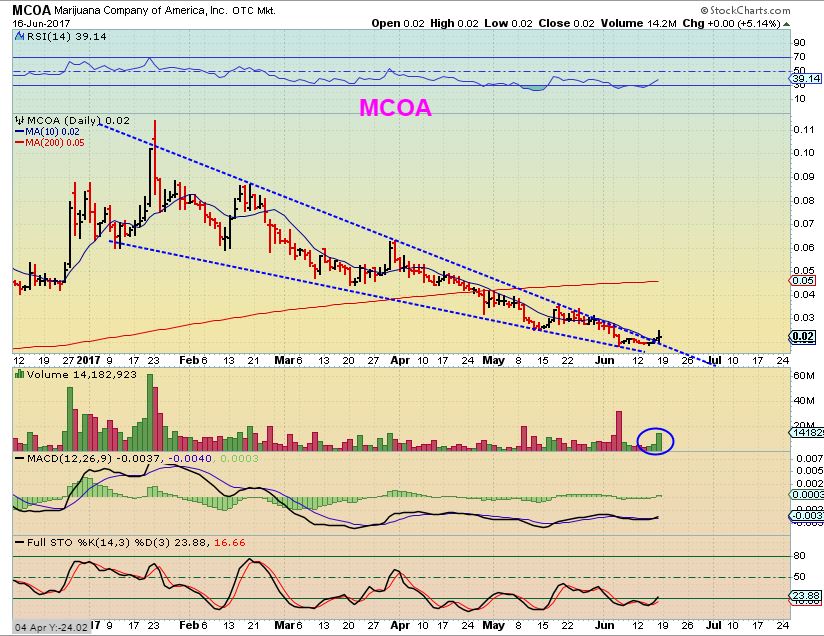
MCOA – This one is a 2 cent stock, and it was only up 5% Friday, but the fact that it is moving out of a wedge base and increased in volume could be viewed as a positive. It CAN just continue to base out and double bottom too, but again, if it runs to the 200sma, it is a 100% move. I am basically posting this to show that an entire sector is reacting without news and this sector may be bottoming. a 2 cent stock is obviously higher risk. A drop to 1 cent is a BIG loss.
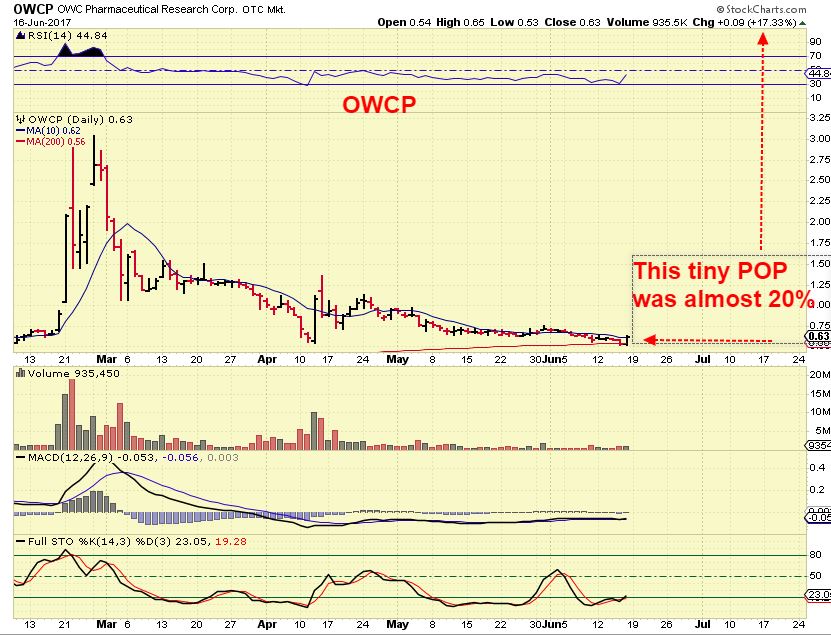
OWCP – Up almost 20% Friday, yet it looks like a tiny pop on this chart. This is a long base with good upside potential if this sector gets moving again.
The choice is yours…
-Take a small position, add if it gets moving?
– Just start a ‘watch list’ and see if the entire sector has bottomed, that way you can be ready to catch the next future gainer?
-Start a small position at what could be the lows and hold on for 10 years and see if your $1 stock became a $10 stock? (Use a stop below the recent lows, just in case this is not The Lows).
– Just ignore this sector and wait for your favorite ones to bottom?
ENERGY THOUGHTS
I took a small position in NATGAS Thursday and was going to add to it if it had upward follow though. Today NATGAS is gapping down and I will probably get stopped out, but in the weekend report I also pointed out the progress of the XLE using this chart.
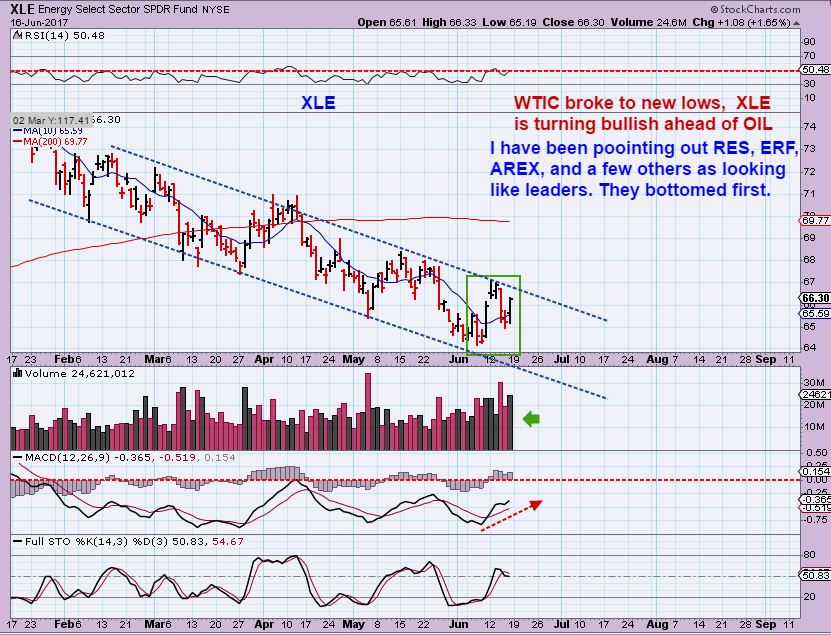
I also have been basically pointing out that RES, AREX, ERF, and a few others look to have bottomed already. They are not breaking down below the 50sma on every sell off, so they can be bought in that area, with a reasonable stop under the 50sma a bit. Let’s take a quick look here again too.
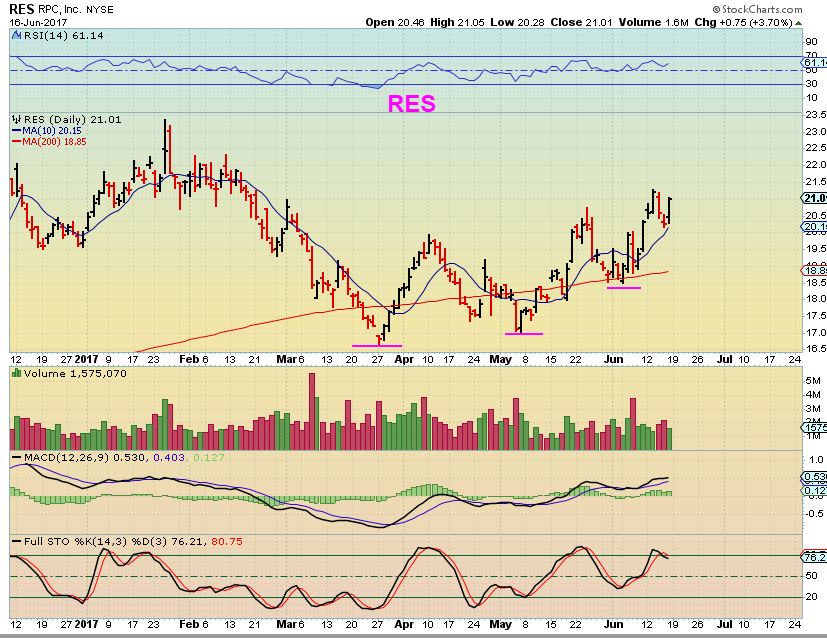
RES – It is now easy to see that RES has a series of higher lows and support at the 50sma & 200sma. This is becoming a bullish chart and a leader out of recent lows in Energy.
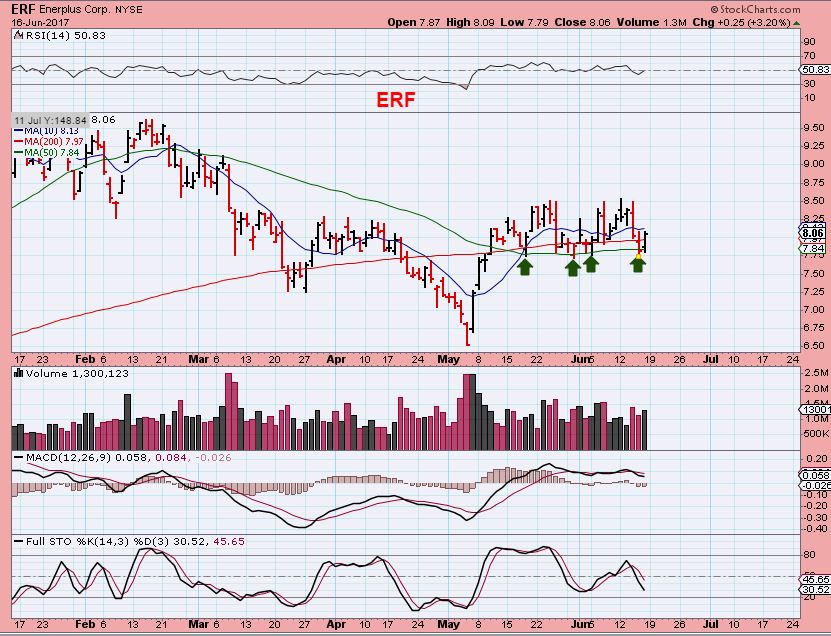
ERF – Another leader out of the lows, it sits right at the 50sma again, so this one could be bought here at support with a stop. It may or may not need more time before it gets some upside follow through. IT is in a consolidation.
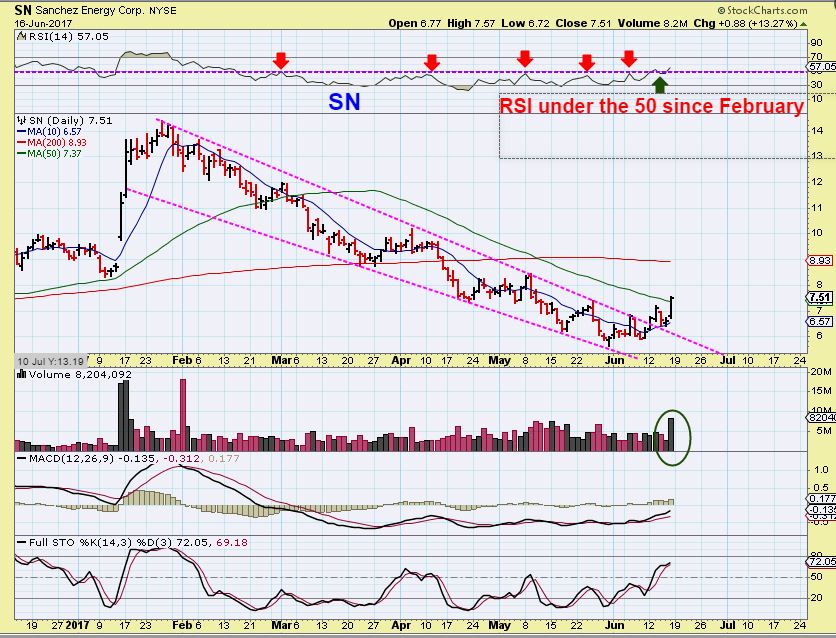
SN – Last week on June 13th I pointed out that I thought SN was breaking out above the 34sma ( I used the 30 here). The lows were under $6 and it was now at $7.12.
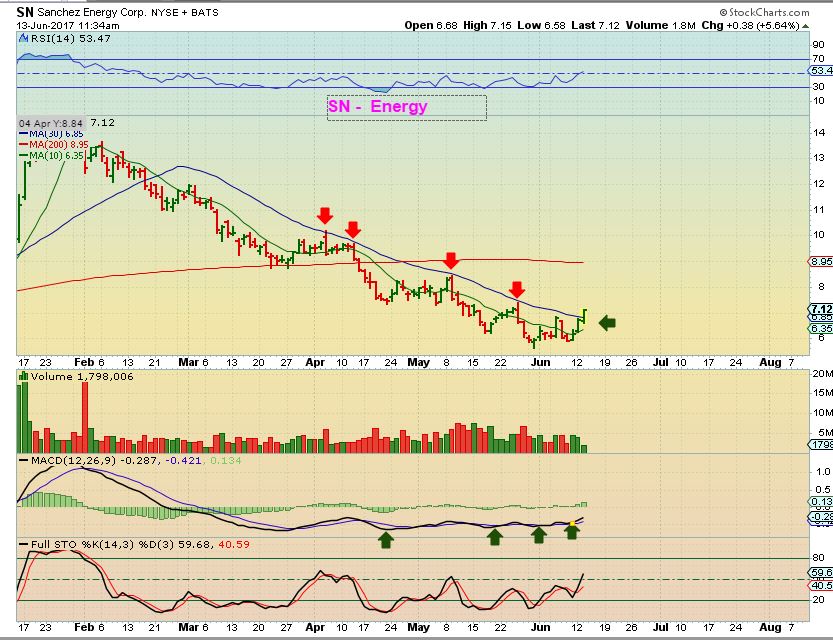
SN – It is now $7.51 and breaking above the 50sma with increasing volume, so SN could run to the 200sma, and then drop back to the 50sma. A future buy candidate ( or quick scalp here).
I’ll close with the simple reminder that ‘over trading ‘ can chip away at funds that you may want to use when your favorite sector bottoms. Some may want to patiently wait for the Precious Metals sector to bottom and move higher. This report is not to encourage everyone to jump in on the MJ stocks or even the energy leaders, but some traders here are very active and are looking for trade set ups and sectors that show positive signs. That is what we seem to be seeing here and Fridays action in many of those stocks certainly caught my attention.
Some of these companies are near recent lows, so it may offer a nice BUY & HOLD entry, just to invest in this sector and see what it does over time, rather than just trade in and out ( That is a personal choice). These seem to be BOTTOMING, and that could be a bottoming process, so I recommend keeping position size a bit small and reasonable as this plays out. This sector has had some POP & DROP moments in the past.
Enjoy your Monday trading.
~ALEX
Weekend June 17 
 June 20 – Market Snapshot
Scroll to top

Good morning friends.
Alex…. thank-you very much for both reports, I’m thinking about your long NAT.GAS!!!
I see the bottom to go long around 2.50. But I know you know better than me!
The question was….. where do we place the comments on this report, or the weekend report?
See you later.
Good Morning Geurt
Hi Geurt,
I will be on this page for comments.
As for NATGAS- I would not disagree with $2.50 . An A-B-C type drop if it breaks down could take NATGAS there.
CNBX did run right to the 200sma. Might even break out with this strong volume
Refresh
https://uploads.disquscdn.com/images/b097d62a89d51ccdecae9edae476cfff848b87c21ec1d118f5d61bcdd2c70862.jpg
I am in with a small position as I did very well with this last Feb…..but of course, as soon as I got filled at $1.20, it promptly dropped!
I do like the set up at this point. It may bounce around a bot, but that is really strong volume for the first 1 hr of trading. I wanted to buy it myself.
I did take a position in OWCP – just to see if we get any follow through over the next few days. It says that I got filled at $0.6777777777 🙂
CBDS & AMMJ are a couple of Herb stocks that have more than just a 1 day reaction.
CVSI is a warning about position size.
We want a giraffe neck again!
Yes Please!
Hi Alex,
Where are we with steel? Could that have been a right translated DCL on friday coming out of a YCL and today the beginning of a 2 nd new daily cycle? I’m not sure what a typical cycle for steel is. I was expecting an extended rally in commodoties if the dollar put an an ICL and should rally for a few weeks. Thanks for your insight
Hi Curtis,
I haven’t used cycles for Steel, so I am not sure about the cycle count. I still like Steel but feel that it is in a bottoming process. The recent drop was ugly technically though. I’ll mention it in the next report.
CNBX @ $1.24 could rest a while there as its at the top BB line? Or not? Stay tuned.
Alex, you watching GDX right now vs $gold??? on the 15min?
Not on that time frame, but I’m wondering if we are going to get a dcl here ( And Miners amy be signaling it first).
That still leads to 2 scenarios mentioned in reports.
An ICL occurred in May with the SILVER ICL looking drop, and this is a higher low?
Or
We dcl here, bounce into a weak final daily cycle, and roll over into an ICL where GOLD FINALLY drops like an ICL should.
What are you seeing?
GDX is finally leading gold. I like your scenarios. I could be very wrong here, but I am feeling we either get one more quick drop and then off to the races, or we just meander higher from here and then a rocket shot. After all my years watching metals I feel we are close here.
For the past 5 weeks GDXJ is leading GDX as well.
Alex, Just curious, in the past you pointed out that GDX IC’s run every 4-5 months??? I dont want to put words in your mouth, so please correct me if I’m wrong here, Bro. But May would be 5 months, and July would be 7 months (starting from mid Dec ’16, where the last ICL was)???? Wouldn’t 7 months be too long?? Don’t pull any punches. Lemme have it. 🙂
I think in the weekend report I said that they usually run 6 months “give or take a month”. I’d have to go back and look, but there are also those very rare occasions that an intermediate CYCLE can be stretched or shortened.
It used to seem that it was ROUGHLY Dec, June, DEC , JULY, NOV, May, etc etc
Cool. Thx
I looked in the weekend report, it wasn’t there that I said it 🙂
maybe another one last week? Time flies !
man… ru sure CYTR is dead to u..? it’s being nice to mommy… ;o) SHHHH
I scalped today. 10k shares at 61 out 64… that thing scares me… but got some gas money
looking at gold/silver COT it seems the ICL was in may.
Biotechs very strong… IBB , XBI
Hi CF What do you think of CYTR do you think it could go back to .90 + ?
Hey Jbertrand ( Sorry I didnt answer sooner, I was away from the screens again).
I do think that it can make it back up there. Today was a nice start holing that 10sma as support and breaking higher.
OVAS setting up again.
I like the action today and I really like the base.
Went short XBI. Have been waiting for 74.7X for a long time. Almost came today. Drawn gann degrees on chart and 74.7X is 360 degrees from bottom. Should be some heavy resistance for price.
https://uploads.disquscdn.com/images/e1442decb28011e5187bc625a096db61fb7903098993dec37fa4f8aa7ac8b12c.png
Think we might get it exact and perhaps small overshoot.
That is interesting.
I was looking at IBB and XBI and thinking that they were looking bullish on weekly charts.
A break today, but I have seen false break outs and gap fills in the past on daily charts, especially when it is above the B.B. . Your downside target does look deeper than I would have expected, it’ll be interesting to see it play out.
Yes, they do look bullish. Not always are these levels respected, but quite often. So entry and exits is quite important here; to get out if price doesnt respect it. But it respected well the 180 zone, so chances are high it respects around here too, but let’s see 🙂
XBI broke out of trading range today. I actually sold out of LABU on the pop. Would expect it to backtest but planning to short here, myself.
Waiting for gold to enter zone of trend-alteration. Have it due on 26th with a price of 1207 given it stops at that degree.
https://uploads.disquscdn.com/images/43156d2e071ff6eca533837f1c37571a129ea4c5d44a9b1a8856079fe3223907.png
1200-1210, a bit difficult to say.
Wow…you post some really interesting charts!
DRYS…..what an amazing downward spiral for months.
VALE ……. looking good.
Some miners like KLDX just dont seem to care what Spot is doing…
Looking for 2464 to go short the SPX https://uploads.disquscdn.com/images/0b1c650d4368a8959cfce5496e5713c8ea645c7b5a0981d670206cf542b3ea52.png
“Saudis foil Iranian Terror attack on major off shore oil field”.
“US Pilots will defend themselves if attacked by Russians”. Pentagon states.
Something will happen, not sure when but………ya gotta have some gold for these risks alone.
TQQQ is rocking today, but UPRO and UDOW are actually stronger overall. The general stock market looks good to me, despite all the “bad news bears” waiting for a crash or correction. I understand that it’s natural to expect a “top” at all time highs, but stocks are in a strong long-term bull market IMO that I believe will run for years. There WILL be drops, of course, I try to limit my damage when the market gets “toppy” but in the end I make less money trying to trade in and out of the market. For the past couple years I have told myself, “If I had just put all my money into TQQQ on the first trading day of the year and ignored the market I would be WAY up by year end.” Of course, that’s easier said than done. TQQQ is up 63% YTD and 120% over the last 12 months. It would be a great strategy … if I only had the guts to do it! 🙂
I went against you on Friday and took a starter in SQQQ. I hopped out at the bell and jumped behind you into TQQQ lol…
That’s what makes a market … you could have been right because TQQQ was still a “sell” (down trend) on my daily chart last Friday and normally I don’t like to buy a stock that it is in a daily down trend. BUT the exception to that “rule” is when TQQQ tags the 50 day SMA and that usually marks a significant bottom. Often it retests the 50 day SMA a few days later which is exactly what happened last Thursday so I went pretty much “all in” last Friday. It was a calculated risk because my stop was close by, slightly under the lows of last week. As I mentioned, the Dow and S&P are actually stronger than QQQ/TQQQ right now … but I bet on TQQQ because it had been beaten down so far there is more upside potential.
I put your thought process into my trade this morning when I saw what happened to my SQQQ position… Appreciate it when you make trade comments Steve
It might be different this time of course 🙂 https://uploads.disquscdn.com/images/55400f4c5e8218dac70533d51991374c71fec7e4e1cf013ac2e120d7628978ec.png
Look at the 1990’s … still a LONG way to go! 🙂
I think we are in a period very similar to the mid-1990’s right now. I am old enough to remember stock experts calling the market “top” continually month after month, year after year starting about 1995. Eventually they were right, but they missed out on massive gains during the late 1990’s.
Heh, yeah, the dot-com bubble. Now we can have the robotics-low-interest-rate bubble.
But you are right, trying to call the definitive tops and bottoms have yielded not much return.
However, identifying support and resistance and likely cycles should be nice to keep up with an advantage
I went in small Friday, but got out today with a small gain. I think your thesis holds also, but would like to see an ICL pullback before committing a larger amount of capital. Do you have any idea how close we are to an ICL?
SOG, URRE WTF???
NWGFF, MJ stock finally had a positive day, up 13% today!