
June 20 – Market Snapshot
On the weekend, I used this chart to point out that the NASDAQ did find support on the 10 weekly MA. This is often an area that holds as support, so would the markets move higher from here?
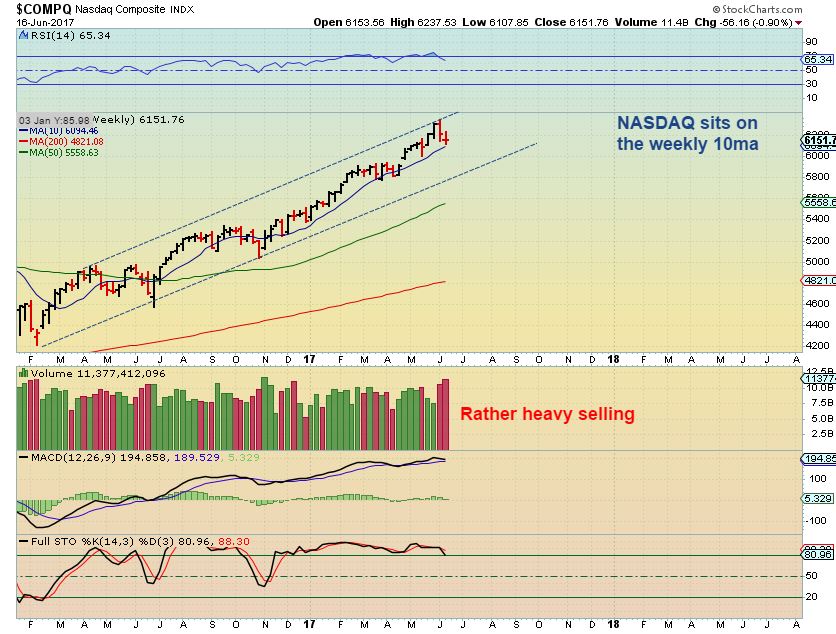
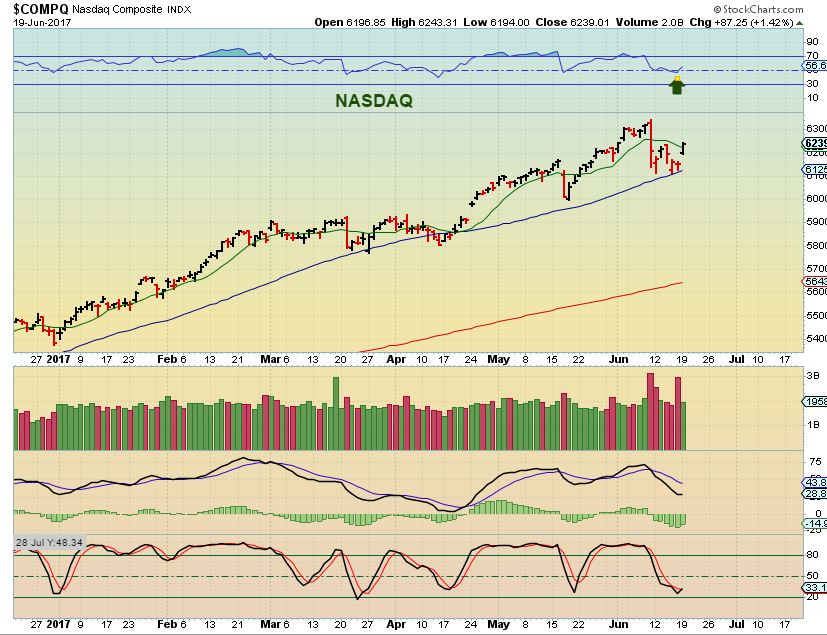
The markets did move higher, and I would use recent lows as a stop.
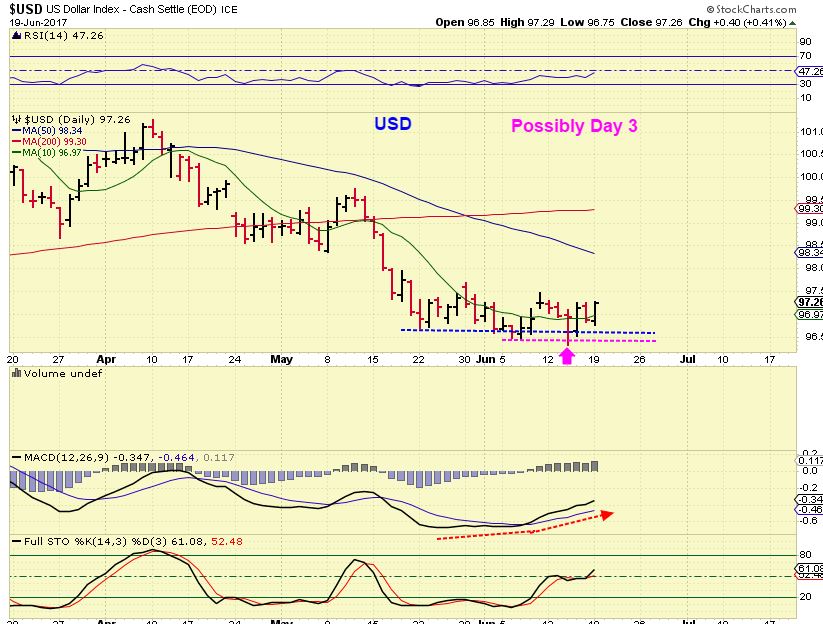
USD – The USD looks to be on day 3 of a new daily cycle
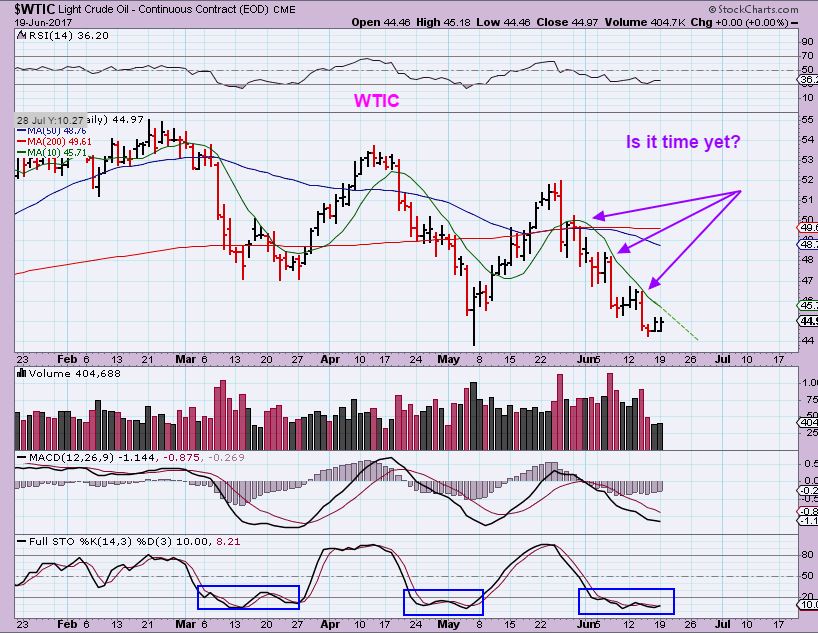
WTIC from the weekend – Oil needs to get above the 10sma, I have not been buying OIL or Energy stocks yet.
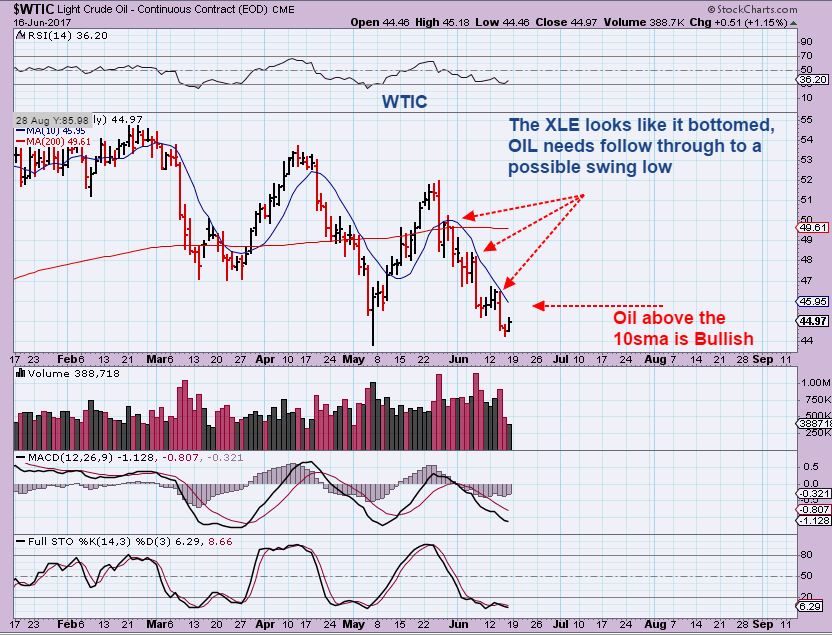
WTIC – Stockcharts charts for Oil, NATGAS, Gold & Silver were all incorrect. Oil actually dropped again on Monday. Breaking the May low would indicate that we have not seen the ICL.
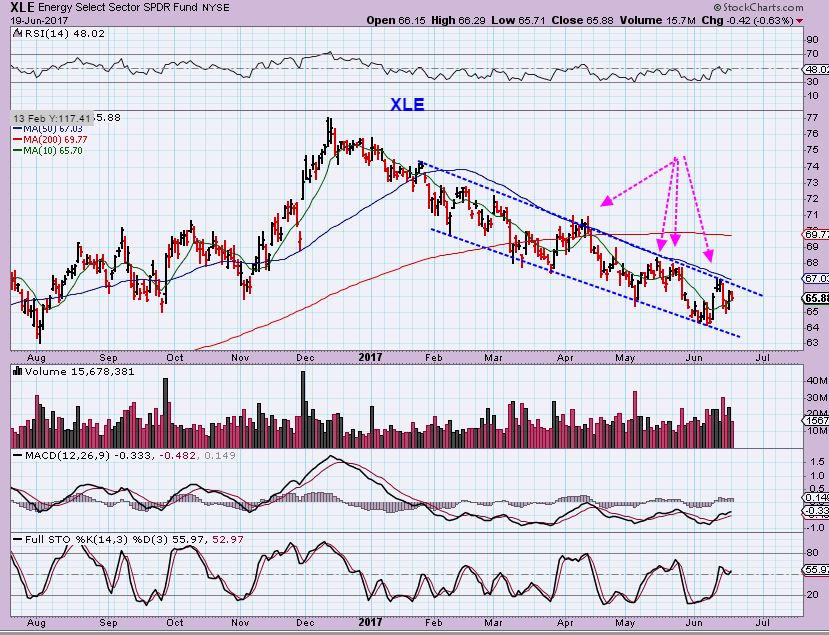
XLE – Xle has a higher low here now, but remains in a downtrend for 1/2 of a year. I haven’t been buying Oil / Energy stocks yet, but I have pointed out some bullish looking leaders. A break out above the 50sma would be the start of something more encouraging, and would possibly signal that it is safe to start buying Energy stocks..
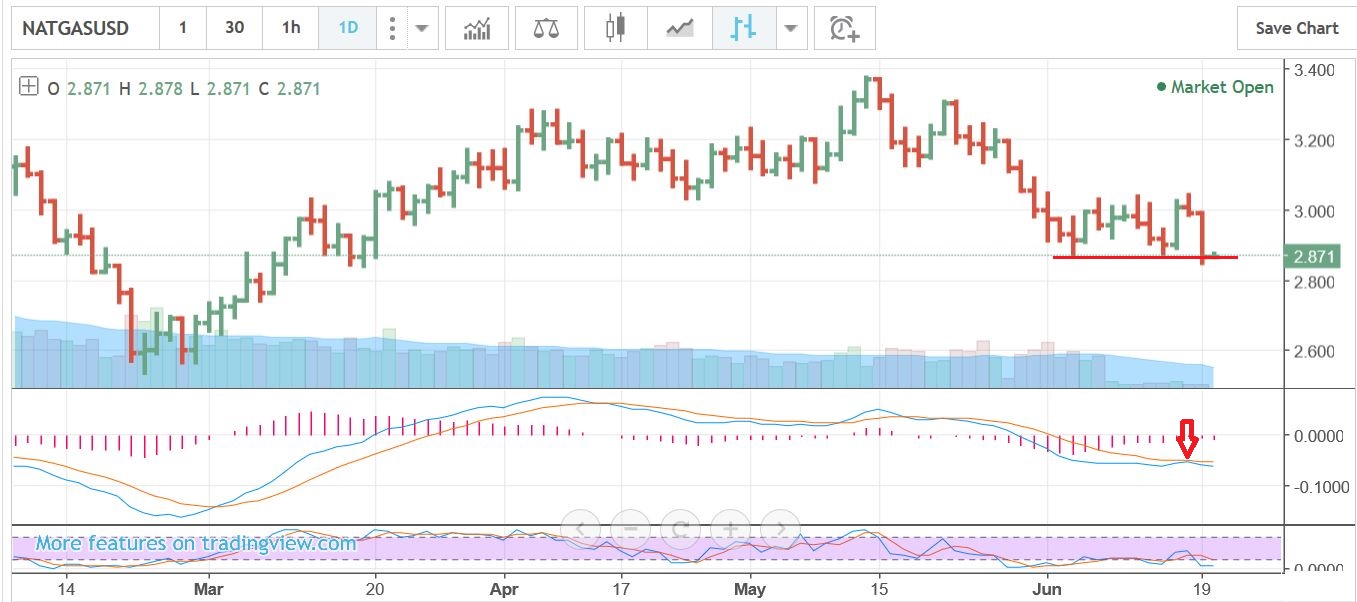
NATGAS – Stockcharts NATGAS chart was incorrect , so I grabbed this one to show that Natty made a new low. The MACD did not get a bullish cross, it tagged & dropped. I went long last week with a small starter position & got stopped out.
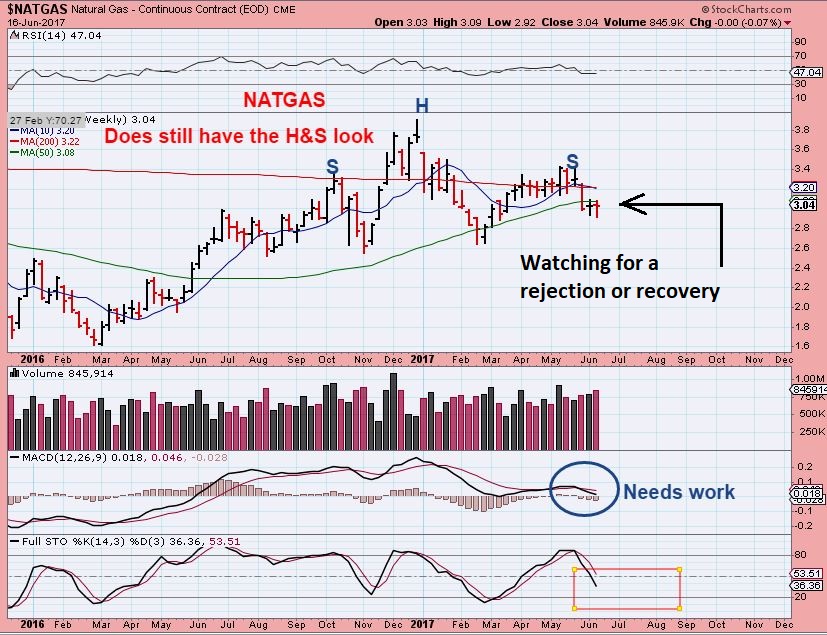
The weekly chart from the weekend report – I mentioned that I’d watch for a rejection or recovery, and so far the rejection is in tact.
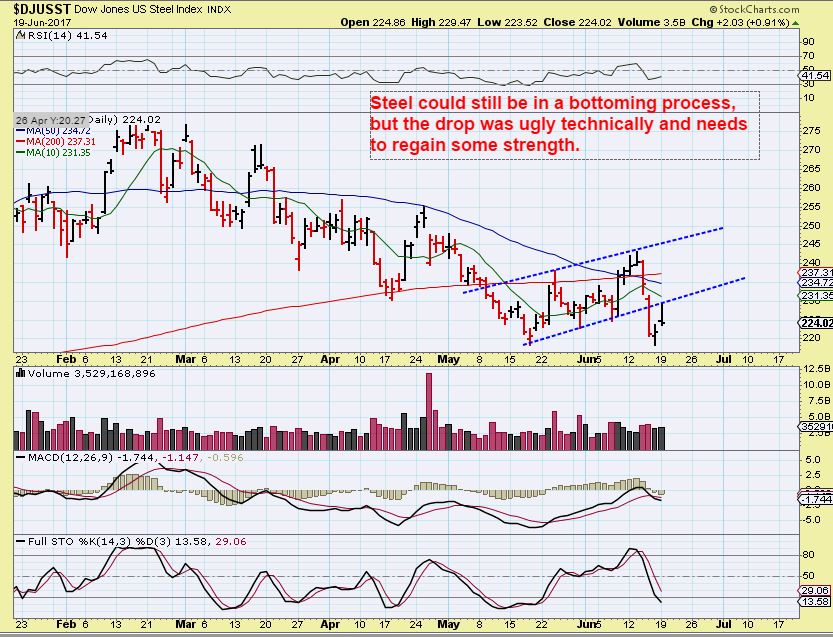
STEEL – Steel itself dropped with the Fed Wednesday, and so far it does look a bit ugly. I think that it might be bottoming, because…
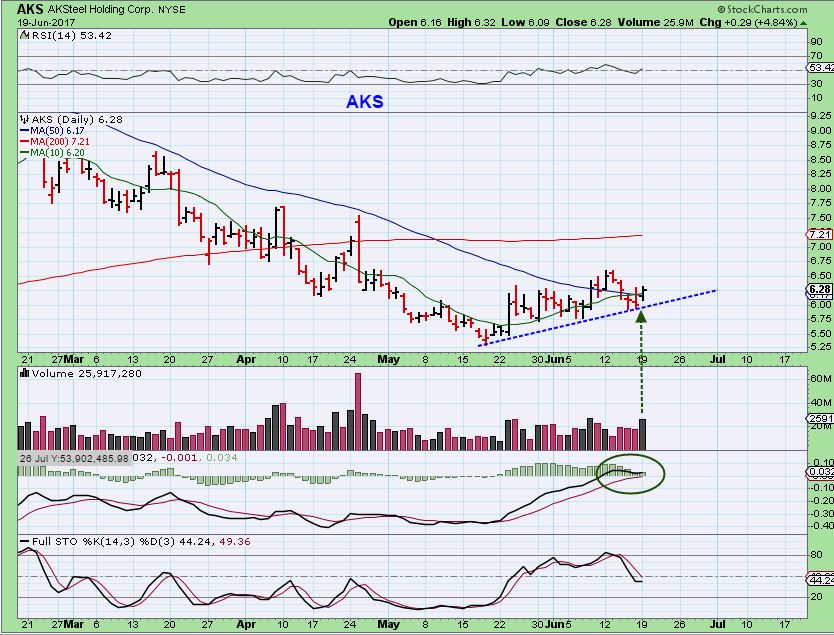
AKS – Steel stocks seem to still be holding their recent lows.
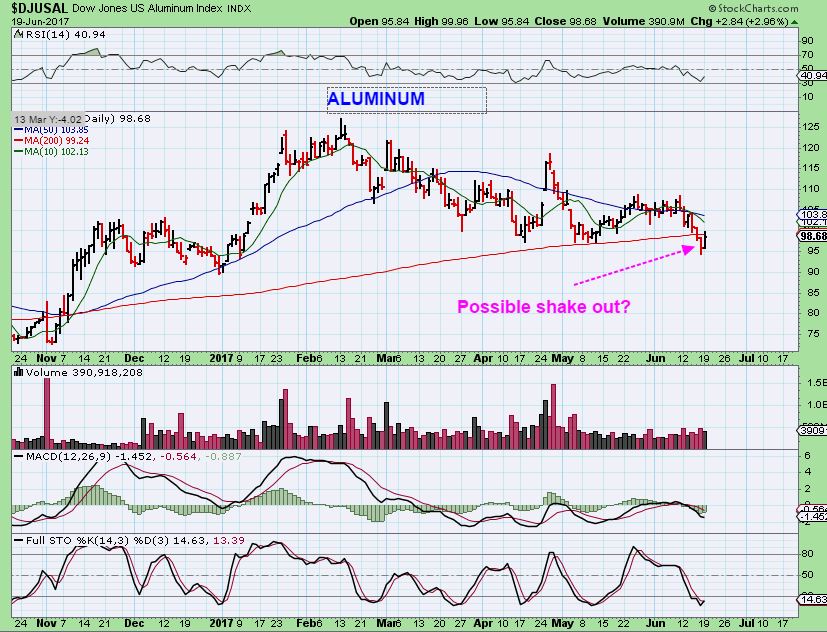
Aluminum – Aluminum also dropped last week, below the 200sma. It almost recovered yesterday, and it could be a shake out if it does recover.
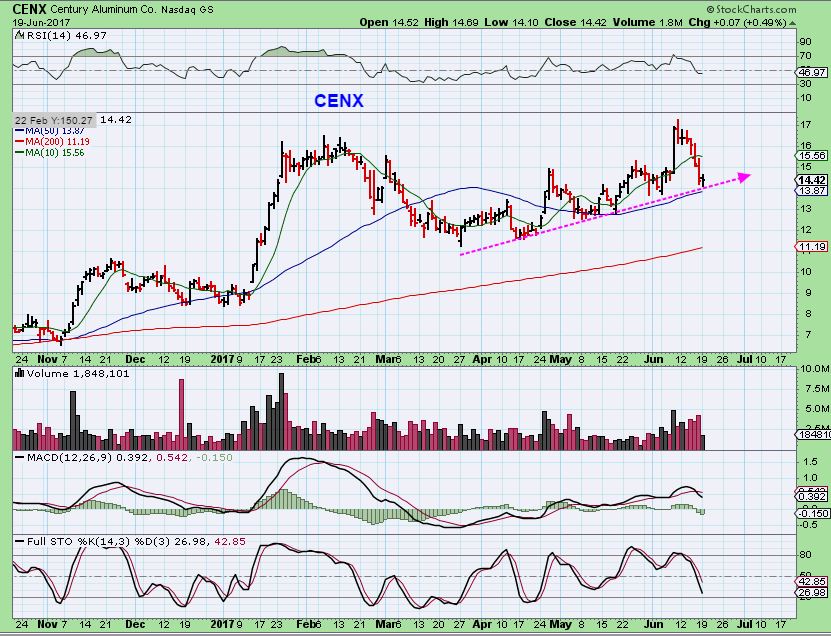
CENX – Aluminum Stocks have pulled back, but this chart of CENX remains in an uptrend.
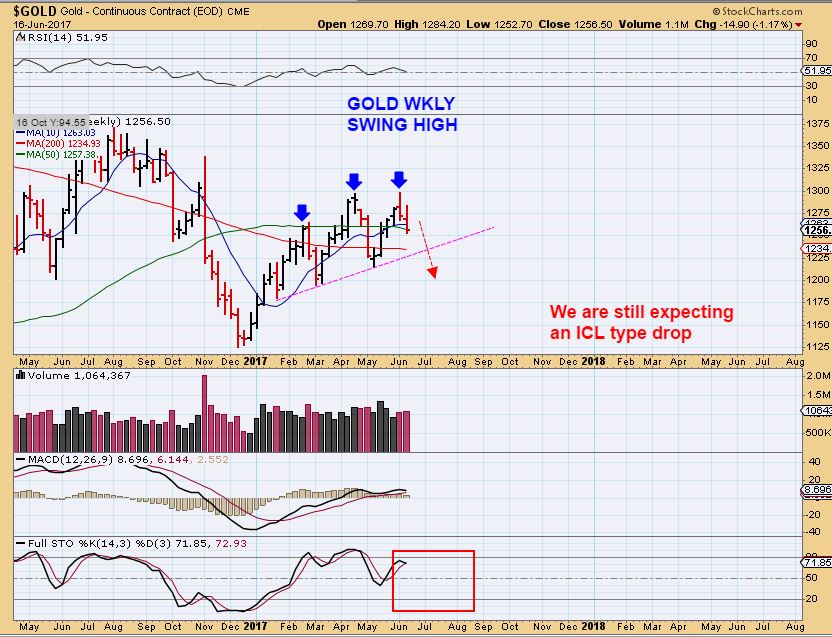
Gold Weekly from the weekend report – Gold was at $1256 and I was Looking for further selling, since we also have a weekly swing high in place.
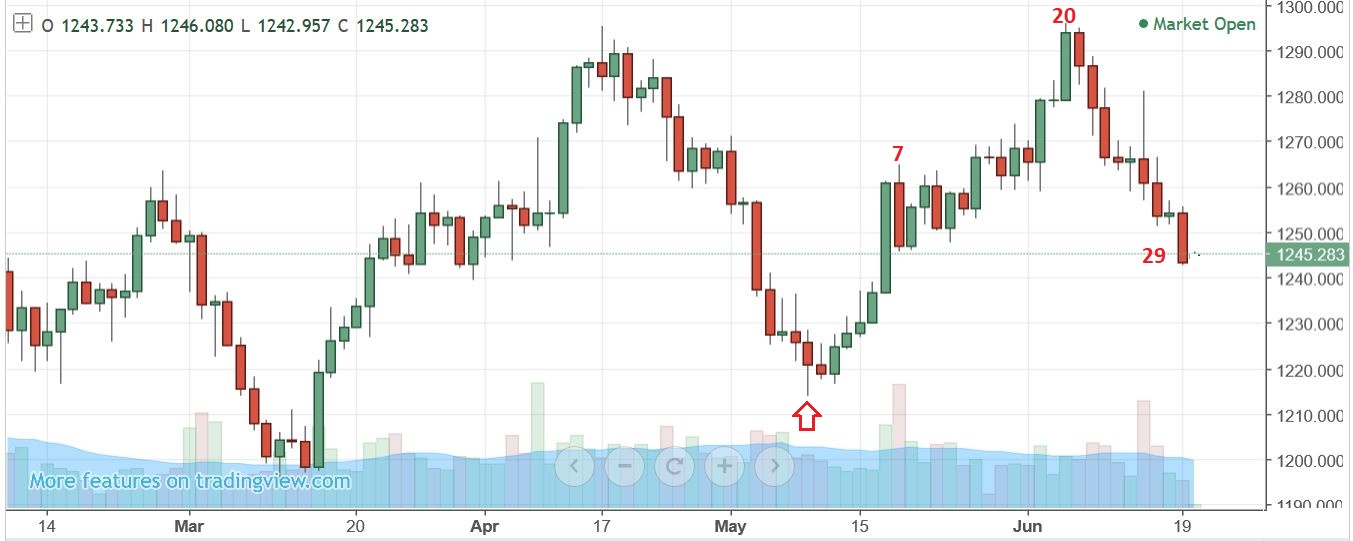
GOLD – Gold sold off on Monday, here it is at $1245. Gold is starting to look more like the drop in May now.
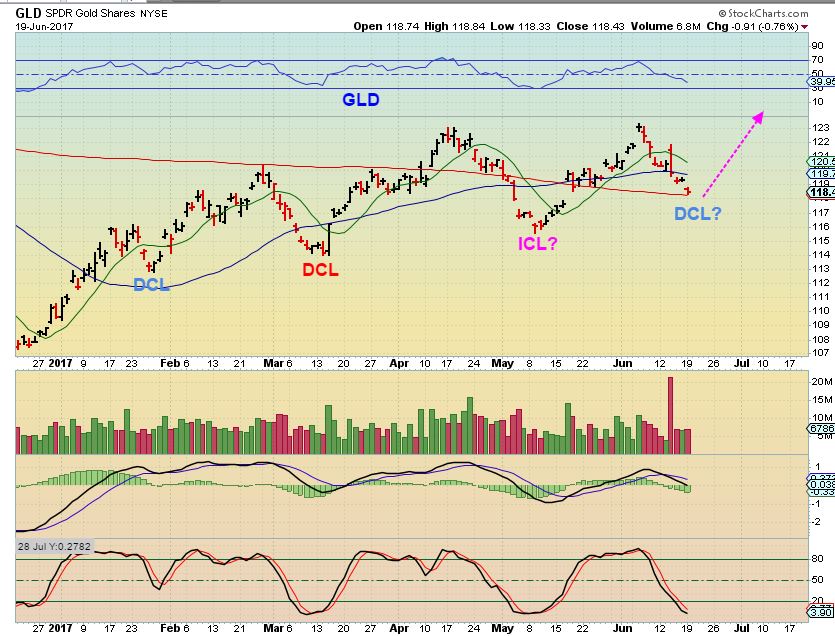
GLD – I noticed that GLD landed on the 200sma. I have been discussing various scenario possibilities for the precious metals. The big question: Is MAY the ICL, since Silver & Miners dropped so sharply then, or is the ICL ahead?
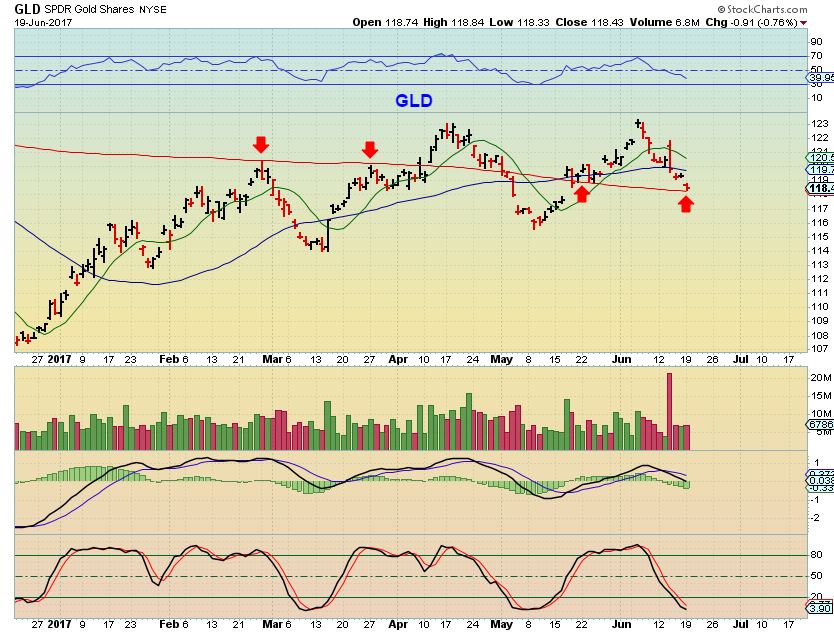
Remember these 2 scenarios pointed out recently:
A bounce here could be a dcl that rolls over into a final daily cycle ( And an ICL)
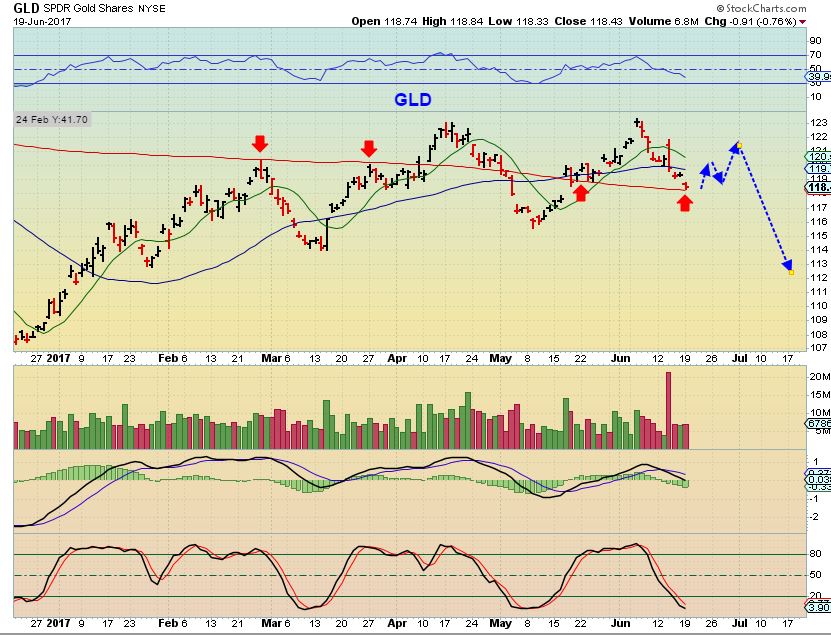
A bounce here could be the start of a 2nd daily cycle if Gold, Silver, & Miners put in an ICL in May. ( If the ICL lies ahead, a dcl would roll over and drop).
SO the question comes up
Based on Silver & Miners having this type of an ICL looking drop in May. The question in my mind is…
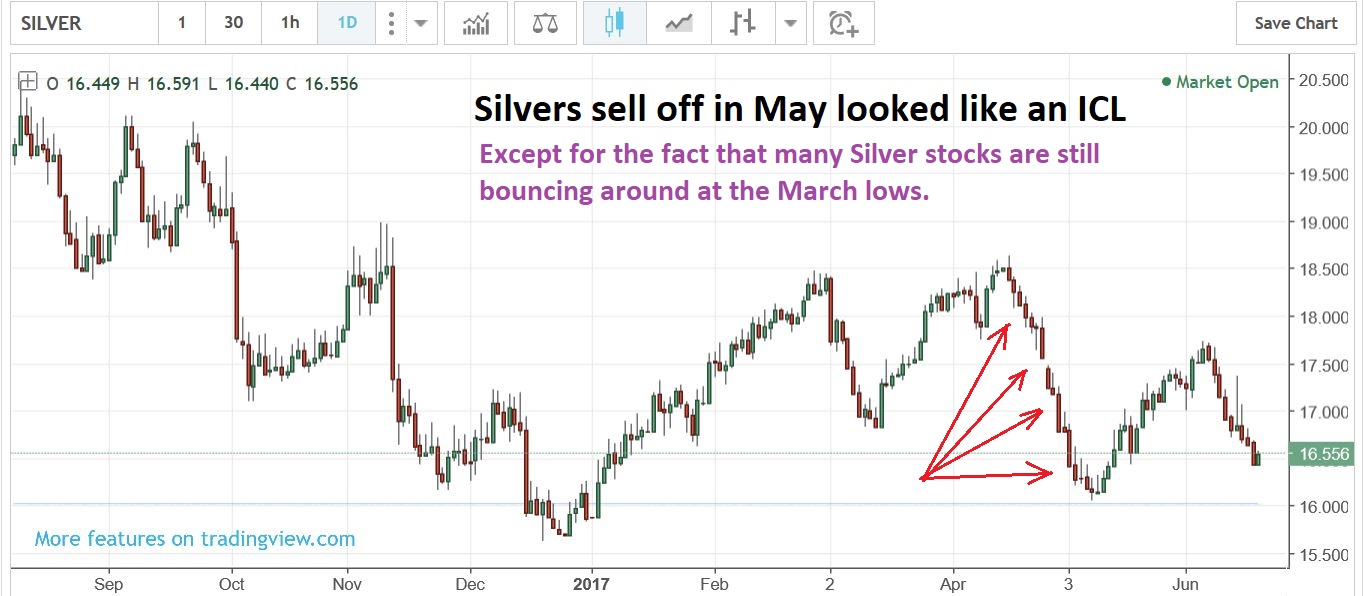
Why are so Many silver miners still at their recent lows if an ICL is in place?
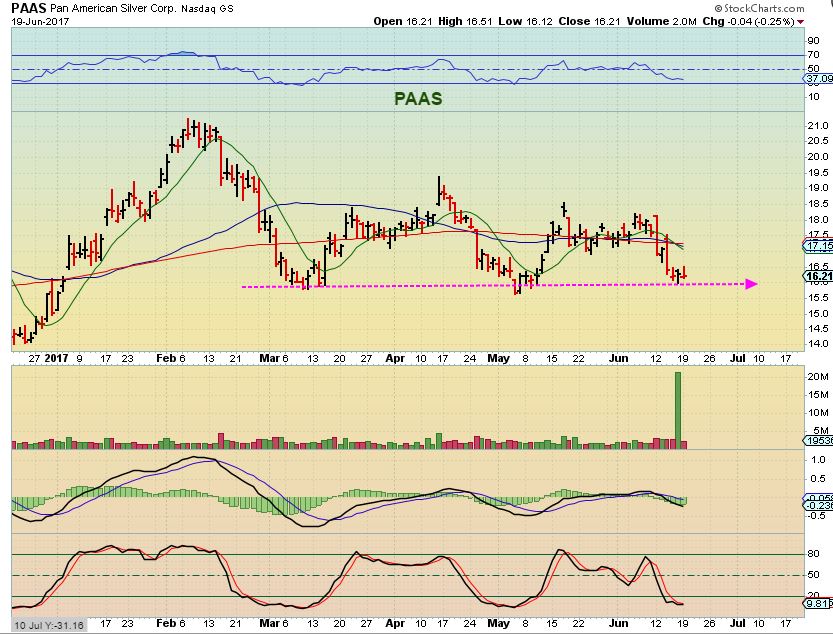
PAAS – At least if an ICL came in May, we havn’t missed the move higher. Look at the March, May, & June lows so far .
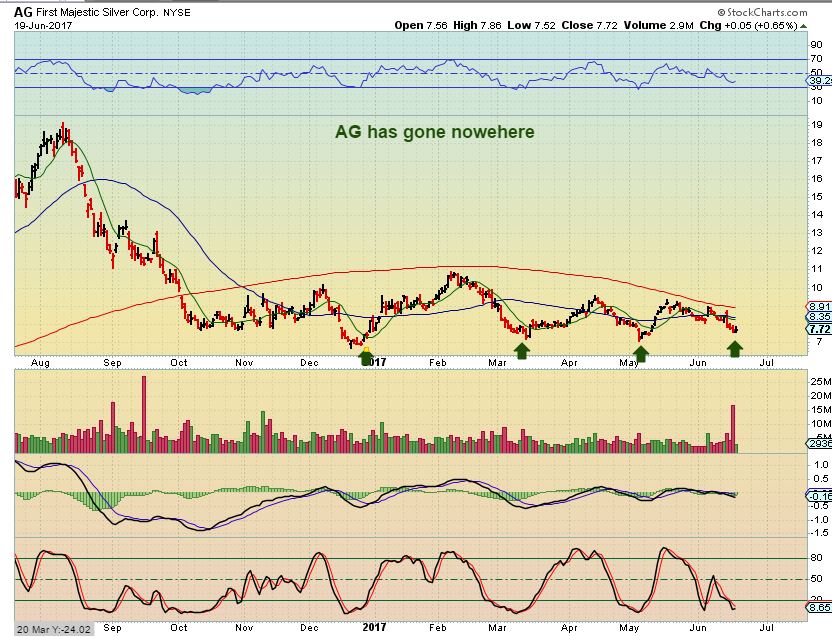
AG – You haven’t missed the strong run higher. Dec, March, May , & June lows
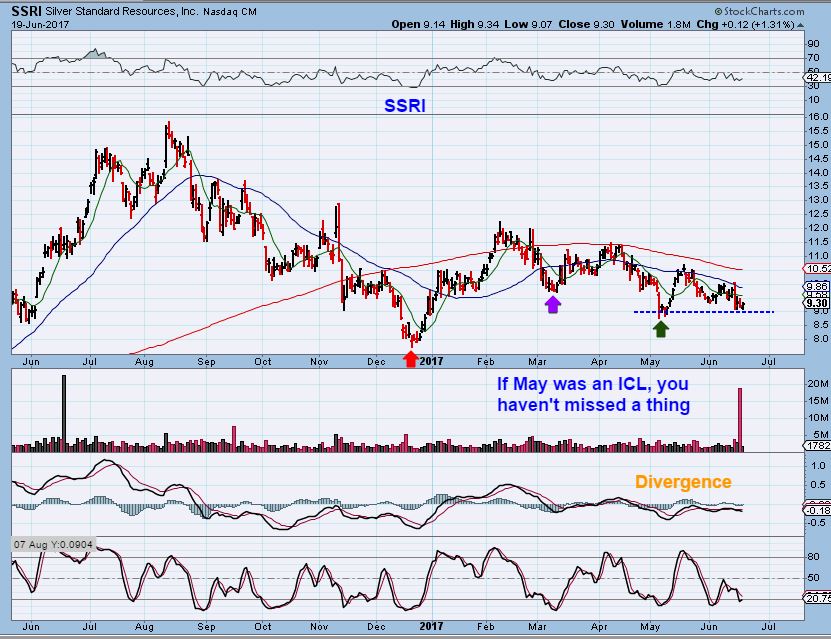
SSRI – March, May, & June lows
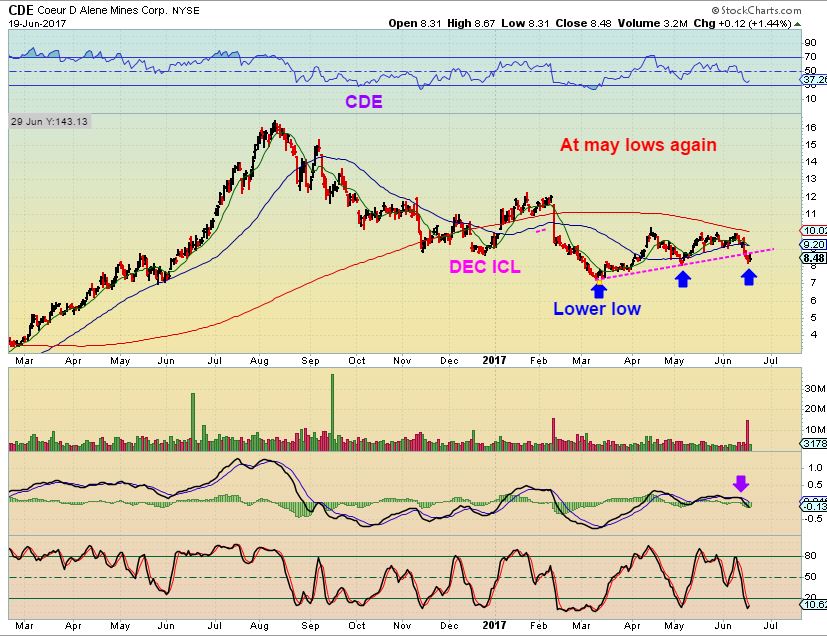
CDE – CDE broke below a possible uptrend line and is back at the May lows too.
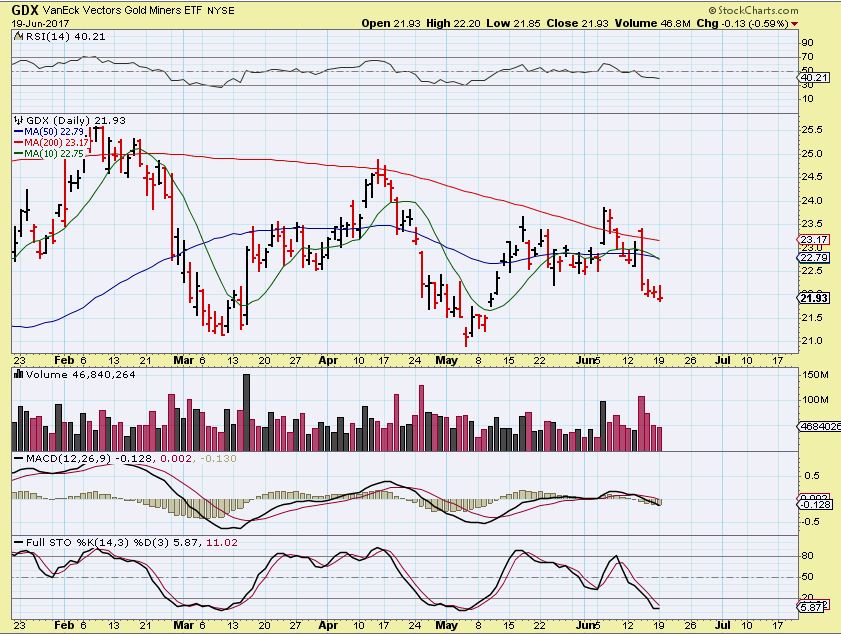
GDX – GDX sold off a bit more on Monday. It is getting late in the daily cycle count.
So whether or not an ICL occurred in May or if it lies ahead, it is obvious that many of the Miners, and especially the Silver stocks, have not been running away higher without us, like most moves out of an ICL would. They look like long consolidations that , if they do break out higher, will run in a very strong manner. We have not been left behind, we have actually been saved a little head ache by riding the miners up & back down again. Patients will pay off if we get that steep drop into an ICL ahead because these May lows could even eventually be broken. If MAY was an ICL, these could break & run in a 2nd daily cycle, and we will ride them higher. For now I continue to monitor this situation and So far there is no big change in that sector. Enjoy your Tuesday trading!
.
~ALEX
Note: It is sill a bit confusing with Miners, because some Miners do look like bullish set ups and we are at proper timing for a dcl in Precious Metals.
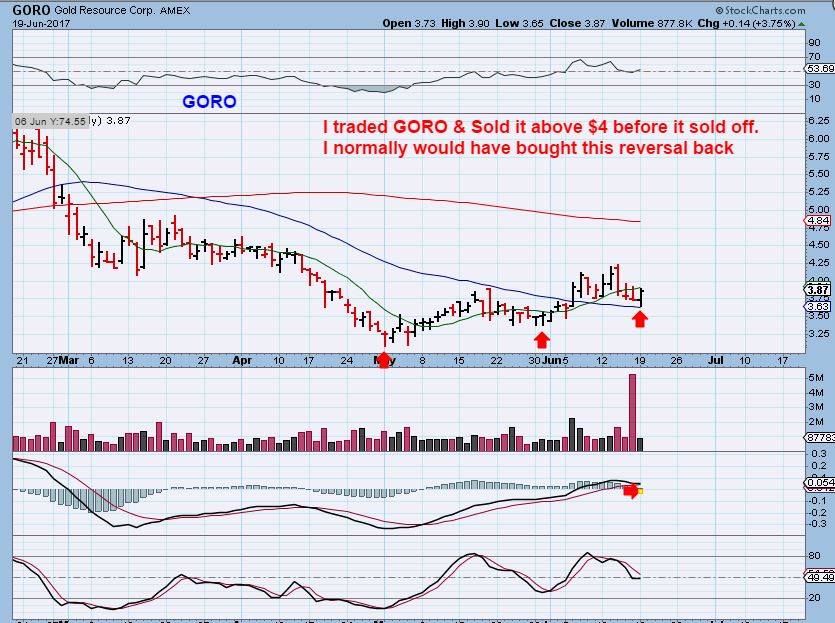
GORO – I traded this one, and it looks like a buy right here. I almost wanted to try trading it again, since this is how it acted as Gold dropped yesterday, so like I said, I am watching the situation, expecting a drop into an ICL, but aware that if MAY was an ICL, we could be looking at a dcl and the start fo a 2nd daily cycle. It is tricky with most Miners NOT looking like May was an ICL.
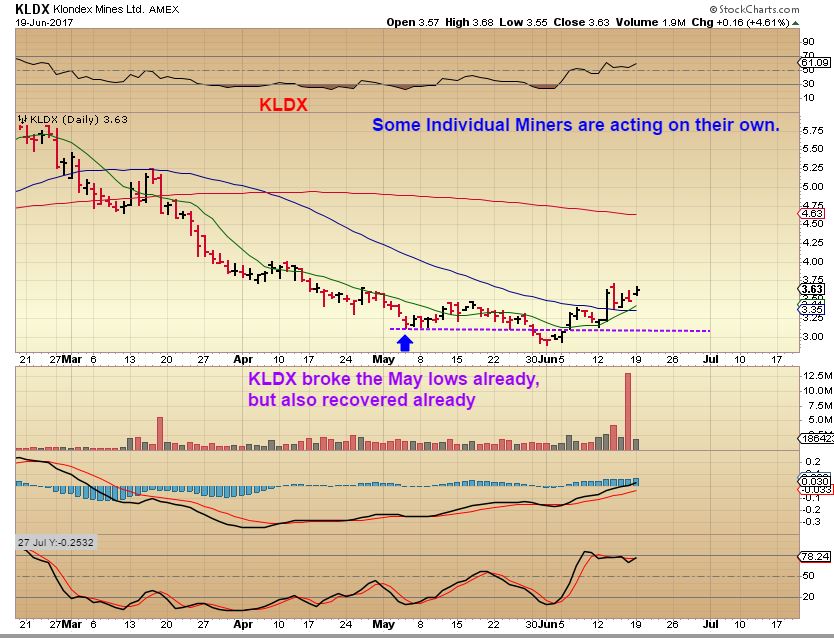
KLDX – To confuse things even more, we have some Miners that broke the May lows, and already recovered. With Gold selling off on Monday, this is how a few miners look. They look like they are leading the way higher. Even if Gold just did a nose dive into an ICL, doesn’t this look like it would drop to the 50sma and put in a higher low? SO we continue to monitor things.
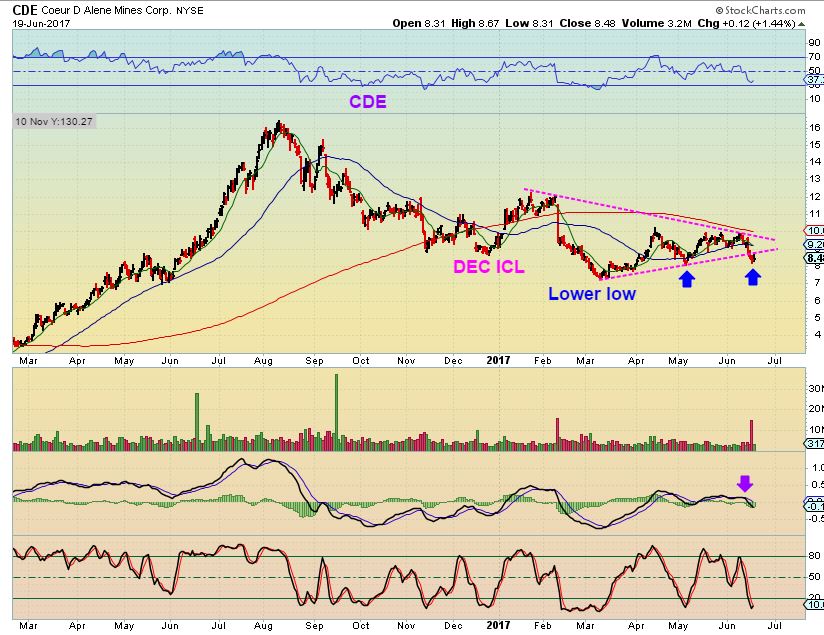
CDE – I did want to point out the possible bullish set up on CDE. I like the triangle patten if this break down recovers, so I will be watching this. The lower line was broken, but it could act as a shake out if this is a DCL and the start of a second daily cycle (with a Silver ICL in May). The May lows were not broken yet. These Miners really need to break back above the 200sma and curl it back up to start a bullish move higher, so a break out higher would be nice.


Alex, sounds like you changed your thinking. Previously you were pretty sure we were on a 4th DC into an ICL, now it sounds like you are leaning towards a 2nd DC. Am I reading you right?
Hi bill,
No, you must have missed it in a few reports. This is the thinking that I have entertained for a while now. IT is difficult to lean strongly one way or the other. I even wrote a long report ( or several long reports) showing the contradiction that exists in both scenarios. I do think that an ICL should be ahead for many reasons, but…
I have mentioned circumstances of contradiction such as :
– If May was an ICL, why is the rally of what would be a first daily cycle so lame with Miners, some breaking May lows.
-If May isn’t an ICL, I mentioned the thought “Why did we just get what looks to be a Right .translated daily cycle just now? ” The move out of a 4th daily cycle is seldom strong, it usually rolls over by day 8.
The 2 things do not add up , and there is more that contradicts both scenarios, so we wait and watch,
I didn’t miss anything. A month ago you were pretty sure we were on a 4th DC. You weren’t buying the May low as an ICL. I remember you and Ken at odds on that. Now it seems like you’re leaning more towards a May ICL. I realize you haven’t come out and said, “its an ICL”, you have been posting comments saying it could go either way. I get it, I know this is a tough call right now.
I’m not leaning more towards a May ICL.
That is the point, there are contradictions in both cases, so it has to resolve itself. I am not short or long due to that.
Just a possibility, he’s keeping everything possible on the table. Bc with this action? Who Knows!!! Just like you were saying last week it just doesn’t all add up at all!!
https://uploads.disquscdn.com/images/282d5903ed2a09b852b75515ce14a79113485be9360744ce8957fa1087f5c48b.gif
We were just talking about OVAS recently and how some of the Biotech / Pharma look good ( Nice break out of XBI, IBB, LABU). I’ve been eyeing VSTM & CGIX again, along with OVAS.
So one of our readers ( Thanks Chuck) just emailed and Mentioned that he is watching INFI too. It had a nice pop out of a base yesterday.
Volume on LABU not strong.
Yes, It is so far.
!/2 Million in the first 30 minutes is strong for Labu
ANYONE KNOW WHATEVER HAPPENED TO PLGTF? IT was a Miner that I followed.
and while we’re on the subject of #stuffthatdisappeared.. where did CWEI go?
That one got bought out, but I can’t remember by whom
DRYS again Reverse Splits……..unbeleivable.
Just trying to stay afloat 🙂
https://uploads.disquscdn.com/images/d564a60239eab1cc4b499e4632f2f34d33ca09e7760caaa00cd0583da6444844.png
Hey Maria, Hows work?
work? you mean as in this trek I’m making down to those two chairs? ;o)
Greetings from Lake Placid … round 3 🙂
https://uploads.disquscdn.com/images/d917cbc29df3b854074f01cf86f094b63d3b400a5bef1f7958278384c334430e.jpg
sorry .. i have no idea why it flipped itself sideways when I uploaded it… turn ur head.. lol
That looks really relaxing- The lake looks really placid 🙂
I dont see 2 chairs, but there must be a boat dock down where all those canoes are tied up. I’ll take a guess and say that the 2 chairs are on the dock? 😉
Test- test – I guess You really are a multi-tasker – reading your tablet in the left hand, and taking a pic with the other.
https://uploads.disquscdn.com/images/a2c478b0e227c3d26dda876552e323a0e2d9e7cbda0913f12037da54df9791ff.jpg
i have all 3 years shots .. somewhere
It looks like a nice place for a work conference, thats for sure.
Much better, my neck was hurting
Meow
oops sorry i uploaded wrong pic .. ha ha ha .. the sun is so blinding… i cant see 😉
ooooooooooooo…poor you! Really, rub in what a great sunny place you are in! [just teasing…have fun! Apparently, you are good at that.]
😀 it’s entirely possible that I mayyyy have overindulged in the drink last night… but it indeed was a great opening night of the conference….
That’s your work locale!? Lucky you!
no .. im at a conference… that pic is from my hotel balcony… 😉 I have taken a shot like that … w/ my coffee and reading chartfreak report out there .. every year ….:)
You were over-served? Oh my!
Dang VSLR
Good follow through so far on XBI, IBB, and LABU. The volume seems strong ( ANd INFI, PRAN, etc)
Kicking myself on NK….
I feel your pain, been there and done that.
Refresh- The volume in XBI & IBB looks like it is going to be a surge of follow through to the break out
https://uploads.disquscdn.com/images/dcc3b771708635a77f648933f87244af1107aad361cba744b63b367a9dad3b30.jpg
Dang, sold too early. But I front-ran the breakout nicely! 🙂
OIL, three drive pattern complete this morning at $43. I’ll be looking for a buy soon, low risk stop. Near your $42 prediction CF.
I do think Oil is trying to find a low. Some of the energy stocks seem to be indicating that too.
I’m going to wait for a swing low though.
https://www.tradingview.com/x/e6ZtqOJs/
3 drive pattern……
When are you buying? And what vehicle will you use?
ERX double bottom. 24.46 has to hold or I’m out. FFYI, bought
Makes sense, low risk.
I might be entering UWT in the future, but I don’t want to jump in too early, so I’m waiting for the swing low in Oil.
Bill, you’ve been pretty spot on with oil recently. Looking at getting long here as well.
Oil stocks are going down heavily.
Yes, some are getting hit rather good.
AREX just broke that 50sma support that had been holing it up.
Shake out or break down? Time will tell.
Final panic selling……IMHO
if Oil goes down under 40, what is going to happen? Thank god, I’m not in any oil stocks.
The refinery trade is holding up well, despite the panic. REGI, PARR are OK
DK and MPC are having a bit of a tougher go but the selling has slowed or stopped.
Yeah, all of those that you mentioned all have really good 1 year charts – especially considering the sector they are in
NAK…another negative article on Seeking Alpha by someone admitting he is going short.
Still above the 200sma so far
OVAS – Nice follow through
INFI looks pretty good too
PETX & BCRX – I like the charts.
The sector seems to be benefiting from rotation.
Gold (GLD) and GDX have broken their triangles this morning…….overthrow (stops) or a continuation ?
Interesting times to say the least……
Yeah but I thought if miners were gonna washout they would have done it by now. Really weird to get that big Fed day down and then just kinda sit here with a low volatility do nothing this long. Def not what I expected.
NAVB – https://finance.yahoo.com/news/navidea-enters-exclusive-license-distribution-143700988.html
Interesting Channel ……. STLD https://uploads.disquscdn.com/images/6b4afe97956e556eb42e03a519769e9edc0143ea0d4ce8c7300e51a151fb4fe6.png
Ken, I’ve been watching this one for a while. Perhaps a low risk buy at the tag of the lower bull flag channel.
https://www.tradingview.com/chart/STLD/rGc5q3gQ-STLD-set-to-run/
Or…….maybe soon with a stop below channel, it is oversold technically. 🙂
Of course, but I don’t think its a rush to buy. I’ll look to buy at 31.40-30.80 area.
That would be too late for me …… that would mean a break below channel, I will be playing it where it will stay inside……
Good luck, your channel formation is a little different than mine. More accurate perhaps.
ARRy popping up…
VALE ……..
Ouch.
WRN is crazy. Pops and looks good one day, break down and shake out soon after.
CF, any comment on CNBX? Stop suggestion?
Well, it hit that 200sma like I mentioned as a target, and then dropped. Now I wouldn’t want to see it close below the 10sma in this bottoming period.
Thanks
Uranium (URA) lower low……broke the double bottom.
Jo too – All time lows.
Commodities not loving a stronger dollar or something.
Just saw that….agree.
The stocks still seem ok.
CENX just tagged and reversed higher off of the 50sma, KS, X, CLF hanging on above recent lows.
Just a messy bunch of volatile set ups lately.
Yep….I am mostly flat. I am long IPI though.
Looking to maybe get some Steel…. VALE, STLD, MTL all possibilities.
Oh yeah, and NAK on the 200sma (Again). Really want that one to get moving.
NAK is a long term hold for me (not really trading it)….I will add when the Metals start their uptrend though. 😉
Any targets for WKHS?
got a bundle of overhead ma resistance at around 4.60+
weekly 65ema & 150ema gave strong pullbacks in the past
Yes, NAK making me sad recently. But really trying to be patient as it is still holding support for now.
I just keep reading everywhere about low inflation and how it is lower now than anticipated but the Fed remains in target with rate hikes. Maybe some of this fundamental change in inflation and forward expectations are now creeping into the commodities charts. Check out $CRB lately. :O Ugly!
So did you just get up?
Yep! Just after 6AM local, 2 PM Eastern. First thiby I did was read CF report from bed! (and check my watchlist!)
Well that’s life over here. I usually make to the computer by 5 a.m. I did try for awhile to make at at the open, but ended up just too tired all the time. I’m actually somewhat worried about what it will be like on the east coast since I’ll probably still be getting up early. I guess I’ll try to learn to sleep in lol.
You’ll adapt in a couple of weeks! Can get up with plenty of time for coffee and a relaxing look at pre-market then if it’s slow have time for gym, news, hobbies, etc!
Oops, would have been about noon, not 2PM.
Yea got stopped out of quite a few plays… URA, BOIL (this one hurt bad) etc… Some have been great like NK – Just wishing I didnt sell at the 200 SMA now lol
cannot believe HMY can go this low, $1.60. same thing for PPP, PLG. my goodness
Alex, do you have any idea what day we’re on with SPY? Is the ICL ahead, etc?
I have the same question. right now QQQ is down big
? – I’m not posting this to contradict you, I’m just posting this to help us see things in relative terms.
I’m not seeing it down big, especially compared to what it did yesterday. I see it down a bit, relative to yesterdays surge. See the chart
refresh
https://uploads.disquscdn.com/images/d9e90f06276487dc34a368a718e97b7e7b8da5a7a645ae5b29cad07e7f0c259e.jpg
for me , down 0.1% for QQQ is big already 🙂 In this market, shouldn’t QQQ be up all the time. 🙂
Yes, everyday – It HAS spoiled us 🙂
Looks like day 23
There is an ICL ahad, but I imagine that you remember me showing the NASDAQ BLOW OFF TOP in the year 1999-2000. ICLs were smothered by overly bullish conditions.
SO I remain aware of the possibility of a larger drop, the buy the dip momentum can mute it in a blow off situation.
Thanks! So when was the last ICL?
I just noticed that Likesmoney says we’re on week 33 and overdue for an ICL. So if we get a good correction, that would be the time to load the boat.
Hey Alex, what do you think of the chart on CNAB? Have only been able to keep up with reading on some days so hopefully you haven’t covered it (I think we’ve all been ignoring mj’s a bit…..at least I have….)….Thanks in advance!
CF featured them yesterday I think…I bought CNBX…but , as usual, it dropped right after and is red today with all my MJs as well as most everything I own. Not a fun day. Hope all is ok with you again.
I just posted that at the exact same time : )
I dont know if you saw it, but yesterdays report was on the MJ sector.
CNAB looks good. Many have popped and look to be consolidating or possibly preparing for another move higher.
No, I didn’t get to read yesterdays – I’ll go back and do that, thanks! 🙂
Man, my MJ stocks got smoked today. Easy come, easy go with these guys, eh? That’s why I won’t chase any of these guy. And don’t really trade in/out either.
Sold out of my last 2/3 of SCO this morning on the renewed oil slide. Kinda starting to get ridiculous so taking profits before tomorrow’s oil inventory report. (Could that spark a reversal?)
XBI didnt respect resistance in a comfortable enough way and overshot it by about 1.5 dollar. That can lead to further bullishness in price with a likely target of 81- https://uploads.disquscdn.com/images/8c6d7dacfb2415b6da961d89200e04d860e186bfd9d7b78b15f39fe7c4792487.png 82.
I really dig your charts Nord. Def something different
Nice Nord. Please keep posting. Love the charts.
Keeping the position though and adding instead if price goes to 82. The area from 75 to 82 is strong resistance.
Hey Nord –
So when you say “Keeping the position”….It sounds like you saying you’re staying short from yesterday and adding as it moves higher?
So you started small and will add to shorts going higher? Thanks
Hi, that is correct. I have only small entry from yesterday. I will add if we hit 80 – 82. XBI is quite overbought. And to me, the whole structure is a giant bearflag/corrective pattern.
Always being careful with opening positions in countertrend-trades 🙂
Yes, I was going to say – similar to what you said about price moving from zone to zone, I agree. At times, however, former resistance becomes support, like a back test of the break out. SO yoou could scalp some gains on a short back to the break out, but then may want to see if it breaks back inside, o reverses there.
Not sure if that makes sense, basically saying that short here could pay off on a back test, after that it is tricky if the break out is real and that resistance becomes support.
sidenote: I just looked and XBI is actually giving up quite a bit of todays gains. Back test already??
Well, it could become support in its chase to price of 82. However, as mentioned, this is a very strong resistance zone, and my overall view on XBI is that it is approaching a top. So in my head, the risk I am running is that it would just continue up to 82 as I view as a final intermediate top. There i would short again with the perception that price would at least go below this level again. If price however, continues and closes above 82, lets say, 84, I would take my loss on the starter position and also the loss on the position entered at 82. But it is a perception of likelihood I guess. I wouldnt do this strategy on random levels, only most significant ones; 180 / 360 levels should be quite tough for price under normal conditions to just penetrate and close above on first try.
Another example, this with the ETF EWZ. Red top line imposes heavy resistance. https://uploads.disquscdn.com/images/1a2fcb6c6b46ec1384b5b5be2a08d16a2249a8d58c94a3fdb931d96ca3e64ee6.png
I have maybe a strange way of thinking about price. I think of it as moving from zone to zone, like electrons move from layer to layer. Sometimes we get an overshoot, even on significant resistances. Other times, the exactness of the base is a bit hard to set. Using a base of 45 instead of 44.17 (exact 2016 bottom price), it gives a better fit at current levels. Hence the resistance price becomes 75,8 instead of 74.76 using 44.17.
https://uploads.disquscdn.com/images/195cbe81bb8246300540e9f666e2679e92c6a3d95601c7aa700a46677e071638.png
Overthrow & a gap at the bottom where it broke out.
AMD firing on all pistons – Lets goooo
AMD looks as it has a nice run!
Hammer on the XLE
Food for thought: I’m throwing this out for consideration, you don’t have to agree with me. I used to be a hardcore “silver stacker” back in 2011 with 8,000 ounces of physical silver, so I was a BIG believer in PM’s. I have changed my mind over the past few years and back in October 2013 I sold almost all of my silver (kept 1,000 ounces just because) between $21.50 to $21.92 per ounce. Since then silver has come nowhere close to breaking $20 per ounce. I believe the long-term secular PM bull market has been over since 2013 and I think PM’s will likely trade in a relatively narrow range for 10-20 years like they did from 1980 to 2000. As Alex has said, you can still make money in a bear market by buying heavy at an ICL and selling near the top of the daily cycles, but that does not mean the “good old days” of a long-term bull market for PM’s is back. I think the first half of 2016 “tricked” PM traders into believing “The Bull is Back!” … but look what has happened since then. Miners have been in a long term down trend since late 2016. Yes there was a nice pop at the beginning of this year and I rode that in JNUG … but I just want to mention that traders should consider that PM’s may NOT be in a long term bull market and PM trades should be considered short term until the long term trend changes. IMO the general stock market will outperform PM’s for the next few years, other than the occasional short-term PM pops. I know that goes against what many traders here believe but I am posting this to offer “alternative facts” for you to consider. Good trading to all!
Thanks for your thoughts Steve…..
IMO I think one needs to hedge (5-10%) with Metals just for geopolitical reasons.
I have now even started to invest (lightly) in crypto currencies……
Have to agree with you Steve.
Funny thing Steve- ( You wrote a big story here) I also wrote a report on this subject as a valid possibility last spring and never posted it . I wrote that it is possible, and even my charts freaked me out. It was kind of a deflationary scenario .
Here is a chart to add to your thesis – though I am not saying that I believe this to be the case. When I wrote the report, I wasn’t seeing inflation and started to research different things and came up with a similar conclusion. It is a possibilty based on the research that I did when I wrote that report.
refresh – This chart I just drew up now to match your story.
https://uploads.disquscdn.com/images/f420ad46a89d83a0a0621ad7626fd260492dca63a522323a9133f47c04705a5e.jpg
The only other thing that I would offer is the theory of “peak gold”. There are some supply/demand dynamics to it as well just like with oil. There is only so much gold and silver that can be mined. 1) The price to mine it will continue to increase as the metals become more difficult to get out of the earth. Anything that was easy to mine has been found and is already being excavated. 2) the punishing 2013-2016 bear greatly lowered CAPEX. Same issue oil will face in the future. Everyone got HAMMERED so they stopped acquiring and making purchases and pushed back exploration and exploitation. Both of these forces will (eventually) limit avail gold production which will serve to increase the price. But this is NOT a quick process, but a fundamental rise that should be seen over a multi-year period.
Giving VALE a shot at these levels…..Sept Calls stop below recent lows.
Check out OMER – Missed that one, but it was on my watch list.
TENX, OVAS, PRAN, ZIOP, INSY, Idra , INFI, even MAC all responding today. Some in a base trying to break out.
Mack just bouncing from the ‘pit’
EYES looks kind of good with a long base.
VSTM regained the 50sma.
CF do you have a ICL count on Crude…..atleast where you are somewhat comfortable with ?
I’m not sure I understand the question.
Where we are now, or how often they come about? Or something else?
The last 4 or 5 ICL dates …..
I’d have to look it up ( And I may already even have a chart) but I’m on my way out right now.
One thing about oil is that the daily cycles vary in a big way- they can be 30 day daily cycles , they can be 50 day daily cycles, so that can stretch the intermediate cycle.
two 30 day dailies are similar to one 55 day daily, ya know? So it kind of stretches things at times.
I have to run, but they run near 4 or 6 months, maybe more in stretched cycles.
No worries…thanks
I feel we are very close here
Yea…me too
And so does Bill!
omg VSLR…grrrr … maybe RUN will do the same… hmm
AREX & that 50sma . Funny. :0)
wow….
it looks like gold made a slightly lower low today at 1241. maybe it is time for the DCL, if we get a swing low tomorrow
MUX sux.
My favorite post. I yell this during the trading day constantly. How can such a well run company that did so well last year but complete and total garbage. Seriously, wtf?
QQQ still BTFD mode? just a question. I’m anxious to buy but …….
Don’t want to sound like a “permabull” on the stock market, so I want to point out that TQQQ is still a “sell” (downtrend) on my daily chart and is currently a “sell” on my 15 min chart selling off into the close. Two days in a row it has been rejected at its 10 day SMA. So it may rollover and it’s still a risky trade. The nice thing about buying last Friday is that I have “pad” room to work with and I can ride out a gap fill if/when it happens. And if it drops below the lows of last week, I’m out.
5 out of 6 of top SOS on money flow were Biotechs. Smartmoney carefully handed over breakout to retail.
https://uploads.disquscdn.com/images/e17835fdb4b7835ba062cc81f014ea51c92451d29bdda4d51a25e223dc28cda8.png
Thanks for sharing, Nord.
Took a position in KLDX. Ive been watching it for a while now and given that miners and inverse cant make their minds up, Ill play something that has a nice chart pattern… In OVAS, KLDX, AMD – bleeding a bit with AKS and BOIL
A post I posted in TV April 21st. It summarizes my gold-view, that we are in a “consolidating state”, much like we were last summer, building up a inverted HS pattern. Trend tend to change whenever entering the circles. Ignore the count, I just made a scetch thinking loud with myself 🙂 A little overshoot and undershoot on the range, but switching to a logaritmhic scale and applying more exact channel would yield better result. In original idea i thought price would intersect orange circle at upper level, but as things were more time consuming than first presumed, it will instead probably intersect at lower level. This is in chart about at 1210, but given history of undershoot, expecting a potential lower level. Keep track on what price does next week. Hypothesis is that ppl must hate gold a bit more before we can take off and have a failed daily cycle. I have a very unorthodox target of 1592 by end of november. https://uploads.disquscdn.com/images/d91858f203980bf9a6ad75c503b6f572a3b69c2777d9920471a577f29944f8f7.png
Maintaining bearish view on NatGas. Hopefully resumption of trend further extending tomorrow. https://uploads.disquscdn.com/images/b31fddc7f44453aeebfba215f76d57decf96e6c987a4718531fa4b46ca1e3fca.png
Some dear go long again in the hope of gapfill. Markets know how to exploit hope.
Sold XBI, it was a great 3-day run. R/R favors a pullback now to me. It could still shoot up to $80.