
June 1 – Lessons
Today we’ll start with a quick market review, and so far things are really still playing out pretty much as expected. I then want to present another lesson on patience. It is important and a lesson on patience can be very helpful at times. It helps us to remain positive while we wait for what I think will be an exceptional buying opportunity in the near future.
.
NASDAQ – The NASDAQ & The SPX dropped and bounced off of the 8 sma. So we see that the sell off was avoided for now, but these can still be topping candles. We also do have divergence forming at these highs, so we could be vulnerable to a dip in the markets.
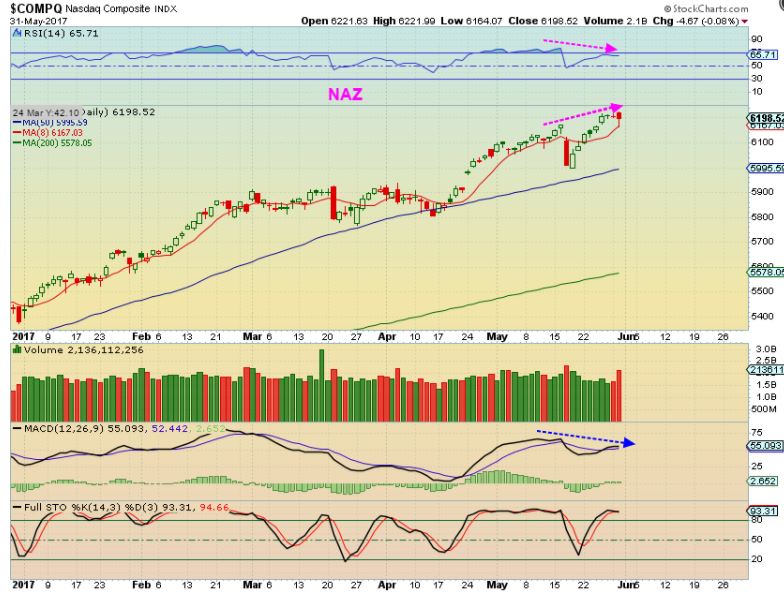
The following chart is another reason that I have advised using that trailing stops…
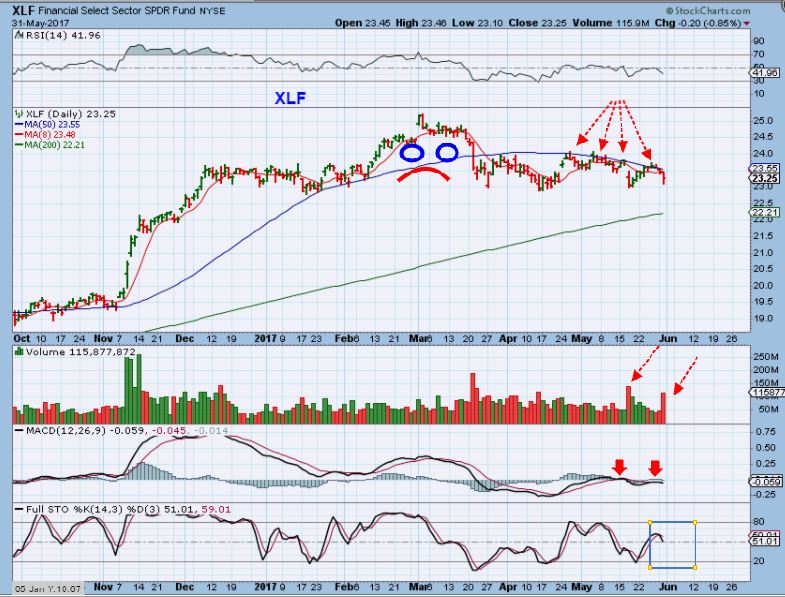
XLF – A reason to be somewhat cautious. The Financials are still struggling. I have been pointing this out for weeks now, and many of the Big Banks are drawing up H&S patterns. If the Financials are weak, can the markets just keep on trucking higher? We could see a drop into an ICL in the markets and then a continuation higher can begin again if the markets are going to go parabolic later. For now- I would still use trailing stops.
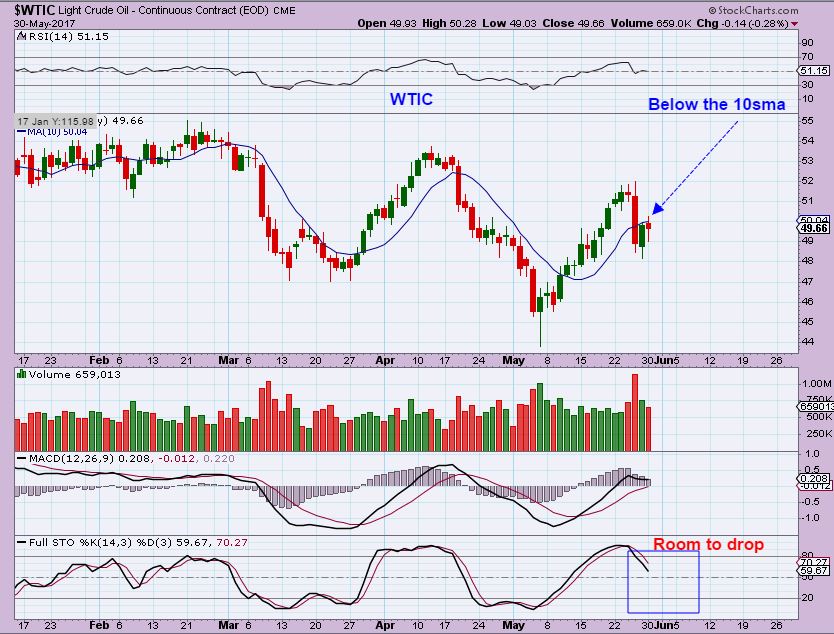
WTIC – My chart from Tuesday, Oil could not regain the 10sma after that swift drop, so I said that I remained short over the long weekend.
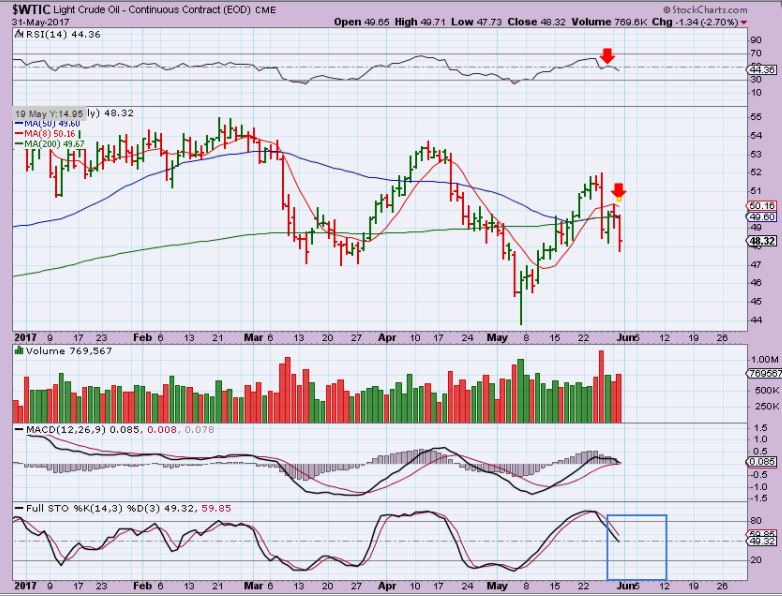
WTIC – OIL continued its drop. I actually wrote in the comments Wednesday that I sold all of my shorts to lock in some good gains near the highs for now ( DWT from $25 to $30+ for example). I was seeing short term patterns in the 3 day charts that indicate that a possible bounce was coming, and I cannot tell exactly how high of a bounce it would be. I will re-enter the short on the bounce, if it looks to be only a bounce.
Oil lost the 50 & 200sma, so I almost think that I should have just stayed in short and not tried to get too cute & play the wiggles. This looks to be breaking down as expected. I may re-short this.
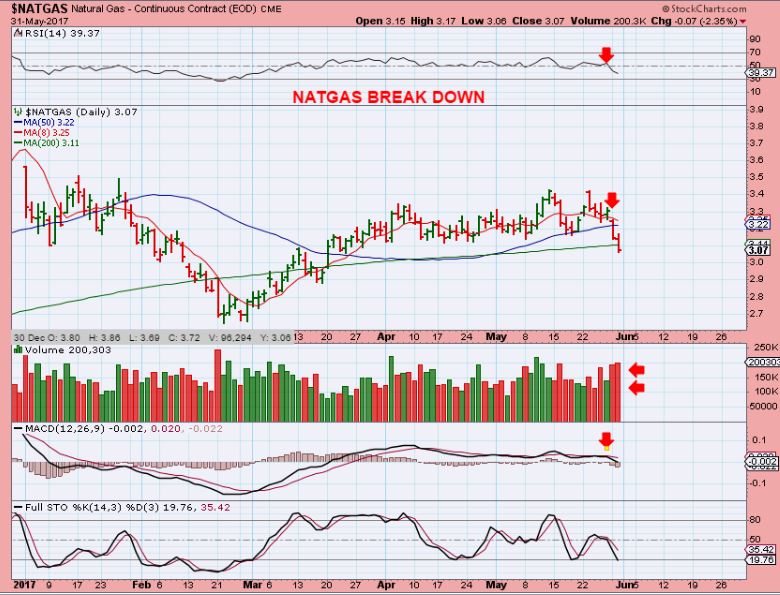
NATGAS – This is also breaking down as expected and Smart Money was a tell tale sign. They are probably closing some of their short positions, but this could drop quite a bit deeper, since it is now just breaking down below that 200sma with heavy volume.
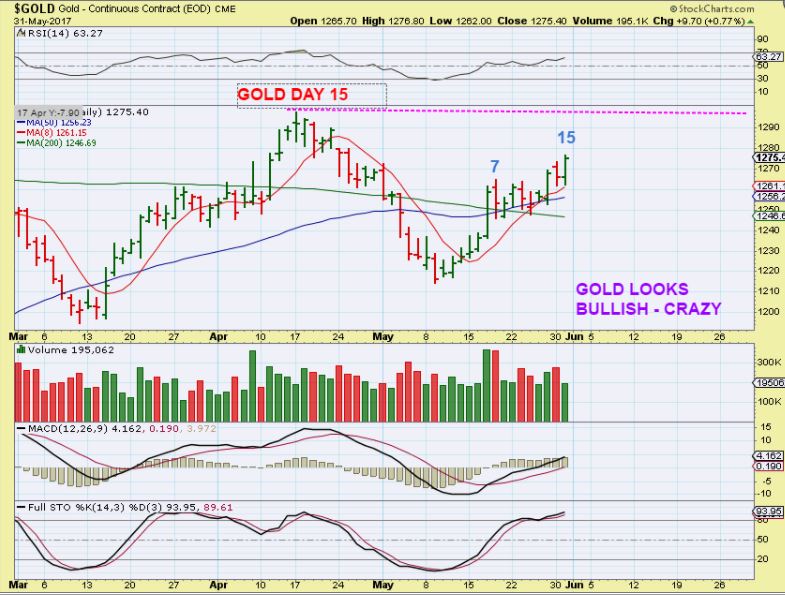
GOLD – Day 15 and Gold still looks pretty bullish. This causes some to lose patience and others declare that Gold just cannot sell off very much. I want to continue to remind my readers that this strength CAN give way and after drawing in more Bulls to the long side, it can ruin their day. When facing an ICL, Gold can still drop like a rock when the ‘time’ comes.
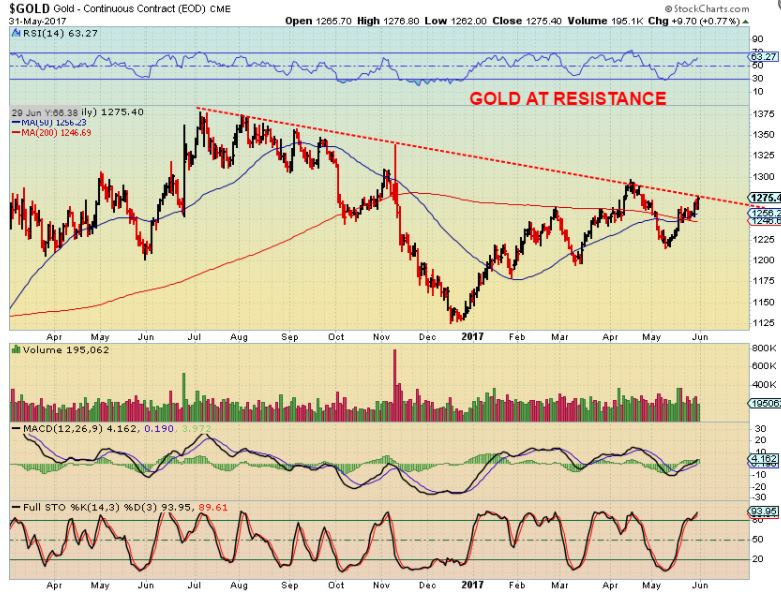
GOLD does seem to be at longer term resistance. And look at that drop in Nov 2016. Gold can plunge into ICLs.
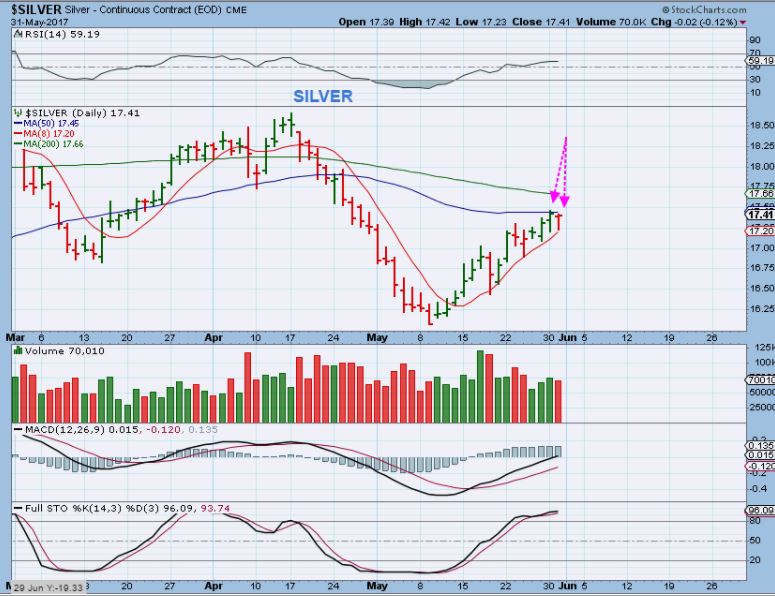
SILVER – Silver did stall at the 50sma
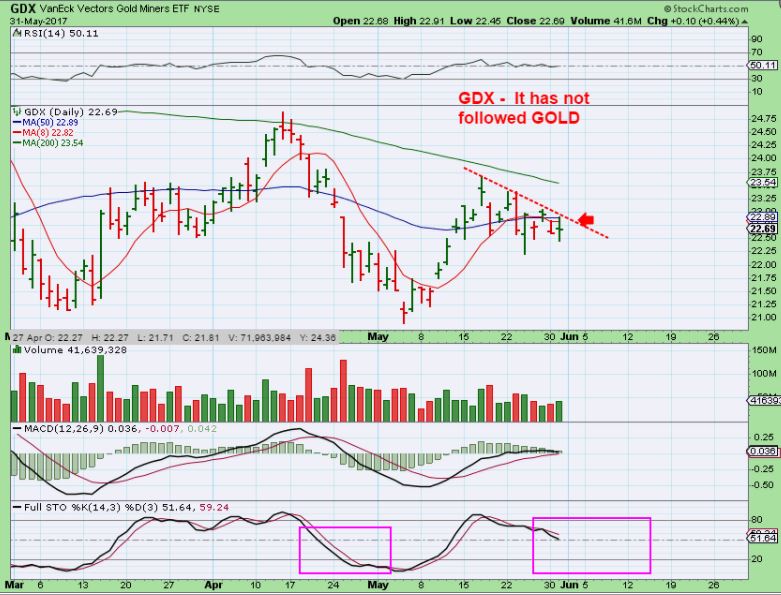
GDX – Gold jumped higher and the Miners still are not following. GDX was held below the 50sma so far, but it CAN jump to the 200sma.
GDXJ – We see the same thing here. GDXJ CAN run to the 50sma and put in a lower high like it did in April, but it has been weak so far, even though Gold continues higher.
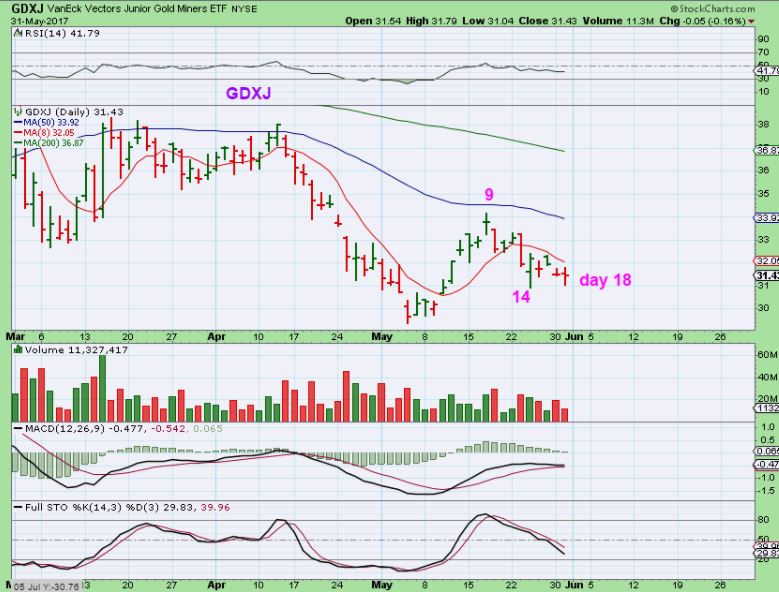
Intraday Wednesday I went short Miners as a pretty low risk entry on day 18, and mentioned it in the comments section. I am still expecting the drop into an ICL soon. GDXJ could run to the 50sma, but it has been rather weak with Gold breaking higher, so it seemed unlikely.
Things are still playing out as expected so far, but all things take time in the markets, especially when you consider that cycles last 30 + days lately. Day after day we get closer to an excellent buying opportunity in Miners. For those that are Short Miners or Energy, so far so good. Lets see what the inventory reports do for Oil and NATGAS on Thursday. Please read on for a lesson that I thought was necessary due to emails from readers. Thanks for being here at Chartfreak, and please know that after this rather boring action, we are going to make great gains. Patience is necessary when dealing with the tail end of various market cycles. Happy Thursday to you 🙂
~ALEX
LESSONS
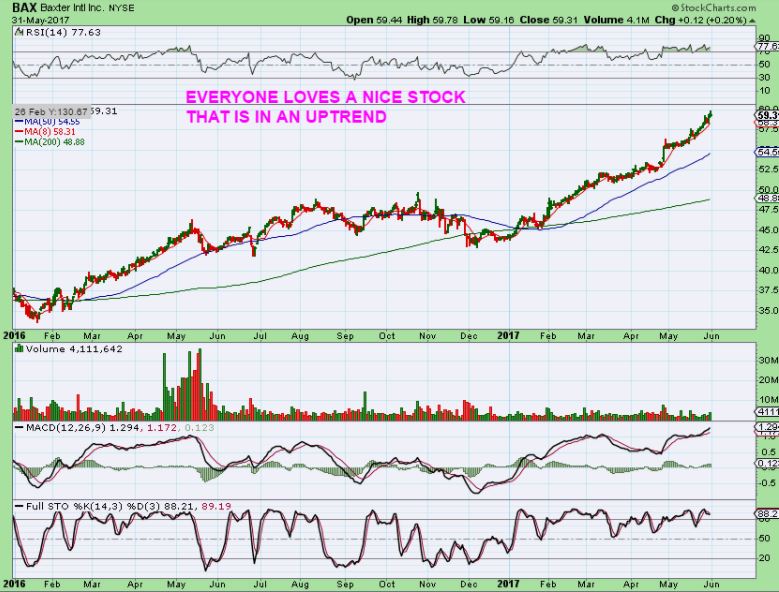
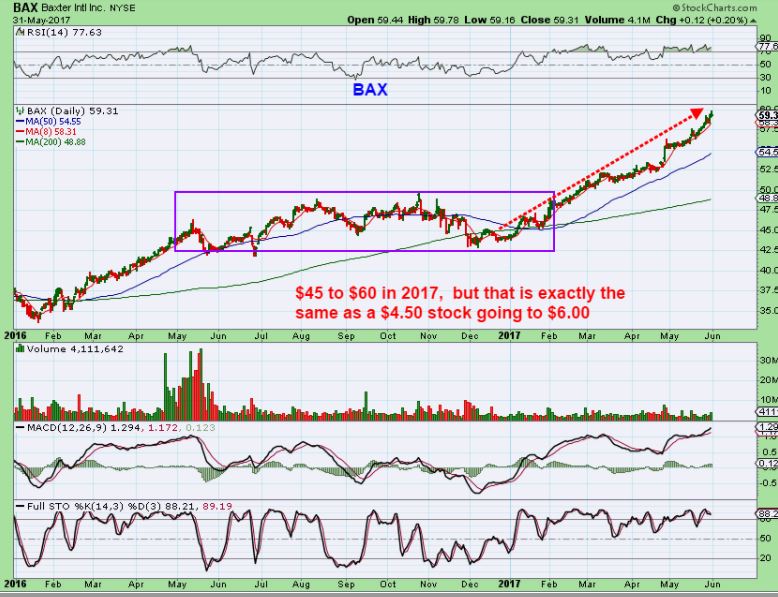
BAX CHART #1- Everybody loves a chart like this right? That is the lesson. When you look at this gorgeous chart, no doubt you see a beautiful uptrend. Some look at a chart like this and explain, “I wish I owned this for the past 2 years!” I would agree with that statement, however…
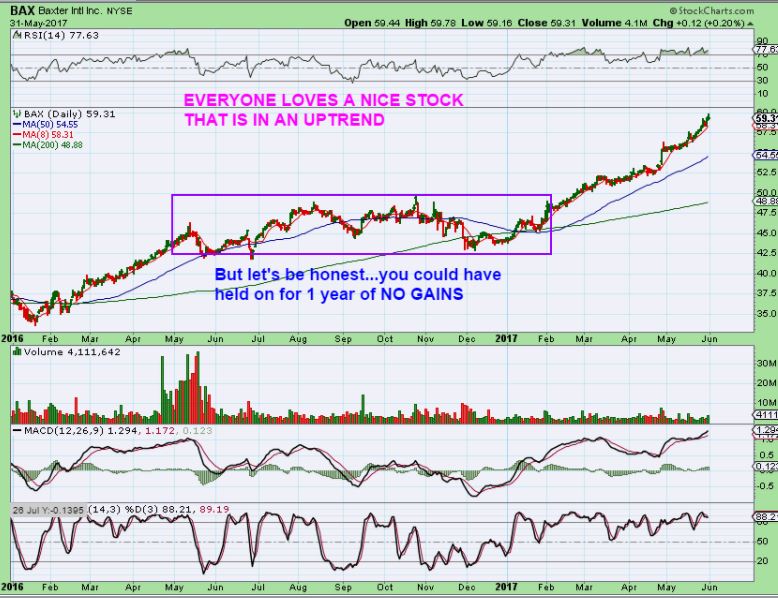
BAX #2- Let’s honestly take a look at what we see here.
-
If you bought this 2 years ago, would you ‘Honestly’ have been able to endure that May 2016 to Feb 2017 sideways volatility in the purple box? Would you still be holding after riding each of those sell offs?
-
Not only were there no gains for about 9 months, but your account would experience lost gains on the downside dips.
-
Now let me show you one more thing…
BAX CHART #3 – The run from this January 2017 to now was $45 to $60 and yes it looks excellent, but that is the exact same %- move as a stock moving from $4.50 to $6.00 in 7 months. When an ICL falls into place, my longer term readers should easily remember stocks running from $2 to $18 in 6 months in 2016. 100, 200, 500% gains in Miners can come to those that can patiently wait ( See Jan – Aug 2016 for AG, CDE, EXK, etc etc ). We also have traded Commodity and Energy stocks that doubled and tripled in shorter periods of time, after their period of selling down. I say this because some are getting impatient in the recent selling off of Energy & Miners, but looking at charts like BAX below, or AAPL, NVDA, FB, and so on, they feel that this was just an easy Buy & Hold Bull run ride. Look closer and you’ll see that these also required patience during sell off periods. AAPL went no where for 2 years recently.
BAX CHART #4– We are currently riding stocks that are less volatile than this one was. If you are riding NAK for example- it seems like a tough ride day after day, but it is actually less volatile than BAX was last year, but the break out from the consolidation and the sell off lows is where the easy money is made. Trades short term have been good, but the real money is coming up. DO NOT let the sideways volatility chop you up and discourage you. Read the blue writing on this chart please.
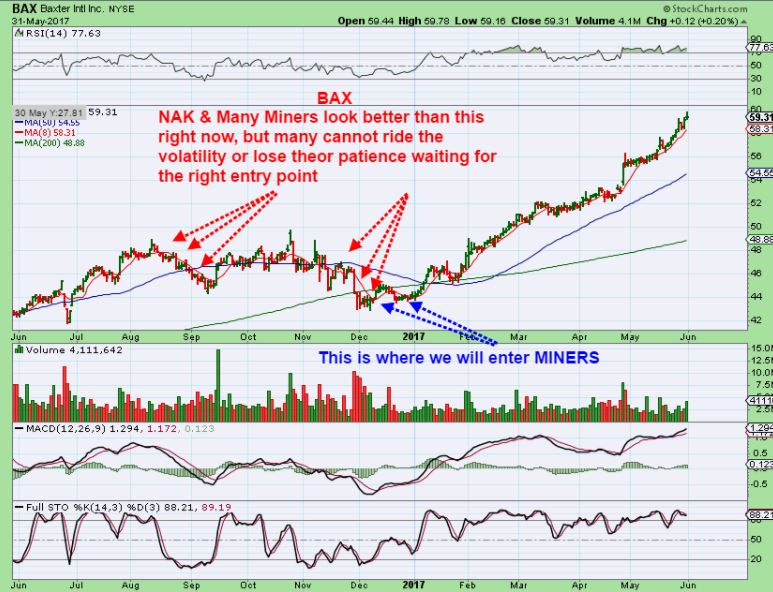
In my reports, I am constantly trying to encourage readers to patiently keep their eyes on the bigger picture. You do not even have to ride the recent volatility & the upcoming Dip in Miners. Using Cycles, I am trying to help you avoid the dips and then you can buy the rips out of those volatile periods. We are going to catch a nice run higher out of the lows in many different Miners, as they begin to set up one after the other at that time.
.
SO that brings us to an even more important part of our lesson. Patience.
.
I do understand human emotions that result from Market action. We see charts like BAX above and we want to buy & hold a nice ride higher like that. It can be tiring day after day, just waiting for a consolidation to end and a buying opportunity to present itself. Also the desire to trade can entice those that are not usually very active traders to try to jump from in from short to long to short again, etc. and that could be costly. Shorting and actively trading is fine for experienced traders that can see how to ‘time’ things out in the very short term, but I want to reiterate that PATIENCE will also be extremely rewarding when the time to buy eventually comes along…
.
Storytime
.
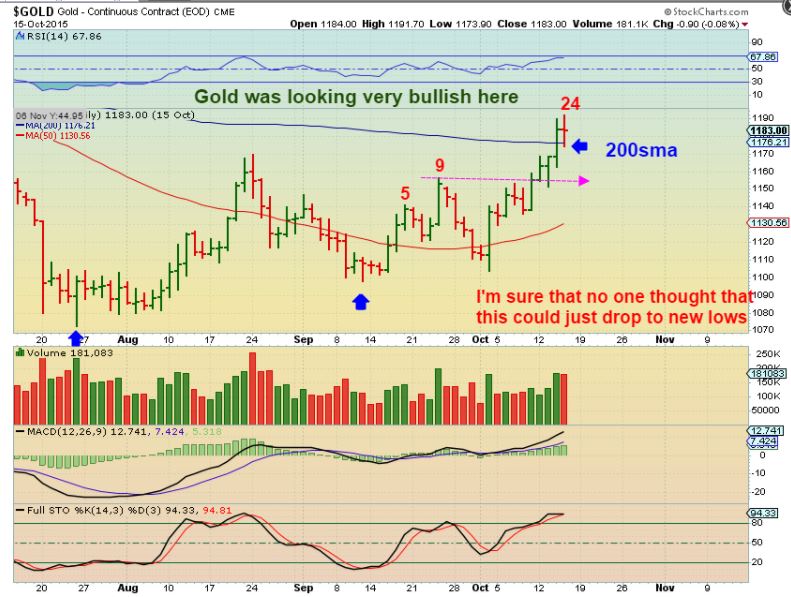
GOLD 2015 – Yes, GOLD was acting VERY strongly. This looks like a day 24 peak, are you kidding me? I’m calling for a drop into an ICL and Gold is THIS strong, breaking out above the 200sma? You may hear people say , “There is no way in the world that Gold can become weak enough to put in a substantial drop” and some get impatient and go long feeling that they are missing the move as GOLD breaks out above the 200sma…
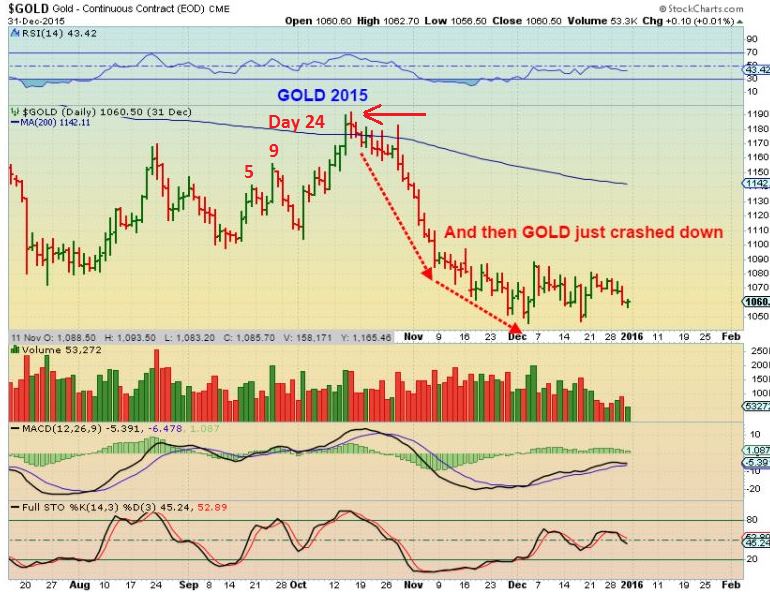
GOLD 2015 – Day 24 peak and Gold did drop like a rock quickly when an ICL was due. New lows were even put in place from high to lows in a little over 1 month. PATIENCE would have paid off very well here.
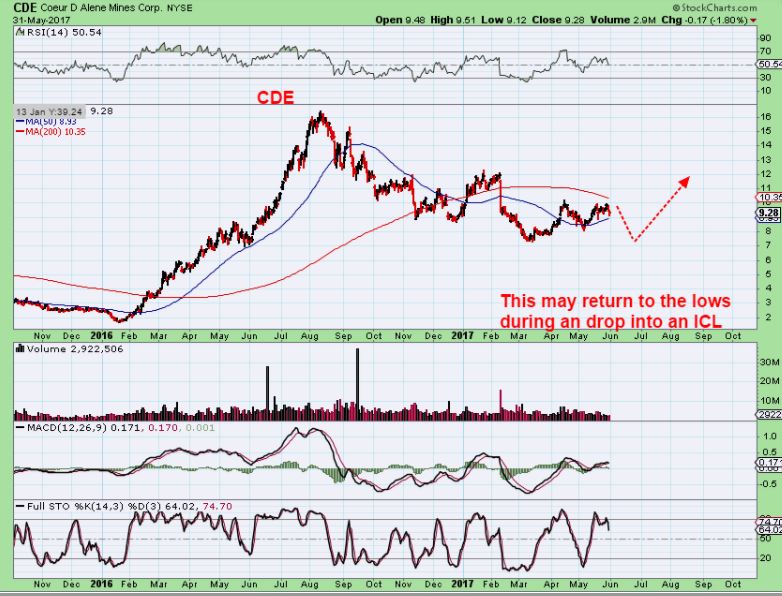
Charts of CDE, AG, RGLD, KGC, etc do look to be possibly already in a bottoming process, but when the drop into an ICL grabs this sector, they will likely return to their recent lows and that will be a great place to buy those too. Right now, GDX & GDXJ are displaying weakness in the face of Golds apparent strength. I expect that patience to be well rewarded.
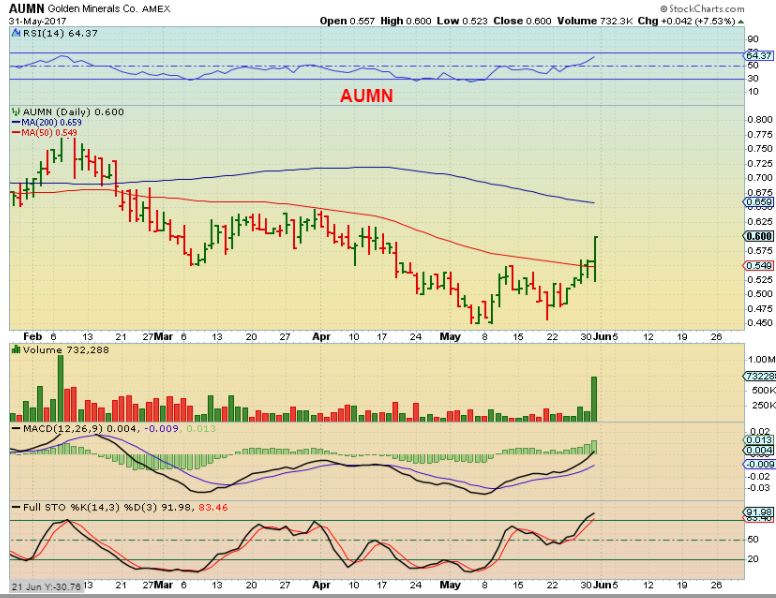
AUMN- And of course we see the occasional POP in a Miner that seems to have bottomed early. That can try our patience. AUMN sold off from $1.10 to $0.45 and is still at the Dec 2016 lows, so we haven’t missed a great move. This could drop to the lows again when Gold sells off too.


thanks for the Lesson Coach … always lovely to hear your ramblings …. er umm .. I mean voice of experience https://uploads.disquscdn.com/images/092bf935dd452a09ae2426a02f0ad9187e574519bb0e862e7b5c0cb7ebf284e4.png .. :o)
Lol – I do ramble on… I blame it on Zepplin, they told me too.
Keep on rambaliiiiin 😀
…ramble on and sing your song man…. ;o)
ILuvIt :o)
Hi Alex! Would you buy JDST/DUST today at the open? Do you have any SL for this short? Thanks for the post!
Hi Tony
SL?
I mean Stop Loss.
I hope this answer helps. I am answering this way , because you are not the
only one reading this reply. If I just say, “Yes, I’d short the
open” and then everyone that reads this jumps in short , some are going to really
have a hard time with it, unless they consider all of the possibilities
first.
Things to consider:
The stop is tough on this one, because most people that short used a leveraged ETF ( JDST DUST) and my thinking has always been that GDX can get to the 200 sma and GDXJ to the 50sma . That is a lot of heat for a 3x etf from here. So with that in mind,
Would I go short at the open?
– It could gap down and then if you short it at the open, that overhead gap might fill. Could you handle that?
Also if someone never shorted before, no – I would not recommend that for them. Do you short often, you could try a starter position, but if Miners are moving higher at he open, you may want to wait and see what they are doing for now…
– Some people do short , but have a hard time when a position goes against them at all. They use extremely tight stops. In that case, They may want to wait and see if GDX tags the 200 or GDXJ tags the 50sma, since there is less risk shorting at those points. See if a gap lower rises to fill the gap.
– DO I think that Miners should drop from here into an ICL over the next week or two? I do , and time is moving along with day 19 for the Miners, so I took the short.
I have a tendency to try to present what i think the current market conditions are and possible trades depending on what each persons risk tolerance is…and let them decide if they would be comfortable in that trade – with that risk.
I hope that helps
Great answer, I am not a big fan of shorting but Silver is really tempting me. However for many of the reasons above I am also very hesitant. I can weather a drawdown on a long position but am really uncomfortable when I’m short. Patience is my strength so probably will just wait for the ICL in Oil and leave the PM complex to the brave ones! 🙂
I don’t know why, but I can easily whether draw down in a long position, if I am confident that it remains bullish. On the other hand, I have a difficult time shorting when that position goes against me. It is a very different mind set for me, and I have to try to take the emotions out of it.
If I am short Miners and I see Miners going higher and my short goes red – I feel that I should be long Miners whenever they are going higher. For that reason, my short positions are never nearly as big as my long positions.
Well, markets are up the majority of time – so going short by default has lower odds of success – for me at least. There are always more hopeful bulls looking to buy a bargain than people willing to short Also bottoms are easier to spot and therefore it’s easier to go long than spotting tops etc – as I’m writing this I’m looking at that Silver short – will probably just close my IB screen and take a walk 🙂 no need to make trading harder than it should be!
Too late, I immediately went short when I read this .
JK!!!
Good report Alex. Patience will indeed be handsomely rewarded especially in holdings such as NAK, in my opinion.
Thanks CS. I own a good core position of NAK unless it sells and closes below the 200sma for a period of time.
It’s funny, all of the times that I’ve expected sell offs into an ICL they all seem to differ a little bit, but they also all feel the same.
It feels like it just wont sell off right before the selling starts, and then when it starts, it feels like it is time to jump in almost all the way down.
Then at THE VERY LOWS, it actually becomes hard to buy because there is always the feeling that it could go lower one more time.
Once it gets going upside though, we have over 200 comments in this section of the website day after day, people are singing, everyone is happy, looking for the next best set up that hasnt taken off yet. They talk about what they want to purchase with their recent gains, etc etc . I love those times 🙂 Cant wait for Patience to reward everyone. The waiting is definitely the hardest part.
Well said…our comments do tell a lot! This such a good forum. Thanks for what you do. I hope we amuse you with our angst!
I do catch myself laughing with a lot of the comments here.
One thing is for sure though, It is always better when the rally is taking place 🙂
This summer should be a good one
thank you Tom Petty
I want to go on vacation like Maria does!!
HL…judge blocks their Montana mining project ,… environmental concerns.
Yen and Silver weakening, Gold will drop soon. Patience rewarded. Which will bottom first, Gold or Oil?
CF: What % of your CYTR are you holding for tommorows announcement ?
Just saw this 🙂 Answered above
Nat. Gas looking for a bottom soon.
XLE also looking for a bottom soon.
Ken.. here’s the updated 3day channels for UNG, which backs up what you say.
For reference, bottom of red channel currently lies at 6.48.
Also..wondering if the MACD will curl up again before touching the rising trendline?.
https://uploads.disquscdn.com/images/e1848a564869a506142237904d4c20b5d8d27d55289db01daa2e3a1864ab9518.jpg
Hey SOG:
When would you “consider” a buy signal ?
I usually follow b/o from daily/4hour MACD/PPO trendlines, ideally with contact at an extreme channel boundary, and a swing candle.
I’ve noticed that this often coincides with the regaining of the 4H 13ema as a first sign.
Try a daily (1,33) MACD for your trendlines.. it works wonders.. sometimes 🙂
Hey SOG, I try to learn from your charts and chatter…but this has too many abbreviations I just can’t even guess at! What is b/o? And MACD/PPO trendlines?
b/o = breakout
b/d = breakdown
f/o = fakeout
s/o =shakeout
t/l = trendline
MACD = moving average convergence divergence indi
PPO = price percentage oscillator indi
indi = indicator 😉
thanks, i will save this
MACD & PPO are very similar, except that MACD is based on absolute price values,, whereas PPO is based on relative price values expressed as a %.
So a 1,33 MACD measures the distance of the 1day ma (ie. the actual price) away from the 33day ma, and the scale is in whatever the stock is priced in ..eg $
A 1,33 PPO measures the same distance but the scale is in relative %
Thanks for the clarification. I’ll have to look at examples to understand the difference. Sometimes I select indicators because I “think” with them better than others. %, as a concept, I usually don’t like as well as actual numbers. Maybe it is an artist thing. How I visualize. And I like charts because they are so visual and make more abstract things “see-able”. Thanks again.
% are often better for the longer term time periods, esp when price has varied greatly.
it allows you to better compare like with like.
if summat drops $1000 to $100, then $100 to $10, these changes would show as big differences on an absolute price scale (900 compared to 90), but as a %, it would be the same degree of drop in each case.(90% compared to 90%)
Same as Arithmetic versus Log scales
I think I followed that.
u 4got:
ROTFLMAO
SAF
WTF
KMA
etc… ;o)
Hey! PASII!
PASII…put a sock in it! lol
ps…what is SAF?
lol…. think on it a bit…
Saturday Afternoon Football ? 😉
ummm … what’s the opposite of yes…
but .. hey .. that reminds me of another…
AD
looking up slang, the first thing I found was “single asian female”….huh!? LOL
thankyou for your valuable contribution Maria
LoL
… happy to be of service 😀
Cool…let me play with that for awhile.
In the mean time let me know when “something” triggers for you so i can watch and learn. 🙂
Here Ken.. i got URRE on the verge of a trigger (am already in as you probly know)
Must add that b/o triggers below the red 0-centreline may just be countertrend rallies.
A b/o above the 0-c/l is more likely the start of a trend (but make be a fake)
This URRE looks like a perfect case, ready to break right at the 0-c/l
https://uploads.disquscdn.com/images/c72ad8ef560350a84dc51b72ad196744ef1eb6b0b9333ea6219c2a9285861f40.jpg
a ‘friend’ of mine uses the ’54 rule’ … for miners… when price closes above the 50 on a 4hr chart…
the last two good runs on dust was not until gdx was into oversold territory on the stochastics, wiliams % r, etc….coming up…picking up a few dust here and there on the dips like today.
omg… akg…. lol
wow.. hadnt realized that went back down to jan2016 price level.. bummer if you panic sold yesterday, fabby if you bought
neither… just observing
Dang it !!! I thought about it too before the close yesterday…. grrr
u musta been too busy doing the worm off my roof .. into my hot tub…
HA HA HA
lmao… what a vision…. ;o)
It would be a beautiful finish !! 🙂
arex lookn interesting… no?
Yes….wait until she gets above the 20 and 10 sma”s with a stop below ?
look how the 34 and 50 have come to save it .. offer it a comfy seat to rest it’s weary legs…
Yea for sure…..nice catch.
The whole sector is ready to move up looking thru my glasses. Technically oversold and sentiment is extreme so…… 😉
Exactly. Remember when I was pointing out possible leaders before RES, ERF, AREX, – check those out on the 34, 50 & and even the 200sma for some.
Many others look like possible double bottoms.
Check out this attached chart of PKD Double Bottom
forgot to attach 🙂 it is here. I’ve been watching quite afew this morning for signs of life
https://uploads.disquscdn.com/images/794b7a1221c3a02e9d41f755aba110e49f51f6ab0872493622cf66d6dda9ec19.jpg
sweet
I guess they weren’t worth “nothing’ after all 🙂
And right on schedule, here come the sharks for the attack after the fact
refresh
https://uploads.disquscdn.com/images/372558d72564146d8acff1d027751243c80b1689e13f6ca5870ba58cc1976440.jpg
Hey Alex and gang, I’ve been watching SVU for a while and today it just jumped over the 10 and 50sma. Momentum seems good, kind of a base. Thoughts on the chart? Am I missing anything downside?
I like the way it looks
GLBS…. hmmmm
Bought at $3.99. Target $4.50. *bort*
CF: CYTR Wutcha holding into tomorows announcement ? I still have 50% left…..
Do they have an announcement that I dont know of?
I was under the impression that they have a presentation of trials of their clinical studies, and I believe that the result of those trials has already been disclosed. Maybe you read something else, and they are disclosing something else? I’m not looking for a surprise of any sort, but maybe I didn’t read what you read.
I was pretty heavy for a small biotech stock and sold a 75% chunk at almost 80% gains. I wanted to buy back if it drops or eventually breaks out higher ( The weekly chart still looks good), and basically I am all house money.
so check out this chart.
Bull flag or a drop coming?It is tricky – a drop to the 10sma is common, unless it bull flags and the 10sma catches up.
https://uploads.disquscdn.com/images/3fb74826ea8951c38024ebd30fc0d9fc76766e75eec1b49aa4ffab5ecf15ffcf.jpg
STS phase 3 data will be announced June 2 in the pm…….
Some of the results seem to have been leaked a bit
refresh
https://uploads.disquscdn.com/images/7c710e5852dcbb2c378e4250820a6deca081b5dc0abe12c384718d63e2141e2b.jpg
Well then seems like a hold to me……
It might be a non-event, or a “That news was already baked into the cake” and then they could sell the news.
I’m pretty much using free money, so I’d like to take a chance and get a bull flag here or a break out on the weekly chart.
It is definitely a crap shoot at this point 🙂
I kind of hate that chart that I drew up, if this bull flag does what the last run up does . That was a quick slam down
Agree….house money for me so….this “may” turn out to be a long term hold.
ditto…possible long term.
*Subject to change in the blink of an eye 🙂
Yea I guess so…….. these biotechs can go bonkers in either direction !!
Was anyone else watching NAK at the 200sma.
Hey, the day isn’t over yet, but that acted about as good as it gets so far.
yeah… but I’ll like it a LOT better if it gets it’s hiney back in that channel ….
i have a feeling… that’s just “A” of abc
I just jumped in it at 1.51. I’m curious. Is it your expectation that it’s ICL is early like last time?
The last time Precious Metals fell into an ICL, My NAK position ran up 500%.
Let’s hope we get a repeat. I notice you look at history a lot. Now I’m staring to do that. Thanks for the teaching aspect of the blog.
I got in at 1.52.
That is a tough one….not sure if to add or not ? You are expecting an ICL in Metals very soon so that make me pause. On the other hand May 8 “could” be the ICL so conflicted here…..cloudy. 🙂
And to add to the confliction I am getting a bullish micro 1 hr. EW wave count.
Im waiting on ICL.
So hard to be patient! Bought more NAK as it trades on its own world. But am not buying traditional Gold miners or ETF until we get the ICL all clear warning.
go do pushups….
#HB
Three weeks of push-ups? That sure is a lot!! https://uploads.disquscdn.com/images/e55c6eaa9a2193cec4f127dc7884fbad968fab74990c3e48720c1f2623ec1b96.png
The last time Precious Metals fell into an ICL, My NAK position ran up 500%…
Yea I know…..hence the reason I own a piece of that ground.
I like that on a down day like this the volume is weeeeeeeak.
Employment Numbers will be announced tommorow at 8:30 am……
SPX up Metals down OR SPX down Metals up ?
ADP announced their version of the employment report – up 253K jobs – well over expected.
Yea saw that…..
I am going to take my hedge off before EOD.
I heard consensus was NFP at 180K so if govt comes in exactly flat and private is correct at 253K then the numbers will easily top street expectations.
What is a 3x etf for XLE ?
It’s ERX KEN. Can’t seem to post under your name.
Yes Thank you H50.
Where did your post go? Deleted? GUSH works too, right to the 50sma the last few times 🙂
I tried to reply to Ken in the reply section and I got, ” The post you are trying to reply to has been removed by a moderator.”
That means that he deleted it ( This site allows each one to moderate their own comments).
SHLO looks good.
LTBR POPPING
BOOM went boom
CLNE – Shake out?
MANY ENERGY STOCKS coming off of the lows.
SHIPPERS POPPING OUT OF LOWS TOO – SALT, NAT, TK, TOO
I mention the above because I said that I closed my OIL short and expected a bounce. I said that I would watch that bounce & probably add those shorts back on if ti looked good.
After watching many of the Energy stocks come off of the lows this way, and RES, ERF, AREX land on the 50sma and turn higher, I will not be adding those shorts back on at this time.
Good to know. I have been watching the energy sector move higher without much upside in OIL. I wonder if its like the miners leading gold?
It usually does, but it can lead in a bounce ( Like the last 2 XLE run up toward the 50sma) or It also can be leading by bottoming first, so I’m just watching right now.
I’m watching closely but only expecting the “B” bounce currently.
Reversing now. Oil still not oversold on the daily chart. That’s what I am using as a gauge.
mentioned it the other week .. was a bit premature,.. but CPLP shipper looks (potentially) good
Ken check that one on the MACD/PPO
Very nice SOG. I also have a buy signal on it.
Out of JO…not acting correctly.
ERX….bght. 1st. tranche.
Another new high for SPX.
Silver recovered today it’s gap down today……positive.
I am playing Crude Oil (USO) as May 8 was the ICL and currently working on a 1/2 cycle low (wave 2) yesterday if that low is broken I will add to ERX on the next Daily Buy Swing.
I would normally buy USO Calls but XLE is so oversold with sentiment at such an extreme level.
Hey Ken, I’m on the other side of the trade still short oil (SCO). But stops at breakeven, just a trade. I certainly would not take ERY or DRIP here as they are overbought, XLE oversold. Hope this works for us all!