
May 29 – Weekend Report
Trading is closed in the U.S. on Monday. Here is your week in review…
.
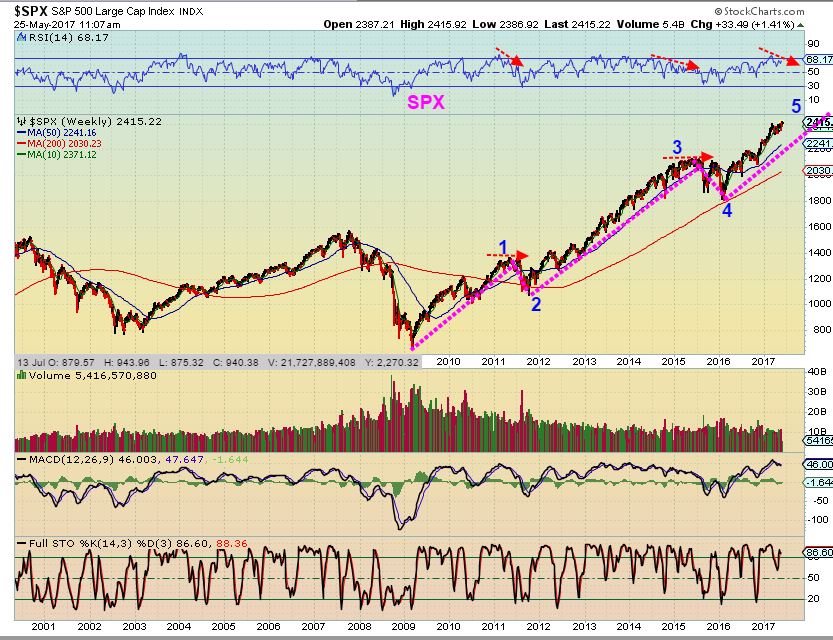
SPX – This is from our Friday morning report. A week ago I mentioned that it seems that the slam down may have cleared the deck of sellers and put in a dcl. We still have had all right translated daily cycles in this run. Please read the chart.
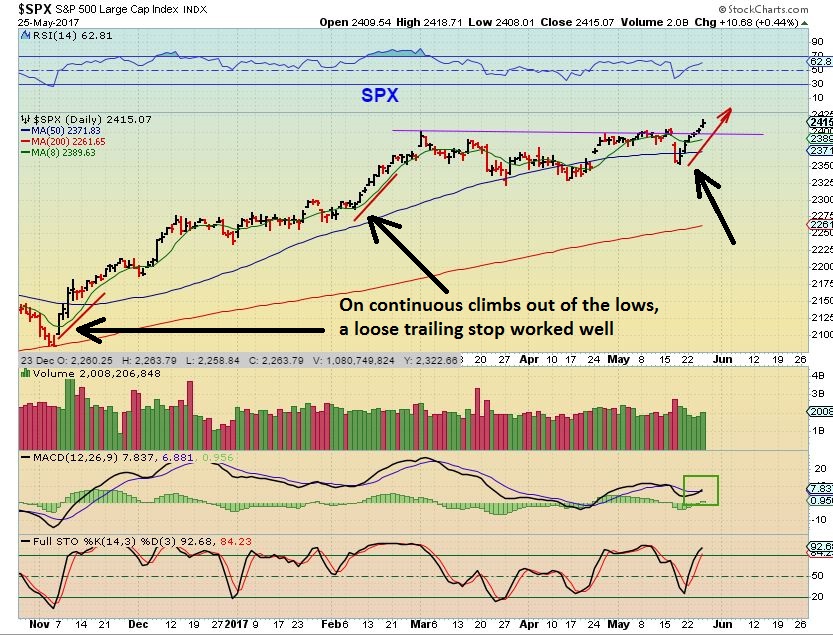
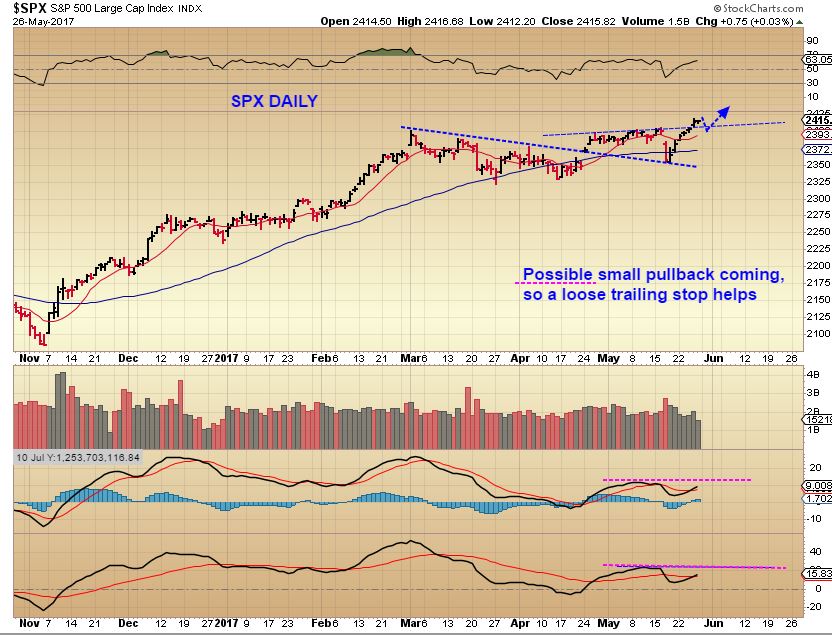
SPX – We could get shallow pull backs at anytime, but a loose trailing stop can keep someone that is ‘long’ in position. A hard stop could also be placed under the 50sma, since that shouldn’t be broken again for a while. This is now a 3 month consolidation and a break out.
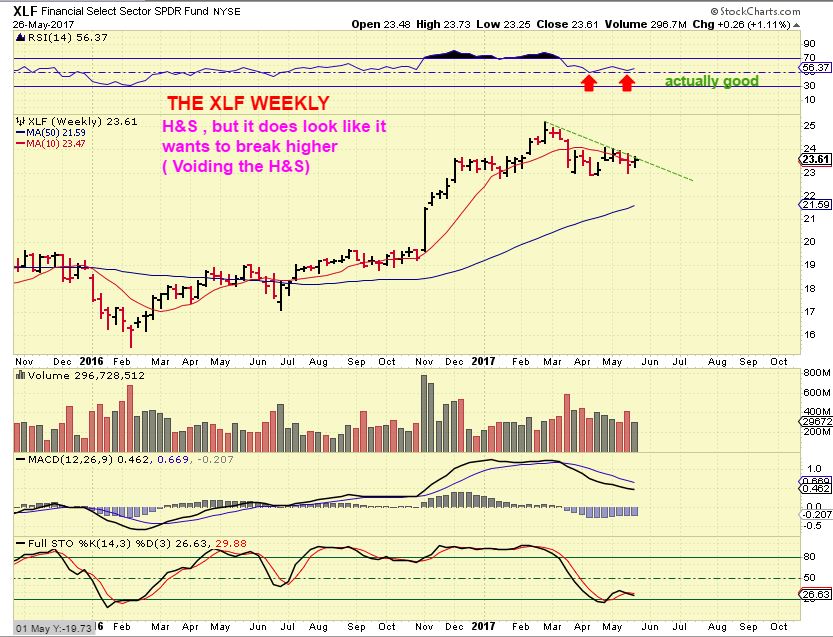
XLF WEEKLY – Looks like a H&S , but is it finally Improving? Watch for a break down or a break out at the 50sma on a daily, 10 ma on this weekly.
SPX WEEKLY – We have a break to new highs, but the MACD isnt confirming that it has good momentum, so it is a warning in the back of my mind along with that XLF. Again, just a trailing stop will be fine, but I would not be shorting these markets.
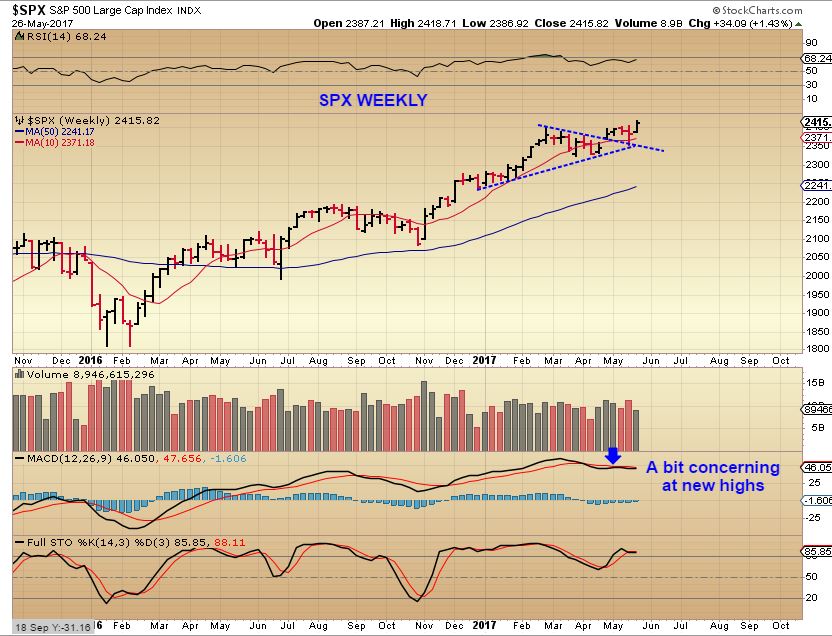
I keep hearing different wave counts, it seems that everyone has a different wave count. I was asked for one, and I would just keep it simple and enjoy the ride. I AM NOT AN E.W. Technician . Could this be 3 of 5? 5 of 5? This would be nearing an end if it was.
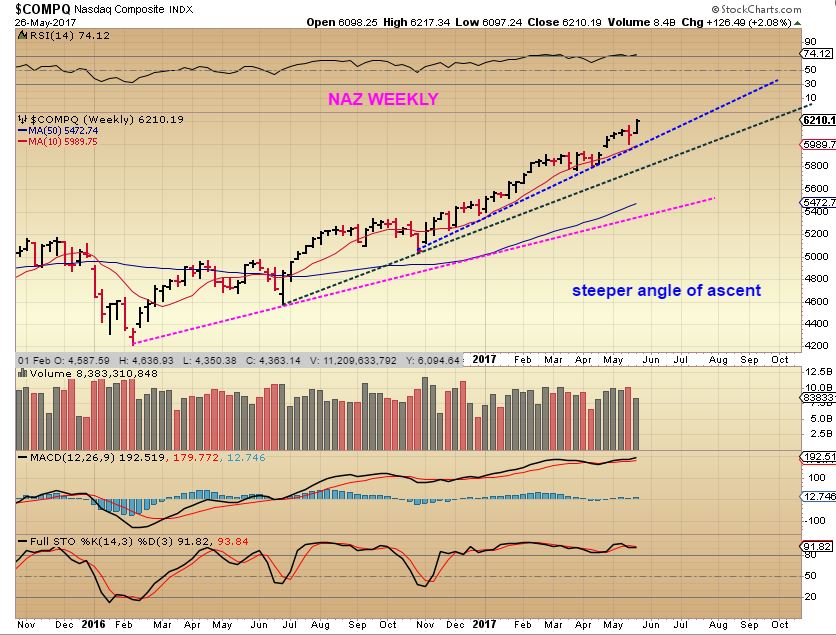
NASDAQ – This has just been on a weekly uptrend that seems to be getting steeper along the way. Quite Bullish. The NASDAQ broke from its consolidation in APril
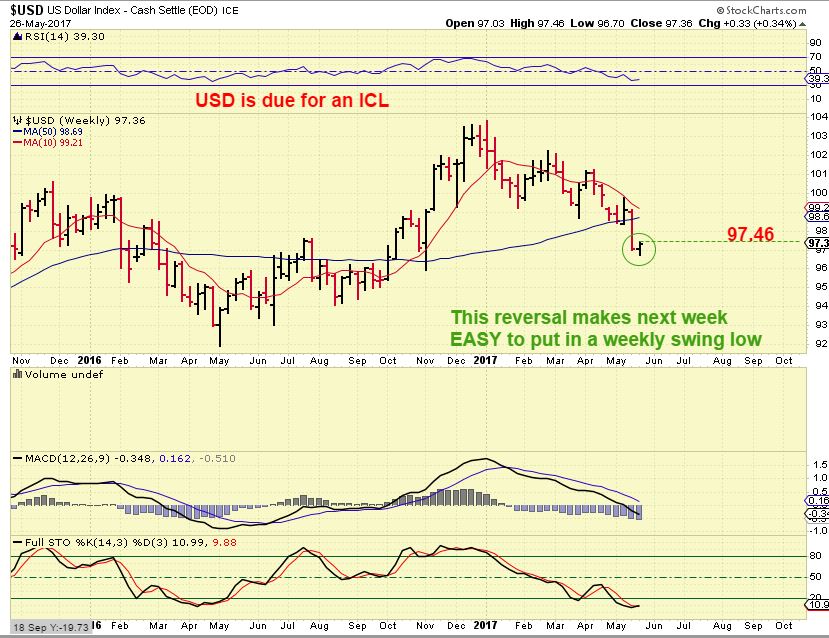
USD – This could be forming an ICL. If so, we may finally see some real weakness in Gold ( Miners and Silver already had big pull backs, but Gold has been holding up better).
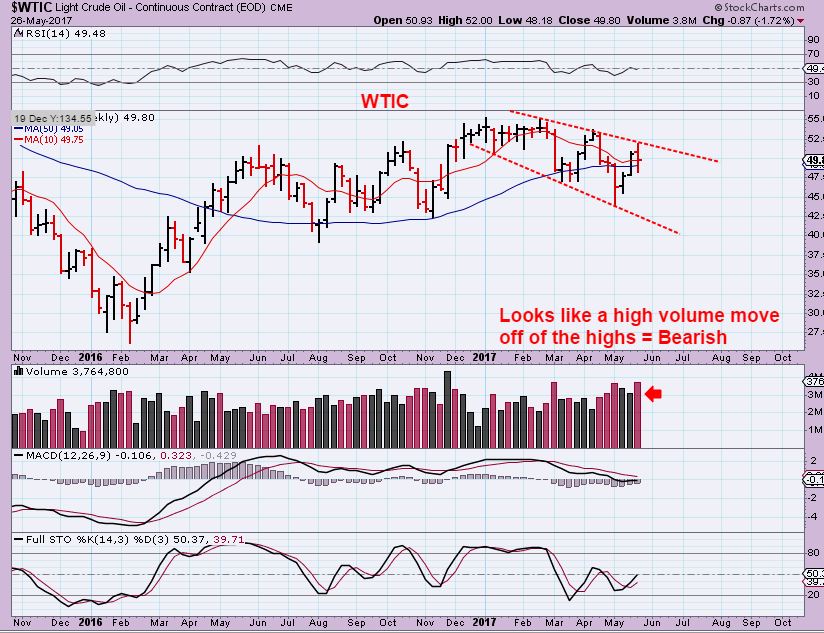
WTIC – I pointed out a ‘doji’ at resistance last week, and Oil dropped from there. Friday we saw a noteworthy reversal, but I still think Oil can drop further. THE FOLLOW THROUGH HIGHER OR LACK OF FOLLOW THROUGH THIS WEEK IS IMPORTANT IN MY OPINION. The stochastics is overbought and curling down now. Day 15 of a new daily cycle, and I still think that the ICL could lie ahead. A break & Close ABOVE the blue line would be a sign of strength, and suggest that an ICL happened in early May, but ENERGY / OIL stocks are lack luster at best. All shorts must cover above the blue line.
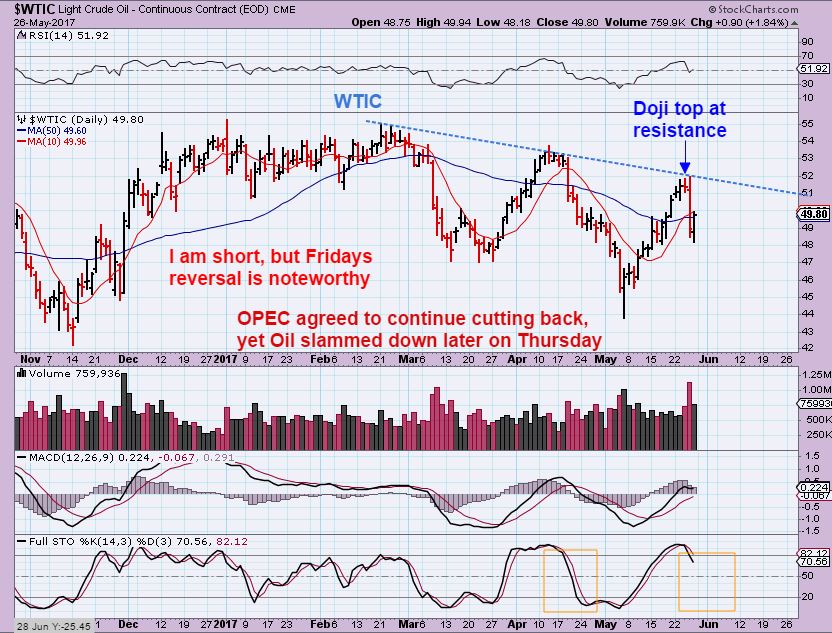
WTIC WEEKLY– A drop below $48.18 puts a weekly swing high in place. Time will tell.
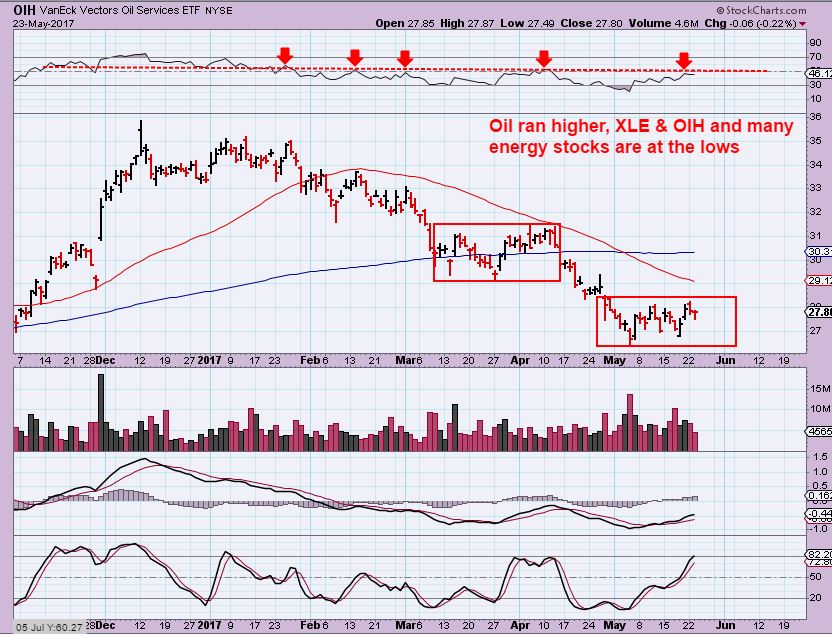
XLE , OIH, and Energy stocks have not been bullish with OILS big bounce.
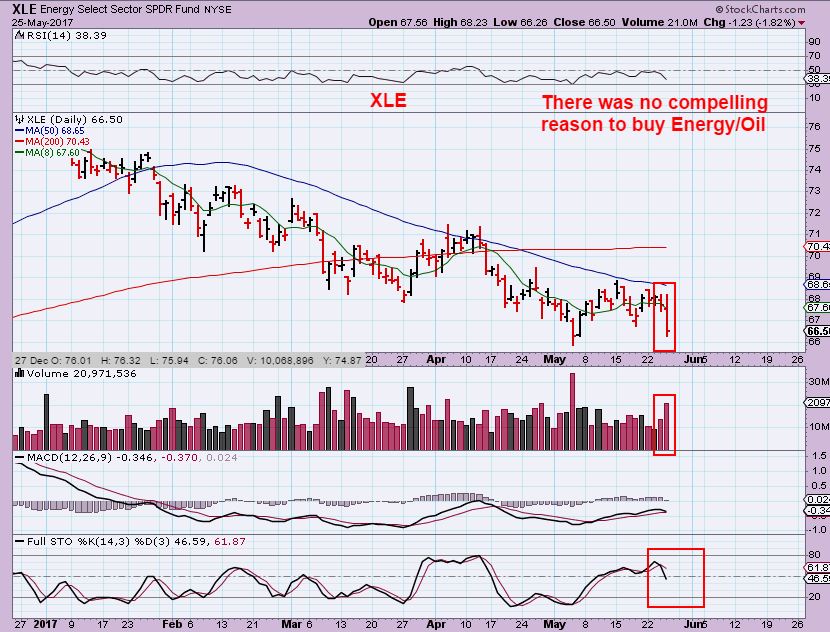
I have pointed that out in many XLE & OIH charts like this one.
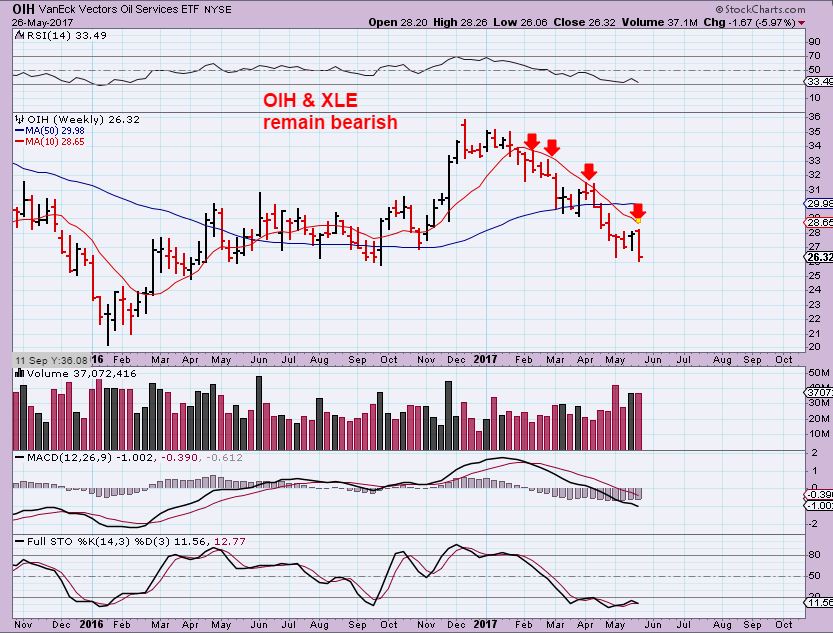
OIH WEEKLY – CERTAINLY NOT BULLISH at this point, and the XLE looks like a weekly swing high.
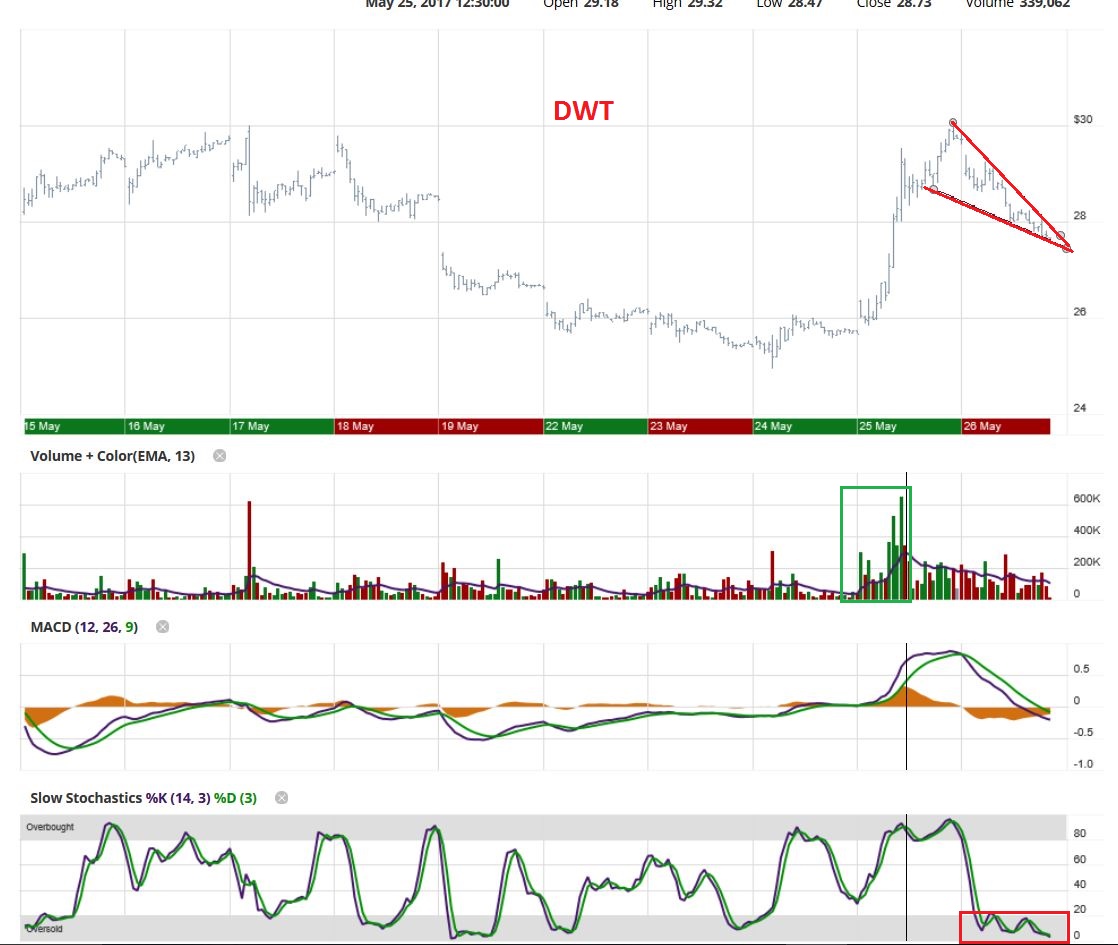
DWT– This is an intraday chart of a short Oil ETF. I am short and I was watching this for clues going into the close Friday. DWT DID break above that line into the close, so we will see if there is any follow through next week. The hardest part is that in the US, we have a 3 day weekend.
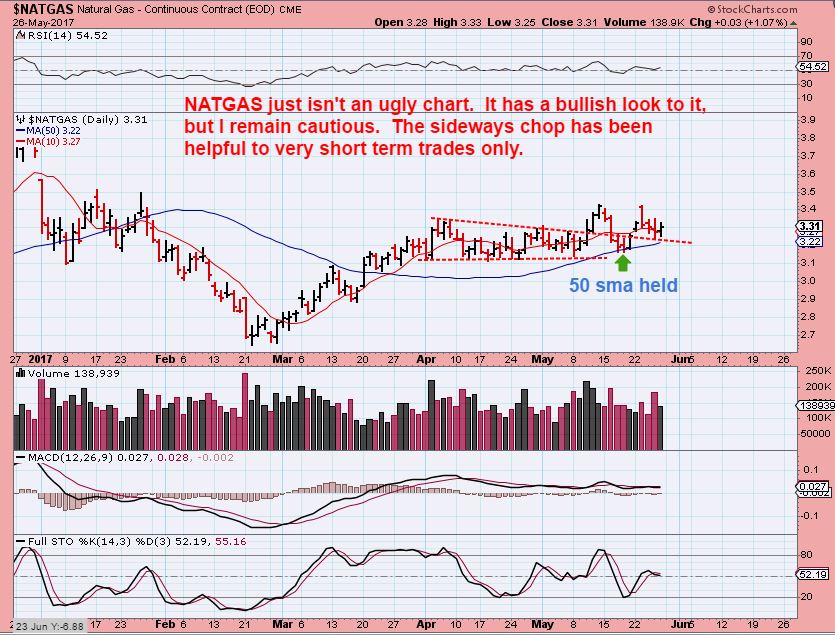
NATGAS – More sideways chop. There are reasons to feel Bullish or bearish on Natgas, and so far for me it has just become a short term trading vehicle. The COT remains heavily short this week, but price held the 50sma. I am somewhat neutral. A break below the 50sma may start a sell off this late in a daily cycle, rather than just a shake out.
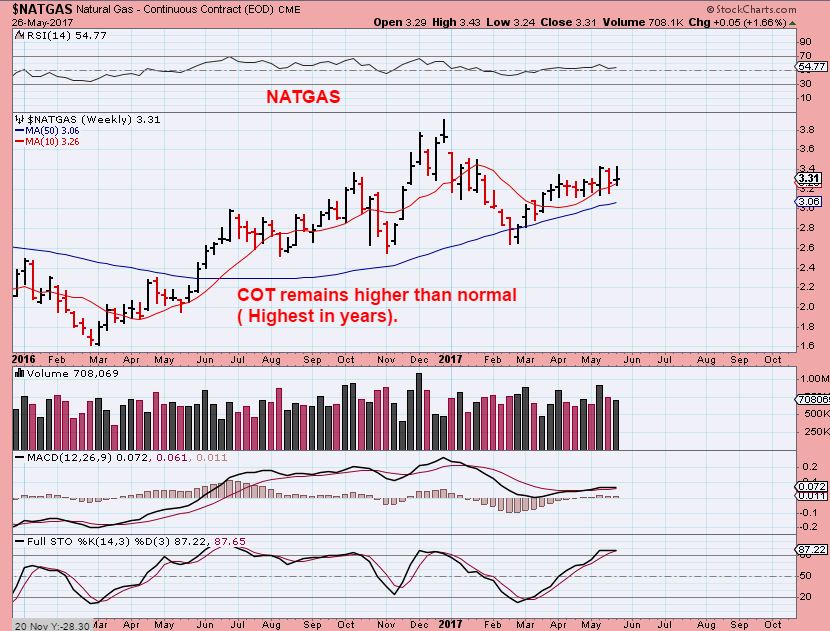
NATTY WEEKLY – Somewhat Neutral, it has become a bit overbought, a drop would give the appearance of a H&S. Needs more time.
GOLD , SILVER, & MINERS –
My Expectations remain the same.
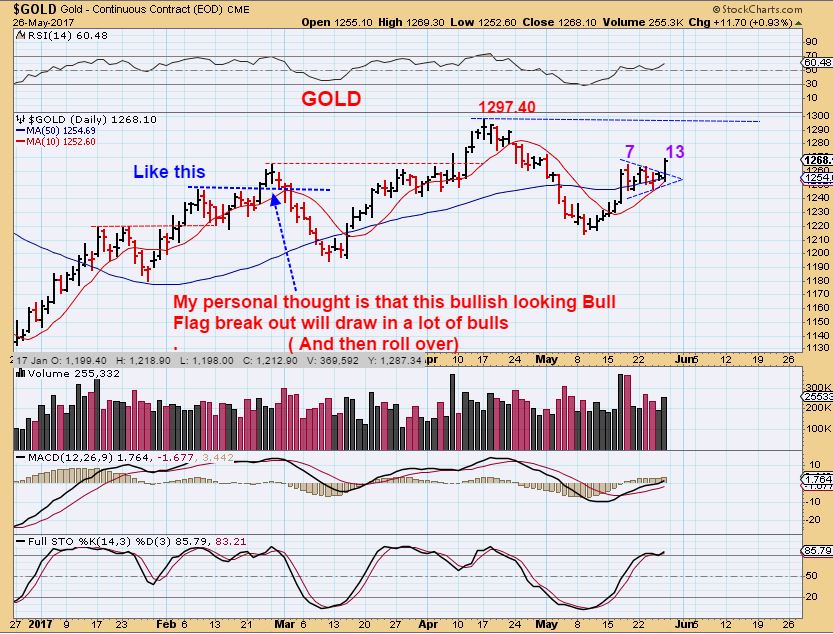
GOLD – A new high on Day 13 and a break from a Bull Flag was pointed out as a possibility last week. Gold is now near 2017 highs. This LOOKS bullish, but it might just draw in Bulls for the slaughter. Day 13 or even 15 of a 33 day daily cycle is still L.T. Next week is important, but break outs do fail, as shown on the chart. Gold has definitely been stronger than Silver & Miners.
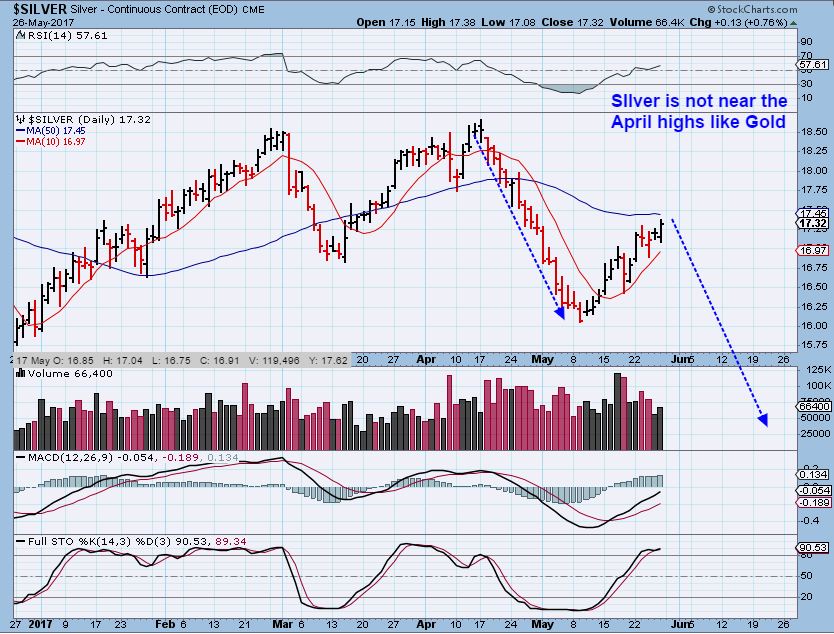
SILVER – Silver is not near the 2017 highs. If it stalls at the 50sma and drops equal length to the last drop, it could get really scary for the Bulls, and we need that to put sentiment into the trash. I’m actually thinking that Silver MIGHT just drop slightly below recent lows as Gold drops, and it is possible that most of the selling might have occurred in April.
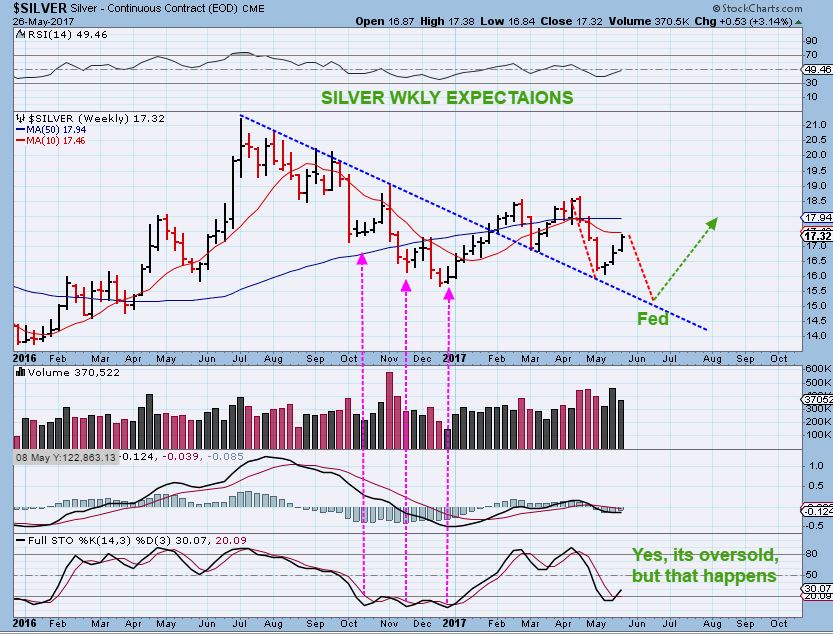
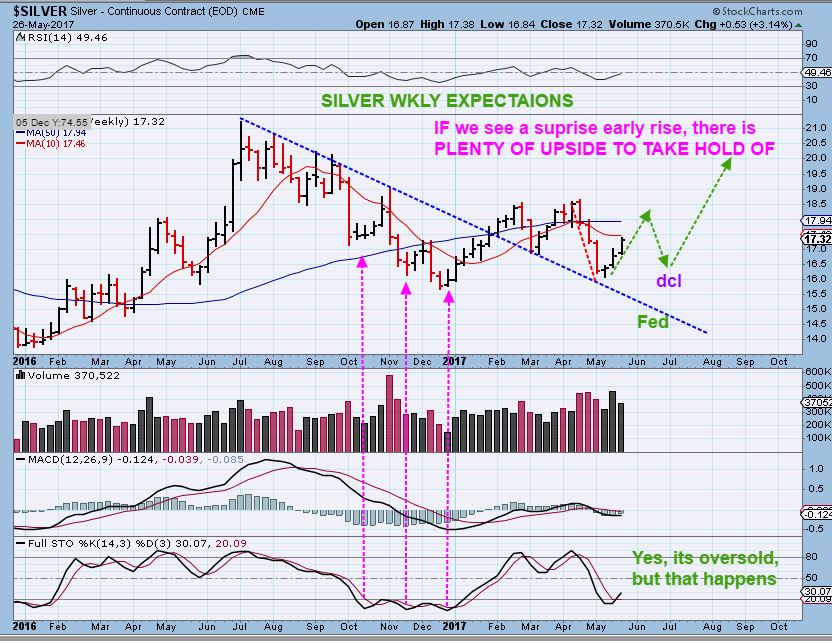
SILVER WEEKLY – If the ICL is ahead, this makes perfect sense.
SILVER – I still get the “But what if…” questions, and I do understand peoples thinking here 🙂 Many took long positions at the DCL and rode them for a week or two as a trade. I did that and I am now out of the trade. IF silver took off upside, we have not missed anything, a DCL will come and the next leg higher would be the BIG one. I will cover more on this later. Look at the chart and notice that in 3 weeks Silver went from $16 to $17.38 – you did not miss a huge rally even if you didn’t buy the DCL.
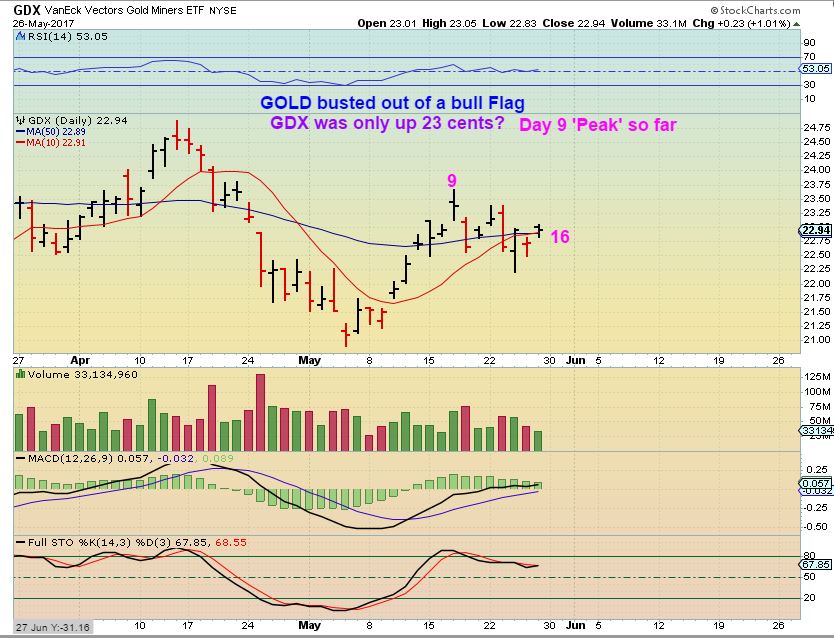
GDX – Gold is near 2017 highs, but look at Miners. Gold broke from a Bull flag Friday, up $12, GDX was up 23 cents? I still have people telling me that the ICL is in place, but the Markets look to be telling me something else. I have No problem patiently waiting here. If I jumped in LONG with the GOLD break of a bull flag, I would have had a 23 cents gain? The Peak remains on day 9.
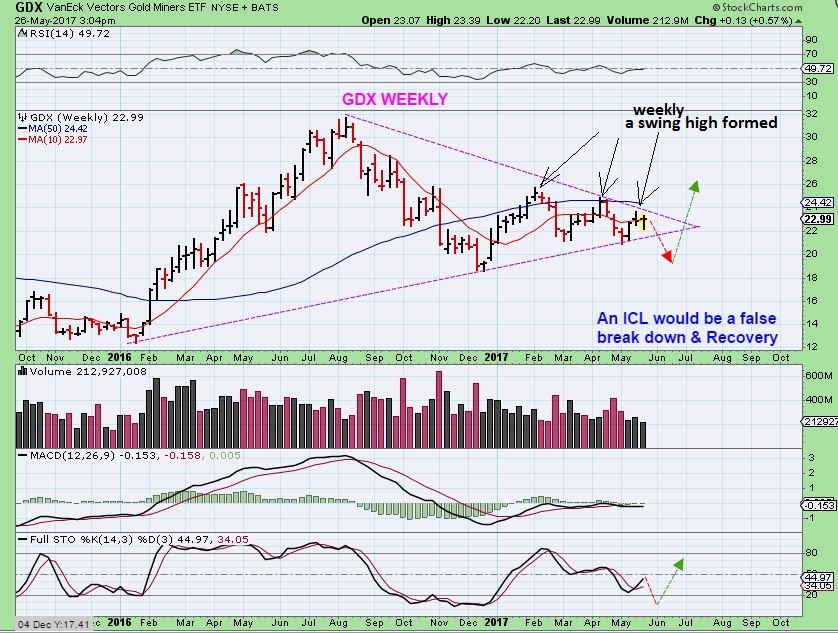
GDX WEEKLY – An unconfirmed swing high has formed. A drop into an ICL could give us a false break down from this triangle pattern & then become a strong rally, because many would short that & be forced to cover. Sometimes Patience is best as things play out.
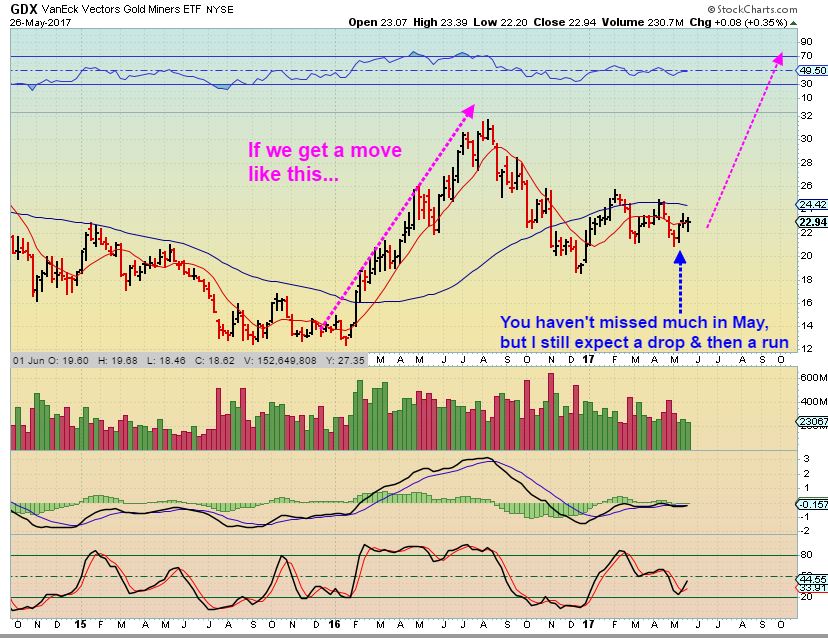
GDX WEEKLY – This is the same chart as above – Did you miss a huge rally in May so far for the Miners? No, and even if this breaks out higher and rallies from here to the former highs in August 2016, we would catch a huge amount of that rally.
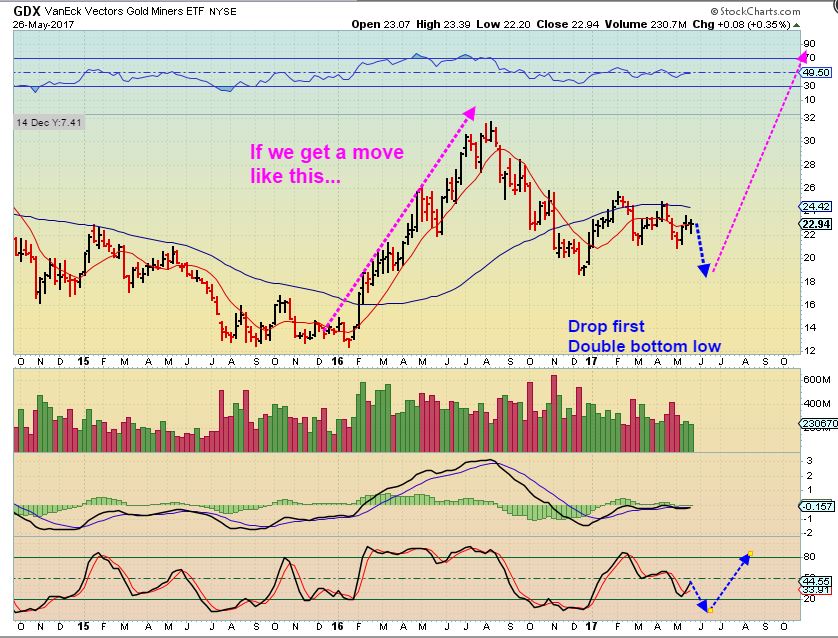
GDX WEEKLY – This is the same chart as above – Notice that we see lower lows and lower highs in 2017. One more drop to a double bottom low would offer an EXCELLENT buying opportunity.
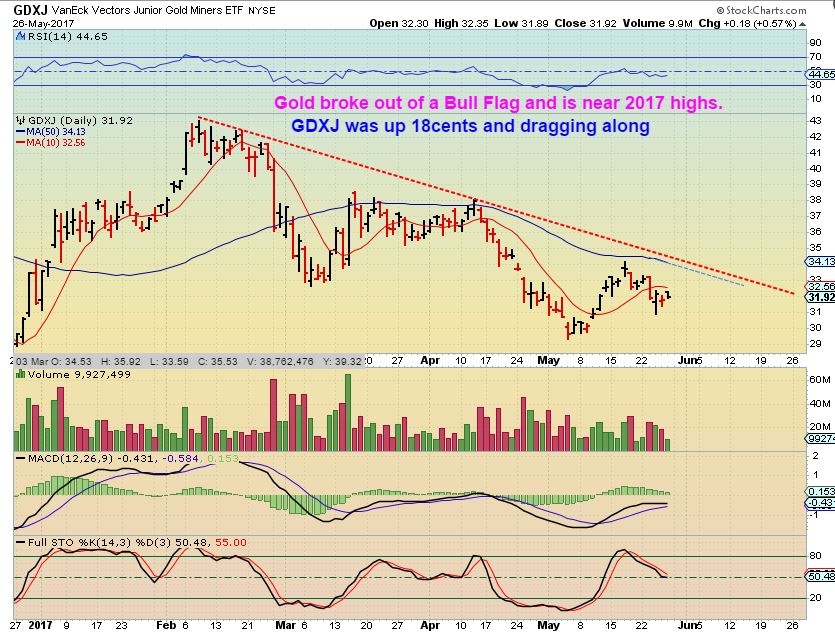
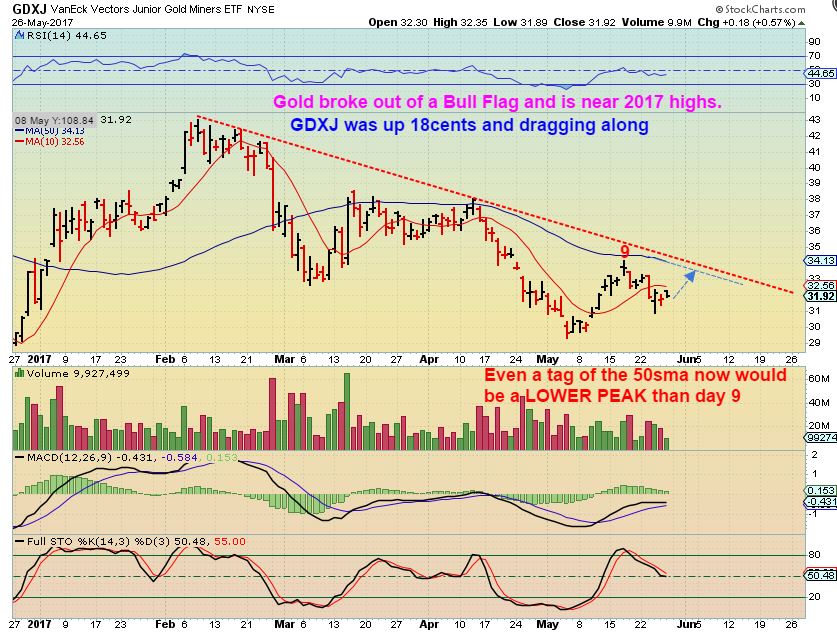
GDXJ – Gold broke out of a Bull Flag and was up $12, yet GDXJ was only up 18 cents , and it sold off into the close. You have NOT missed a rally here in May.
“What if N.Korea tests a Nuke & Gold takes off?” “What if someone declares war on N.Korea?” “What if…”
“But what if…?” 🙂 I can still picture a rally to the 50sma this week as possible and that would still be a lower peak. IF GDXJ rocketed higher and broke out above the 50sma, above day 9, above the blue line, I would definitely close any short positions and consider “Long” strategy, but I only say this because I am being asked “What if…” daily. My primary thinking is that too many people want to go buy here & go long ( or are buying the Bull flag break out). Sentiment will be flushed out if price gets flushed out into an ICL, and that is still my primary thinking. Day 9 may be the peak.
That has been your market weekly review. Enjoy the rest of your long weekend in the U.S., and if you are living elsewhere, enjoy your trading day.
~ALEX
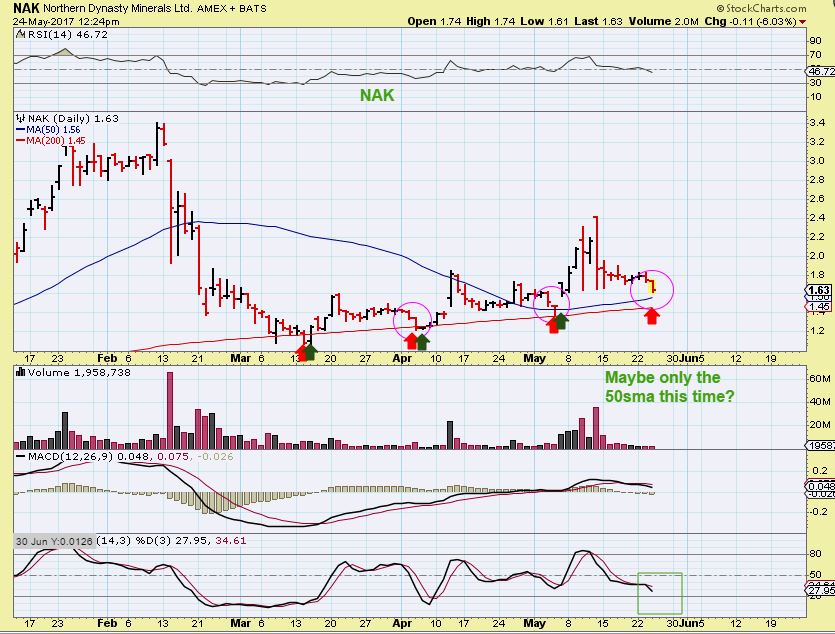
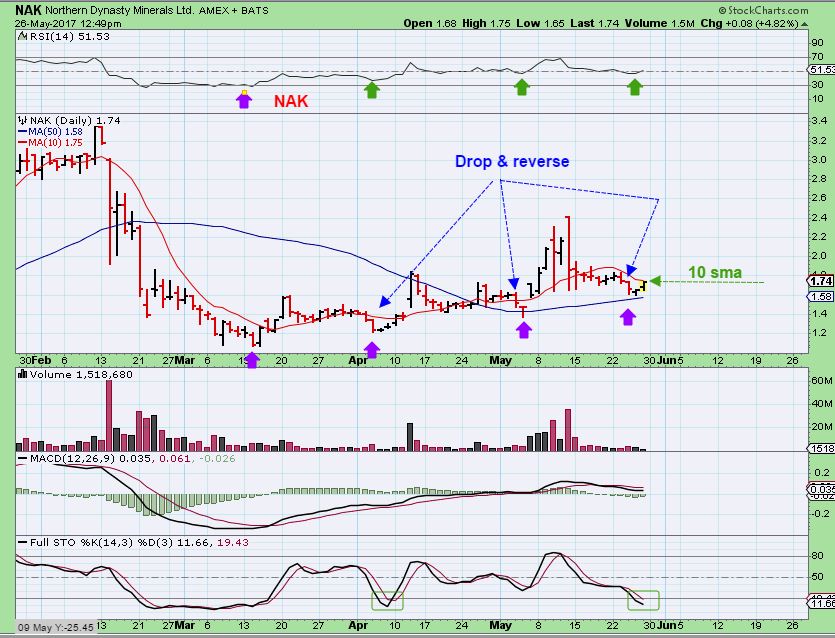
NAK – I mentioned that I noticed how NAK would drop after a sideways rally and then turn higher, and then we started to see that on May 24th.
NAK – It also started to turn higher, so we’ll see if it can break above the 10 sma and find some follow through buying.
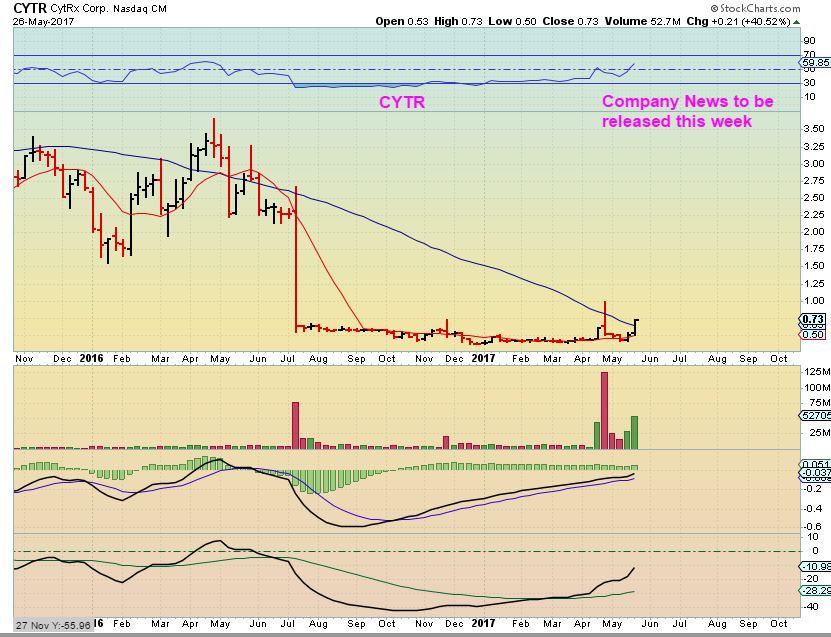
CYTR WEEKLY – We had a nice pop of 40% last week. Congrats if you took this trade with me. The weekly chart shows some large upside potential. They participate in a presentation on Jun 2 Friday, this could boost the stock or be a ‘sell the news’ event. A reaction may occur one way or the other, so you could lighten up and lock in some profits if your position was large, even if you want to continue to ride the trade.


Hey Alex! Thanks for posting this so early on this Memorial day. I get to read this during daylight hours like regular people.
Thank you!
Hey Johnny – Glad to know you had extra time to digest the material , hope you had a nice long weekend, 🙂
Great report again. Thanks!
Thanks H50- Aloha
Excellent review….looking forward to fabulous setups that follow thru…for weeks..:-) https://uploads.disquscdn.com/images/0f3fc9a31562d4526911b4d58905e3e5ae62eff0fc4cd908a506f0e249cd1a66.jpg
Me too Maria, I really want to buy & hold for a few weeks. Can’t come soon enough! 🙂
Remember 2 or 3 weeks ago we had a “trades all coming together” report and thought the traders paradise was back? Well, phooey! That didn’t work out at all! So, hopefully just a few more weeks before maybe it will? I don’t want to wait!!!! Now!!! 😛
For some reason I see the general market charts, but none of the pm charts? Very strange
Now I can
Great. Report. Like most i m tempted to jump on the bandwagon but good you te warning us again
That is priceless in my opinion!!!!!!!!
The Bull Flag was tempting Ray, but even with N.Korea launching another missile this weekend, Gold had a muted reaction today. Patience should pay off, “Time” does not seem to be in Golds favor yet.
Thanks Alex. Good stuff as always.
Thank You Daz 🙂
SO as mentioned in a comment below, GOLD is breaking from a Bull Flag, and N.Korea launched another test missile, but Gold did not take off higher today. This is a good sign for those anticipating more downside before the Deeper meaningful lows are in place.
Time is moving onward, it may be closing in on a lower risk time to short Miners if that is ones plan.
Enjoy the rest of this Monday and back to work tomorrow for the U.S. & their markets 🙂
NatGas down heavily
Yeah, that roll off the June contract was pretty evil. That’s part of why I hate trading these so much – UNG and friends really get beat up with natgas contango.
Good points regarding NAK Alex. I was noticing that pattern last Friday and hopefully it will repeat and produce the same results as in the past.
Holy crazy dividend, MACK. Literally just paid out 1/3 that’s completely ridiculous!
Dividend was 1.06.. price drop is 1.05,.. so its actually gained a cent so far
The way I figure it, only the government came out ahead on that little maneuver, unless held in an IRA they got to tax you twice on the your money.
MACK could be a cheap buy at these levels.. check out the turn-arounds at the 3day channels on the chart
https://uploads.disquscdn.com/images/e671f624866b66b1529dcddecb5cc544b01ab9bc789316f889492c076ba46531.jpg
It does, but I stopped out early Friday on that huge toilet flush. AND I got stopped out on LABU today as well, so I’m taking a bio-tech break for a few days. I don’t like to jump right back in after a stop, I make emotionally charged mistakes when I do. The good news? Raising cash for metals ICL?? ;P
JDST +3%.. DUST -4% ??
what gives?
I show DUST up 2.19%
thx B.. ..must be my charts
hmmm… steel tryn to do a LiL sumthin sumthin…..?
and solar …FSLR SPWR….
and VSLR ..
X & AKS both look like higher lows on the 10sma
CYTR 🙂
Where are you looking for exit CF? Shes been poppin pretty hard
refresh :
I posted here that I started my position around 48-49 cents, then it moved higher and dropped on light volume to a confluence of moving averages, so I added again in that 50cent area.
I usually watch how it rises and see also the weekly chart ( Which is excellent), so I will sell 1/2 for about 80% gains, and may let the rest ride for a bit, just to see what happens.
I don’t like to get greedy, and I do like to lock in profits, so selling 1/2 takes care of that, but the longer term story may be good for their cancer treatment. A huge gap is still open overhead on a 1 yr daily chart, and it has formed a long flat base in that 1 yr daily chart, so I like the set up possibilities for longer term too.
If it falls like it did at the end of April , rather than break out and continue to ridiculous overbought conditions, I will probably sell the rest below todays gap- I really have to watch it and see how things play out.
https://uploads.disquscdn.com/images/2697d72719e329ed3e2689037c756d05179f1be86c8dc4005a37c23b965934a2.jpg
tweet that baby out … 😉
I should , but I’m afraid that If I do, it’ll crash tomorrow – lol
AWESOME call CF … fwiw .. gaps in EW terms .. usually mean ‘3 of 3’ ….
edit> “gap and go/runs”
Yea my index finger starting to twitch…… 😉
LOL mine as well
lol.. well … steel’s lookn pretty good …
hmm.. XRA looks close .. no?
Hey maria….:)
I hope you had a good long weekend……college is about done for this semester ?
Metals still too cloudy for me short term…..other than some long term holds. Just me though…
Anyone else like URRE here
Getting close…..
I think so too, look at the 3 month chart. Think it needs to break that down wedge
am already in & waiting (as is Nancy & Cason, i think?)
ouch….yes…in already….c’mon already! We need a giraffe neck! LOL
almost tempted to add & average down, now
Anything I have left, I am waiting to deploy. If you want to see a real painful one….look at CRK chart! ow ow owch.
nasty!
Then I look at a 3 year chart….sometime it has to recover….the question is, will I still be alive to see it ?!
Couldn’t you do to adopt some kind of DEFCON bailout strategy?
Might save you going so deep into the red with some of these nasties… unless you prefer to just buy & hold thru the pain, i s’pose
I am reformulating as I observe my results this year and last. I was more an investor than a trader, but am starting to change my views. I will be making some changes.
Ahhhhh…
Come on URRE! You’re killing me!!
Shorting SPY this morning….stop above recent highs. Very low risk with excellent reward.
Kinda a hedge for me in a way…..
really? i thought last week you said the general market is going up.
Short term trade YS…..
Does anyone here use options as a hedge for their miners?
What about TGB? Is that a flag forming?
Its been for a while now. I mentioned it to CF last week or so. Im still in and holding.
Me too, that is one of my core positions.
Very nice Nance. Im just waiting for this to double lol
How about if the get out of the courts and get to resurrect their plans for the New Prosperity Mine?! Then we’d really go up!
Very tempted.But since I don’t own it now, I’ll probably wait for the ICL to be in.
It is a copper mine mostly now…Prosperity would be both gold and copper if it ever gets approval.
Ahhh … I see.
Im liking PLG alot here. Going to start stalking it again
Loving Mack, TAN, and AKS today. I picked up JO a week ago and plan to hold that one for a while.
JDST, DUST, and DRIP trades looking good. I really think USOIL is starting the 3rd drive to a bottom. GOLD has been going up, and miners don’t like it. 4th DC collapse coming soon.
I don’t get it. Oil recovered today but XOP, GUSH, others got HAMMERED!! I’ve heard of divergence, but this is getting ridiculous. Starting to wonder if energy is even ok to play when we do hit the ICL. Maybe crude will be the only safe play then?
1) Third Carrier now in the Pacific. North Korea risk…….
2) Tax Reform being delayed. (unfortunately)
3) Over sold SPX……wave 4 correction ?
Just some of the reasons I am now hedged with Puts in SPX and need to have “some” exposure to Metals. imho.
Ken, What does your exposure to metals consist of and is it hedged with DUST?
GDX and SLV Call Leaps and a few Jr. Miner stocks.
Thank you.
why US needs to put 3 carriers in the Pacific? what’s the purpose? SPX oversold?
CYTR….taking a little of the table.