
Friday – The Oil Leak
Friday, the last trading day of the week.
Well, honestly the Oil leak that we experienced yesterday was no surprise to most of my readers. I expected that drop and I wanted to point something out from here…
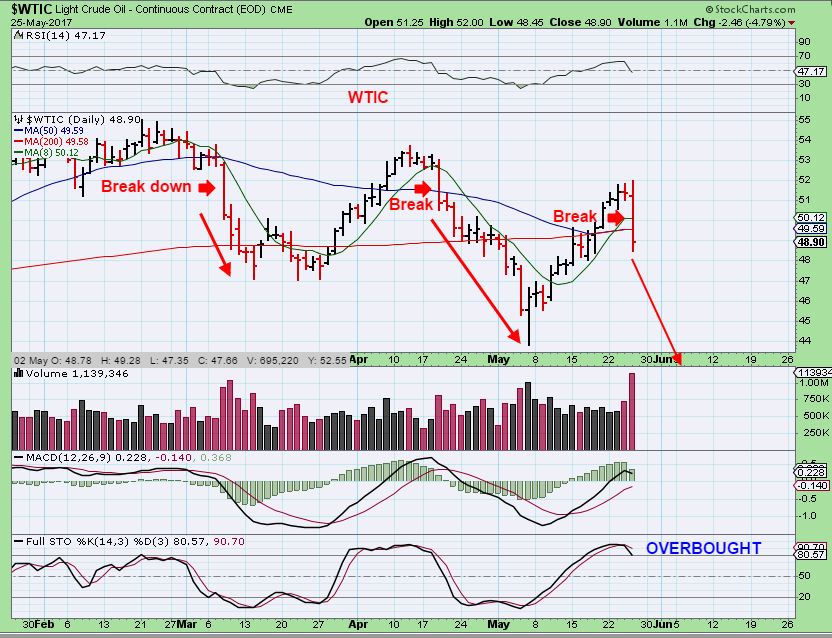
WTIC – This Doji was pointed out yesterday as a topping candle. We had an OPEC meeting that would review possibly continuing with cuts. Could this drop if they agree to continue with the Oil cuts? Yes, it was due and even though OPEC agreed to continue with the Oil cuts, Oil sprung a leak.

WTIC – One thing that I want you to notice is that often when OIL has that one big 3 or 4% slam day ( see red arrow) , it doesn’t usually bounce like many other sectors do the following day. It may bounce intra-day, but often that OIL SPILL just continued to sell off day after day in the recent past. Oil is overbought and has plenty of room to run lower. Thursday DWT, DRIP, DUG, and ERY were all great trades from that DOJI top at the trend line.
OIL & ENERGY STOCKS
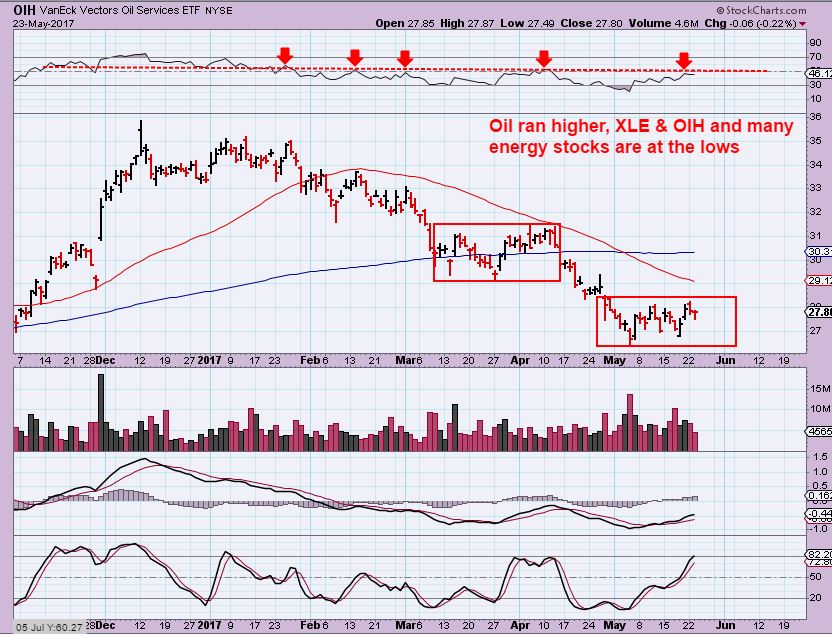
OIH (and XLE) – Almost daily I have been pointing out this weakness compared to Oils rally. The OIL & Energy stocks were just not finding real buying power even though Oil was rising in price.
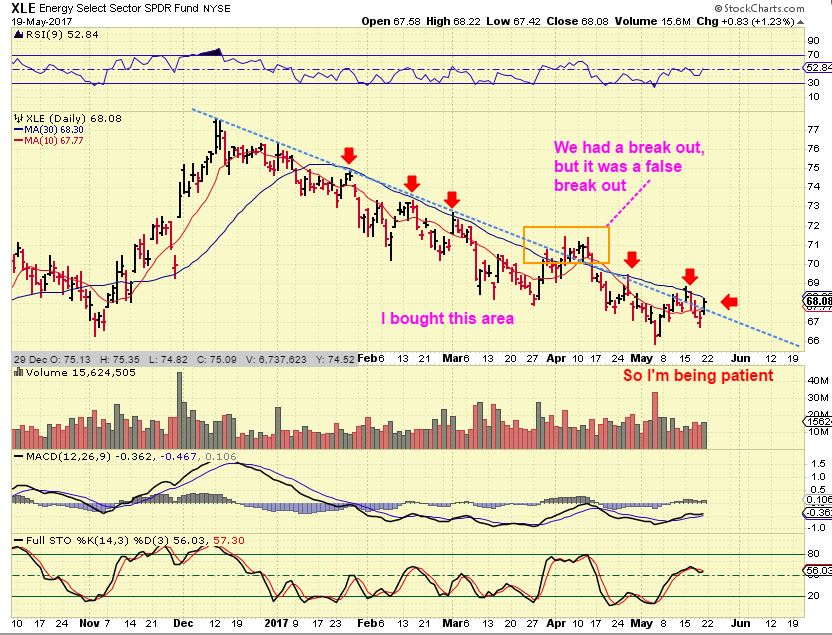
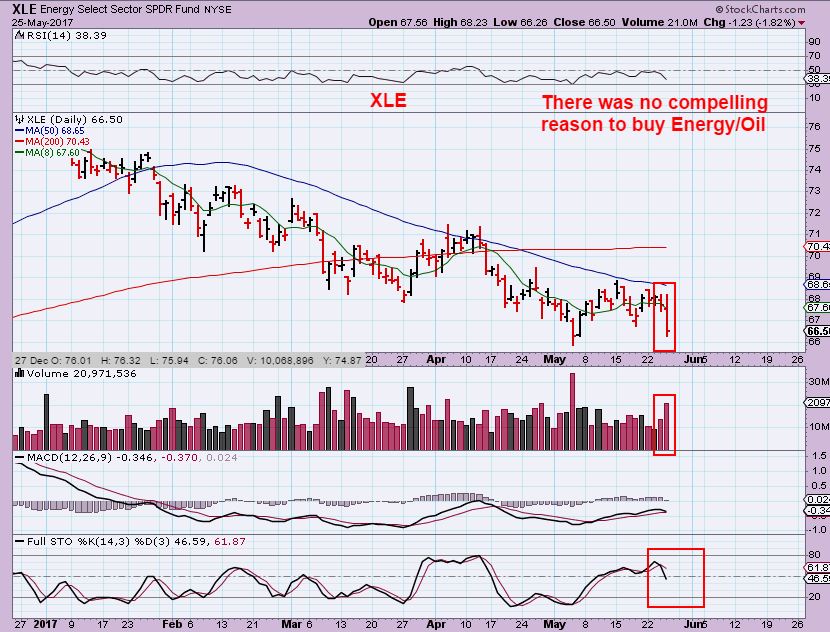
XLE May 19th – A week ago I was showing that the 50sma had capped price again, after a false break out in march. I wrote on the chart that I wanted to wait & be patient.
MAY 23rd– Oil was green, but look at OIL & Energy stocks. This was still warning that Oils rise may not be real. We’ll see how this plays out from here.
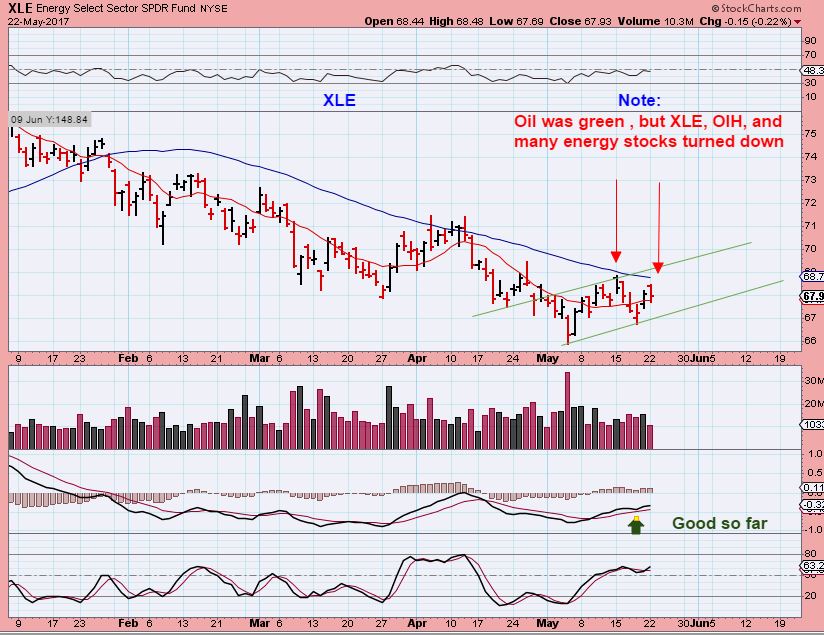
XLE – The XLE dropped basically after tagging that 50sma again, as expected. If Oil itself continues selling down, I want to see how Energy stocks and the ETFs react this time too.
You may recall that I did point out some possible ‘leaders’ in that sector, since they seemed to be acting stronger than others ( ERF, BTE, RES) I said that I was NOT buying them yet, but I wanted to monitor these stronger ones as things played out, since I was anticipating a pull back in oil.
From the comments section Wednesday: Now I want to watch how these hold up.

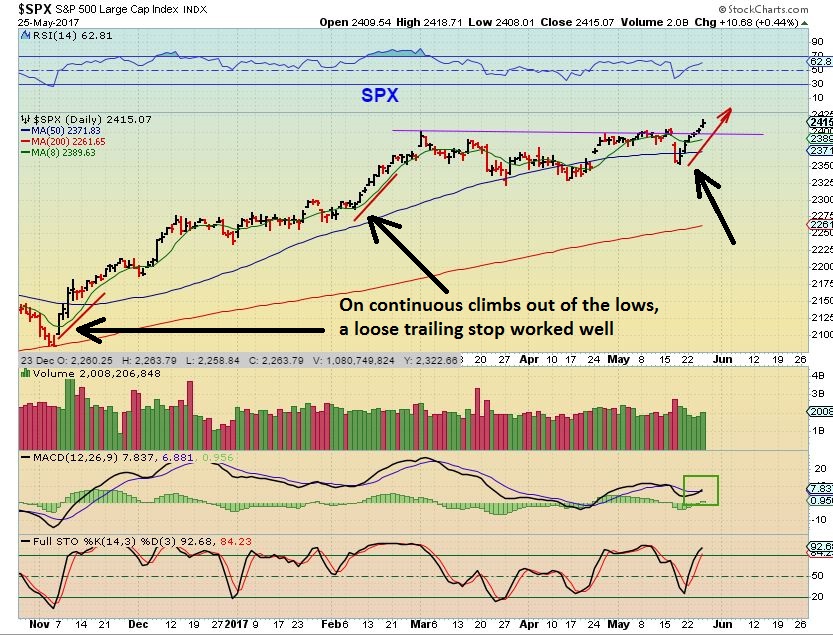
SPX – That ‘slam down low’ cleaned the plate of bears and sellers the reaction upside has been continuous. It is hard to find sellers at new highs. The SPX is breaking out to all time highs, similar to what the NASDAQ did weeks ago. I expected this to slow down and eventually dip down into a DCL, but it is finding buyers after a long consolidation, and that may be the dcl. Most other 1 day slams gradually rolled over, but semi-loose trailing stops work best in situations like this.
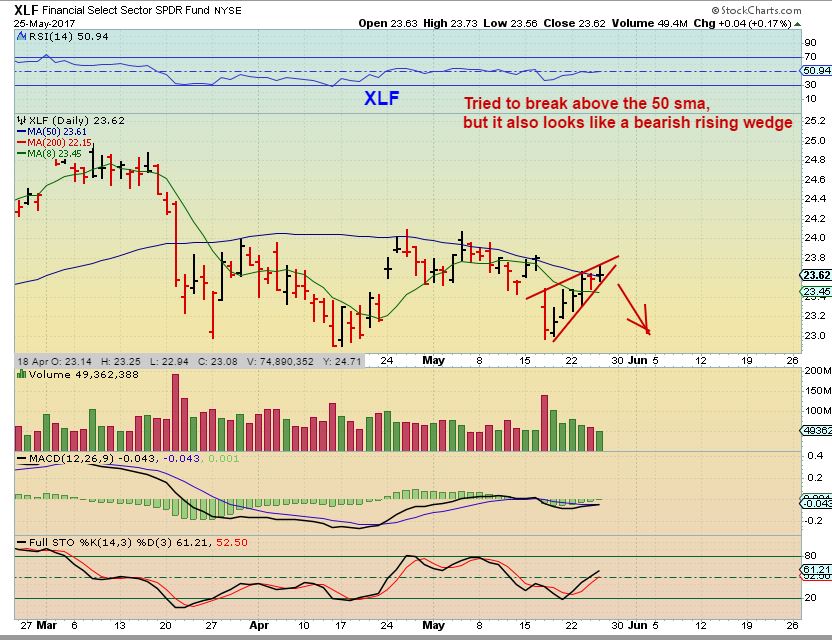
XLF – This still stands out as concerning to me so far. The XLF did break above the 50sma Thursday, but then it dropped back down, so now we see a doji at the 50sma. It now also looks like a bearish rising wedge. The XLF is just not in sync with the General Markets, unless it suddenly breaks out higher.
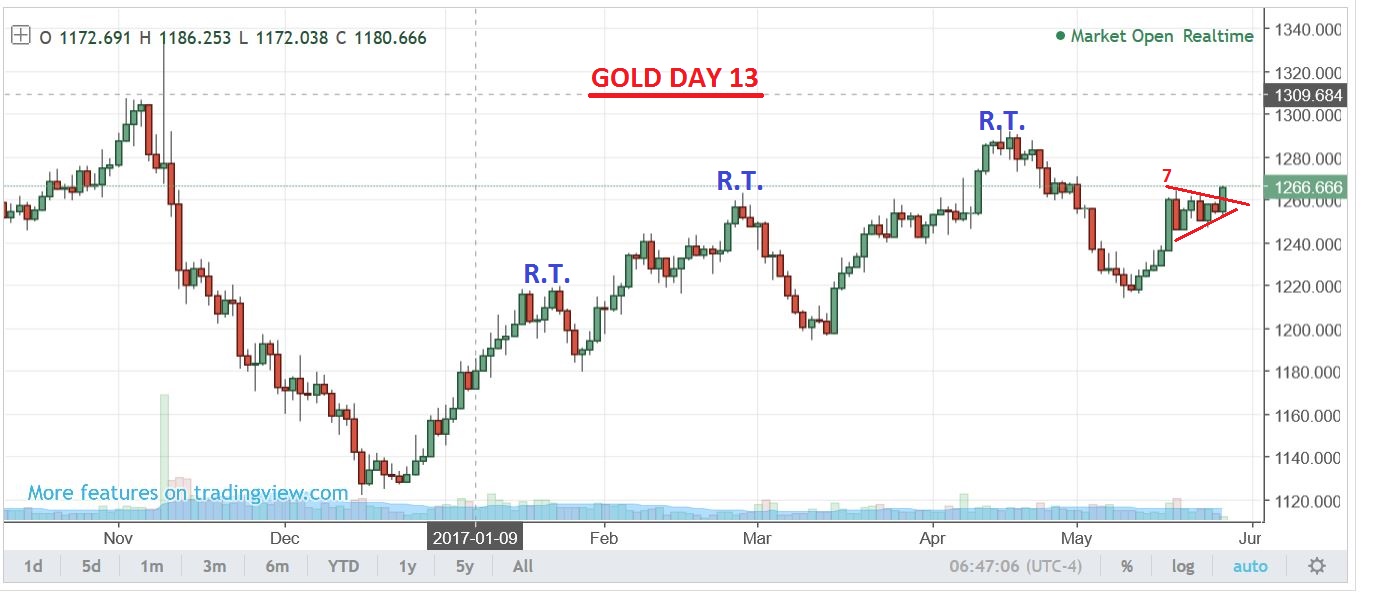
Thursday I also pointed out that GOLD looked like a legit Bull flag here on day 11.
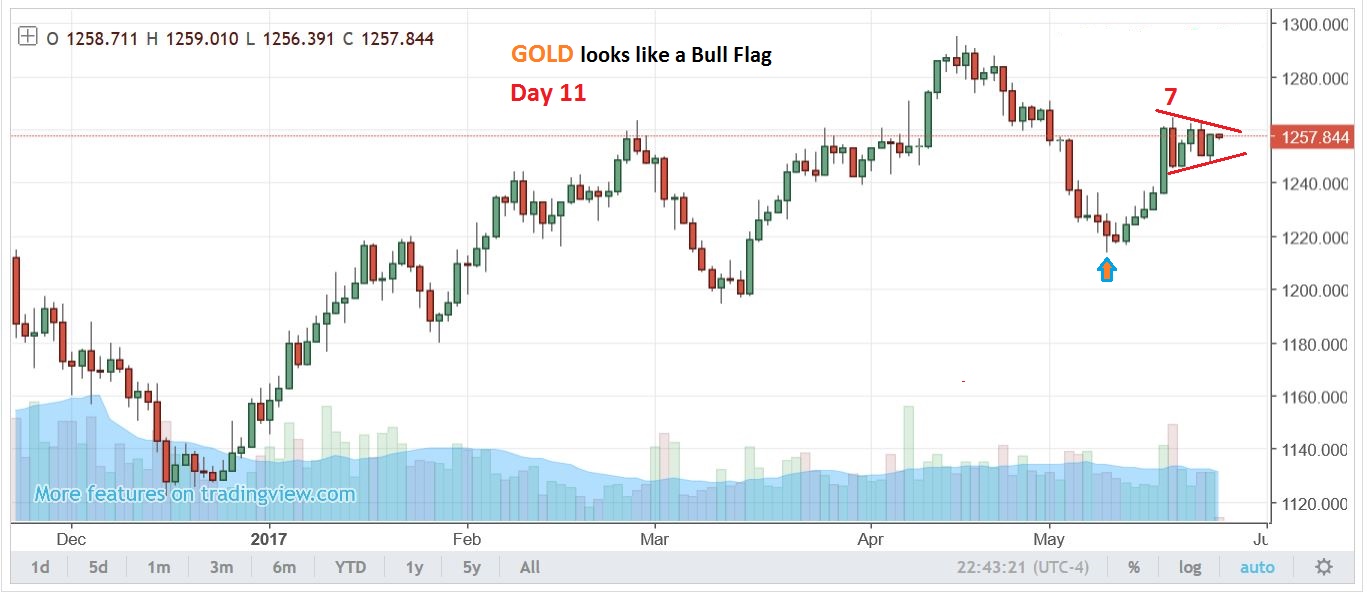
GOLD remained in an uptrend. It is breaking out on day 12. Again we see that GOLD is much stronger than Silver and the Miners. A normal price target here would be $1300, and that would make this 3 R.T. daily cycles in a row, plus another new high in Gold. This would be happening while SILVER & THE MINERS sold off and remain fairly weak? The Miners peaked in Feb and made lower lows and lower highs in March & May so far. We just have to see how GOLD plays out, and how the Miners react to it. This is NOT normal.
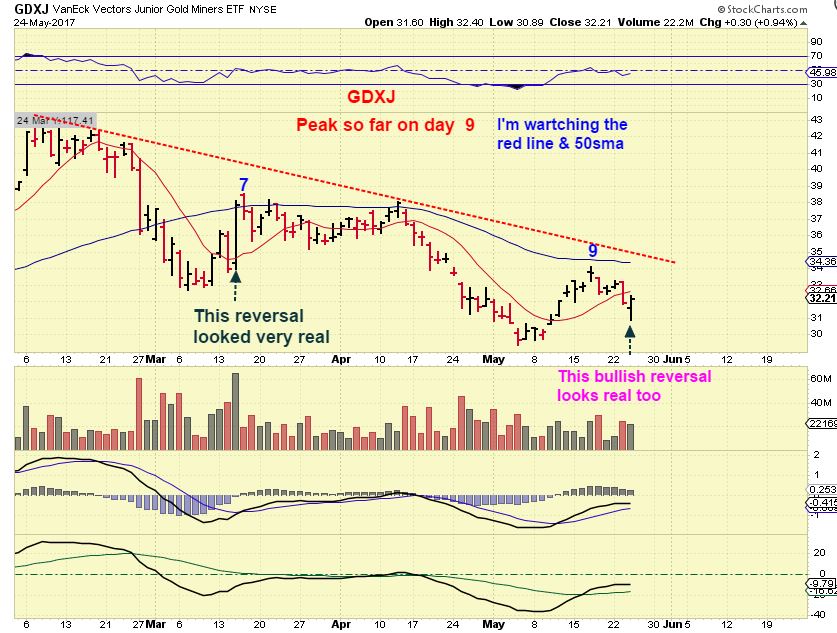
GDX – Lower highs and lower lows, and is in a downtrend. My observation has been that GDX cannot close above the 200sma in a meaningful way. GDXJ cannot close above the 50sma in a meaningful way. IF THAT CHANGES with Gold breaking to new highs, we will conclude that it is bullish and have to react to that. I was being patient and haven’t gone short yet. I said that I wanted to wait for a possible tag of the 50sma area GDXJ, and 200sma GDX. Anyone that went short ahead of me should have their stops in those areas. If Miners do not react to Golds rise, it could be a fake bull flag break out? These charts were from yesterdays report and show those Moving Averages.
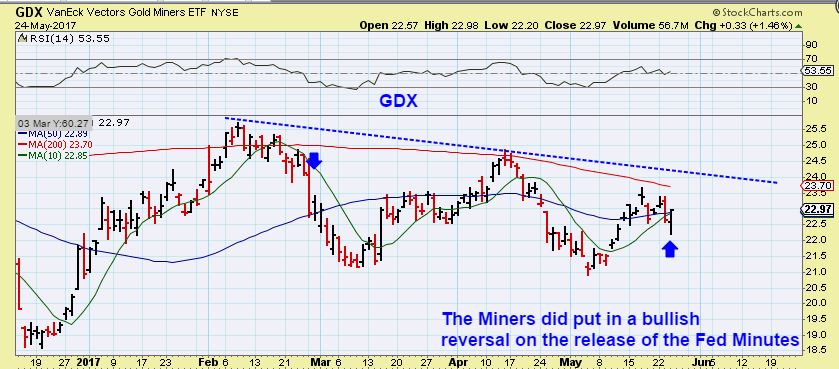
You can see that a similar sideways frustration occurred in the last daily cycle. This is why I wanted to be patient and wait before shorting the miners. GDXJ closed above the 50sma on day 26, but still did not make a new high! It remained L.T. We’ll see if the 50sma & 200sma still hold down the Miners.
In yesterdays report, I went through and pointed out with several charts that various Miners are showing pretty big ‘differences’ at this time. It is as though they are all telling a different story. Some were near the highs ( RGLD, GOLD, ETC) and many others are still near the Dec ICL lows. Some look awful, others look fine. Yesterdays report covered this in detail, if you need to go back and see what was discussed there regarding Miners.
.
Friday is the last day of trading before a 3 day weekend in the U.S. markets. Obviously there will be a lot to cover in the weekend report. The last daily cycle in Gold was actually around 41 days long, so to be Left Translated, Gold could even peak on day 13, 14, 15, etc. That said, Gold should not be allowed to make a new high above the April highs here. So far GOLD is in an uptrend with higher highs and higher lows. Silver and Miners definitely are in a down trend and they are weaker. From the looks of Silver & Miners, this move higher by Gold has been a solo act at this point. That is very different from normal expectations, and reminds me of OILs rise without the energy stocks. We’ll see what Friday brings our way. Enjoy your Friday trading and have a great weekend.
.
~ALEX
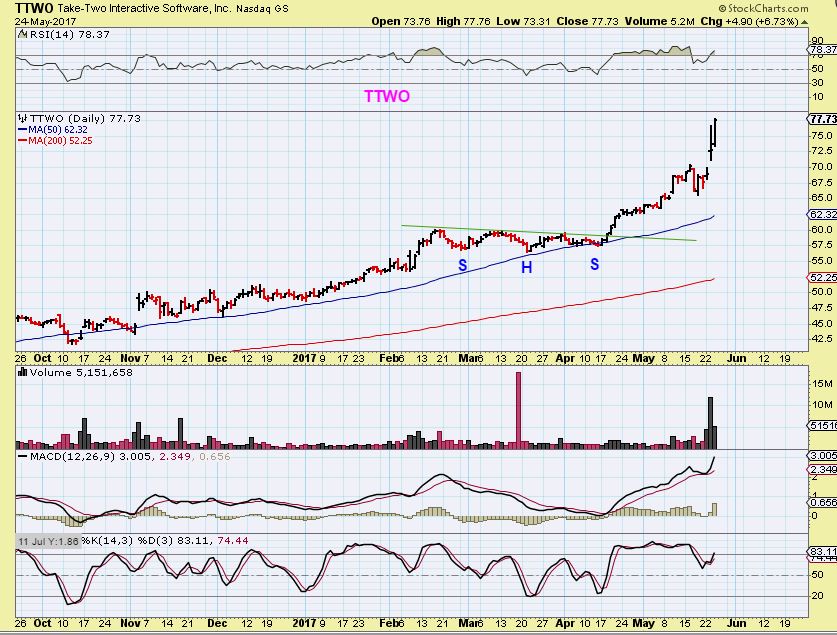
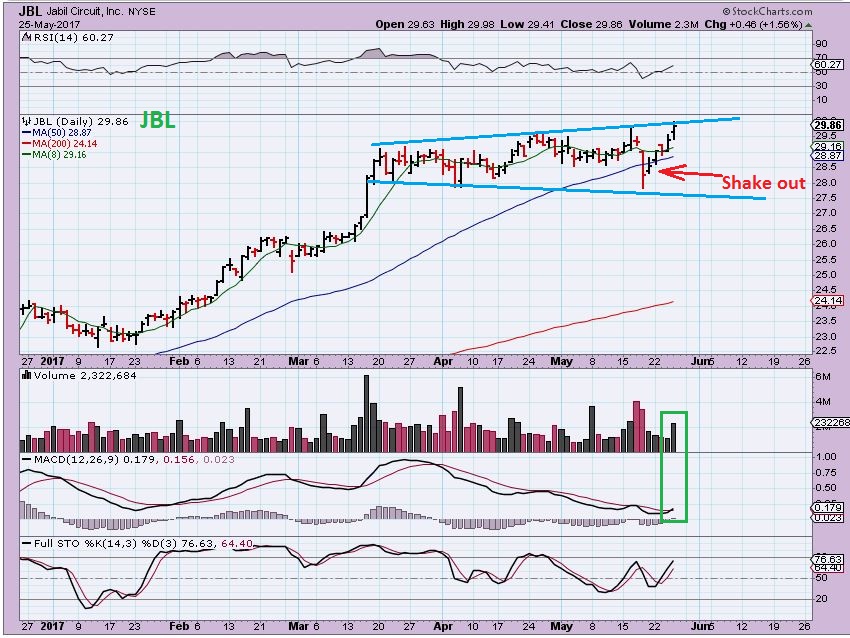
Yesterday I showed JBL and compared it to TTWO. I said that it looks ready to break out after a shake out below the 50sma in a similar fashion. Let’s review.
TTWO _ April 20th, The break out in TTWO was pointed out.
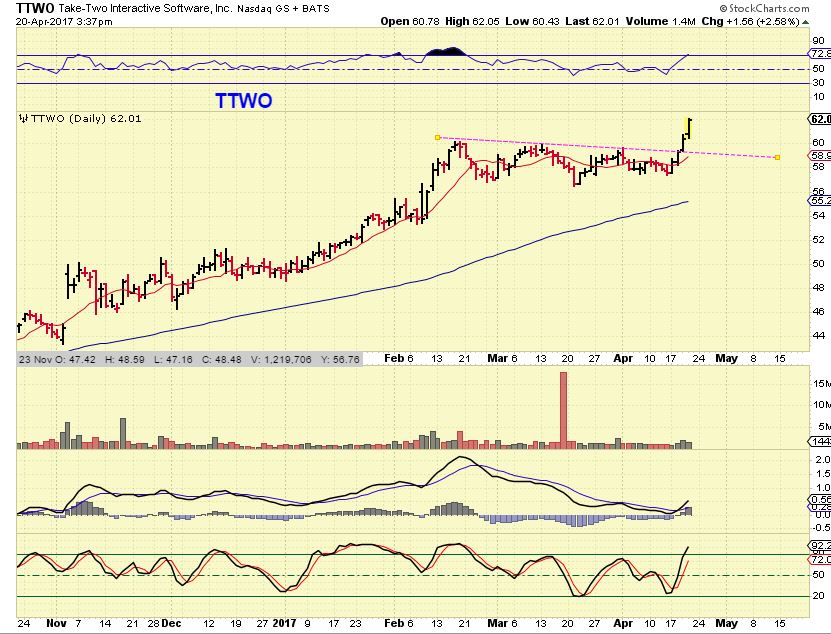
TTWO – The solid follow through $60 to $77, about 25% in a month.
JBL – Yesterday, I mentioned that with this long consolidation, it could be a break out after a ‘shake out’ at the 50sma. Is it time for JBL to run?

JBL – So far, so good, this may be ready to run like TTWO has. I’d put a stop below the 50sma, because it should not go under that point again after that shake out.
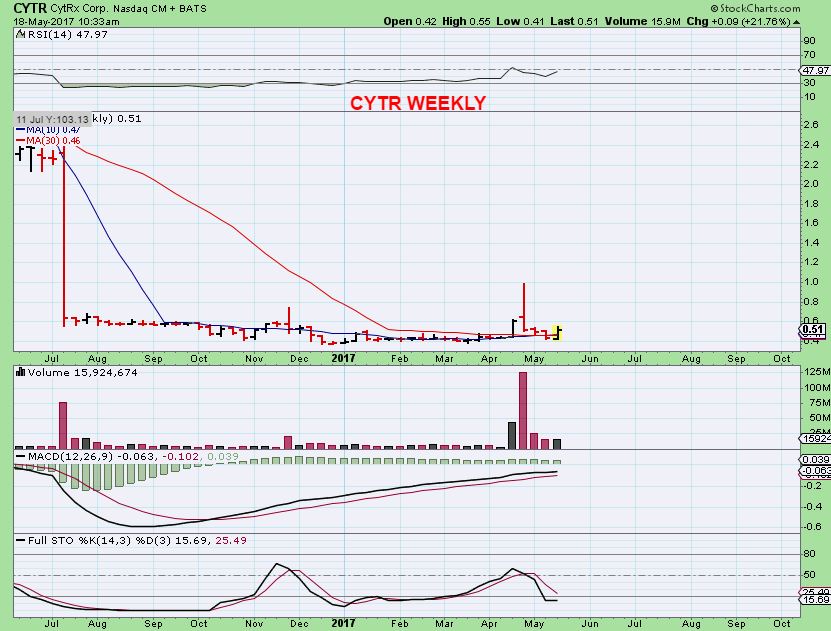
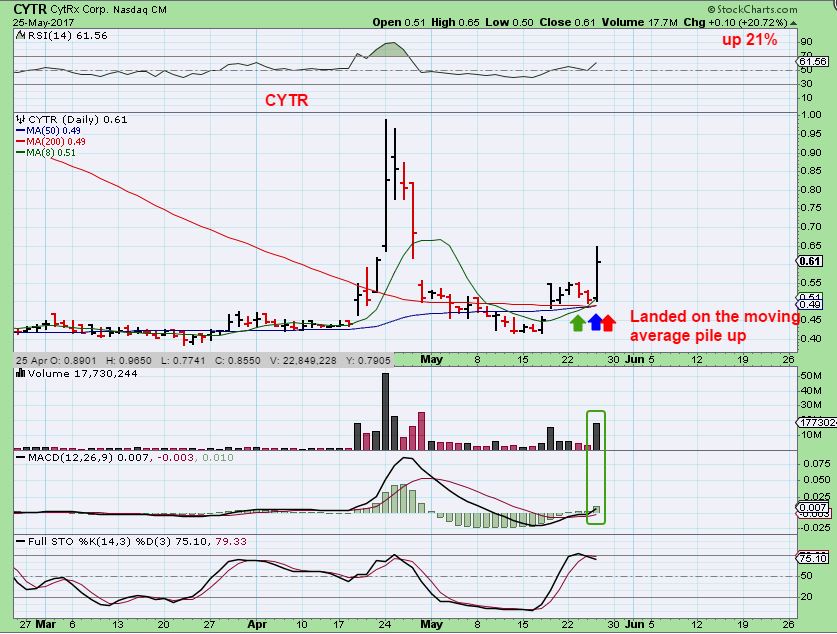
CYTR – I liked this base and Bought it at about the $0.48 average area, and posted it real time in the comments and in the next days report. I was asked about it in the comments section 2 days ago and I said that I am still holding it. I like this set up.
CYTR – Notice the 10, 50, & 200 sma are all piled up together and acted as support. That is usually bullish and this surge was 21% on Thursday. They are releasing news next week that could affect this stock Bullishly or it could sell off ( sell the news?), so be aware of that. If you bought this with me, you may want to sell a partial if your position is sizeable.


The triangle breakout on GOLD has happened on a negative TSI divergence on the 2 hour – something to monitor. Unless there is something coming this weekend we don’t know about that will impact GOLD positively – with the Dollar looking a little more firm this week – this maybe GOLDs last hurrah. And what a great way to suck in longs right before the weekend and then kill them on Monday. I need one of those crystal balls
Agree – something to watch. I have seen false break out in Bull flags that do exactly what you are saying…people see that break out and just jump right in leveraged long expecting a strong rally. This sideways stuff is dangerous to jumpy traders.
I will admit that Gold is up-trending and it looks very convincing, but “All things considered”, the Miners peaked in february and have made lower highs & lows, still stuck under major moving averages tec… It MIGHT be the perfect area to short miners in the coming days.
I think that the end of today will tell me a lot.
I’m not buying this move in gold. US Dollar looks primed to move higher here. The USD just finished a three drives pattern. TSI is crossing positive and %R is oversold and curling up. https://uploads.disquscdn.com/images/41770d7fd2f49c5657d0c457d3cb80ac5138fd7e0d0a038a357a6f0b2faac021.jpg
Yeah, I think you’re on to something with the dollar here. Unless gold and USD suddenly want to be friends and ride up together.
For the last 5 months I’ve wanted to wake up to a $10+ pop in gold. And now that we are getting to the end of this intermediate cycle it wants to play. Ugh.
This^^
Bounce this ^^?? I can only imagine……..Lol
Ya, it looks like Gold and USD moving higher together? WTF.
Follow the Yen…..
Good advice. Yen rolling over on the hourly
Agree. Few buyers in miners due to imminent low in USD. However, IMO, gold will continue to go up with the rise in the dollar, and then we will see the miners take off. My expectation is that the stock market will top soon and gold will really take off at that point. Time will tell.
yep me either Bill. Looking for higher low on macd and higher tsi for dust for signal…..gdx:gld…etc…. when this rally ends expecting body slam back to 1214 or lower….then big guns up.
Way to Rock Out CRUDE CF …. you have the most AMAZING Crystal ………..
*oh, nevermind…. 😉
https://uploads.disquscdn.com/images/39627e79ff831016e779090ede4c84914864dcce7b7ef14a18c69717d4def106.gif
wonder if Ken will speak to us.. now that he’s famous (gets a mention ‘above the line’!) 🙂
no doubt … he’s sittn back sippin his java right about now ….
Nope….above you both now. 😉
I want my crystal ball back now too Maria……good thing I kept the owners manual. 🙂
well.. i was gonna say you were rubbin … it .. BUTT … ;o)
your wish is my command… ;o)
https://uploads.disquscdn.com/images/0097bdc3a825b6d26dc2a4326324d8ae08419a9833cde0fac66aa9ef5266c5f9.gif
Oh man you brought me back to my childhood…what was that show ? Genie in the Bottle with Barbra Eden I think ?
I dream of Jeanie…. I WAS her in my daydreams.. lol
her and Bewitched… wish I had a dollar for every time I blinked & TRIED so hard to make it so…..
LOL…..thats it.
I wanted that bottle in the worst way… lol …I even remember asking Santa for one one Christmas.
Good memories. Who played Bewitched?
haha Elizabeth Montgomery… i can still “see” that on the tv screen…
Me too !!
Her husband ? always got in some sort of trouble lol and she would always save the day…..
If anyone had BAA, they just did a 1 for 10 share “consolidation”.
Thanks
Baa??????
CYTR – Very big volume for 20 minutes of trading.
Yea…I reduced exposure this morning and took some profits off the table.
I do not know how you sleep at night sometimes CF with these Pharma’s……. 😉
Excellent trade btw……thx.
Sleep? What is this thing they call sleep?
I actually HATE trading biotech / pharma for sure. I dont dare to hold more than 1 or 2 at a time.
Although that CGIX 6 month chart kind of looks good again on that 50sma ( Low risk). I am out of VSTM 🙂
You NEED a holiday……Oh Wait.. 😉
I was looking at CGIX this morning she keeps dancing on the 50.
Actually, yes, vacation I was able to sleep a bit more …
CGIX is moving along that 50sma, and it is even rising along the 10sma now sideways….but I havent taken a position. MAYBE if I see a sign of strength that isnt a huge gap up, maybe then I would enter for a trade.
Miners are not buying todays break out in Gold. They are almost begging to be shorted.
Very confusing. I can make the case for a Bullish Pennant on JDST 2-hour with a measured move to $96.
Are you taking it?
Not me, right now. I’ve been short OIL & NATGAS- Thats enough for me to watch closely
Are you shorting?
I’ve been short OIL & NATGAS- Thats enough for me right now
You Still short ? I am flat on Crude.
I stayed short
USO or OIL over the 10sma I’ll close shorts . A back test could happen & be normal .
I totally missed where you said you went short oli and natty
REFRESH:
I am not always able to mention every trade that I take, and I may also not be recommending it to subscribers, because ‘shorting’ is more difficult for many ( Myself included). So I dont mention all of my trades, and I was also not in the comments section all day, I had some appointments to take, but … In my reports for weeks, I have been calling for that drop in Oil when it gets to that trendline. Then in a report this week, I pointed to a doji at the top of Oil run on the attached chart, and also at trend line resistance.
That would be a very low risk place to go short , because the failure of the trade would be a break out.
NATTY I ‘m not sure how you missed it, but again, I was not ‘recommending’ it for everyone, because shorting isnt for everyone, but I said that I no longer wanted to take a long position with the COT smart money short and a POP down that we had on that day. Hope that helps.
https://uploads.disquscdn.com/images/febb683cd6603bbacc597f385b53b613fde5da186405ebc95462e111ca0aa6f7.jpg
I probably should mention that when shorting, I also do not know if I will hold for a day? 2 days? 3 Days? And the reason is that I am usually shorting with a leveraged ETF ( UGAZ, DWT, GUSH, ETC) , so I’d hate to say that I went short, sell it later that day, and have some holding it for days. I kind of hate recommending 3xETFs.
I am looking at a possible JDST, but I don’t want to hold too much crazy stuff, it gets too hard to manage mentally.
yeah… not that i want to follow u … but just knowing that you also hopped in …. makes me sleep a teeeeeeny bit better ;o)
😀 https://uploads.disquscdn.com/images/7d0433bde665426a16a7ed8c9782a2593cc18057782f1609430d87b571239d37.gif
any still holding MACK?..
dividend is due today..
why lots of selling?
Just found it. CFO resigned overnite to take a new position, but really, 8%? Whatever. Also, I let myself get shaken out of BRZU instead of watching the big picture, I concentrated on the wiggles. Grr… I’ve been stopped out of like everything this week. Horrible. Ugh.
Screw you Marrimack Pharmaceuticals! Screw you!
BRCX gave back all of yesterdays gain and then some this morning……these Pharma stocks are dangerous !
CBIS has an interesting chart, but I cannot be sure that it is ready to go yet or not.
I like the weekly too, but it needs to close over 8 cents to draw me in, IF I want to take that trade when it happens..
JDST is making a series of new highs on the 15 min. Still ascairt to add though without seeing gold back off.
I was hoping for maybe a 10% JDST/JNUG day. Not sure 4% is worth adding to with gold still strong. If going to add risk, need a better price to do it at.
GDX “should” correct ……. just Not sure how deep.
I am Not taking the trade though……….
NAK dropped to the 50sma ‘kind of’ and reversed and is holding up.
Maybe that is it for the eanticipated drop?? ( Please). 🙂
I was kind of expecting the 200sma tag, but I could do without that.
Again, I kind of like what NAK is doing here so far.
a move above the 10sma ( And close there) would be encouraging.
Lower trend line down around $1.52.
Hi guys,
Been lurking in the background, not much going on.
I did look at some long term charts (monthly, 7 years) on the PM’s
Waiting for an upward breakout.
The only ones that have broken out are FNV, RGLD and I think for a regular miner KGC.
Otherwise the others look like they are still under a downtrend line.
Another shakeout certainly can’t be ruled out but I think by the end of the year they will be much higher.
The current lack of movement based on gold’s strength probably argues one more shakeout short term which is exactly what Alex has been saying for awhile.
Tick tock………..
I actually LOVE the looks of many of the monthly charts, even GDX.
As you said, Tick Tock…. When they go, we’ll be making great money
JNUG 4H chart has a feel of last December about it… last little flick-up, before final drop
https://uploads.disquscdn.com/images/10bd3f65b87df31b775cf184b8b66aeeb25794cdf5dcdea19be22b1a7994c4fe.jpg
I hope! Holding my JDST over the long weekend.
me too.. just small amount, mind you
Seeing the left hand side of that chart brings back bad memories… it did lead me to Chotfreak though, which is nice.
LoL.. no doubt many here have been forged in the fires of previous bad PM experience
i def have a tat on my A** ..
oh .. wait .. u talking about jnug? hahahah
pic.. or i don’t believe ya 🙂
#trueStory
*it says .. “cantBTamed ;o)
meeeeoooww
: ) Thx – Let’s relive January again ( Better yet, Jan – Aug 2016 I hope)
https://uploads.disquscdn.com/images/c47d728553e2c4692c6967081e43f0ce95c834caaaaad59eca389000ee9f930a.gif
MACK down around 10% any updates?
Cason wrote about it below
Thanks Alex. Currently I don’t have position looking for starter
That’s an ugly candle and broke the support of a simple back test of the break out from the base. I would hold off and not take a position until it reveals a bit more of what is going on.
Refresh – it is at the lows now actually, lows of that base.
https://uploads.disquscdn.com/images/aeddfb9a31f4c278ff66c48fdad9d26eef0f69d152c66f506d50abec36b74d2c.jpg
Noted, thanks for the updated. I will and watch for the upturn to jump in.
Really needed to have sold that one. Day after day just kinda bled out. If I had stayed more disciplined would have sold 1/2 on that big pop. What’s that stock market saying about pigs get…?? :O
it’s coming back. 🙂
Am about $35 down on my original entry… might just play safe & bail here for now.
Another ‘Grand old Duke of York’ case.. shouldve followed my own technicals, & got out jst after the peak 🙂
Staying all cash till next week…would love to short GDX but will wait for green light from CF. Anything could happen over next 3 days. I’ll sleep better. Enjoy holiday and all be safe.
CF- an old favorite of mine, NOVO Resources NSRPF looks to be starting to move off a nice base with larger than normal volume. Any opinion on an add to an existing position here?
Hey Bob – Sorry , I went away from my screen for a lunch break.
It does look really good, but once you get a pop of 14% out of a base, it could just keep running, bull flag, or drop. I have no way of knowing at this point.
Its kind of like CYTR right now. It is getting a 2nd day of follow through, but yesterday I couldnt tell f it was just going to bull flag or keep running. Sometimes I add a little to my position just to own more, and if it pulls back slowly, bull flags, etc – I can add more. If it keeps running, at least I had a little more.
The weekly chart looks good ( Stalled at the 50sma on a weekly last time, maybe ti goes there again?)
Thanks Alex- I have had 20K shares at .75 cents for 5 years, never sold because I believed in the story. But would like to make better use of that money trading something else.
did anyone notice NVDA’s highest price for today is 145.28, but you cannot easily find when it happened?
I actually see one of those phantom spikes when I look
I see it now through TD Trade Architect. I really want to buy NVDA, but it’s keep going up.
Have a good 3 day weekend everyone!
bye Nancy
have a great .. safe .. long weekend All :o)
et tu M
the biatches be cray, just down the road from me at the mo!
CYTR closed at the highs.
This intraday chart was what I was looking at with my OIL SHORT… DWT.
It did break out at the end of the day, but we’ll see if there is any follow through next week
OIL looks like it took 1/2 of that down day candle back, and that is usually short term bullish for Oil, bearish for my short position, but I held on to it.
HAVE A GREAT WEEKEND EVERYONE, LONG WEEKEND IN THE U.S.
refresh
https://uploads.disquscdn.com/images/c0d8ee0c2025aabb2f8ee689c2385abb05f72f1958df7a8a49a0596b0e62112f.jpg