
Fed Follow Up Report
Honestly, there was little permanent reaction when the Fed decision was made known, but we can’t say that a lot changed. Expectations remain the same, so lets review these markets….
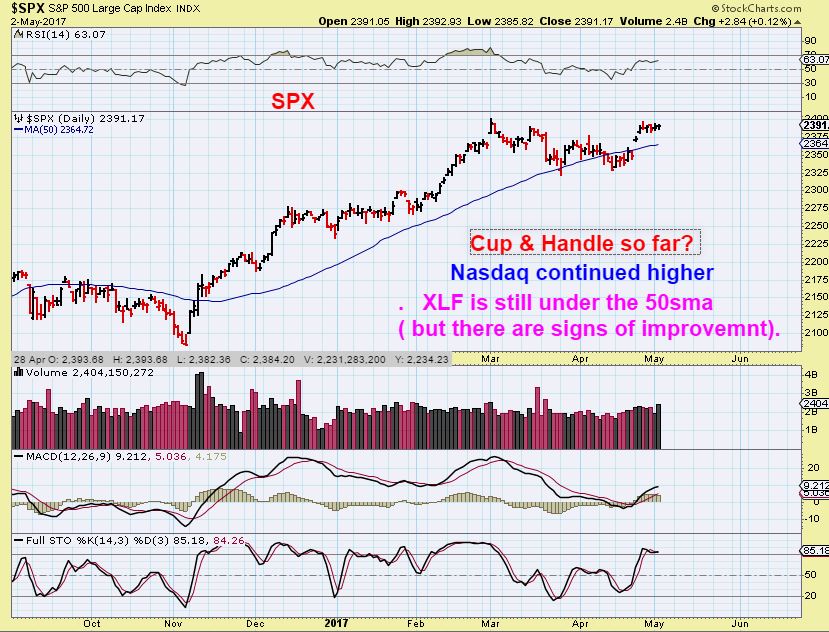
SPX – This was in yesterdays report, please read the chart. Also the signs of improvement in the XLF continued.
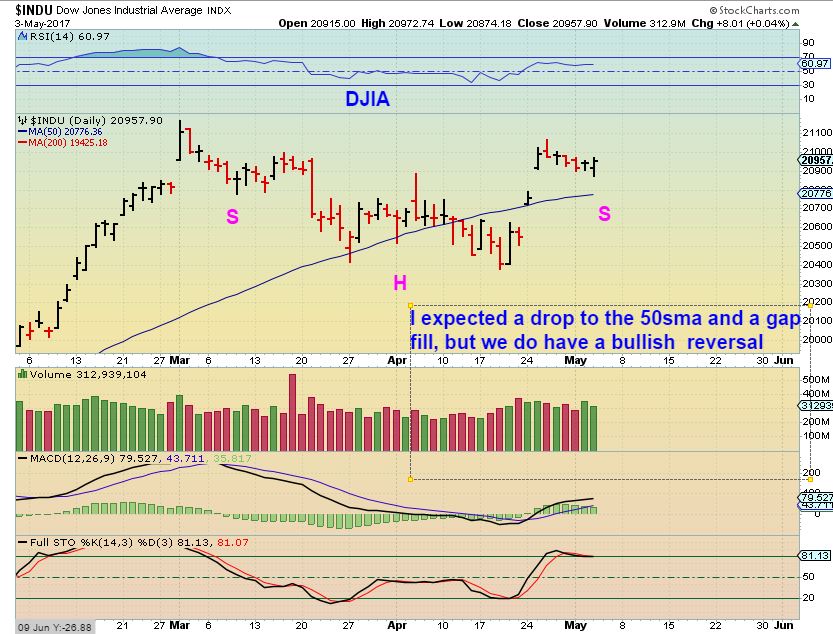
DJIA – I expected a dip, but this reversal after the Fed may have follow through upside. This consolidation could be forming an inverse H&S.
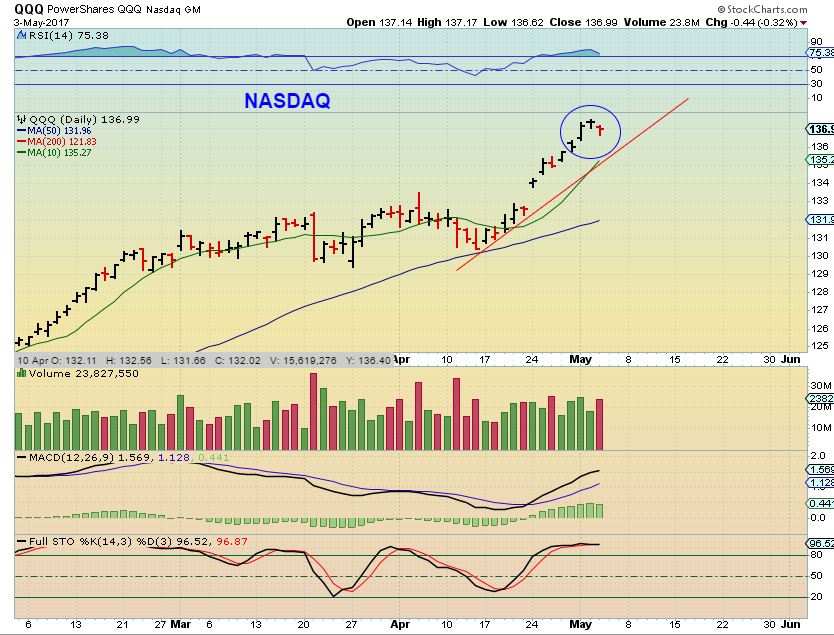
NASDAQ has been the strongest. It actually may have put in a swing high, but they did buy it back up into the close. Earnings is still playing a factor in the individual stocks, with some gapping higher and others breaking down. FB & TSLA released after hours yesterday and both dropped a little in after hours.
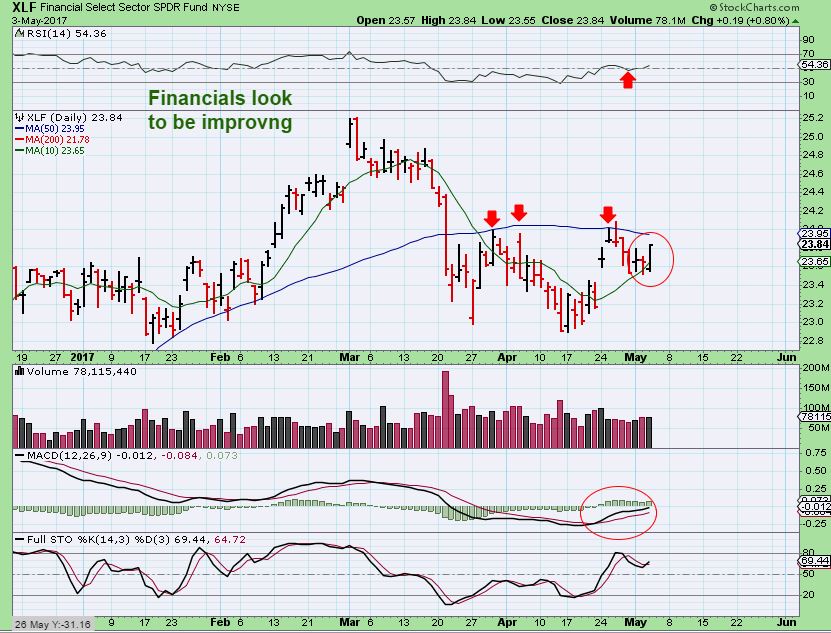
XLF – I have been concerned with the financials when they broke down below the 50sma and could not recover. I am seeing slow improvement, as mentioned yesterday.
NASDAQ – Will the Nasdaq sell off a bit with that reversal? If so and it does remain in a strong uptrend, these are the various areas that it usually falls to. At times it rides the upper line of the band. Dcls break to the lower line (Blue arrows), ICLs break through and recover, but it usually rides the upper line. So a drop to back test the break out could occur when we drop into the next dcl.

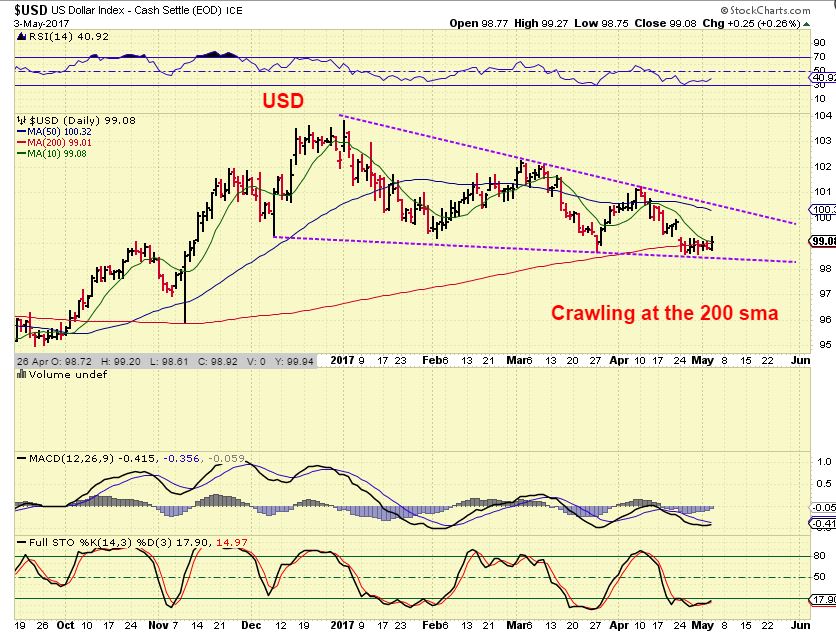
USD – The USD continues to crawl along the 200sma. The FED DECISION propped the dollar up, but it has been trapped inside of this downtrend and we see lower highs and lower lows each month so far.
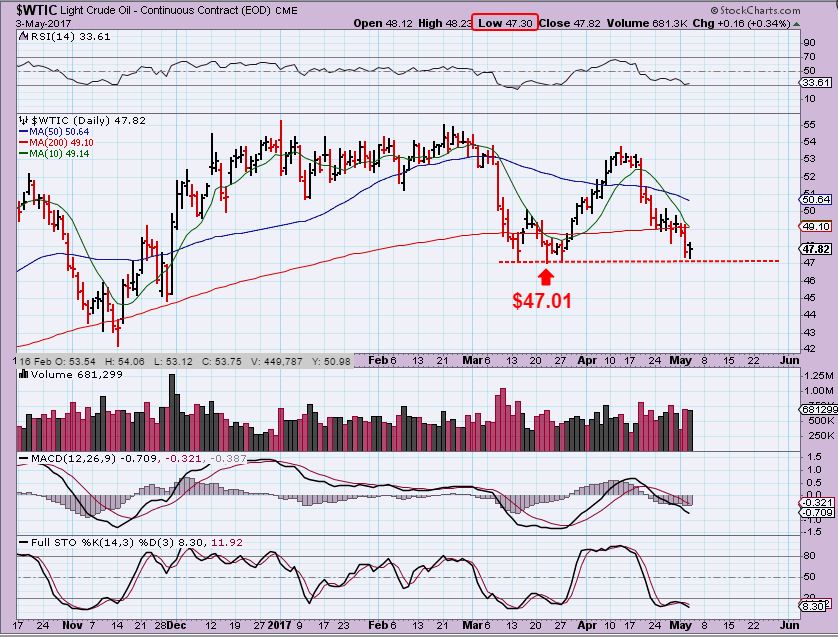
WTIC – This was in yesterdays report. I was wondering if the lows would break from March. Yesterday, those lows still did not break.

WTIC – I am watching $47.01, but I noticed that some Energy stocks seemed to hold up well yesterday when Oil initially sold off after the inventory report. After that, Oil also reversed higher. The selling may have dried up now.
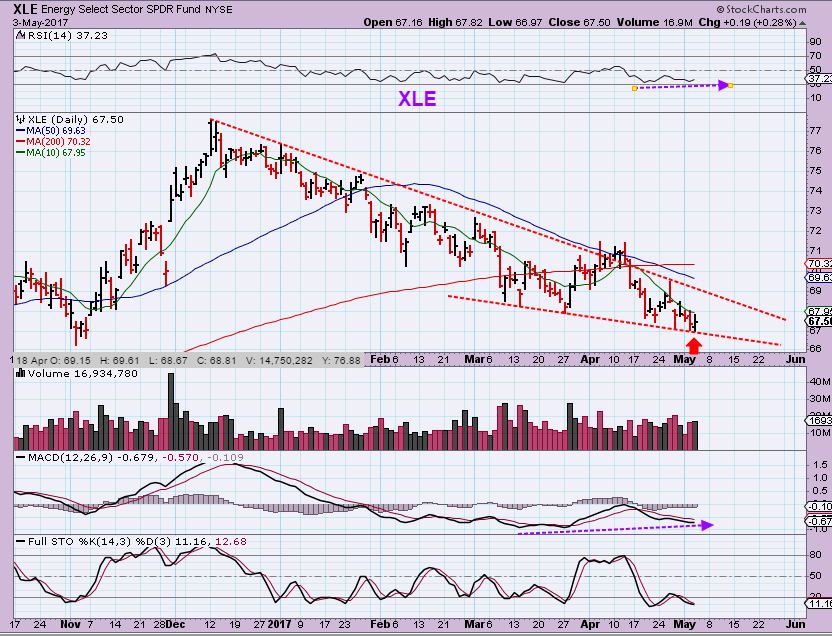
XLE – I am finally starting to see bullish divergence in the XLE.
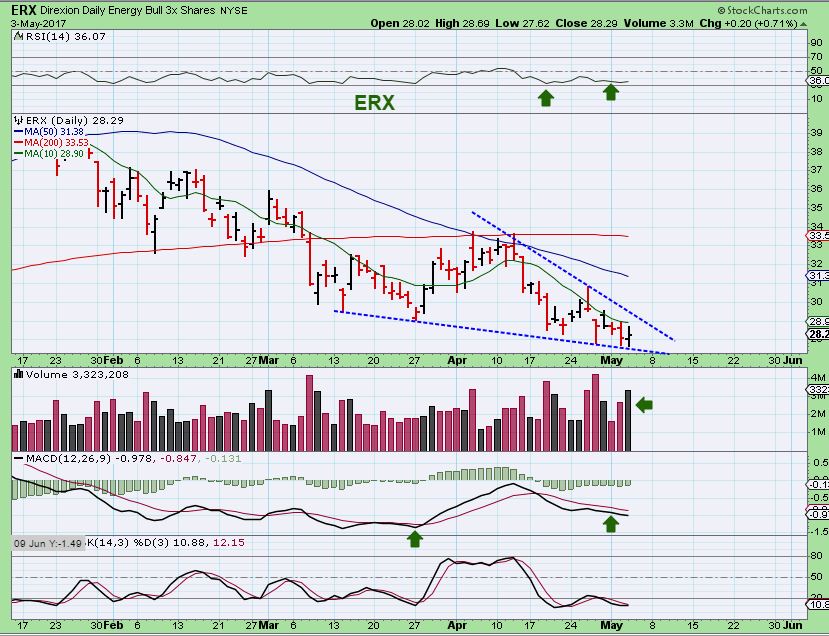
Ray sent me a chart of the ERX asking about a possible falling wedge, so I drew this one up. This does look like it wants to break out higher.
NATGAS – I have been saying that I want to go long NATGAS again, since the first trade went well off of the lows in March. I was asked why I haven’t taken that trade yet, if I think the lows came in on APRIL 18. It is due to the consolidation . I may take that trade after the inventory report today if it remains bullish, but this is the reason why I haven’t…
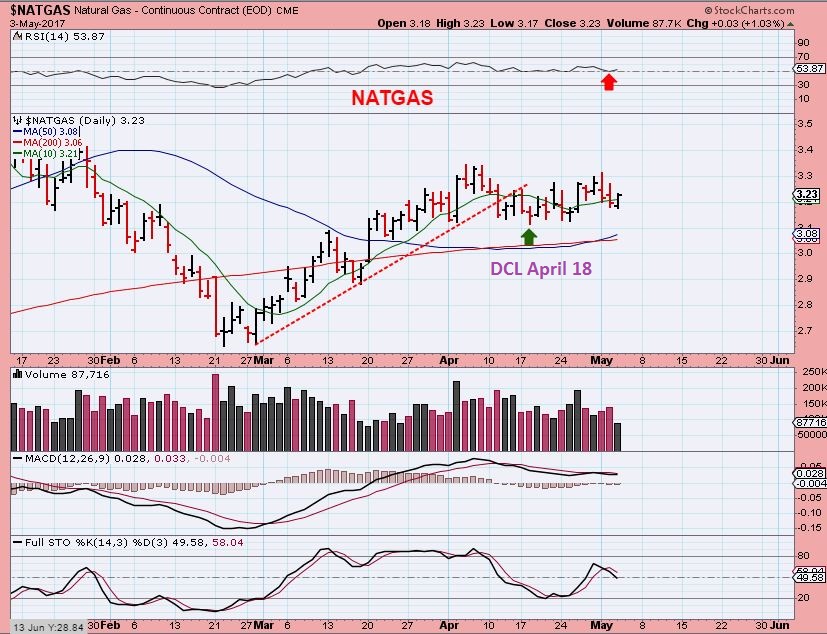
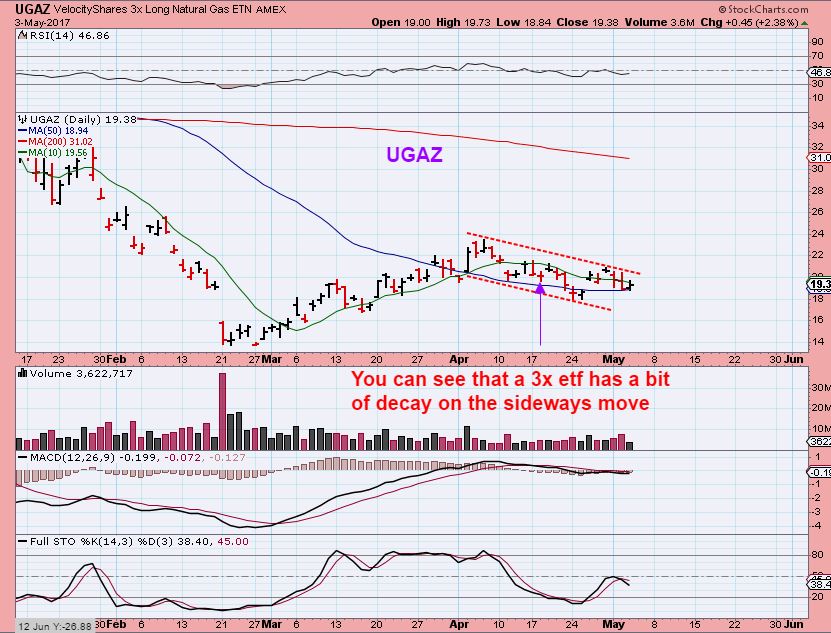
My trade is going to be leveraged, and in sideways consolidations like we have had in NATGAS, price decays. I saw a consolidation forming. Look at the DCL on April 18th in NATGAS vs UGAZ. UGAZ dropped well below that DCL. I haven’t missed a thing , except for maybe losing sleep if I bought it back then , when it didn’t quite look ready to go. UGAZ & BOIL now have filled their gaps, and Natgas may finally be ready to go.
GOLD, SILVER, & MINERS
It is odd, but GOLD , SILVER , and MINERS actually all have taken on different characteristics throughout this intermediate cycle. Remember how BULLISH GOLD was, with 3 R.T. daily cycles? GDX was strong enough to break the 50sma and reach the 200sma, GDXJ was weak, and couldn’t even recover the 50sma. Well his report is going to show something odd with the Silver set up too. They all seem to be acting in their own way. Lets have a review…
GOLD –
GOLD from yesterdays report – This was an example of Gold dropping below the trend line and then the bounce into the 4th daily cycle.

Gold sold off a little, but it didn’t break down through that trend line ( yet), it actually landed on it so far. Not a HUGE down day for a Fed day, so a normal drop into this dcl seems to be taking place. Notice the March drop day after day – it is best not to keep trying to catch lows in a sell off into a DCL or especially an ICL. Please read the chart.

Now I will discuss what I was talking about with Gold holding up well, yet Silver has taken on a much different look now.
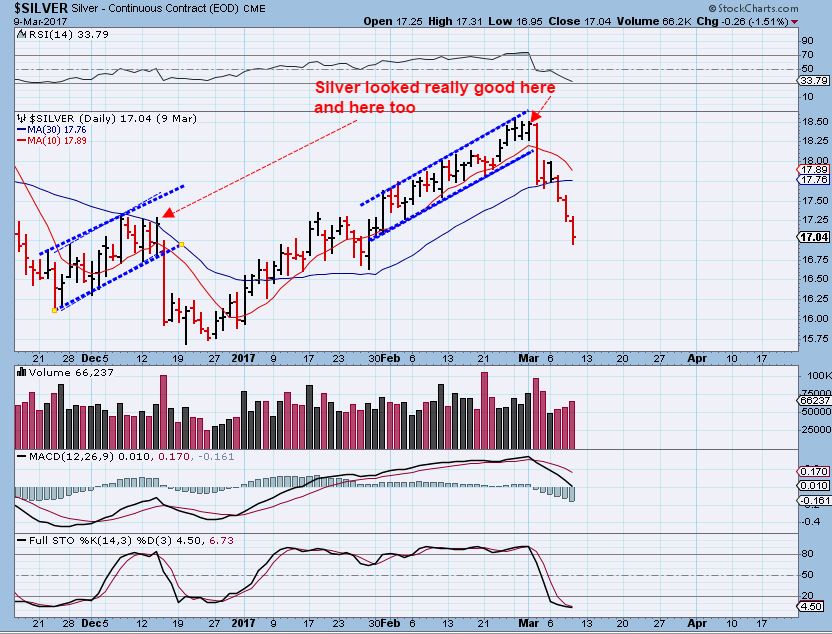
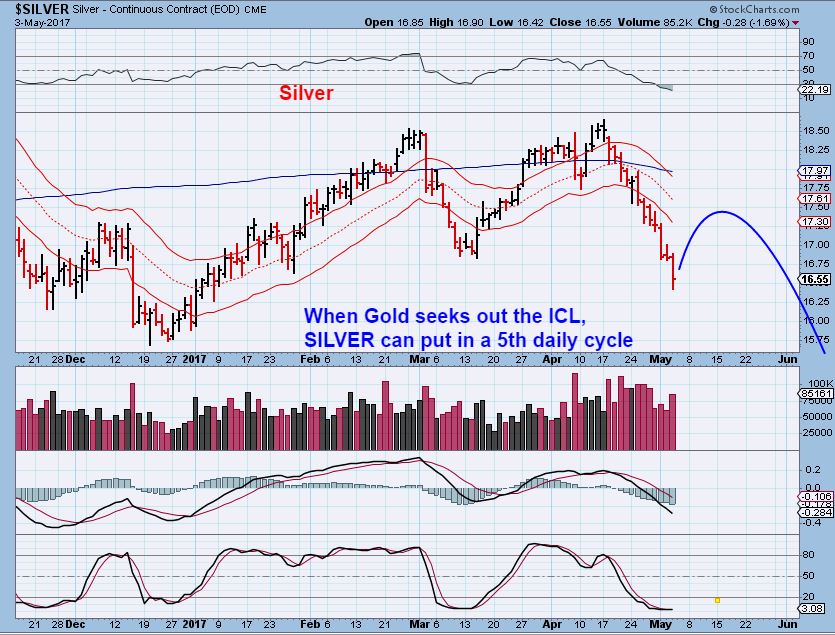
Silver was holding up well with GOLD and I pointed out that when Silver drops, it drops! I used this chart, because there were some that felt that Silver was about to break out to new highs and they were leveraging long with AGQ. I showed this drop to warn the readers that ‘timing’ is important with Silver.When it is time for a dcl, SILVER DROPS.
SILVER MAY 3 – This silver sell off actually looks like what I was expecting to see as Silver began to sell off into an ICL. Silver does drop sharply into dcls too, so I am NOT saying that this is the ICL, but this is usually what you want to look for when Gold begins to drop into an ICL. This looks steeper than Golds drop at this point.

Silver – the part that catches my eyes is that Silver resembles 4 daily cycles. It is a secondary thought, not my primary thought, since Gold has been acting so Bullish up until right now. I’m following GOLDS CYCLES. This is a GREAT example of how quickly things can go from Bullish to Bearish in Precious Metals.
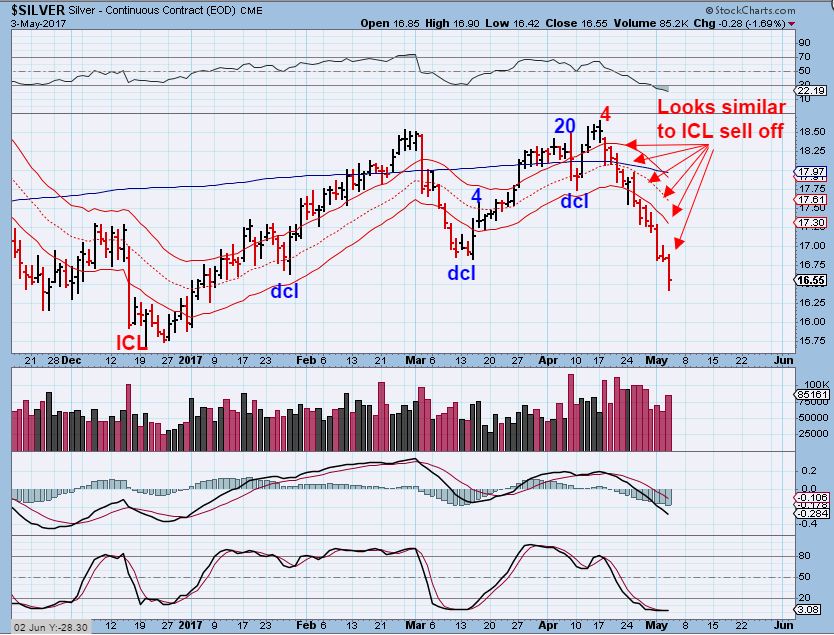
So lets say that Silver has 4 daily cycles, it can still have a 5th one too, and drop with Gold into an ICL later with Gold, as shown here.
GDX -Did Miners crash after the Fed? Some think that they did, but…
.
This is not a crash, Miners moved up higher early in the day, so it looked like they dropped a lot after the Fed, but they really just started from a higher point by the time the Fed Decision came out. We have a big reversal day back at the lows. Not a bullish day, but we do have a possible bull wedge and if Miners can break above this upper trend line, we probably have seen the lows for a bit.

GDXJ – GDXJ also has a similar set up. Prior bounces were held back at the 50sma.
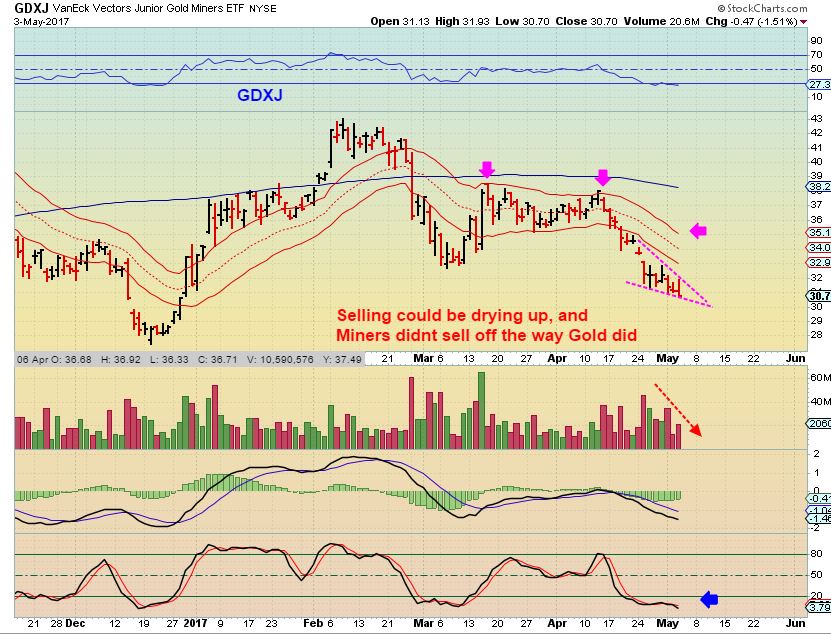
I posted this idea in yesterdays report – It is a possible path of the next bounce in Miners.

SO we are due for a dcl & a bounce in Gold & Miners. I want to repeat what I said at the end of yesterdays report… I cannot recommend a ‘safe trade’ in Precious Metals at this point, since there are higher risks in a 4th daily cycle. Patience can save you money in volatile situations, so any trade taken at this point should be taken at your own risk.
We are still dealing with the Jobs report for the markets, and we have the French Elections on Sunday. These can cause volatile or choppy reactions in the short term, so investors have to be prepared for that. We actually saw enough of that in March to leave a bad taste in our mouth about choppy markets. Today is ‘Thursday after the Fed’, and that may give us a clearer idea of what the precious metals want to do. We also have the NATGAS INVENTORY REPORT on Thursdays. I am thinking that a long NATGAS trade may finally develop. It is low risk, with a stop below the 50sma or recent lows, whichever you refer. Again, ENERGY may be bottoming here, so I will look for some trade set ups here and other areas for a brief Friday report tomorrow.
Enjoy the day and thanks for being here at Chartfreak!
~ALEX


Good Morning Alex, Hope you enjoy your well earned “road trip” and use plenty of sun screen. Are the channels used in the NASDQ, GDX, GDXJ, and Silver charts all the same and what are their parameters? If explained prior or in a different section, please excuse. Thanks again for doggedly staying with this market and explaining it to us so well.
Hi Edward, How did you know we’d be away somewhere sunny? You must know my wife- lol. Yes, she booked a beach front trip, so I will be wearing sunscreen for sure.
As for the channels- those are not my parameters, they were given to me by someone else who wants to keep them private, so I also look for moving averages that do a similar job.
Refresh –
On a really bullish run, I’ve used the 10, 22, 50 or 66 sma, and the 22 & 66 work well for that here. The pull backs can be gauged that way too ( Dcl or just short dips).
https://uploads.disquscdn.com/images/ed1539dcb007e52bbd41ce7f081cb46bc53106b25d35a2f62c5031e42b6abb76.jpg
Thanks for the explanation. Actually you had a trip at this same time last year and I remembered because I’m in the Islands diving for two weeks just as i did last year. So it is not due to any telepathic ability on my part. LOL
NICE !!
The hardest part about trading is knowing when to sit on your cash and be patient! Real hard. Right #HB?
For me, the hardest part isn’t ‘knowing’ when…it is the discipline to stay on the sidelines even though I do I know that it is not the best timing for a good follow through trade.
As a trader, I find it hard to ignore a good looking stock trade set up, but if the ‘timing’ isn’t right, they can fail to have follow through.
Alex, thank you for your reminder. I’ve been sitting on cash right now. It’s so scary to watch AG, AUY drop so hard.
‘Sitting on Cash” – Probably feels like the best trade this week, right?
Patience pays off in spades at times. Good for you.
Amen!
Finally. Adding to cash. I had some real dumb-sh!$ trades now. Now that they are all cashed out, I’ll have plenty to deploy (though less than I would have). But I can’t sit here and do nothing for a month waiting for the cycle. I just CAN’T!!! Ahhhh….
*go do pushups
For a month?
Can I burn leaves and play flute in my fake band also?
If it keeps you from losing money and throwing up all over the comments section during the ICL dip , sure – lol
Throwing up all over the comments? Man, that was cold!! My portfolio threw up all over me this week!!
That comment was for Maria, btw, not CF. And for the record, I play a mean jazz flute! (Not really)
..yes… Hard.
🙂
#HB 😉
Good morning ALEX !
Would you do me a favour? You said about Nat.Gas: “after the inventory report you will see if it still remains bullish” After the report Alex, can you give us a short update how YOU see than Nat.Gas??? Thanks a lot.
Very good updates in your report. See you later, thanks.
I wont be able to do that immediately after, I wont be in front of my screen at 10:30. If NATGAS goes up after the report, if inventories are dropping, it should indicate that NATGAS is bullish, because the chart in the last few reports have been bullish. I would have to enter a trade using my phone, but I am helping family later this morning with yard work for a few hours. Hope that helps.
Thank-you-very-much, this helps ALEX !!!
Just an FYI – UGAZ & BOIL dropped on the report and then put in small reversals, so they may be good to go, it is hard to tel. That said, I did not buy today- I did not get in front of the computer in time to analyze things.
Thanks a lot Alex, I also did not buy today.
Gold still dropping like the 2 charts in the report so far
GDX is going to get close to or break just below the megaphone its forming on the 2hr. There is also the long term lower TL there as well. I’m going to take a shot and sell my DUST here as it hits the top of its megaphone and add to my NUGT position. risky
If you can pull that ff, thats a great trade, a tough trade for sure, but you need to capitalize
R-I-S-K-Y! 🙂
This was my GDX chart from May 1st. It is not an exact target, but it does explain that this selling to the 20 area isnt really unexpected
https://uploads.disquscdn.com/images/32967b534efbb286e15faa22aff84ebaf642c5c6a36bb065717804632c6eabb5.jpg
To be honest, MIners started dropping well before Gold- Gold held up at the $1300 area for a while with GDX & GDXJ struggling, so I was hoping for Gold to keep dropping a bit more and for MIners to show signs of resistance to the selling, even reversal candles along the recent lows.
We’ll see where things are at by the close, but you can see why I mentioned a week or so ago that buying during the dips to dcls can be painful. I sold my JDST on the way higher to lock in gains, but now it seems that I could have held on to the last 1/4 a bit longer
That’s why I was hoping GDXJ would take today’s gold drop in stride, for exactly those reasons. Darn!!!
And I’m taking a shot that sentiment is going to get to bearish after today for this to continue … perfect spot to reverse and catch those short later in the day…then have a real convincing rally out of the lows to draw in longs and get the bulls back on board and then start the ICL in earnst… That’s a possibility here.. they have done this before
Yes, and timing wise we are due
A couple of significant issues here. This seems like an ICL style drop for miners and as you mention, for silver. But not yet for gold. Also GDX HAS now undercut the March lows which GDXJ already had. In a BULL scenario, that should not happen on the daily cycles. The run up was too short and DCL pullbacks too steep. Really have to question any kind of bullish thesis for PMs now, imo, until we FINALLY see higher highs and higher lows. Which we cannot see yet. The next ICL would have to be AMAZING!!! to put this back on track. For now we need to go back and trade this the way we did in the bear: 1) long 1st and 2nd cycles only, 2) no core positions holding ‘old turkey’, 3) short 3rd and 4th into final DCL/ICL for lower lows.
That’s how I see it. But what do I know.
Plenty, if you ask me! 😛
I sure hope you are not correct and CF’s cycles and guidance is. My account is bleeding red today but I was ready…and I know we still have the ICL to face! Just remember to evaluate your own emotions as well…it gets scary and sickening when we approach DCLs and ICLs. Stay…”frosty”…?
Hey Nancy, I’m dying in red today as well. Whole market is down, all major commodities and US indexes! Ok, hard to summarize these thoughts to be clear and concise, but let me try again.
My view is actually not different from CFs. The “ICL” for miners broke in that we have a lower low now during the 3rd daily cycle, which would be unexpected in a Bull, but possible, almost likely in a Bear for Gold/Miners. Alex has talked this subject. We still buy the ICL!! But trading plans may need to adjust as we get deeper. Do we run to 2016 awesome-sauce or do we get this bullshit fantastic action we’ve had since Trump election?? I don’t know yet but stayed tuned. Make sense yet or is it still garbled in my head?
Just popped back in and my account is truly sickening….not 1 green position….and worst one day loss in a LONG time. YIK. Getting through the coming ICL will not be easy. Am learning some lessons as I see my “core” positions barely green. I think I will go watch the Star Wars movie I rented.
Hey Mama, at least CLF just turned green. Why? B/c it got slammed all week long already. BUT…it’s still green! 🙂
wait.. so are u saying it’s a bear market??
Note to self: BUY BUY BUY
*Teehee
Hehe. What I am saying is that we cannot approach the next ICL with the notion that this is a bull in PMs, period. That would be unwise.
Oh boy- someone stayed true to her style amidst the selling 🙂 Funny
GOLD, SILVER, and the USD falling together again.
Now add DOW, SPY, NAZ, and TLT. How is that even possible?!! Did the money just evaporate instead of trade hands????
OIL = $46.90 – see the Oil chart in the report for significance.
I’m looking for divergence in the energy stocks ( AND XLE) As Oil breaks the March lows and seeks out the ICL.
The first scenario that I had back in Feb about a big drop, then a big back test , and a break to new lows is playing out.
The fact that I wanted to short that last drop from $53 and didn’t when XLE & Energy stocks broke out upside is rather frustrating.
REFRESH for May 2 chart
https://uploads.disquscdn.com/images/62f5bf24616d807468e417deb1c39dc9d0d224c8b88a69a8b16bbc2926f3f963.jpg
Frustrating yes, BUT you have an ICL in front of you. Focus on our entry into the energy ICL. Do you think OIL bottoms before GOLD and MINERS?
Yes, but by that I mean the ICL in Oil could be in a week, I think we have another daily cycle left in Precious Metals.
They could both bottom this week , but one could be the ICL, the other a dcl.
One is an ICL and the other a dangerous 4th DCL. Which would you choose? Read CF’s report above if you’re not sure. 😉
I know, what the heck?!? Why did energy stocks fake us out like that? It was all FALSE strength or else we’d have had a sweet short on crude waiting for us! Shoot.
What time is natural gas inventory report out? I would like to reenter as well.
10:30 –
got the starter position BOIL 100 Shares @11.77
Added to my GEVO position on a quick gap fill this morning. I mentioned this chart yesterday.
Leaving for the morning. Best wishes all.
Refresh
https://uploads.disquscdn.com/images/4dc75457b6ec4bf5196c92cef596e1cbee8554049a12bf028c3ee2917476e0c6.jpg
Earnings on the 9th for Gevo
Yes, I may have to sell before then.
I took this trade too. Good setup–clear stops. GEVO has big problems with negative margin and senior debt. But seems like those are known entities and priced in? Will see soon.
i get into the starter position @1.03
Reversal , now my position with my new average cost from todays add is now a pretty red. Just slightly though, so I am still in this trade.
hey Alex.. check out MACK.. doing an amazing backtest tightrope walk along that PPO trendline.
so far never closed back inside..
https://uploads.disquscdn.com/images/7a374b4e85b1c2e702c70adb3357f37ebdf4d558544c543a9d1b932b42ea923f.jpg
Nice – I am assuming that it still held today .
was ok at eod.. dunno bout aftermarket
Uranium, Crude and Steel will be my focus going forward.. All looking for bottoms.
Hi Ken,
Have a nice day
URRE – what is the price can we get in?
Hi Siva,
I am waiting for a Daily Buy Signal (unconfirmed) to purchase my first tranche with a stop below that daily low. Do not forget to watch URA, DNN, and UUUU also. 🙂
any of you Canadian and wants to buy uranium mines ? buy NXE
so far only dropped 50% fibo of top where URA dropped more than 78% so far
fundamental this is a great company
just bought some at 2.91
Very Nice chart Ray…..thanks
URA -3% today NXE didn’t even blink so far – means it strong
Noted, thanks Ken. I will follow up.
Natural gas inventory increases. https://uploads.disquscdn.com/images/c0fa51066dc56a5004650befd9747ae0d22eedb18b9ebf3e78117d986c342219.jpg
expected. it is injection season
Thx for posting this for the group when the report came out, I was away.
It says that you posted it at 10:34 – It just doesn’t get any better than that ! 🙂
anyone following GSV one of the newsletter “…. Millionaire” recommended.
looking for a bottom right here around 1.5-1.6
They have an excellent piece of land in Nevada, immediate neighbor to newmont producing mines, two strong shareholders in oceana and Goldcorp. Plenty of cash in the till to drill and prove up reserves. Market cap gives them plenty of credit for what they have. Certainly there is upside as they are expanding the resource but the payday will be the eventual takeover. Attractive asset
Does anyone know if there’s a resource to see recent IPOs?
Nevermind–Googled it. https://www.iposcoop.com/last-100-ipos/
Woke up this morning to see that I was stopped out SWN. Lost twice on AKS and once on SWN. Catching a knife is hard. I think I’ll watch for awhile.
SWN had it last week. I don’t know what happened. Alex should some bullish developments in XLE above. The sector is getting OBLITERATED this morning. Clearly oil is seeking out at the low at this point. Agree, best thing to do now is just walk away.
SWN is mostly NATGAS, NATGAS didnt have a good inventory report. XCO took a big hit.
XLE tanked with OIL. Oil looks to be seeking out that ICL
We’re in shoulder season, inventory wasn’t too out of line. I still think oil is dragging it down, even though it’s really gas.
yes, …sadly the same here. Alex, any thoughts on steels and AKS in particular, please if you have a moment. Thanks
Same here
I just got back in… It looks to me like most steel stocks should have stopped people out at this point?
I ended my steel trades with a losing position in AKS and a winner in SID, so I sold both to even off when SID was rejected at the 50sma & Zeus started acting funny. They could be close to bottoming, but some are breaking to new lows, like AKS.
One of the best ones ( Zeus) gave a warning drop and STLD seems to be the only one surviving at this point. SCHN may have bottomed with a higher low.
Is anyone else still holding and watching NAK….Still bumping along that bottom support. Not oversold unfortunately, but holding the 50 MA. I see a chance we move up to the first resistance….Any thoughts are appreciated… https://uploads.disquscdn.com/images/a327c4e4810d4cd5d20ae00e2bdcb9af89194f20486224481d4813e2b6f363c1.png
I am in still and had left a “wishful thinking” order in place which filled this morning. This has been my biggest winner since starting with CF. I want to be in when speculation begins again.
Today is the “Deadline” for NAK. So this is peak speculation day, which is why your wishful thinking order filled :). Good job. Hopefully there is good news in after-hours.
Right!
And we got it. Basically a done deal with an extended 1 week extension to finalize Veto Lift. Up big after hours
I saw it above $1.90 – Boom!
Boy are YOU ( And Me) going to be happy if this price holds in the morning.
Nice visual
I’m still holding and was buying at the 200sma in the past…now it looks to be tagging that 200sma again and reversal, but hopefully the news is good going forward… I dont want to sell all out of this one.
Watching this backtest on KRE. Some banks looking good. Look at RBS and IBN for example.
Should have bought KRE today but didn’t. Maybe if not up tomorrow.
Out of DUST @ $37.26 .. added to my NUGT @ 28.12
Ok, added some NUGT at 27.50. But again, I’m looking for a short-term couple of days bounce, not trying to ride this cycle long. Was out of my JDST WAY too early, it turns out!
Oh no!! : )
J’/K
Watch out below!!
Looking to see if NUGT will hit the top of the megaphone in $33 area before rolling over.. tight leash though
DNR, OAS, SWN, EXK, AG, HBM. This is an absolute Bloodbath (and NO, I do not own all of these thank God, just a shot of watchlist or CF items, down ~10% unleveraged).
URRE, AUY, PLG
I’ve been stalking URRE. SOooo..glad I held off!
Uh…anybody…why did we sell JDST again? That was only the 1/2 way point. Dang!!
*there’s no crying in baseball ….
#CG
Is there crying in charting? If not, can we at least complain and blame others? Throw me a bone here…
Funny Lady!
Where you been?
Hello Cason! They increased my work load and dangled the carrot. Each time I grab the carrot….it moves away from me. Is that not strange? lol! I come home late and leave really early. I do however read the reports and comments. CF is my 2nd family & I will return, soon I hope. In the meantime, it is great to see all the funny post and good info. I love the positive attitudes and all the great newer subscribers. …..& Is there crying in charting? Heck yea. I cried so much, I added the boohoo blues candle to my Stock charts account. Its a very useful indicator! Good to see your tenacity! Take care Mr. C! 🙂
Alright, man. We’re still here when you’re ready!
Beer blames the whiskey, whiskey blames the beer… but it ain’t my fault;)
It was a great trade, made 60%. Now I’m looking at it, saying why did I sell. The daily wasn’t close to oversold? Bummer! ;-(
I sold 2nd half in a panic on that first move off the bottom. If I had trailed appropriately would have kept a runner. But I never expected this. Pre-split JDST above $25? That was WAY above the targets any of us threw out. Crazy!
Well, I did throw this out there on 4-25. I sold my JDST before the target hit. https://uploads.disquscdn.com/images/e68e672e4b596f4fc944f704391228ea10a227b80f6658290dd8a80875edab8d.jpg
And that was 1255 by the looks of it, we hit 1225 today (And may or may not be done).
Very hard to target dcls and ICls- the extend, stretch, and change sentiment.
My targets in a DCL or ICL are just estimates to help readers to see that trading these is tricky and tough.
I agree- it was a great trade for me too ( Would have been better to keep holding, but a bounce also would have taken it back). I just wanted to gain ‘some money’ from it…I was never trying to ride t from Bottom to top. Too tricky on a 3x etf for me to push it .
Okay. I’m jumping in small JNUG for a bounce. I guess I’m a slow learner.
GDX, Bull flagging off the bottom on the 15-min chart??
‘Small JNUG position” – I’m glad 🙂
Gold is sitting on the middle Bollinger band on the weekly….looking for 1220 or thereabouts?….bounce then largest drop of the year coming?……
WO!
Yes, this is basically the 20 MA , and price has broken below it slightly and recovered on past sell offs, so Gold could still drop below & recover in normal dcl fashion.
SILVER is looking like an almost perfect Gartley pattern and GOLD looks like a pair of AB=CD patterns overlayed. I don’t like the TSI on silver, but the Gartley is a good sign. Lets see if we get some basing tomorrow. https://uploads.disquscdn.com/images/a3c064a4407fdccf5a2bdf0ddcdf9d4ebe5fb42e8b9e89042f07d95128b2e69f.jpg
Good eyes! The famous “Vomiting Camel” pattern. My fav!
Hey Bill, I dont use Gartleys, but I have seen them play out.
Question : For the lower target to fulfill accurately, doesn’t the top of the right triangle need to be at the top of price? Is this something that is adjustable, or do you measure out the left triangle and then the right triangle just is what it is? Thanks
The top of the right triangle should be at .886 of the first triangle to be prefect. That’s why I’m showing the blue pattern as the classic pattern and not stretching it to the actual pattern. I don’t think they have to play out perfectly. If the right side is higher than the left it becomes a shark pattern. Or vomiting candle perhaps. If it is a Gartley and starts moving higher we should get a 50% retrace of CD.
Ok thanks…I really wasn’t sure if you had to stretch it to the top o the right side price, to get an accurate bottoming price.
What was the JDST split? 1:5?
1 TO 4
That would explain it – I looked it up & read 1:5 . Thanks
Ok, I just found 1:4 at another website- thanks Ray
NAK?!?
YES?!? NO?!? You must have seen the after hours price too? Up near $2 🙂