
5-15 Can it or Can’t it?
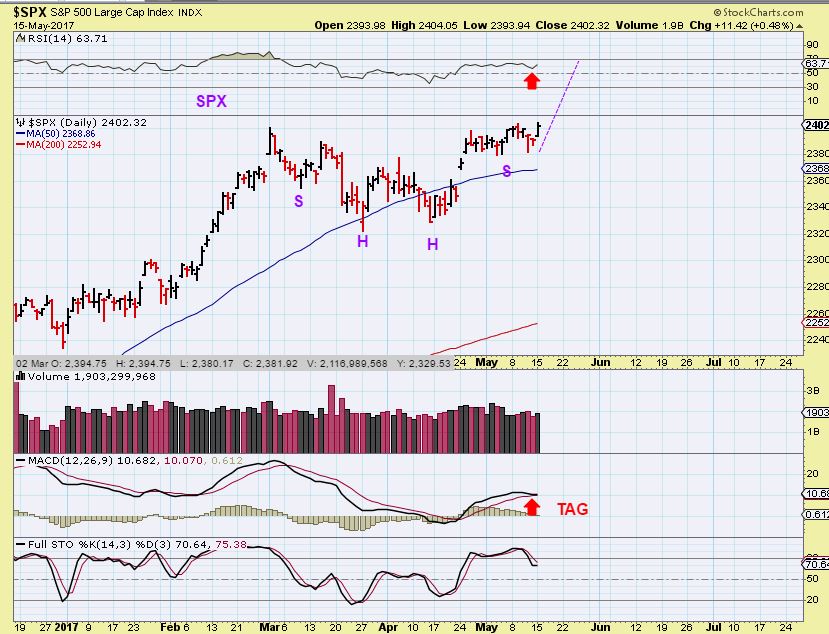
SPX – They just dont sell it off for long anymore, do they? New highs.
Due to my travel early Tuesday morning, I didn’t think that I would have a report, but a valid topic for conversation came up in the comments section, so why not just throw out a short report to discuss it.
The topic was “Could Gold or GDX actually drop down to the Dec lows ( Prior ICL)?“. The discussion isn’t “Does it have to?” or ” Must it drop there?”, but simply, is it possible or even likely? I personally think that it could happen. I have been through MANY MANY ICLs, I choose not to underestimate them. So this isn’t to say that we must see things play out this way, but this adds visuals to what we can look for when the anticipated selling starts.
.
To start with, The drop into the ICL serves as a way of changing sentiment. At ICLs, it is almost impossible to feel comfortable buying. There are rare occasions where they do not drop into a crushing low, I will discuss that in the future, but usually they cause the Bulls to hate Miners and lose their bullishness & desire to buy.
.
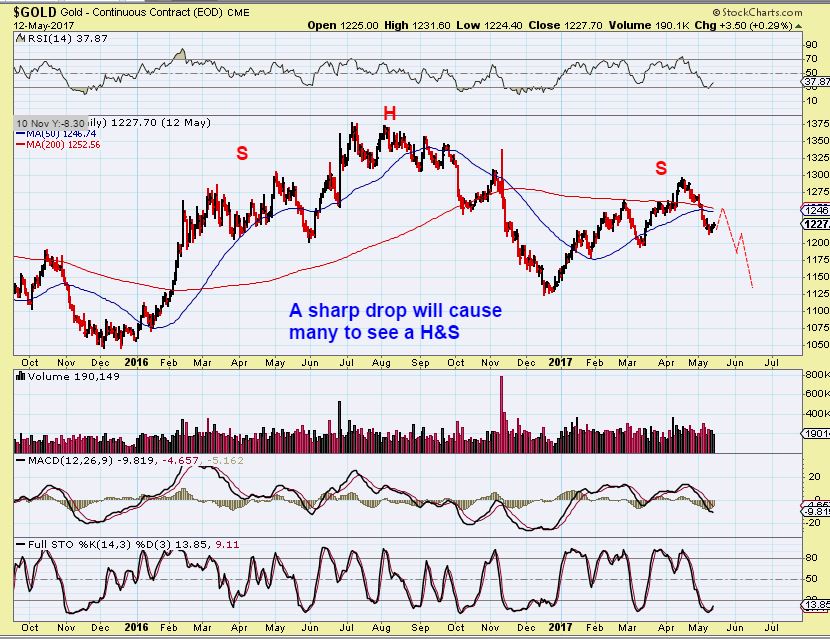
I could see that another drop now will cause many to see a Head & Shoulders pattern and start to fear buying.
The question raised is, Does Gold have enough ‘time’ to drop that deep though? Let’s say we are talking about the next FED MTG in mid June. That is 1 month away. Is 1 month long enough to drop gold quickly?
This is a chart of Gold in 2006, and the set up was pretty similar. This did drop to the former lows, and it did so in an interesting way…
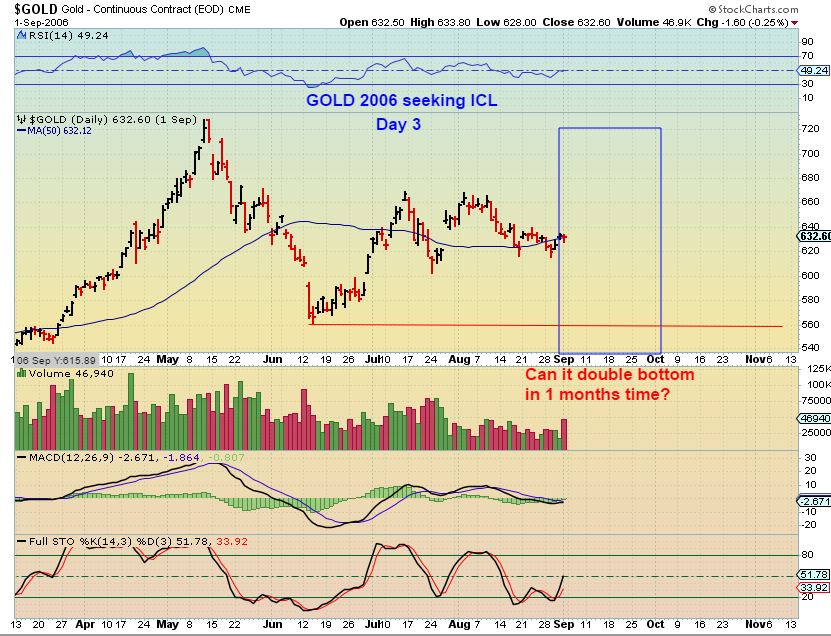
Notice how rapidly Gold can drop in just 2 or 3 days at the first arrow and the last arrow. Even with a strong rally n the middle, Gold slammed down to prior lows. Bulls became bearish. This helps me to visually see that ‘Yes, it is possible for Gold to slam down quickly in just days or especially weeks’. Most of that total drop was 3 days at first and 3 days at the end.

SO THIS IS GOLD NOW – I admit that that would have to be a pretty big drop.

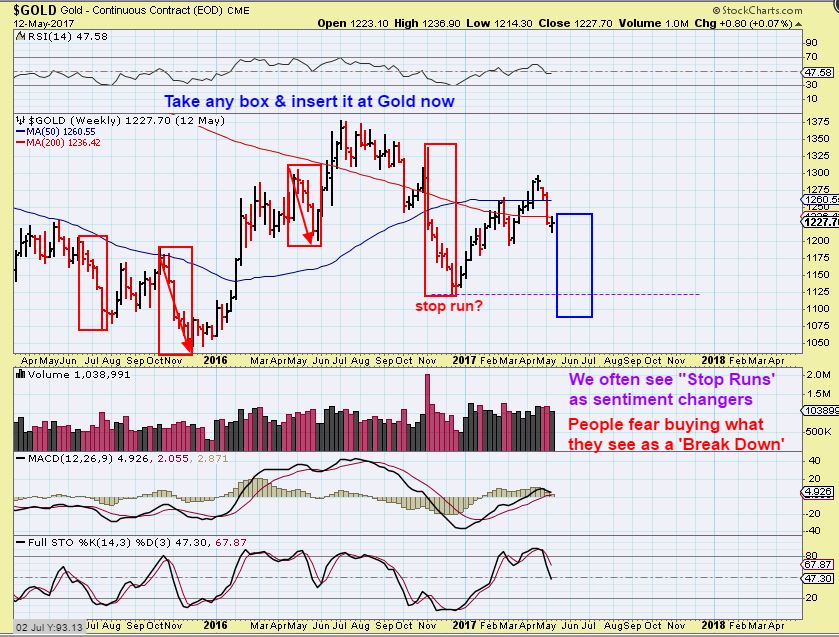
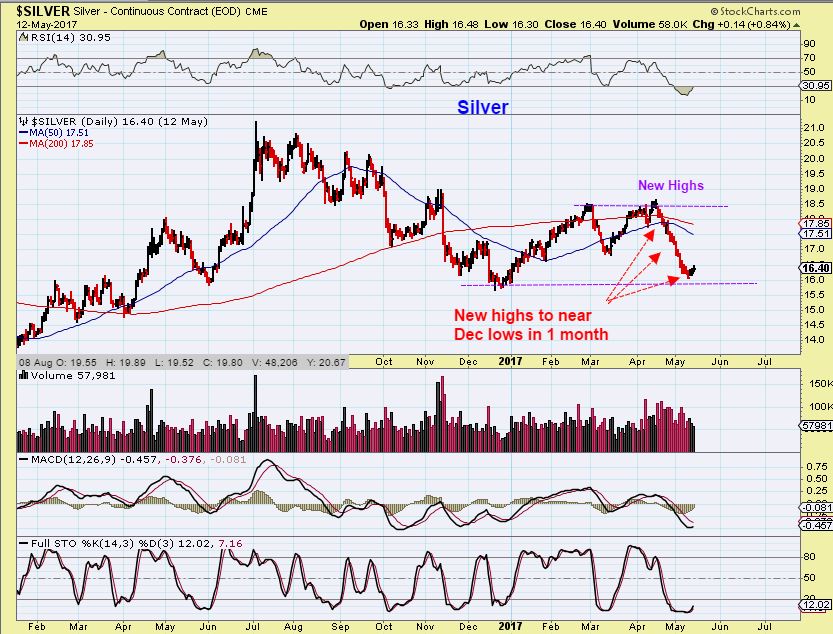
But looking here, we see that we had a wicked sell off last Nov to Dec Fed mtg (blue box). IF I overlay that here it would it would drop from above the April highs to Dec lows. Does this prove that Gold will tag the Dec lows? No. Does it historically tell us that Gold can sell off like a waterfall and drive everyone out to Dec lows? It does show us that it ‘could’ happen and it could happen rapidly.

Finally – That sell off last Dec was pretty extreme, so let’s just look at a few other milder sell offs on a weekly scale too. Take any of those 3-4 week slam downs into ICL and lay it at out current dcl. I want you to notice that each red box was also a ‘shake out’ slightly below prior lows. This removes bullish sentiment. Please read the chart.
May the above visual aides help you to see how things could unfold.
.
So my point in this lesson is simply a visual aide when discussing sell offs to an intermediate cycle low. I personally like to be aware and alert to all of the possibilities, and I do look into MANY things whenever the ICL timing approaches. I share these things with you to help all of the readers to have an advantage in the tough sell offs. Visual aides can be helpful when contemplating our expectations. The above charts are like that old saying, “Seeing is believing”.
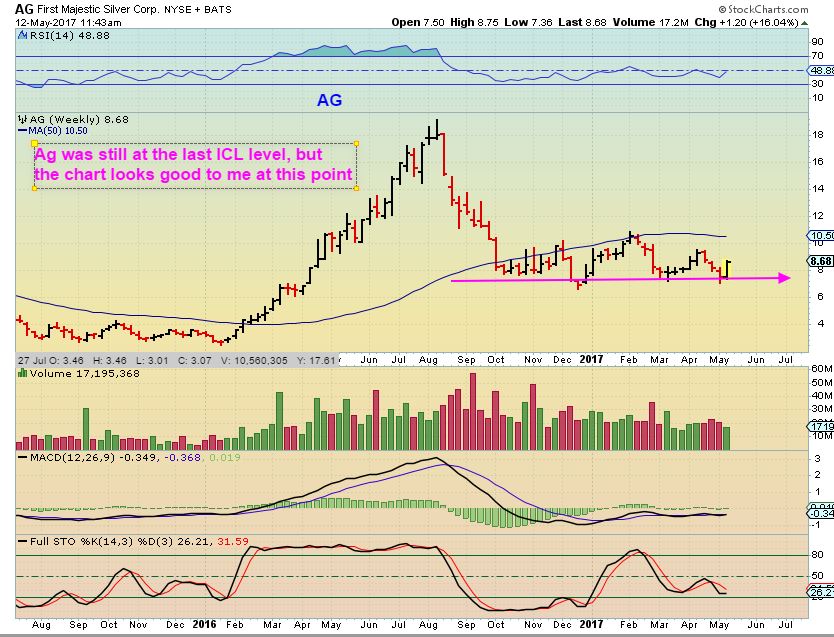
Sidenote: We also know that Silver & Miners can fall very sharply, deeper and faster than Gold. This actually looks like a drop into an ICL in Silver already. I am wondering if most of the selling in Silver is finished and maybe it will bottom out and consolidate for a month as Gold drops? A slight break of recent lows could act as a stop run. Time will tell. Silver went from New highs in April to Dec lows in May. I would love to see it do a stop run and then hold up and base out like AG has ( See the next chart).
I’d love to see Silver start doing this. I think that this chart of First Majestic is shaping up very nicely.
I would also take into consideration GG, ABX, & NEM and look at their charts to see whether they could get to the Dec lows for GDX. Those charts do look as though they possibly could tag Dec lows.
.
Enjoy your Tuesday trading!
~ALEX


So many editorials that are bearish. Retail has pretty much left mining stocks. Weak hands have left. So, the shorts are starting to get squeezed. See what happens. I would prefer we have bottomed and with the new Hong Kong physical exchange to set price we may head up instead . . . .
Hi Alex, interesting report as usual.
Been patiently waiting for the PM ICL, just lurking in the background.
Interesting to see the $USD breaking down here.
😉
Safe Travels chartfreakieDeek
#freakiedeekie
https://uploads.disquscdn.com/images/e3d0425b405279c3c39daa1396230ff78a411daea63c1e46bda3fe2982f73756.gif
Over the past month miners experienced record outflows. Ever. Gdx has been around since 2006. Never in its history has it ever experienced more outflows.
The big ew crew thinks we Are about to see a wave 3 breakout.. I am not convinced and will not buy until we take out a previous high. This particular ew group hs also mastered the art of playing both sides and always claiming to be on the correct side so waiting to see the explanation when the ICL hits.
Breakout in what? Gold?
lol
I have seen both…. 1 EW guy I follow has us still in a bear with Gold heading down to 800s … yikes
Still holding half my NUGT position here. It feels like Gold wants to get to that 1245 – 1250 area and GDX to $24. JDST is still in a very steap falling channel and if you look at the March 7th to March 15th move ( 5 waves down ) on the 2hr. We are setting up the same way almost perfectly. on the 15th JDST dropped from here to $51 in a 2 hour block. The recent little move up looks like a 4th wave with a 5th on deck. Not saying it will happen but I put my buy order in at $55 .. Good enough for union work as they say.
Gold is moving up when stocks are showing weakness. We may see a near-term top in stocks soon, which tells me that gold may really take off at that point.
NatGas not looking good here………
Could yet be a valid backtest of that breakout line, as shown by CF yesterday.. well at least UNG is still above, dunno bout NATGAS itself.
orrrrr.. it could be off down to the red channel i posted yesterday… lemmee know anyone who wants keeping up to date with that 3day UNG chart.. otherwise i’ll just check on its progress myself.
Yes please update. stuck in BOIL. No internet…on friend computer. waiting for new modem. Life with no computer and TV is ODD! LOL.
nightmare scenario!
Truly!
Im interested, although Im not sure your thinking on that chart.
My thinking is.. buy a double bottom reversal if we get down there.. or the breakout of the ema if we don’t.
Unless of course you’re trading smaller time-frames
Im trying to hold longer term, a week or two at least. Im looking for the 100ema to hold on the 4 hr chart. https://uploads.disquscdn.com/images/9a4c9fa2a6e0d6c712733df50759639c0a5f226370dfd5f30c151b966c25b490.jpg
The 50 held for UNG and Boil. Keep us updated 🙂
Thanks for your report Alex.
I do understand your possibilities…..I just do not see a 9.3 % drop in the value in Gold by early June, which is where the next ICL is due. My work with EW, Technicals and Geopolitically the odds are against that kind of drop that quickly, Although…..if Gold has an Extended ICL into July or August that I could see as very real possibility.
I would love to see Gold test those lows….btw.
My question though is: Will the next ICL in Gold due in Dec. or Jan. 2018 be a Higher ICL or Lower ?
… . u must think he’s got some extraordinarily polished crystalballs.
Nope….just his opinion.
Please disregard the writing on the right hand side of the chart. All other writings on the chart is what I just wrote today.
https://uploads.disquscdn.com/images/038cc6dfa6ae5337fc59e07c033a63717669b69435b58f63e9dc25cfe1ef137d.jpg
so … r u saying I am strange???
;o)
strangely delicious.
… Meowww …
Maria and/or Rob:
Are either of you two trading off these forward projections?
If so….it would be very interesting to track say around 50 trades to see the % of profit or loss with drawdowns.
This is the first overlay chart i am trading from…but Alex’s advice will trump.the overlay projection.
The data would then be inaccurate unfortunately…….if you were to track.
what data are you talking about ….. ?? I think you misunderstand how I use these overlays.. read above… 😉
As I have answered many many MANY times Ken — I use these overlays for informational purposes only — to count actual days in a wave/dcl/Icl and to also show prior price movement. I do NOT base my trades on the overlays…they just allow me to examine past moves through PRICE and TIME. .
.ie. “this is what the last structure/wave/leg/ICL/DCL looked like” So .. for ME-(in my thought process – the way my brain works) – it’s the very same thing that CF does when he highlights a BOX in BLUE to study past dcls, icls –except- i have the exact candle by candle count/replica of the move to study — in any time frame. I really like it … it works for me – especially when I can identify waves — It’s been a great learning tool for me. When I examine a chart, my eyes automatically start scanning for patterns – past price movement – it’s just how my brain works
Interestingly, I have found on several occasions when examining a prior wave – lets say I grab the last “3” wave. Now – when I overlay it onto the upcoming “3” wave … I have often found that the ‘corrective waves — ie. 2 & 4 – ‘switch’ or ‘alternate’ . So – IF for instance – the prior 3 wave correction was a “2 deep” and ” 4 shallow” ,,, THEN I watch carefully for a switch on this upcoming wave .. ie. 2-shallow and 4-deep — pretty cool how that plays out.
So i repeat – I use these overlays for informational purposes only — to count actual days in a move and to also show prior price movement. I do NOT base my trades on the overlays…
The End. ;o)
I repeat…..
If you throw those forward projected charts up (informational purposes only) show or state how you are trading off those said charts.
Show or state a complete trade so we can all follow your “mind set”. 😉 As dangerous as that might be….. lol.
Really Ken…. PFFF!!!
lol
https://uploads.disquscdn.com/images/93066d1dbf4299de56f37cfdbc967a4a7796a20bc6db57fdb750823fc4eb3ac0.png
lol…couldnt resist.
I think your brain is stuck on “trading off them”
I do not trade off them Kennnnnnnny …
Have to fly
Off to massage..
It is a tool you use apparently ……
If not ???
Ok..true.. U got me.
It’s a Learning Tool…
*meow
Oh My!
actually .. if u think about it – it’s not really THAT strangely delicious… it’s just a carbon copy of a previous move – that stuff happens all the time….
… if u want strangely delicious…. I happen to cook up some seriously delish stuff in the batcave … I’ll try and remember to send u a tasting next time….
#WickedCoolCharts
*MeeeeeOwwwww
here’s one I’m tracking for a break over that TL
https://www.tradingview.com/x/sOpNZrTN/
or how’s about RENN …?????
https://www.tradingview.com/x/xaNIwBOp/
Before you go all in I recommend to read CW on tradingview.
The guy’s short and he was 10/10 in natural gas this year.
https://www.tradingview.com/chart/NATGASUSD/zmjCLGwC-NatGas-Missed-or-Escaped/
My mental stops are set and will be honoured
anyone knows what happened to MACK? can I buy it today?
No, not sure what happened. It sold off all at once on really high volume. But the daily chart is still ok. Daily was really overbought so this wasn’t too big of a surprise.
TGD: Reverse Split Ratio: 1 for 10 Ex-entitlement date: 16th May 2017 Timmins Gold Corp has announced a 1 for 10 Reverse Split, whereby holders will be issued with 1 new share in exchange for every 10 shares held. Please be aware that Timmins Gold Corp will also change its name to Alio Gold Inc. The ex-entitlement date is 16th May 2017.
omg, SOXS
gotta be a good mean-reversion buy very soon!?
LTBR was on fire today! Took 2/3 off the table and am leaving the rest to ride. Wonder if UUUU or URRE will play Follow the Leader?
hey girl .. 🙂
Lol! https://uploads.disquscdn.com/images/c8673b220004154d9370fe4008454dd33e061bd9c0084c5a5b59f3a7277f0f3f.jpg
I hope so. SOG is bummed I killed the URRE trade. My bad!
KenDawg… do u really not think this is cool??? Dammmmnnn … it’s tracking nearly identically …
https://www.tradingview.com/x/MsAEtFqF/
I do !
Trying to figure out how to harness the potential…
Yeah..u just wanted to harn…. Oh nevermind. 😉
Welll..think of it this way… It’s no different than counting days for cycles…in fact it’s a living example..a footprint if u will … of the length and strength/weakness of a move.
I am a visual creature…learn best filtering data thru allllll my senses… Meow. For me…overlays are just a visual representation of what was….and could possssibly be…..give or take s few candles. 😉
Harness the Visual !
Looking forward to seeing what the “creature” has to show us…….. 🙂
Sure hope we can do that again. Natgas was NOT cool today!
Ok, going on the record to say that was NOT an ICL in oil/energy and that CF was right the whole time. If you caught right at the lows (which would have been hard as it was overnight U.S.) then actual WTI crude was a great trade. Otherwise, energy lagging and I hate the candle on XOP today. Inventories tomorrow as well. Assuming those don’t move the needle crazy on 1 direction or another, am likely to gracefully exit positions and wait this 1 out on the watchlist.
Would that potentially line miners and energy up for same time frame ICLs? It could…
Whoah!! Don’t look now but here comes gold!! About time for her to catch up to miners. So, miners are about at our targets. So the real question is can they continue to push up with gold or will they top early since they rallied early? I almost wanted to start my short as the hot open yesterday sold down, but cycle timing tells me it’s early yet. We had a long consolidation is 3rd D.C. Smart play might be sidelines a bit longer to keep from getting chopped up. I exited all of leveraged longs so too late to chase anything long here if not already in, imo.