
WEEKEND REVIEW
Let’s review what the markets have been doing and what that can mean for this weeks trading.
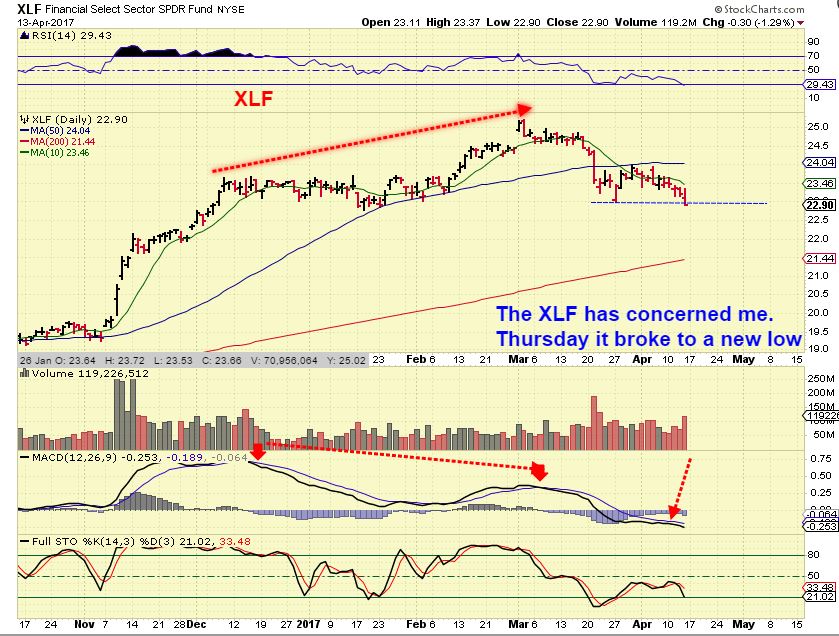
I have repeatedly said that the condition of the financials has concerned me when viewing the markets. Weakness there could bleed over into the general market.
XLF – Friday the XLF broke to a new low, taking out the last DCL. I now expect the financials to sell off over time.
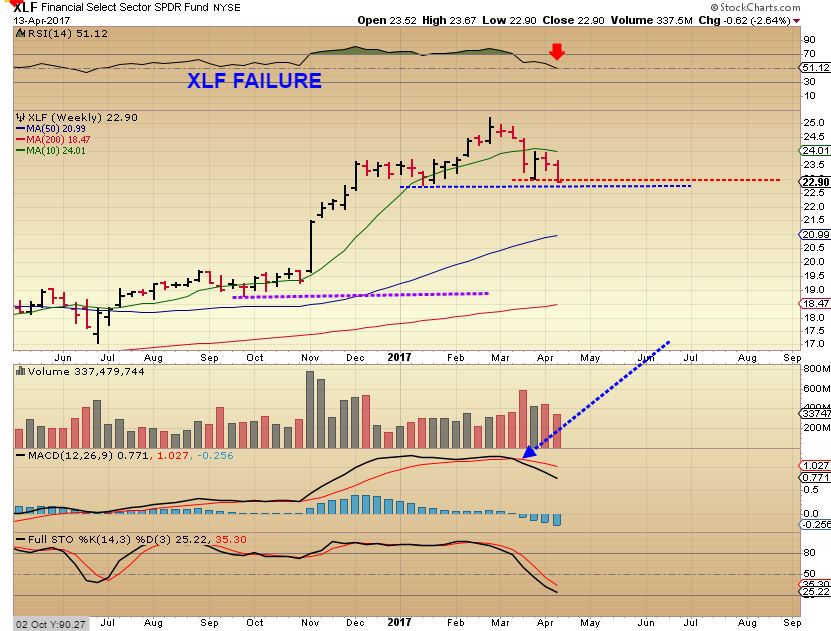
XLF WEEKLY – The weekly chart shows the weakness too.
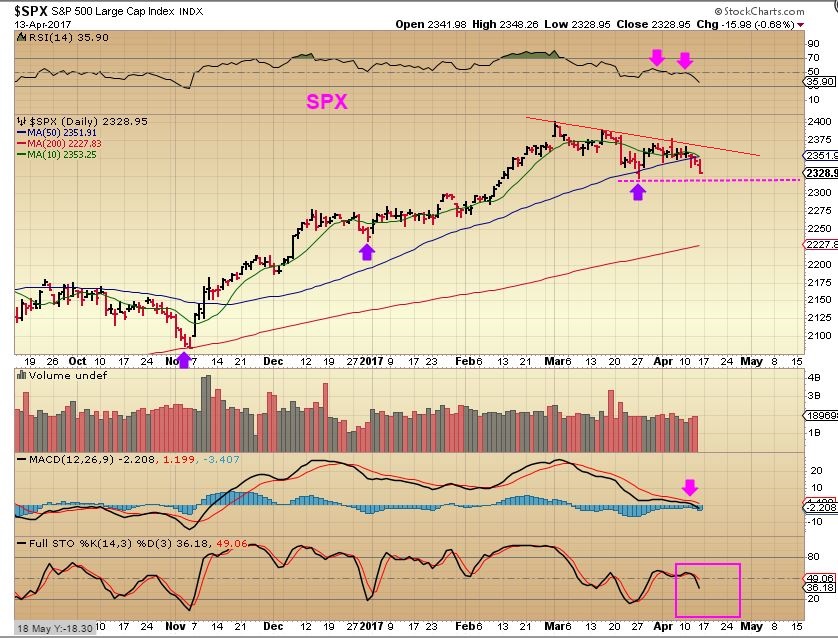
SPX – I think that the markets are in danger of rolling over here and seeking out their ICL too. SPX lost the 50sma and the MACD is weak.
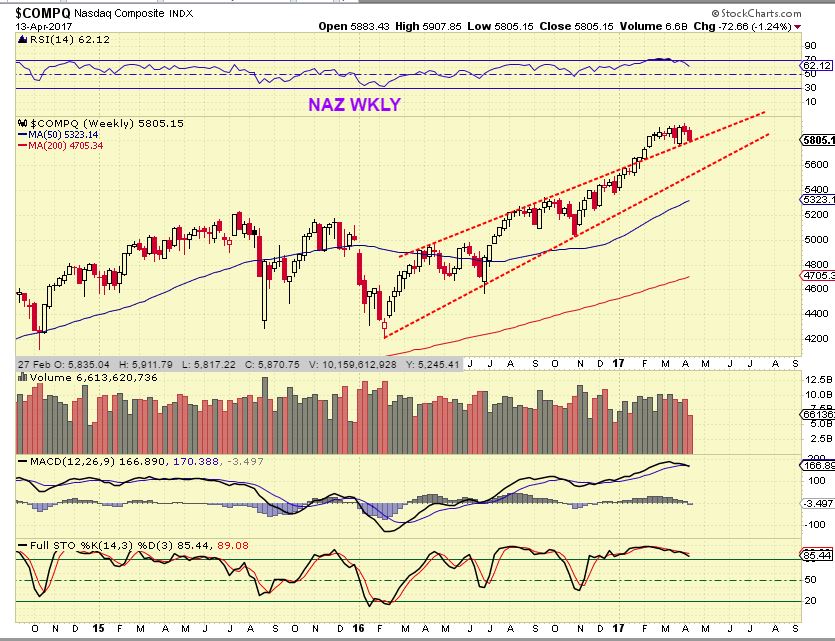
The NASDAQ has been very strong, but it also shows weakness here.

NASDAQ WEEKLY – This was interesting, the NAZ broke out from a bearish sedge, but is now threatening to re-enter it.
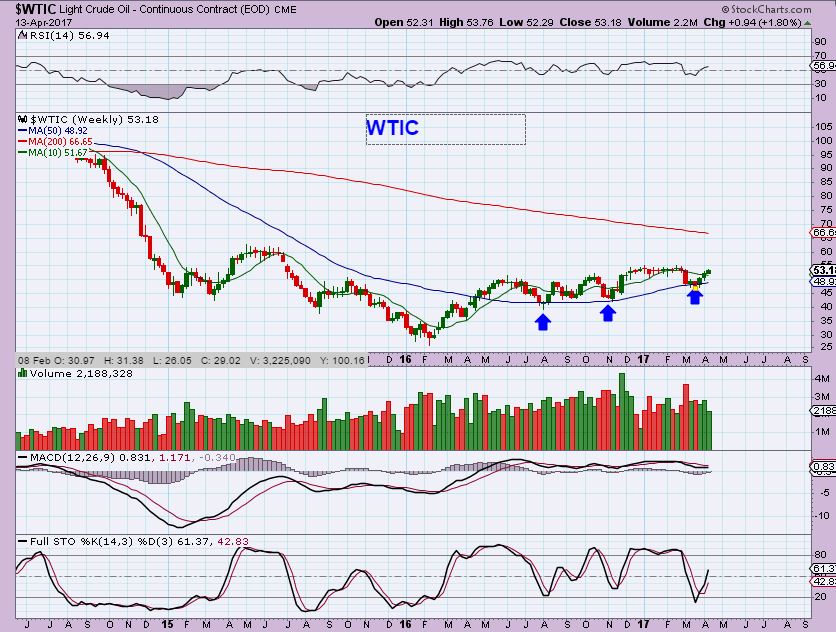
WTIC – Oil has been moving higher daily and looks bullish, but oddly some of the Energy stocks have dropped more than expected. I’m not sure if the Energy stocks are following the general markets or just pulling back here ahead of oil.
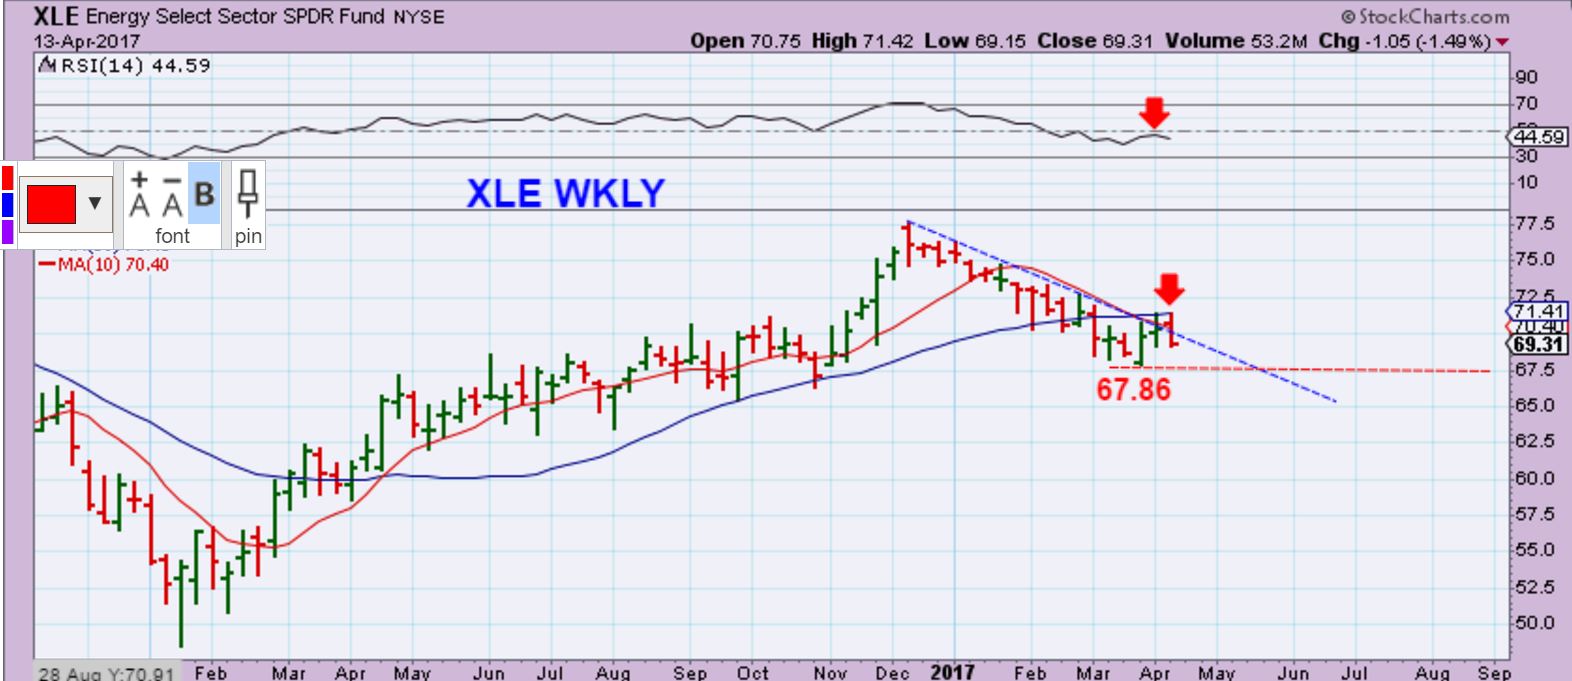
XLE – Here is the weekly chart of the XLE, and it broke down after breaking above the 10 weekly MA last week. Now I’m watching the recent lows a 67.86. A break of that number is bearish .
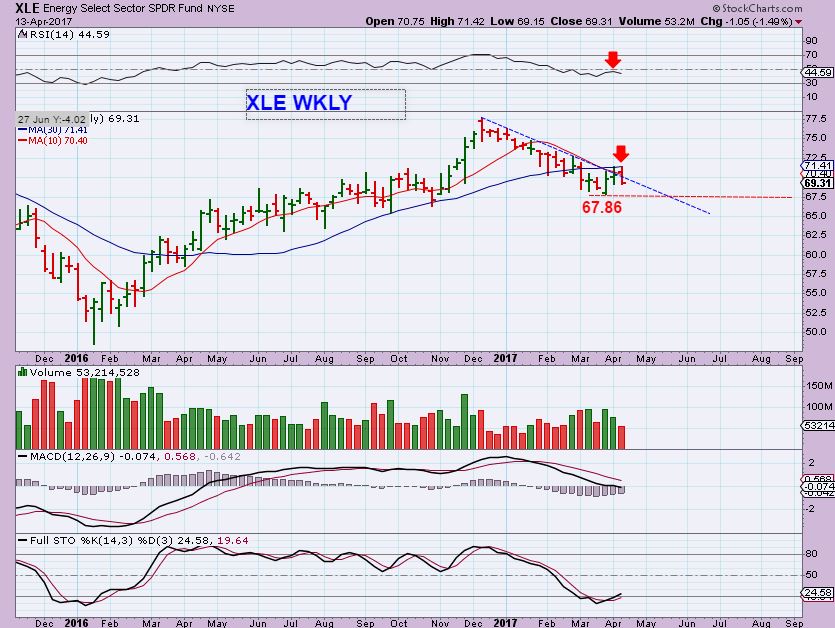
XLE WEEKLY CLOSE UP- Here we can see that the 50 weekly MA held down price 3 weeks in a row.
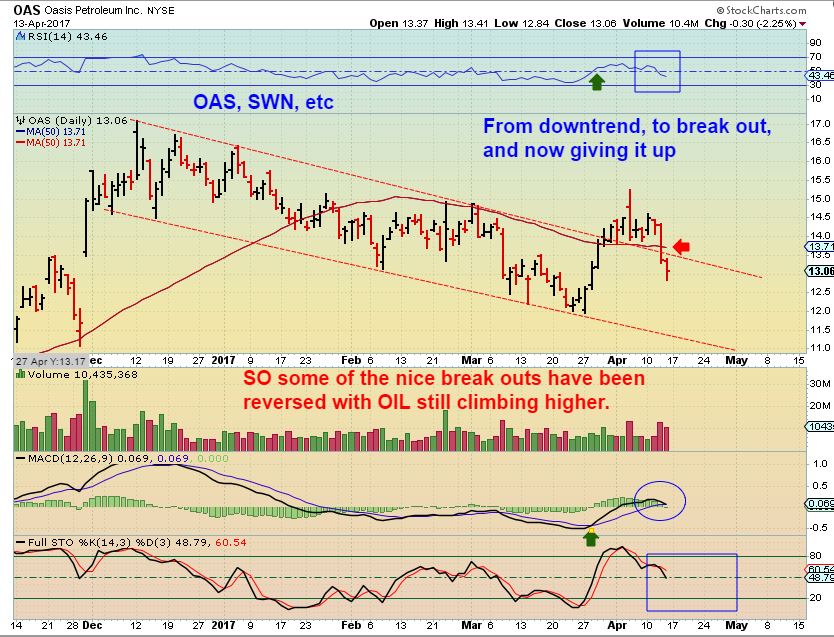
OAS – So some of the Oil/Energy stocks that broke out from a down trend and broke above the 50sma, have broken down again. OAS, WPX, SWN for example. LPI & MRO and a few others are threatening to deliver the same price action. I am not in Energy stocks, but I was looking to buy the pullback. I am waiting , because this is abnormal action in my opinion.
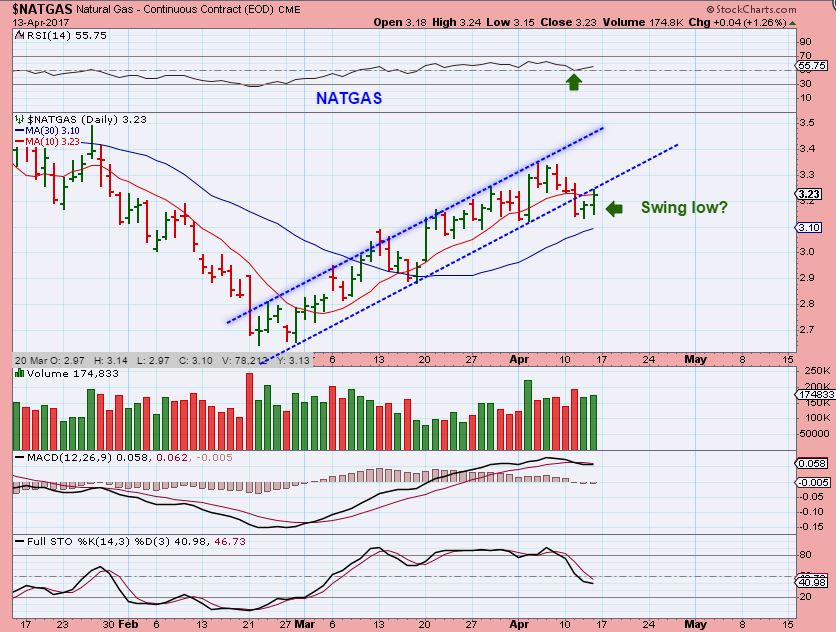
NATGAS – NATGAS dipped down and then reversed higher, putting a swing low in place. I didn’t buy it, but so far NATGAS has been one of my most reliable trades taken recently. I may buy a move back into the price channel & 10sma.
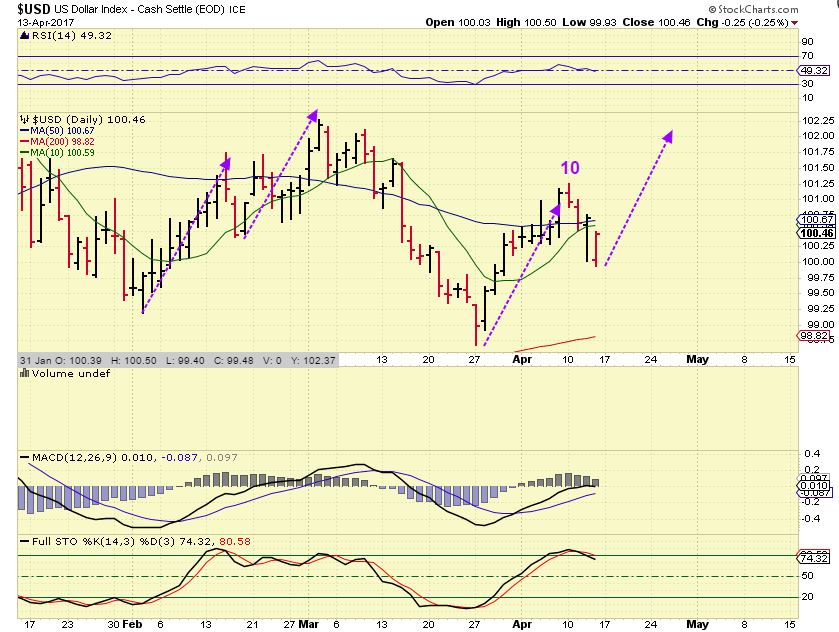
USD – I wanted to cover the USD & PRECIOUS METALS together, since they do seem to move inversely. Did the USD peak on day 10 and will now keep selling off into a low? It may have, since it lost the 10sma. If price cant regain the 10sma, the USD can drop for several days ( And Gold could run). If it recovers, we could get this move shown by the purple arrows. I’m watching for the USD to try to close above the 100.60 area. This type of USD move would likely send Gold into a dcl.
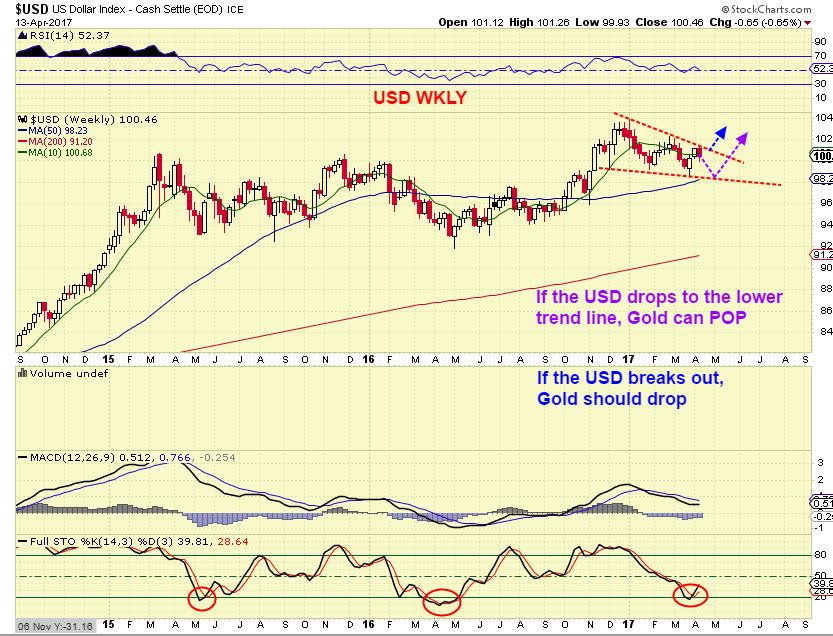
USD WKLY – Please read the chart. It kind of looks like the USD will drop to finish this pattern, and I would imagine that Gold would continue higher if that happened. We’ll discuss the precious metals next.
GOLD, SILVER, & MINERS
Please read Wednesday , Thursday, Fridays report if you need reminders in this sector. Things are not acting normally in this area and I have covered almost every scenario that I can imagine in recent reports. It is still very mixed, and can be a tad confusing, so I have to report this sector in 2 different ways. One is with a cautious approach expecting a drop into an ICL in May or June for Gold, the other view is as one seeing bullish set ups and bullish short term trade opportunities while Gold continues higher. You will again see why this sector gives Mixed signals. I’m viewing it like that old game of ‘musical chairs’ where you are free to move about and things remain bullish looking, until the music stops. So I am still looking at the short term bullish set ups in this sector, but still cautiously since Gold could top at anytime. Don’t let this confuse you, short term bullishness does not mean that we wont get a drop into a dcl in the near future.
GOLD – I posted this in Fridays report, it just looks like a bullish Cup & Handle. The thinking has also been that GOLD had 2 R.T. Daily cycles, and should be strong in the 3rd one. Miners were weak in early Feb, so they could under perform. All of this has played out, but SOME miners look to be gaining strength now, others are dead, so we have a mixed bag of tricks here.
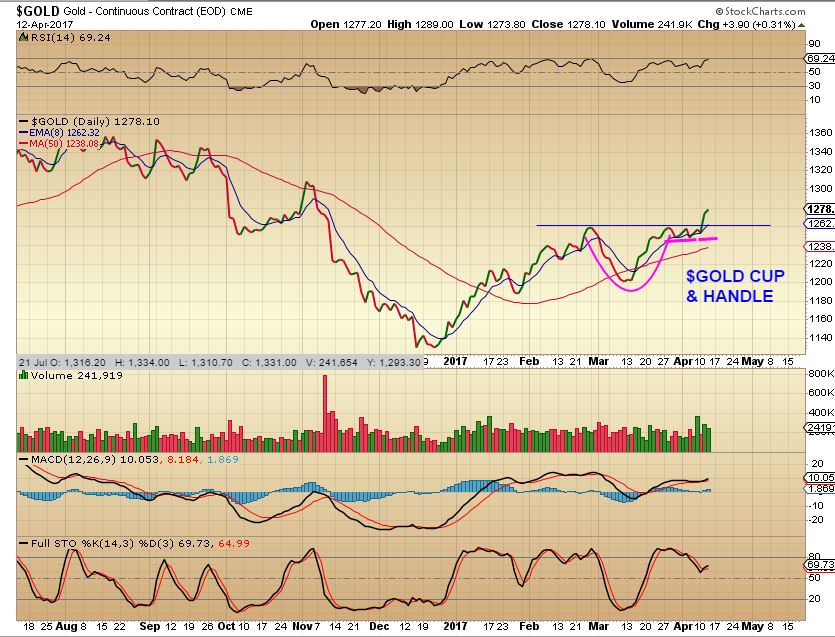
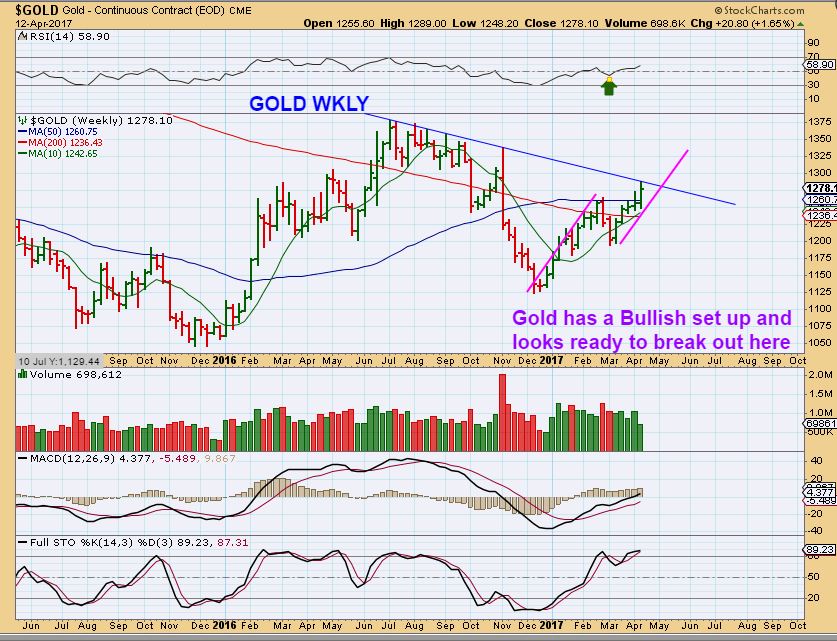
GOLD WEEKLY – Threatening to break out from a long term major trend line, this would be quite bullish. So Gold itself here looks bullish. If Gold breaks out & runs, the ICL would likely be a future back test of this trend line in May ( or June?). The RSI & MACD for GOLD are flat out bullish here.
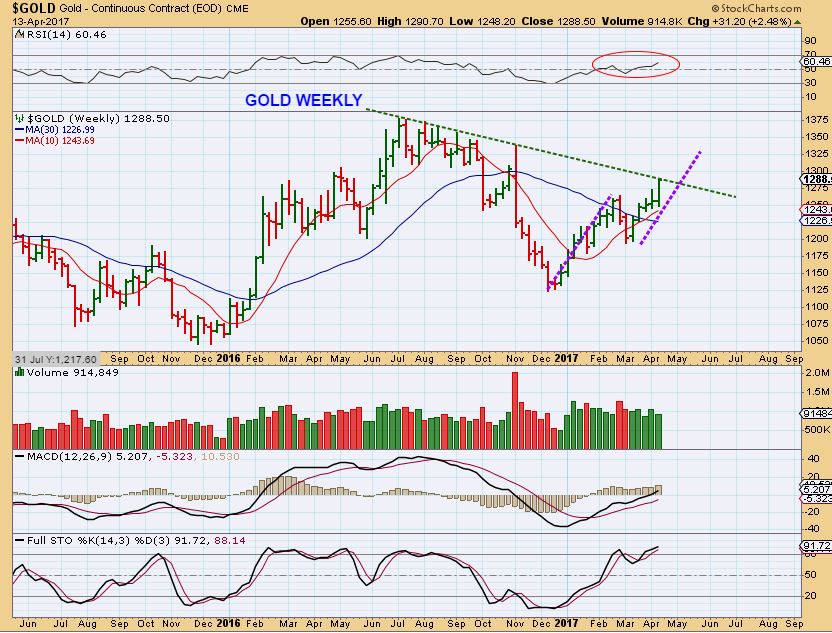
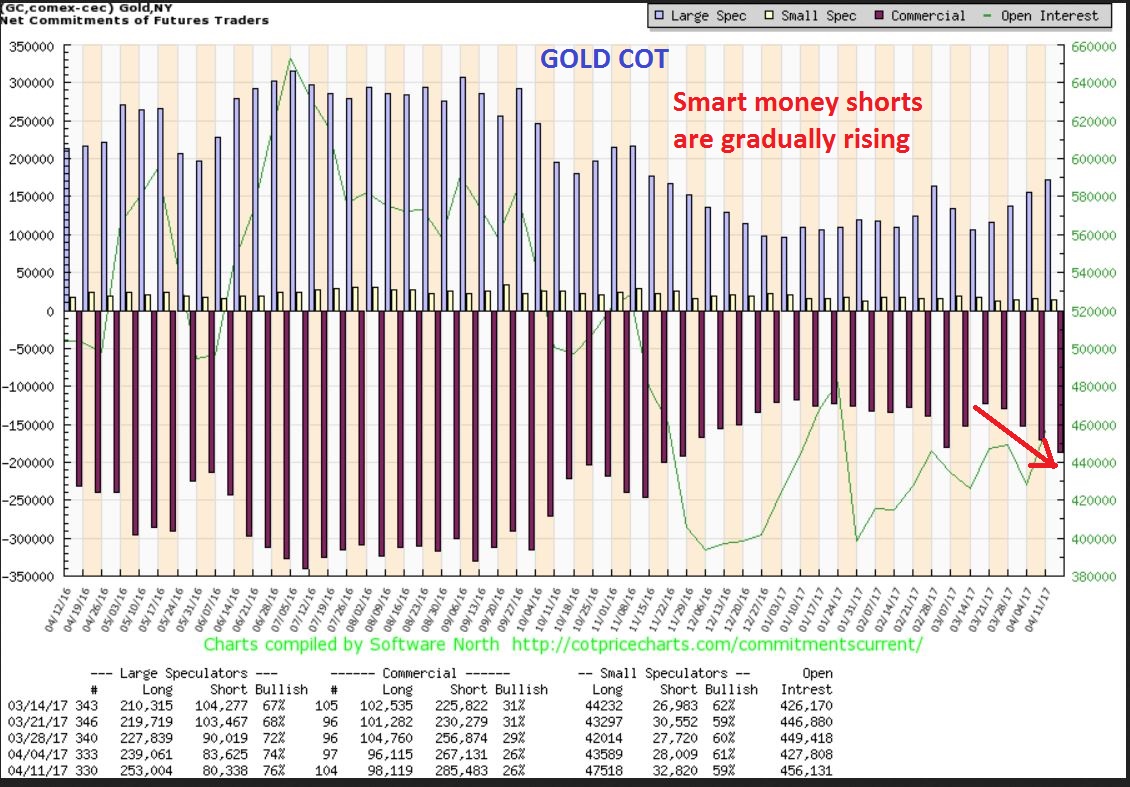
GOLDS COT shows that smart money shorts are increasing, but it is not overly bearish and Gold isn’t overly shorted by Smart money like the summer of 2016. Keep that in mind, because there is more in the precious metals that adds to the confusion or mixed signals.
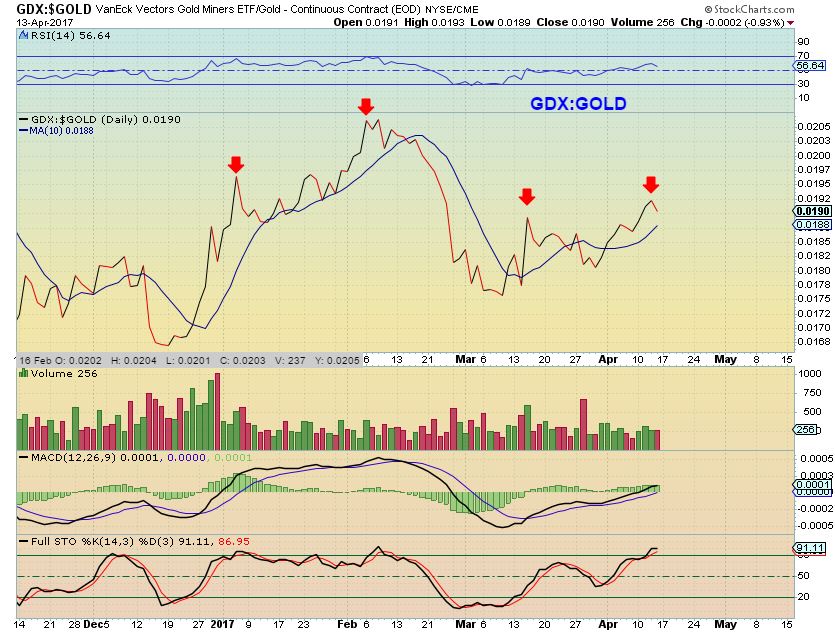
GDX : GOLD – Just a noteworthy look at GDX: GOLD and we see that it did dip a bit after Friday trading.
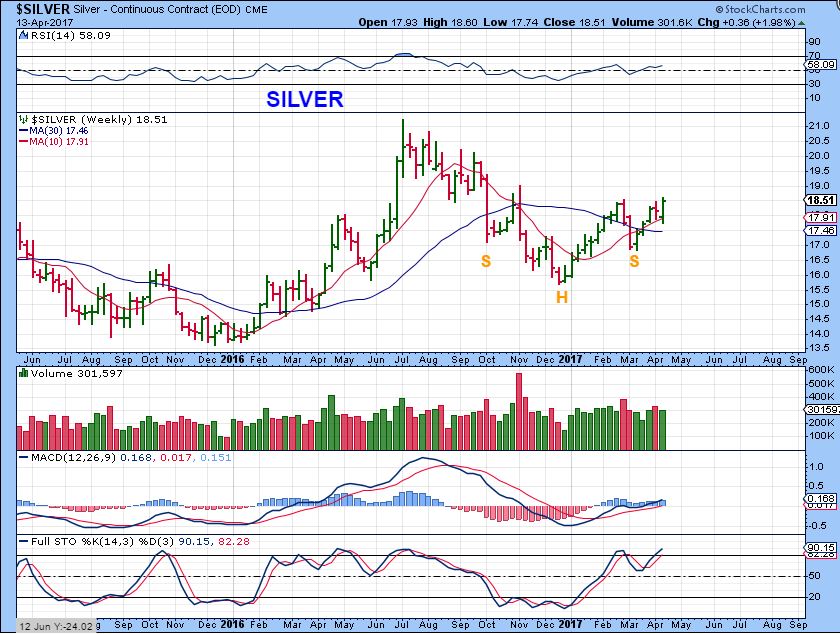
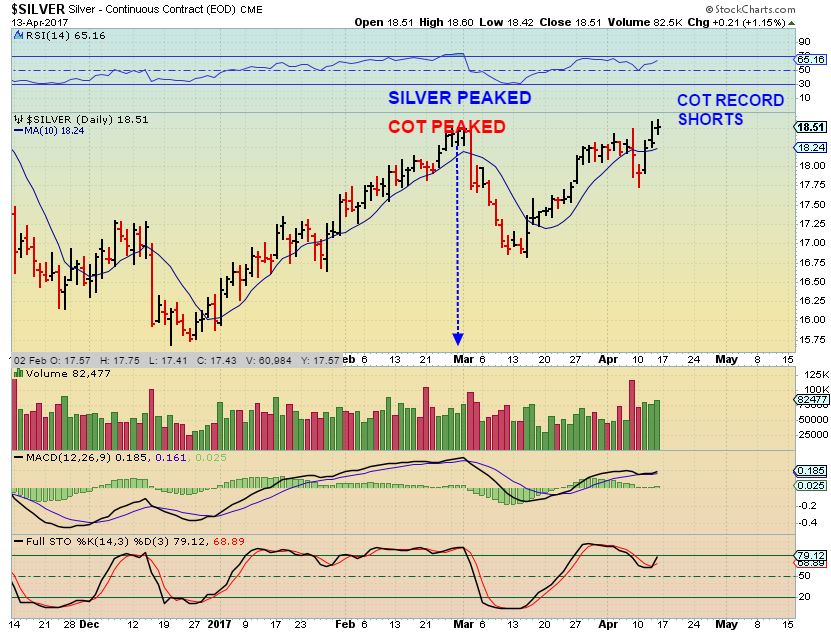
SILVER – So I have been saying how Bullish Silver looks, and this weekly chart looks very bullish to me. Is that an Inverse H&S with a target above 21? At the same time, quite a few junior silver stocks are lack luster at this point, near Dec 2016 lows. This usually isn’t what we see, when the Metals are making a bullish run, Miners usually lead. Next comes another ‘Mixed signals’ part…
The COT for Silver is showing that SMART MONEY is now holding record short positions in silver. They are more short Silver now than they have been in years. SO is this saying that Silver will drop sharply? It would seem so.
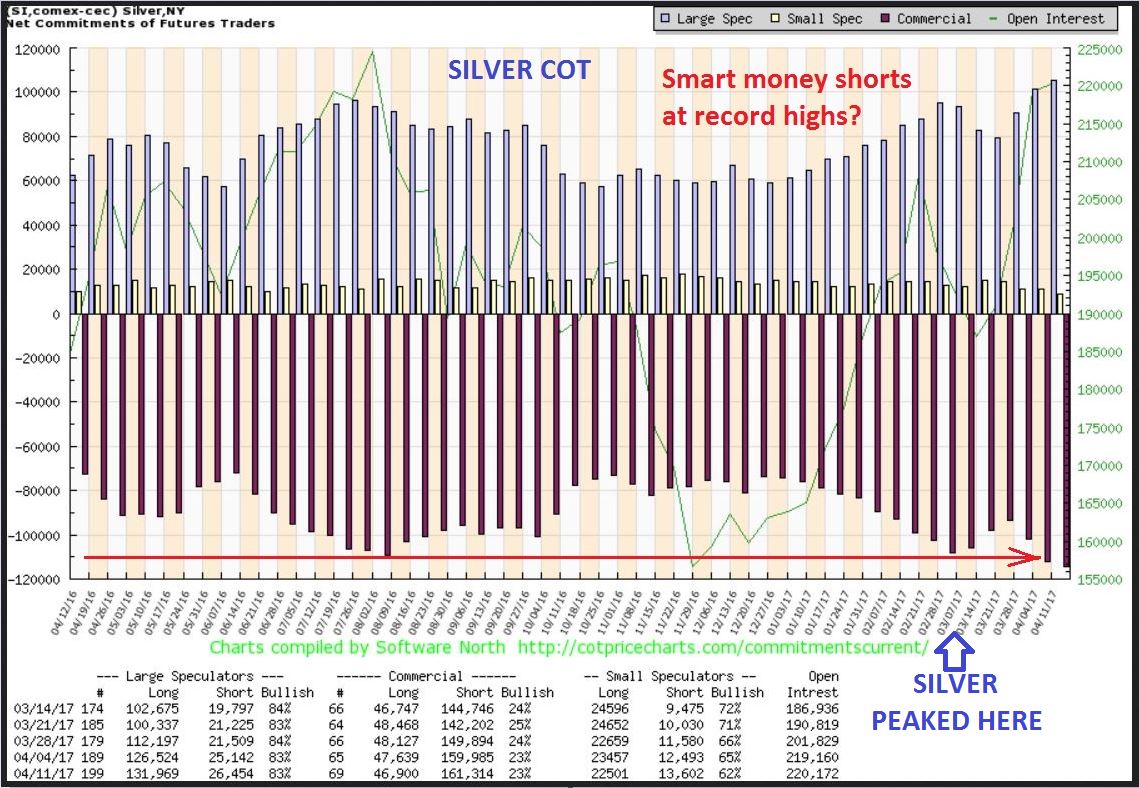
I was just comparing Silvers above high COT in March to the Silvers PEAK in Early March with what we see now. The COT is more bearish now, but I DO NOT use the COT as a timing tool, because I have seen short positions climb and climb along with price in Gold in the past, but it is good to take note of this situation.
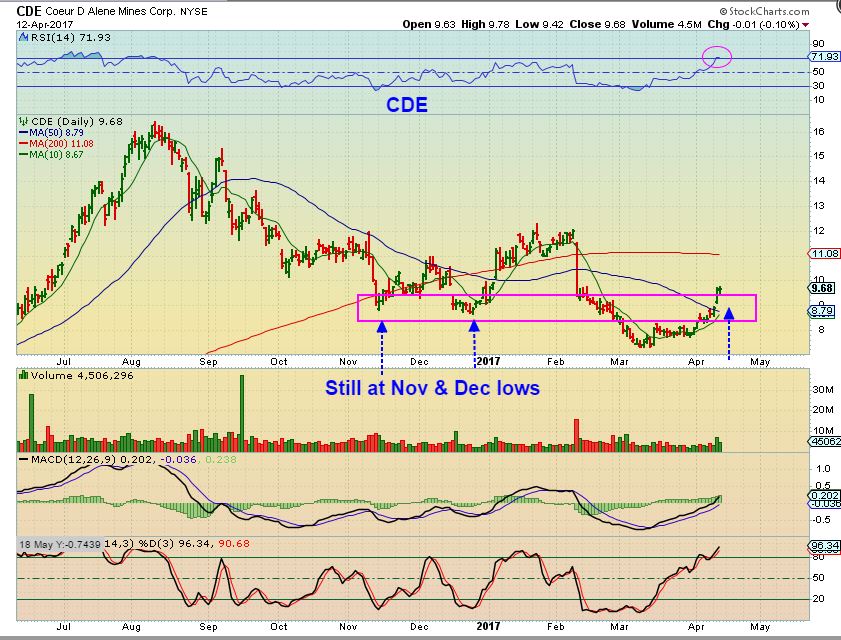
I will say this: Silver stocks like AG, CDE, SSRI, PAAS do look bullish in a weekly chart.
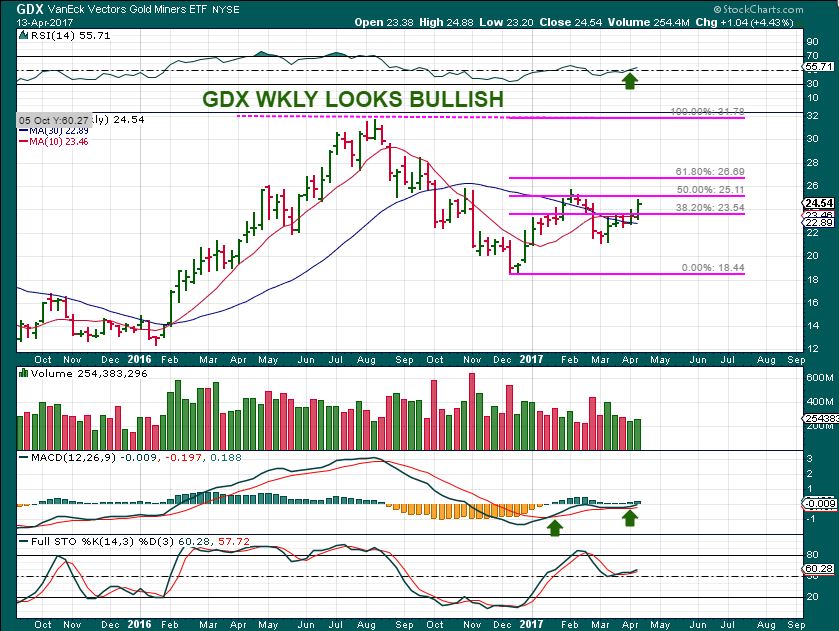
GDX WEEKLY – There is nothing that I can say about this chart that makes it look bearish. I would usually buy a close above the 10 MA on a weekly chart with MACD divergence in a heart beat. Some miners look bullish and others looked bearish, others have still started to move higher. The GDX WKLY chart looks quite bullish.
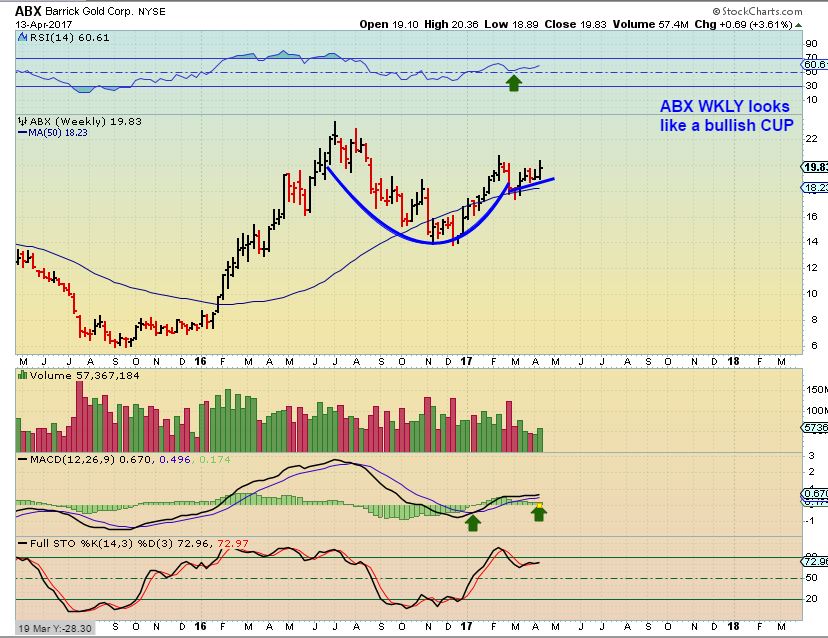
ABX WKLY – This also looks quite Bullish. It ran $14 to $20 + from Dec to Feb, and is back at $19.83.
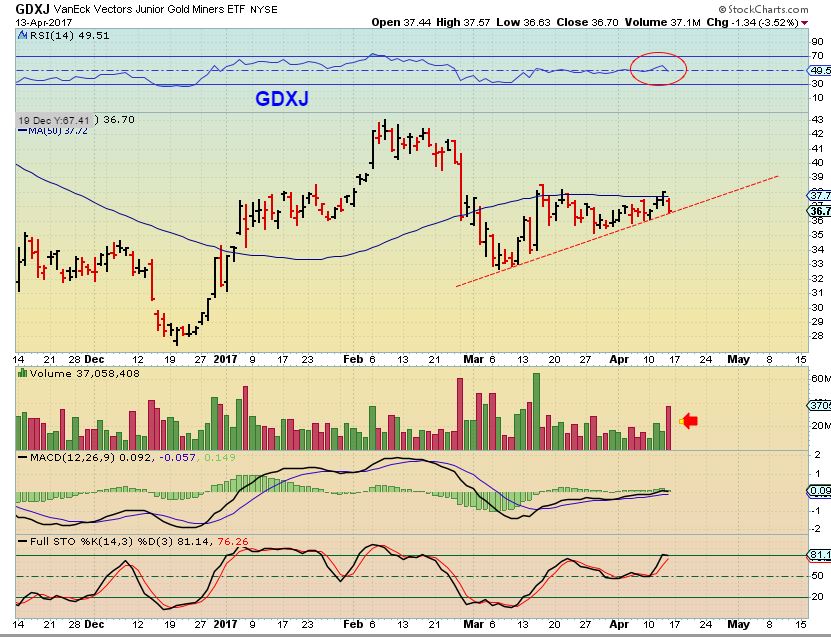
GDXJ DAILY FRIDAY- GDXJ sold off on Friday on increased volume and the RSI dropped slightly under the 50% mark. This looks less bullish that GDX. I kept some short GDXJ position on, because GDXJ is again struggling at the 50sma.
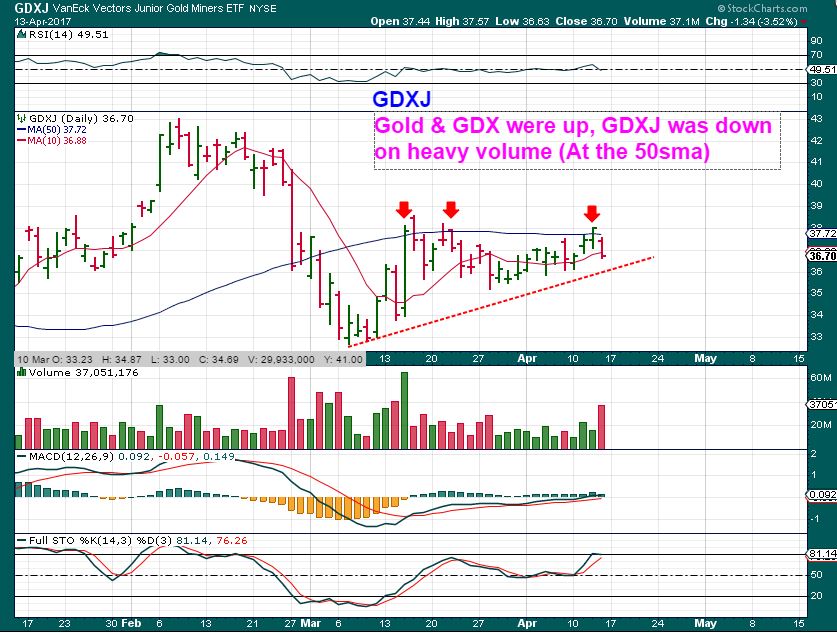
There have been some negative reports about GDXJs struggles, and they could be part of the problem here ( Funds may be slowly leaving GDXJ). That being the case, I’ve still seen that some of the Junior Miners have been a mixed bag of weakness and improvement. Whatever the case, GDXJ itself looks ready to break up or break down This week. Let’s look at some individual Juniors.
A FEW INDIVIDUAL MINERS:
.
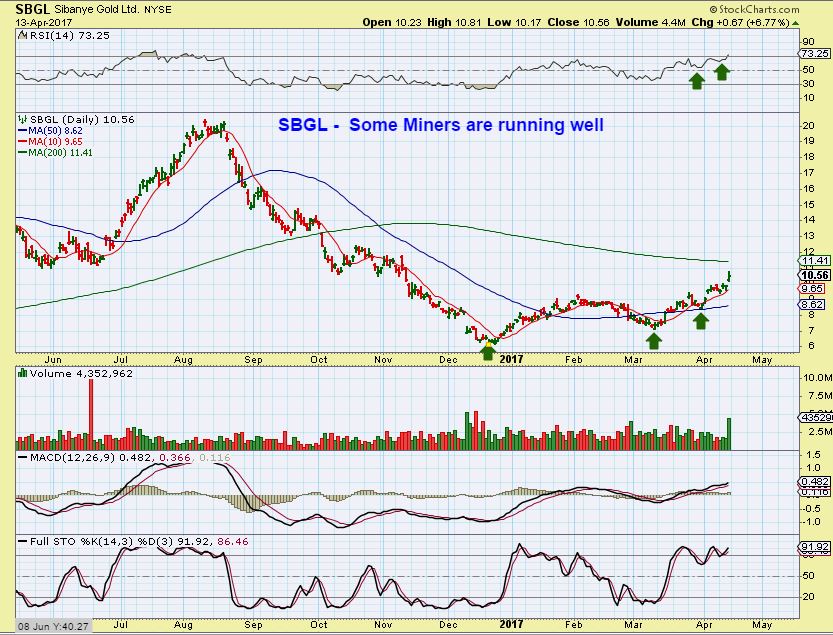
SBGL – SO I have been saying that some Miners do look to be improving, and could even be bought for a quick trade. SBGL is one of them. Higher highs and higher lows out of the Dec 2016 lows. Though SBGL ‘peaked’ in early February, it has now broken above those highs and seems to be heading to the 200sma. Others are doing this too, as GOLD remained strong in its 3rd daily cycle.
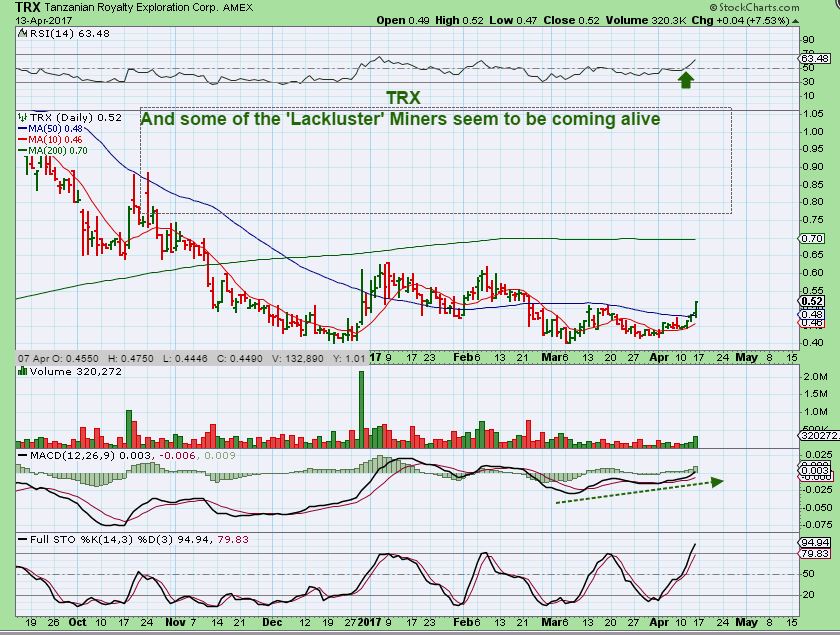
TRX – TRX actually peaked in Jan, double topped in Feb, and looked weak after that. Take a look now and it actually looks set up to break & run higher. It jumped 7% Friday as it pushed over the 50sma. If Gold keeps running for a bit longer, TRX may too. This could even be bought for a quick run to the highs ( 200sma?). I view the timing as higher risk, so I am cautious at this time.
Are all Miners just taking off now??
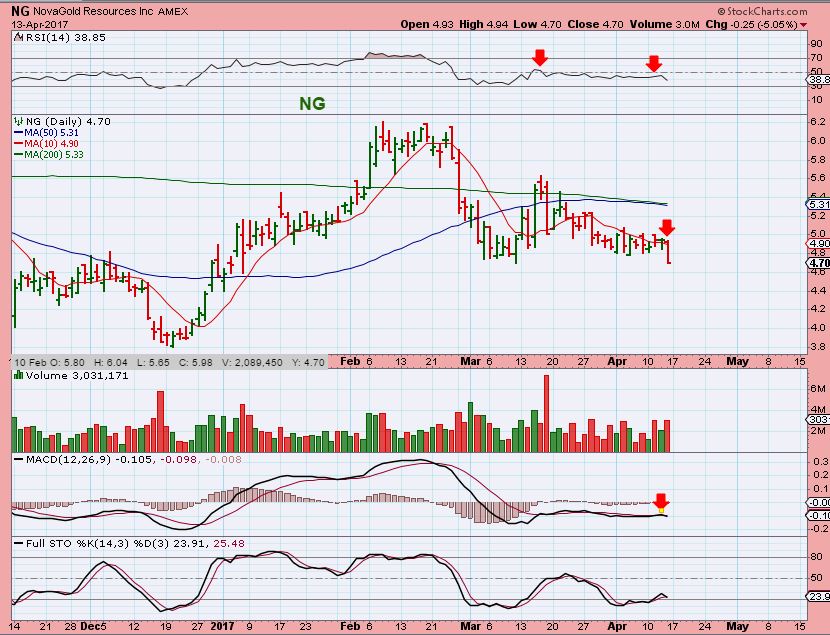
NG – Nova Gold was a great performer in Dec to February, but it sold off Friday with our GDXJ and lacks strength in the MACD & RSI. This looks like a H&S and looks to be breaking down. It is not alone…
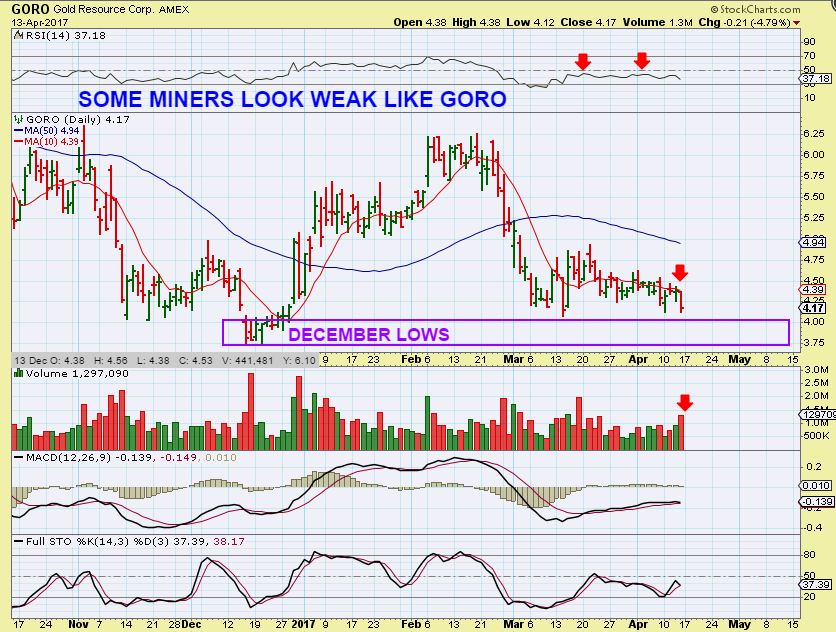
GORO was also strong in December to February, but it sold off Friday with our GDXJ. GORO is at the DEC lows.
CDE from Fridays report – CDE looks to be gaining traction, but is also basically at NOV & DEC lows. My point was that if anyone is feeling like they are missing some great moves, the whole sector is not acting that way. We still can see that some Miners are weak and lingering at lows, while others are showing signs of strength.
CONCLUSION: A MIXED BAG ACROSS THE BOARD.
SO when it comes to Energy stocks, we need to see if they are selling off and possibly just following the general market as it has begun to sell off. When it comes to the Precious Metals Sector, there continues to be a mixed situation there, with Bullish set ups and not so bullish miners. What we do see right now is that GOLD had 2 right translated daily cycles in Dec – March and now the 3rd daily cycle is showing follow through strength. Gold could target $1300 or even more before finally pulling back ( See Wed, Thurs, Fri reports for more).
This GOLD chart was in Fridays report and the target could be $1350 if it breaks out and does an A-B-C-D type move. Notice that Golds lows from DEC 2015 ran higher into the spring, went sideways for a period of time, and put in a stealth ICL in May, and then ran higher again. It really is a bit similar to what we see now. A stealth ICL in May again?
MINERS – Some are healthy looking and still others are weak, as shown in GORO and NG . I said in a report last week ( using AUY, AG, BTG, CDE, etc as examples), that some set ups look bullish and it is a personal decision that some might be willing to take a trade in a miner or too. I personally would just trade a couple of somewhat small positions, and only hold for a short period of time, and USE A STOP since we do expect a pull back into an ICL in May ( or June?). When Golds daily cycle tops, I believe these trades here will top too. Patience may also be best for some as we wait for this to play out.
May this review serve us with many reminders going forward, and we will just have to see what the next week brings for the General Markets, Oil, and Precious metals. It is very odd to be pointing out bullish set ups in some Miners, yet also holding a short position in GDXJ and expecting an ICL in a month or so. Things are different for short term traders than longer term traders waiting for lows. I’m hoping that this week may clarify things in this area. Enjoy the rest of your weekend!
~ ALEX
I will not have time to proof read this long report, please ignore any typos 🙂
TRADERS
.
GDXJ was ready to break out or break down very very soon ( this week) in the chart in the report above, so if it breaks out higher like GDX did, maybe following Gold a bit higher, some of the juniors may become a nice trade too.
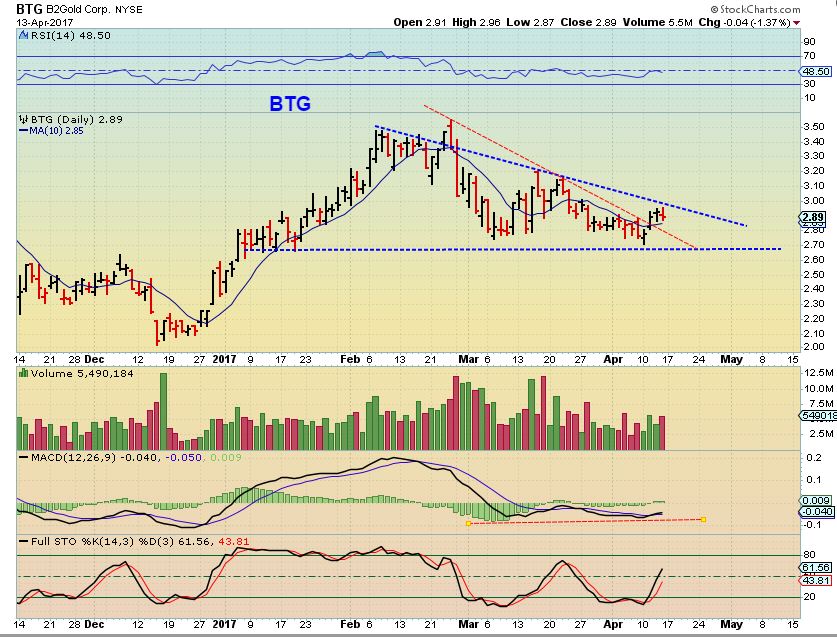
BTG- looks healthy and possibly ready to move higher if Gold does. It Ran up in Dec to Feb and has held up from selling off too deeply. I could see this running quickly to Feb highs if it broke out above the blue line, so it could be taken as a short term scalp trade. When an ICL is due for GOLD though, I believe that all Miners will drop, so this would be a fast trade. A stop below the recent lows would be fine. If so, what could the bigger picture look like?
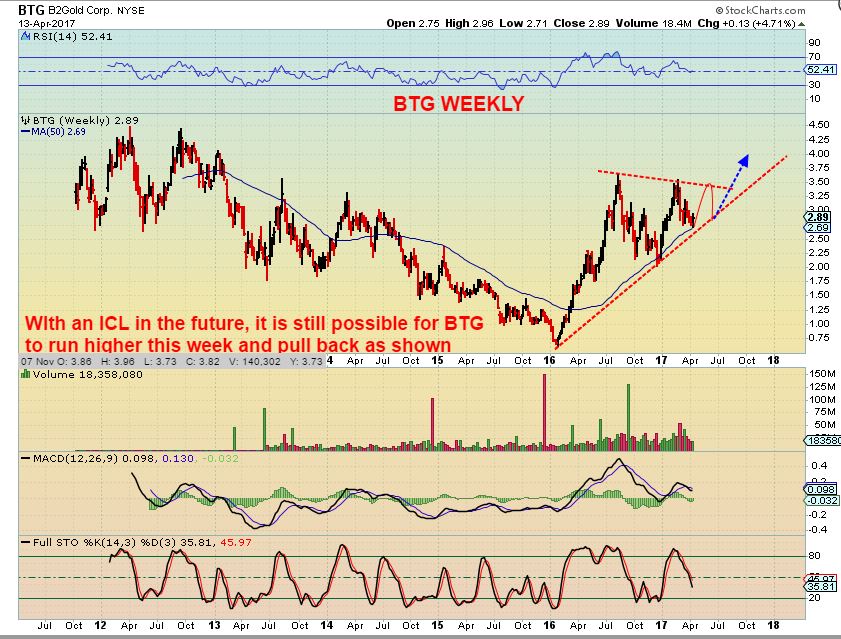
BTG WEEKLY BIG PIC – Look at the 50 weekly MA. Price hit there recently as support. A quick run higher to Feb highs and then a drop as Gold finds an ICL might just finish the current pattern.
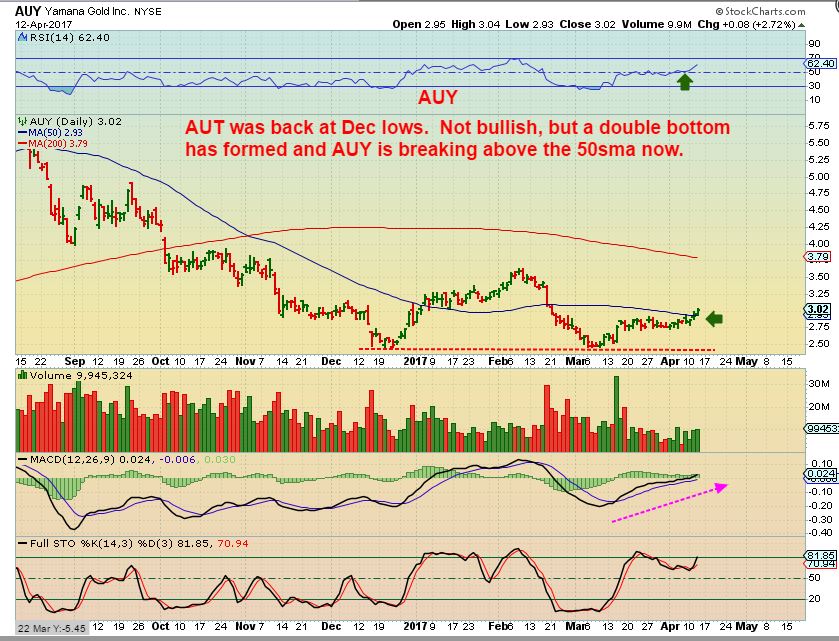
AUY LOOKS BULLISH – This was the daily chart that I put into Fridays report. It was at $3.02 & was breaking above the 50sma
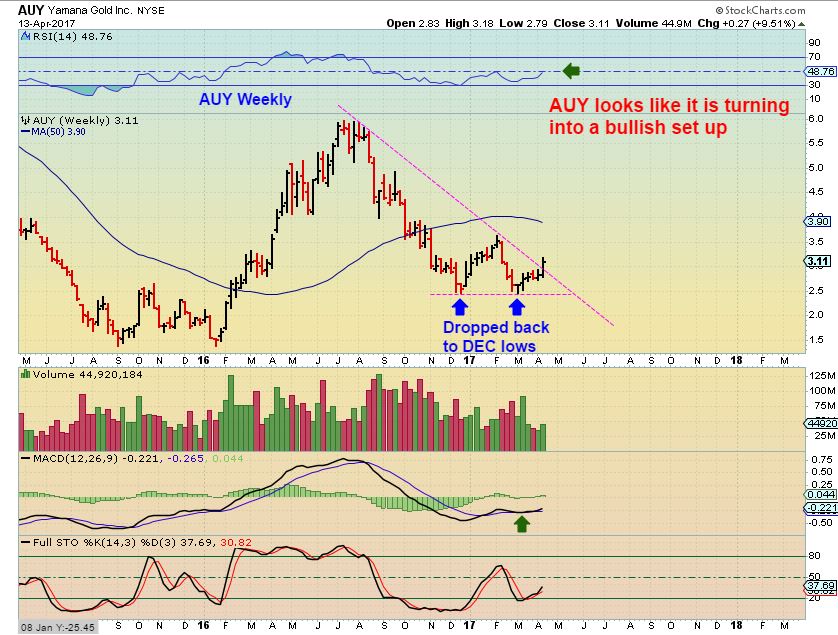
AUY WEEKLY _ I really like this chart now too, after it double bottomed at the Dec lows. AUY may make a quick run before Gold tops too.


Thanks! Another great report.
Alex, thanks for the super work! Found this piece interesting by Steven Bregman how ETFs (in general) are hindering proper price discovery. Maybe this is in play here where the market is so small that these imbalances get magnified: http://www.valuewalk.com/2016/10/steven-bregman-indexation-capitalist-tool-slides/??
jnug is a report out that ETF cant create more orders due to shortage? Why juniors are down?
http://www.zerohedge.com/news/2017-04-15/junior-gold-miner-etf-suspends-creation-orders-due-shortage-underlying-instruments
Thanks for the report. Hope you and the family had a lovely Easter weekend.
https://uploads.disquscdn.com/images/75cf10de7972a4166818139d85e2b28add1f76dc7ac71b72ce8aff10b4c3add2.jpg
I like the looks of this one (YGE), on weekly chart, too. I might get some. Also, I think SPX is gonna drop to 2310.
Great report Alex. Thanks!
Alex, what do you think of CLF?
Not liking it right here below that 200sma. It may reverse & recover, but I’d wait for strength to show up
Thanks…it was in my core and just went red.
Man, once CLF shot to $12, I never thought we’d see a $6 handle again! Way, way oversold on the daily! So I’d expect a snap back here soon, but I’d sell the next rally.
I have the order at break even in already. Got rid of my GPL about a week ago for a some profit. Trimmed a few other positions…even took small losses on a few…but I still am “herding cats”! LOL. At least I have some DUST and JDST to ease the coming pain a bit. I am attempting to hedge.
The word is GDXJ has an over funding problem where not enough juniors to go around to represent the ETF correctly.
Could explain the recent uneven trading lately. When an ETF does not follow the fundamentals then I do not want to be
a part of it. I sold it and will invest in individual Juniors in the future.
That would mean individual miners would need to be bought, so good for the junior sector and may be great for those in individual names. I don’t think it explains why the juniors have done more poorly than GDX of late though, that is a different issue and actually quite common in low volume times like we’ve seen recently, as less interest in mining sector overall usually means the more “obscure” junior sector is forgotten.
As proof I can say my individual juniors are now no longer outperforming both GDX and GDXJ, in fact the are weaker acting, in line with GDXJ’s performance.
i must say the whole mining sector is in the twilight zone lately.
U said it
Thinking out loud: if no new units in Gdxj due to not enough juniors to invest in (and maxed out near 20% ownership of the ones Gdxj wants to own) sounds to me like demand for juniors is going to fall at least marginally as gdxj steps away from the buying table.
Unless buyers divert those investment funds to individual stocks, short term buying pressure from this vehicle to juniors would slip. Being maxed out for Gdxj in this case is not bullish for juniors, IMO. How bearish remains to be seen.
Look up 3-6 month charts of
AKG, GPL, NG, GORO, EXK, DRD… breaking down noticeably
Still short via JDST – hasnt been really easy, but many Juniors breaking down
TGD, BALMF, TRX , and a few others breaking out higher.
EDIT- If you are pressed for time, just look up GPL, NG, and GORO – they are visually easy to see the weakness
I was able to use the recent strength to sell EXK and CDE. Many of these I may want to buy again but waiting for eventual ICL. So, if I can make a few bucks in JDST for now AND buy back lower, that’s a win!! The hard part is the patience – I hate waiting throught these choppy markets for the next big trade so much!
RIC just joined in after gaining the 200sma.
Wasn’t my fault on GPL this time!! But man, ugly candle for GPL today. Oh My!
Last Thursday I posted that I avoid trading GPL because it is a “widow maker” … now you know what I mean.
Man, gold continues to hold on here, almost hit $1300 overnight. Just refuses to die! Looks like JDST might finally be getting going? Hoping to at least get that trade right while waiting for the next big buying opportunity. Base metals continue lower and lower, man really really rough period for CLF here.
My Chinese friends told me they are dumping those steel stocks in China.
Clearly. CLF is extremely oversold here, but looks iffy long-term now.
Anyone still in MACK? It has not stopped me out, but man, now I’m starting to get bored. Sure did not break out and run!
I still own MACK & CGIX
Good to hear. I’m still up on the position, but it’s pennies.
https://twitter.com/michaelbatnick/status/854028774354153472 Ok, this is a problem for junior miners.
This is the issue.
That’s too bad, JNUG was fun while it lasted but the volume got way out of control.
Although this will set up a great buying opportunity in the individual names. It’s forced indiscriminate selling due to the ETF construction.
Are there any other junior indexed ETF’s?
Looks like the stock market is turning around. VIX looks like it has peaked and is now in a down trend on my charts. My favorite TQQQ (and QQQ) both hit their 50 day SMA last Thursday, that was the buying opp I’ve been waiting for. I’ve been buying TQQQ today. Waited to see if there would be an afternoon sell-off like last Thursday but that has not happened so I have been increasing my positions throughout the day. Stop below the 50 day SMA seem like a pretty good entry. Still not quite the “fat pitch” trade I’ve been waiting/hoping for, but worth a shot with fairly limited risk.
Thought of you with TQQQ today. Got in too
Yes, much of the research I read yesterday pointed to Thurs being a tradeable low in the market. Unfortunately, most of my positions failed to move up with the broader market. 🙁 and my SPY positions from earlier still pretty far OOTM.
Any one else enjoying – ahem- “the action” from SXE today?
miners continue to confuse
No kidding, right? Solid rally into the close. And with JNUG and JNUG “off” each other by about 3%? Nuts. I’d like a solid trending move and a buyable low!
DWT and SCO look really good right here.
Is anyone else having trouble getting thru. ?