
April 9 – Weekend Report
As time moves forward, the Market big picture always become clearer, so let’s see what has been happening this week, with a few added ‘surprises’. I’ll also add in 3 more trade ideas.
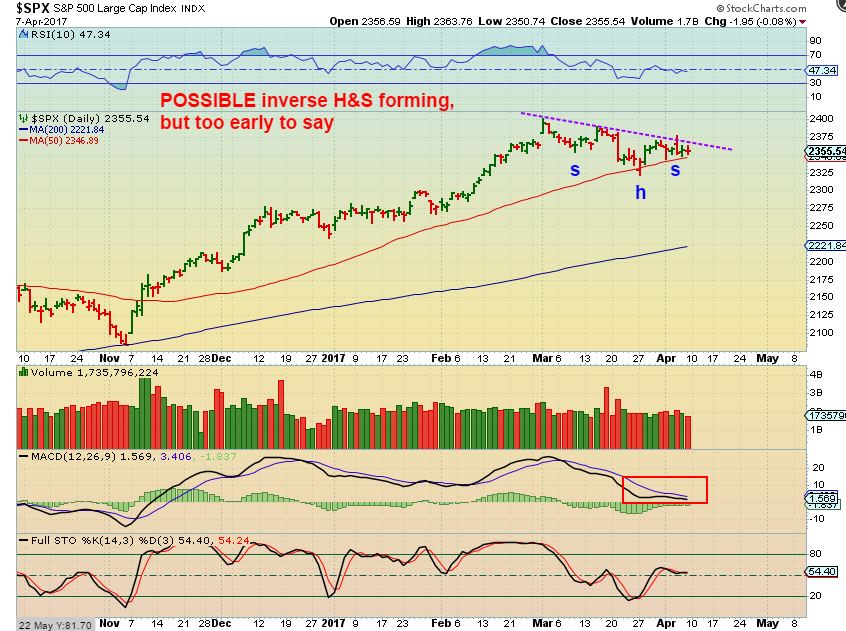
SPX – This is a possible inverse H&S forming now. The DCL would be the head, and whether or not you took a long trade while waiting to see how this develops ( I have had concerns based on the XLF and a few other factors) you can see that you have not missed any great move in these choppy markets. Notice that Price is STILL the same price as day 1, the first day after the swing low! That said, If you want to go long based on the possible inverse H&S and place a stop under the 50sma with a little wiggle room, this is as good a place as any to do that risk reward wise.
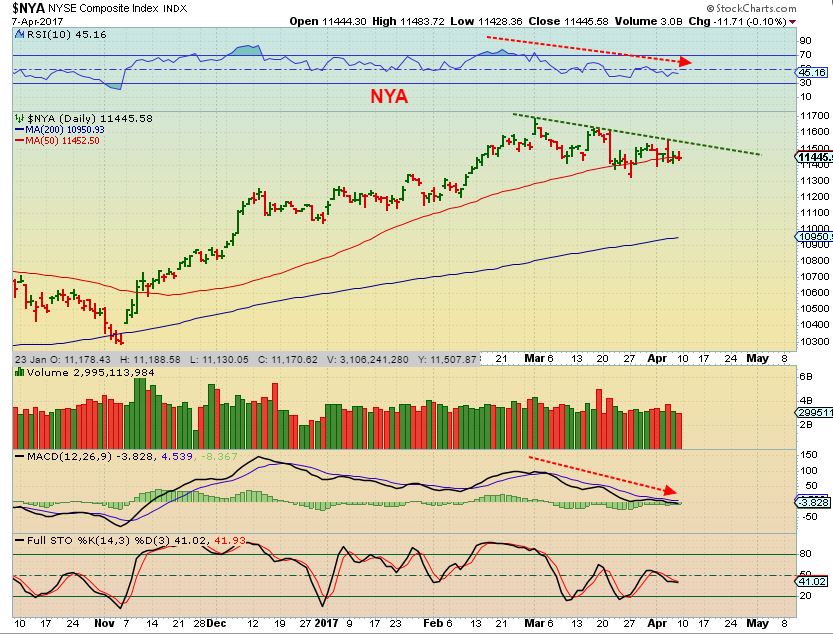
NYA – I was concerned with the dropping MACD , so I still have concerns there…
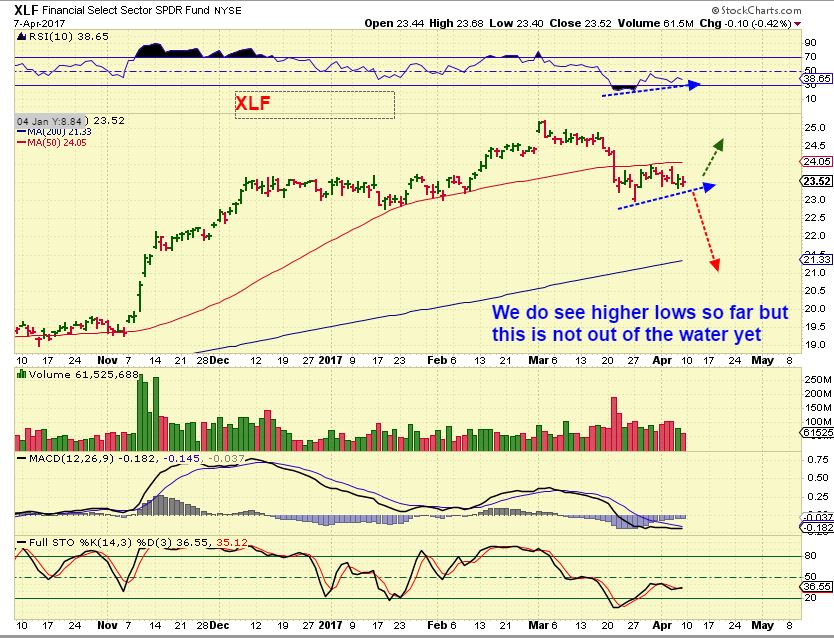
XLF – One of my main concerns was the financials and bank stocks like GS, BAC, JPM, etc. Until I see a recovery, I will still be concerned, but again, price is at a low risk reward area in some of the General Markets. I am not Long or short currently.
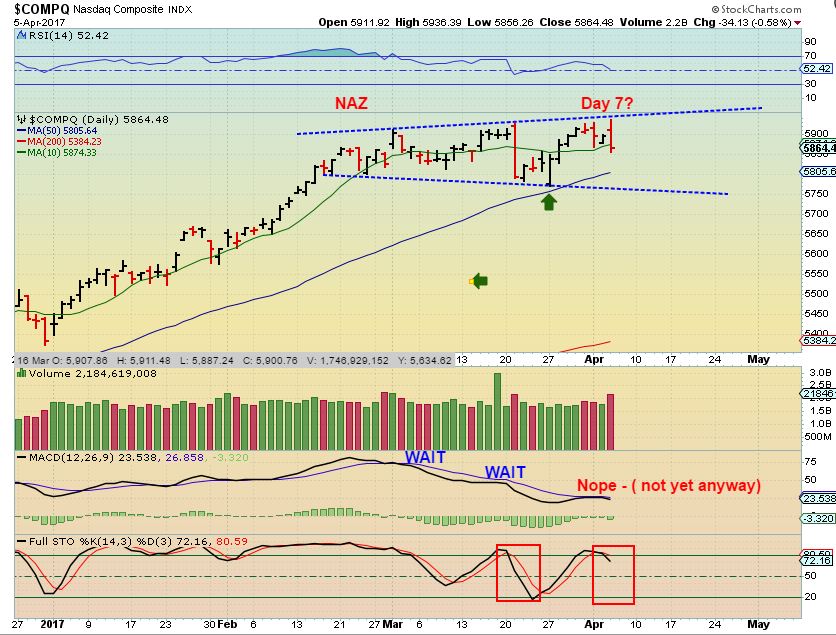
NASDAQ – We Don’t want to get too bullish and forget this chart from Thursdays report of the NASDAQ on Wednesday. This is still in place and that MACD has dropped further. Markets have just been very choppy and volatile and I am still cautious on their ability to gain more upside at this point. They need to prove themselves and the Financials need to do that soon, in my opinion.
NOTE: This weekend report needs to be a bit more to the point in some areas, if I am to release it on Sunday. It will still be a full report, but I usually put in older charts of every sector and show expectations of Then & Now, and time today is limited for me to get this out Sunday night. If I can’t shorten it, it will not be released until Monday morning, and it may be too long for some to read and digest before the market opens. So if you need more reminders of what I was expecting in the past with THE USD, OIL, NATGAS, GOLD, etc. etc., you will have time to review older reports ( See the Friday after the Syrian Attack report, The Thursday after the Fed Minutes release on Wednesday report, etc) with this weekend report.
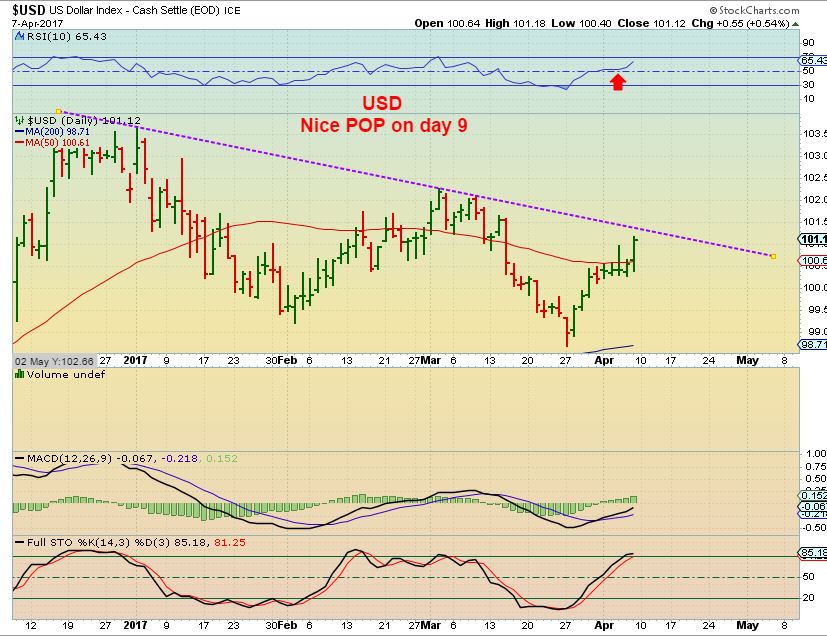
USD – After the Syrian attack, Gold burst higher by $20 Thursday night and the dollar dropped rapidly. My Friday report was asking if this was a “Knee jerk reaction or chain reaction?”. In other words, just a quick reaction or would this start some follow through? So with the USD selling off Thursday night, did it have follow through to the downside and break down? Look how that ended by the close Friday.
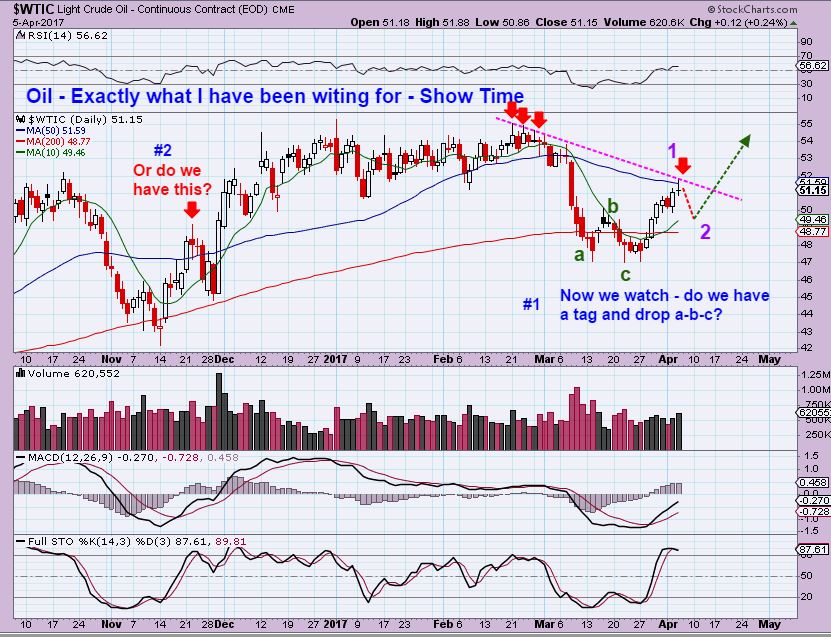
WTIC – This was in Thursdays report from Wednesdays chart. I was showing that OIL could possibly pause and then break above the 50sma, with ‘c’ actually acting as an ICL. This was still only 1 of 2 possibilities. The other a drop to new lows from here into an ICL.
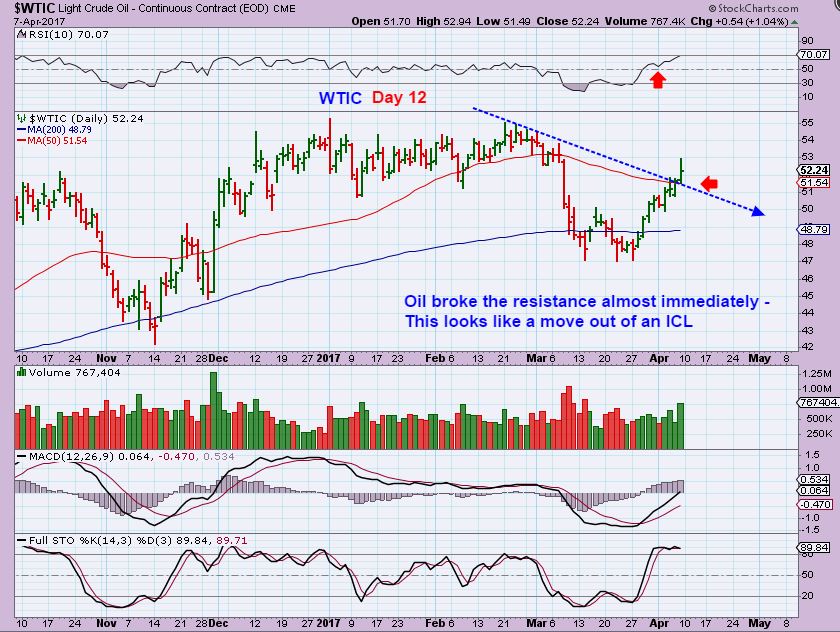
WTIC – FRIDAYS TRADING could be the identification of something important. Last week I said that the Energy picks that I presented look even more bullish after OIL paused at the 50sma. Why? Because the Oil stocks broke above their 50sma and could be leading the way. We were on alert that OIL may have put in the ICL ( Final low) on the double bottom, when March 22 slightly broke below that first low ( the one that I did not think was an ICL). Now we see a triple bottom!
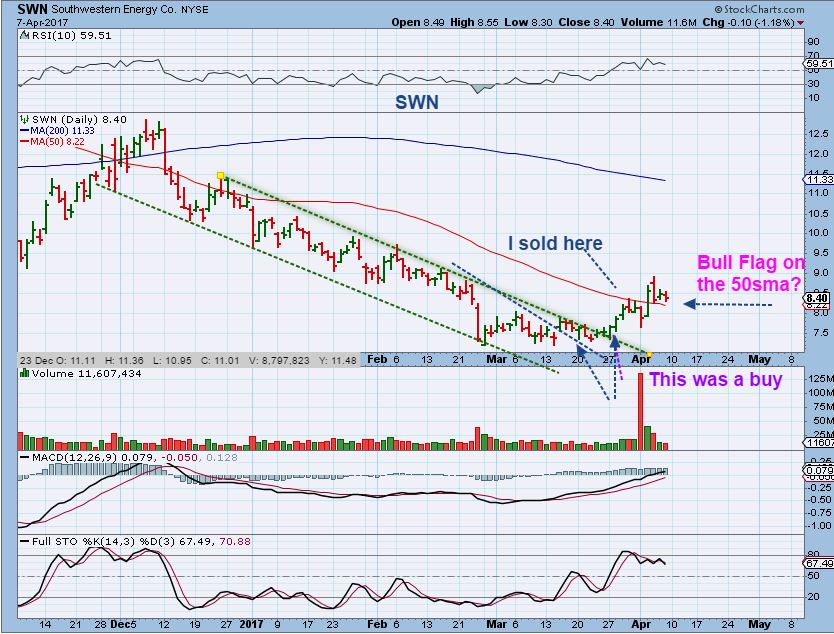
FRIDAY OIL BROKE ABOVE THE 50SMA too, and the RSI is at 70. A strong 12 day rally out of the lows does with the RSI at 70 is better that the rally out of the Nov lows, not just a weaker back test. A trend line break happened on Friday too. I am seeing a bullish set up in Energy stocks, and am no longer interested in shorting the back test of the 50sma like I originally planned. This is my current analysis of what we see here, and we also took the trades at the lows, so we missed nothing in the big picture. I got out of SWN & OAS, but will now likely look to re-buy. I will explain more of my prior thinking on OIL in a minute.
XLE – As stated in prior reports, The XLE and Energy stocks themselves was two of the things that alerted me to the bullishness of Oils recent low. XLE broke the trend line& 50sma, many Energy stocks regained their 50sma and trend lines too, and still sit above them.
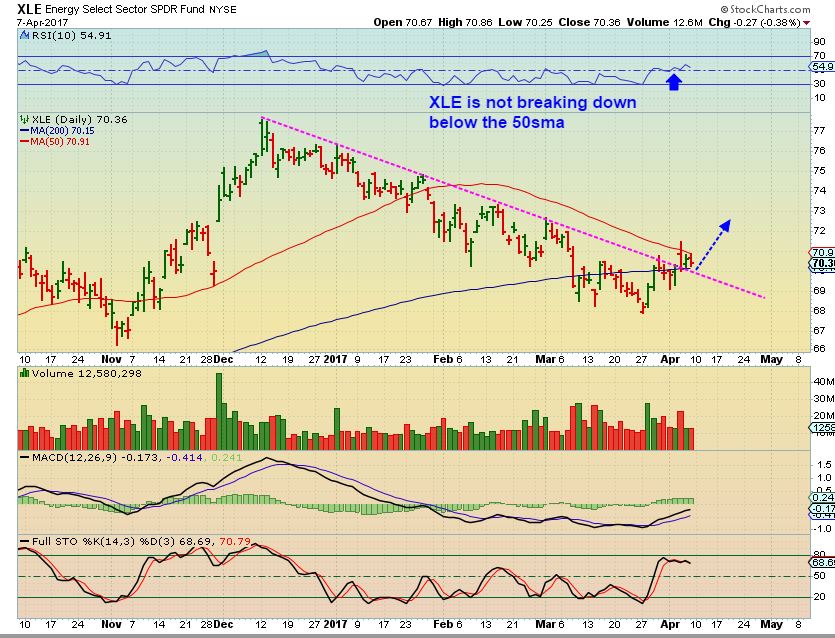
Look at SWM, OAS, LPI and others and they remain above the 50sma, and the RSI is still strong, so these may have their lows in place.
Current thoughts remain the same as last week, where the more bullish scenario seems likely: I did not re-enter my trades yet, I want another day or two to gain more evidence, but the set up seems more bullish than bearish at this point. Monday could say a lot. We made money on a few trades off of the lows and price is still not far off of the lows if we need to re-enter.
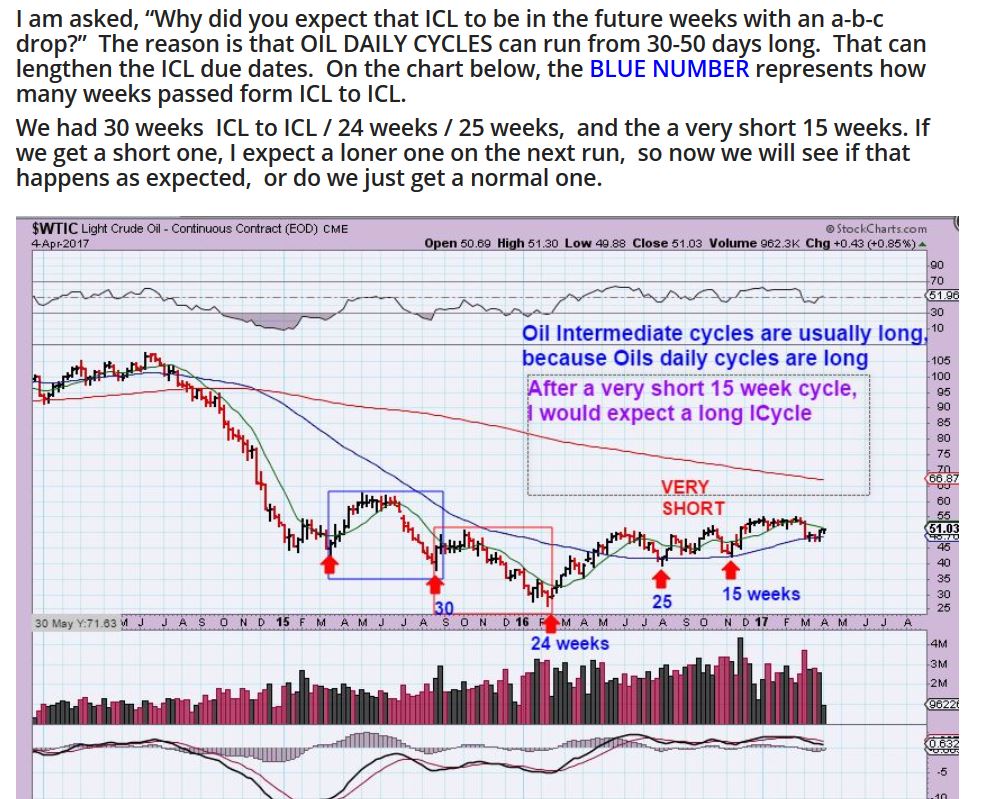
SO, Why did I originally think that OIL could have a lower low for the next ICL after a back test of the 50sma? Partly it was the COT reading with smart money extremely short ( Record levels). I also saw a lot of bullishness with OIL going sideways between $51 & $55 for many weeks ( Months), and I thought that that would need a cleansing. Also I wrote this chart below in a prior report and cut it from the report on April 4th to avoid confusion. Now is the time to add it back in, so you can click on it and the chart and the writing will pop up. The idea is that I was thinking that we had a VERY short ICL to ICL ( 15 weeks) , the next would usually be a longer than normal one. See the chart.
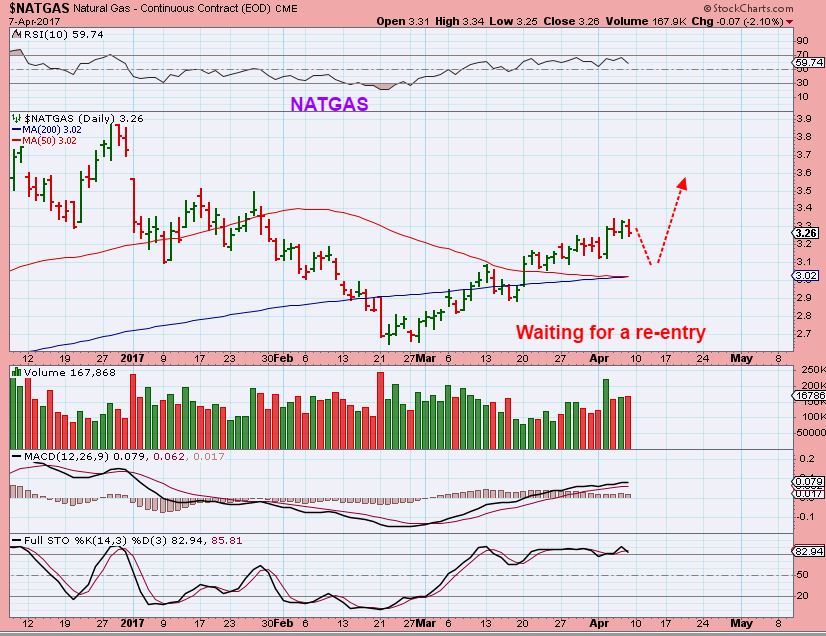
NATGAS – I’m still hoping for a drop into a dcl to get a lower entry for another run higher.
.
GOLD, SILVER, & MINERS
.
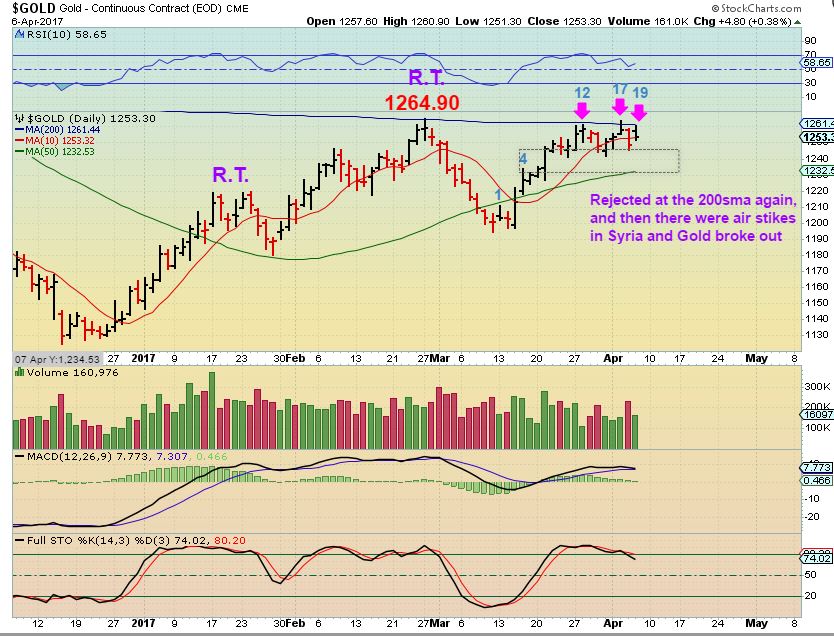
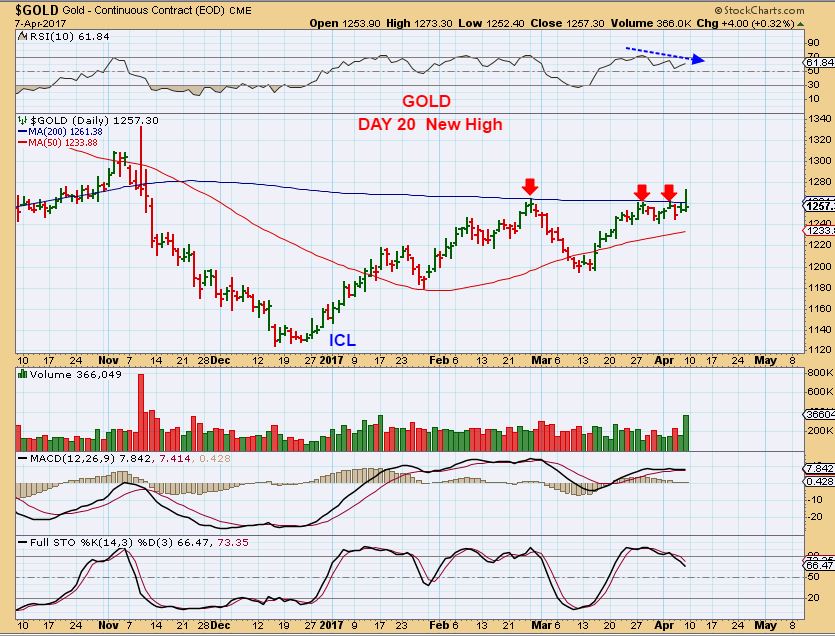
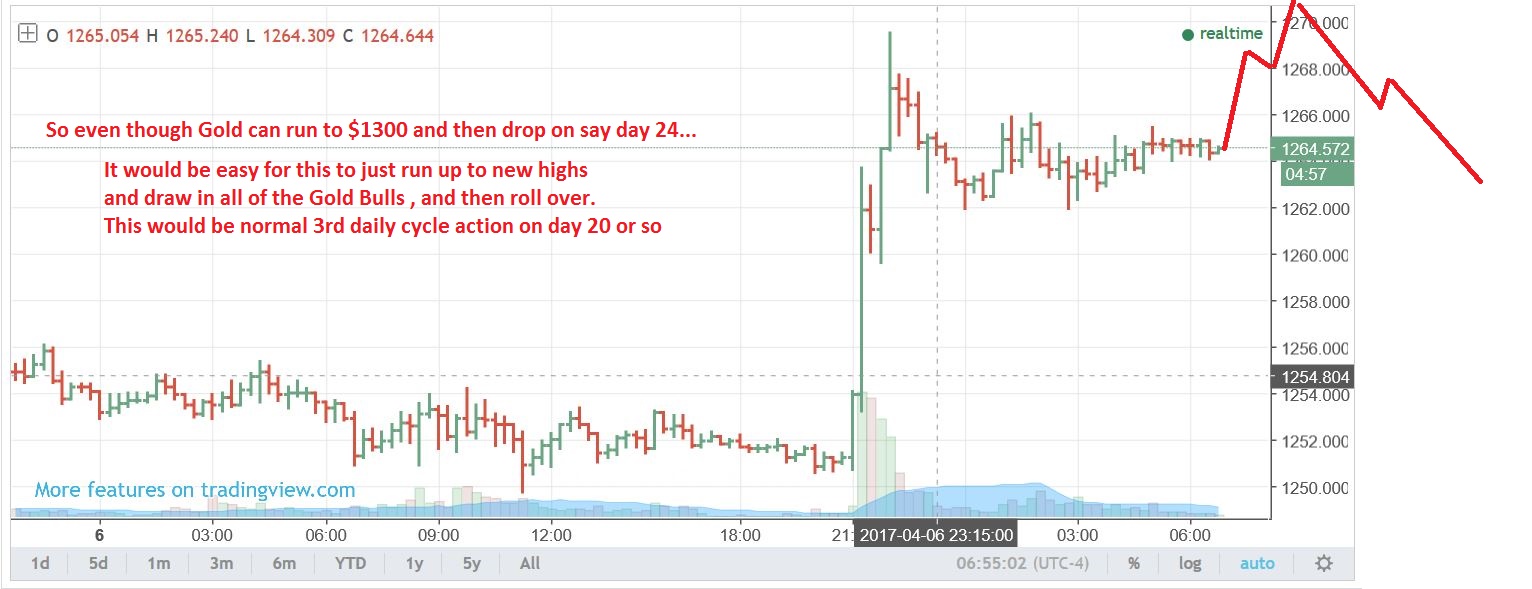
GOLD – I will review Gold. Friday was day 20 and this was our day 19 , Gold has been repeatedly rejected at the 200sma. Syrian air strikes surged Gold above the 200sma. This looked Bullish, and many traders wanted to just ” Jump in Miners for the next leg up!”, but I was saying that it is late. Though Gold could Pop to $1300 in 2 $20 days, this could be a fake out move, a knee jerk reaction. I said that I would not be going long ( see Fridays report).
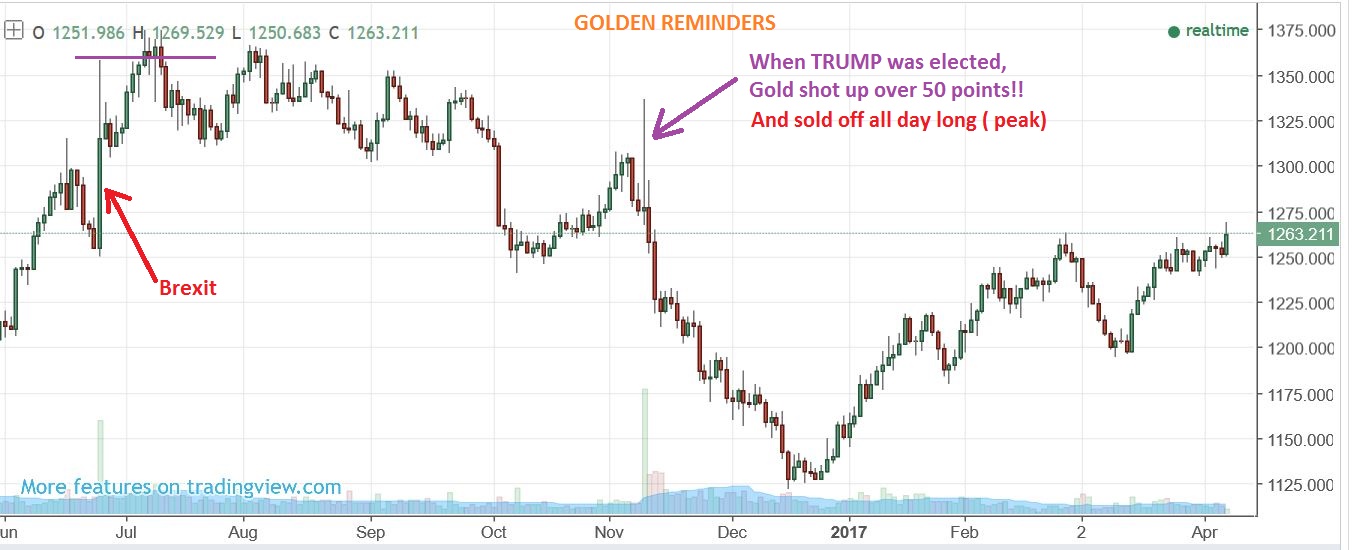
Also from Friday A.M. s report. Gold did look very Bullish, but I warned that I have seen this new event type POP before. A reminder actually, that we all have seen this before, because …
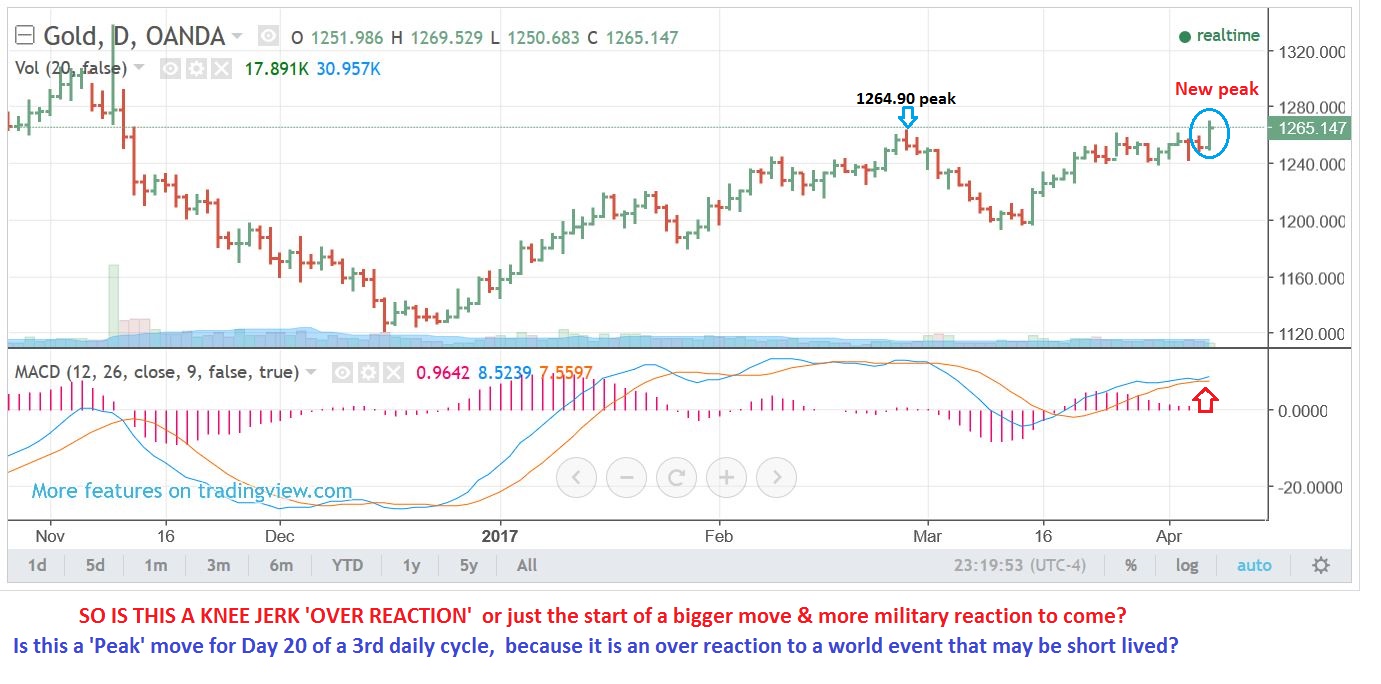
I posted this Friday a.m. – Trumps overnight $50 POP, was the TOP. BREXITS POP was around the top in price too. Therefore this could top a 3rd daily cycle too.
GOLD FRIDAY AFTER THE CLOSE – This could be the intermediate cycle peak, it is a bearish reversal most of the time. That pop did not cause a surge of short covering and Bulls taking control to give it follow through. It sold off. Now I want to see what Sunday night and Monday can do.
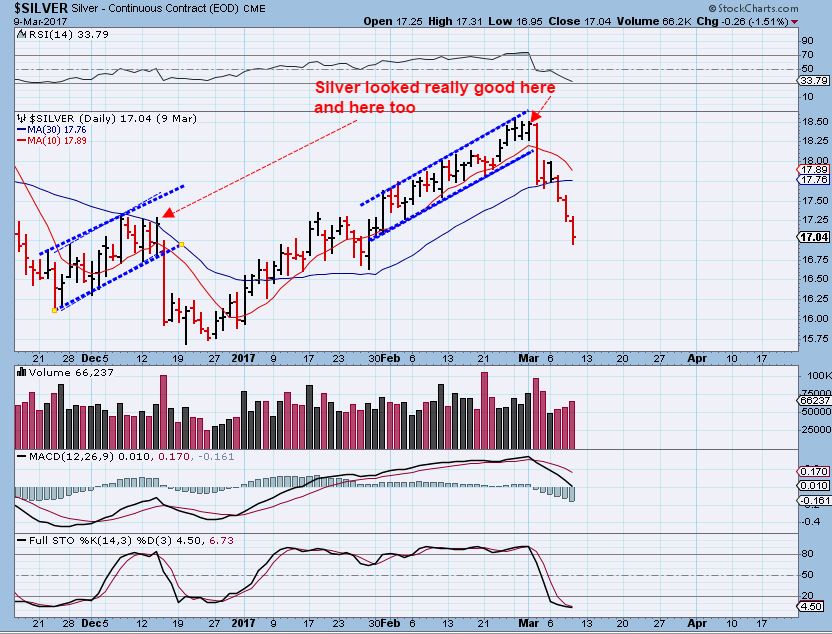
SILVER – MARCH 31 – So many buyers waiting for the break out. I warned that no matter how Bullish Silver looks here on March 31, beware because …
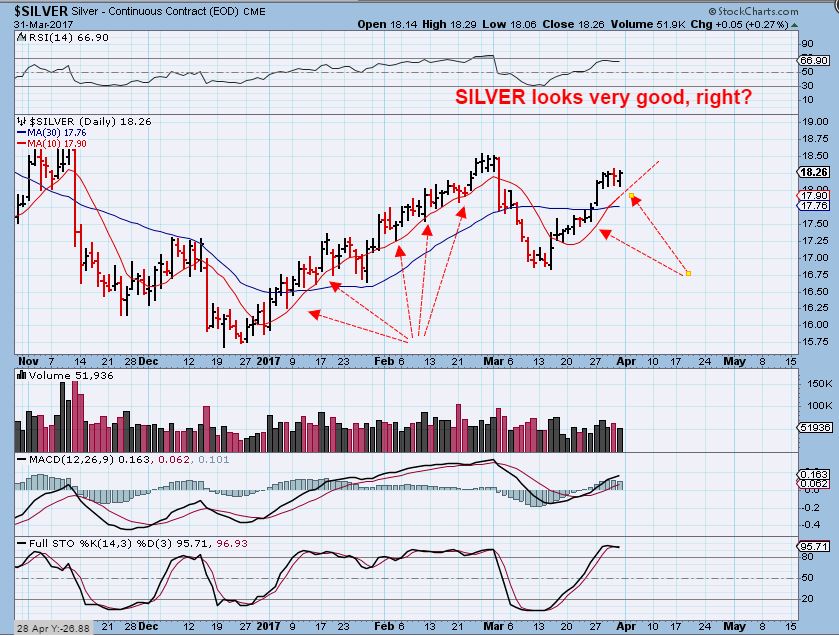
This type of Drop ( 2 shown) can come out of nowhere with Silver this late in a daily cycle.
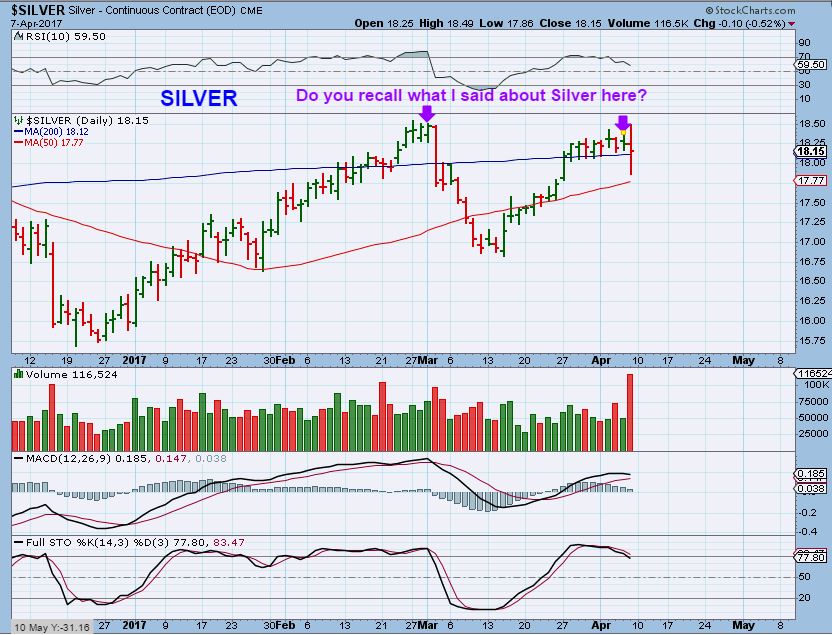
And now we have that drop exactly 5 days later, and buyers on March 31 never really made money. Now Silver did lose the 200sma on Friday, and stockcharts has the wrong closing price. Silver is at $17.96, and that is a close below the 200sma. Notice that Silver has gone nowhere since March 27th , 9 trading days ago, and is again below the 200sma with a reversal on Friday.
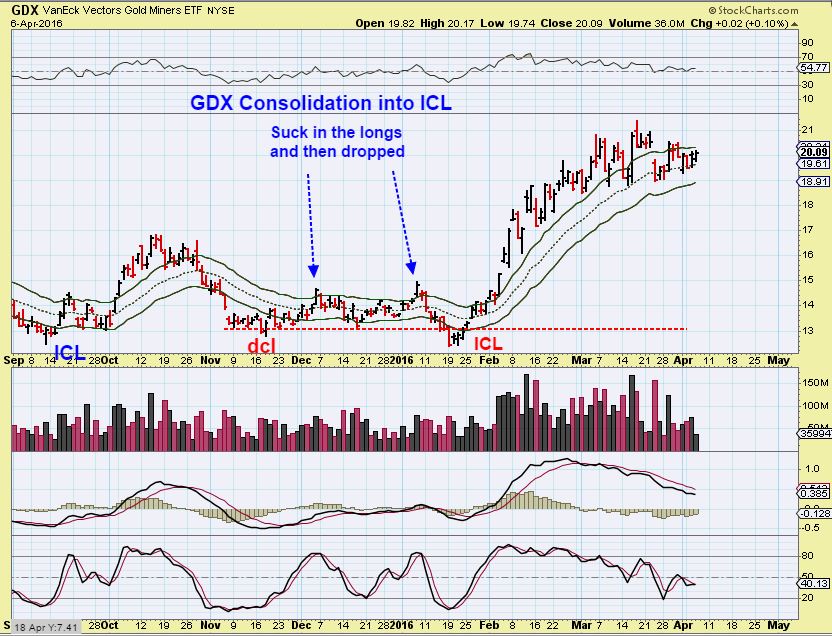
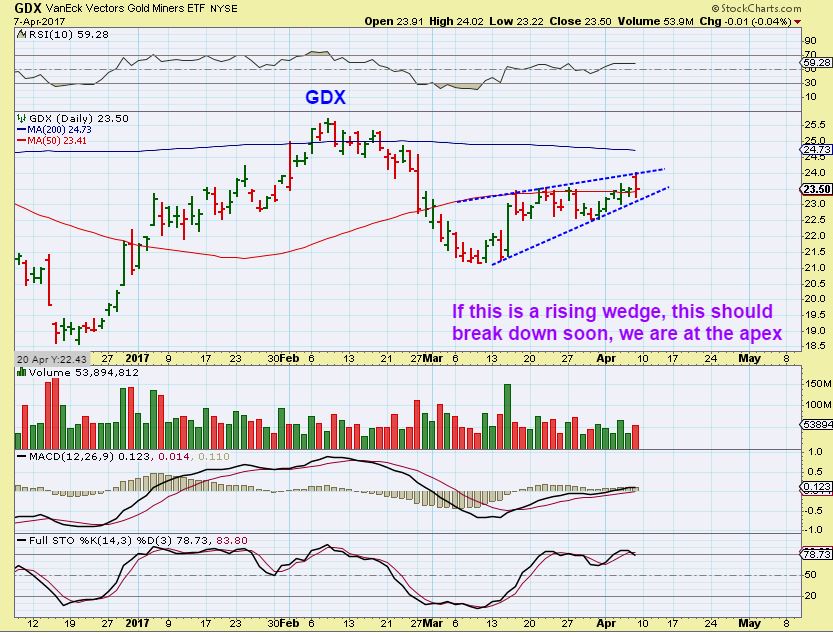
GDX – This was a reminder that POP’s in the past have also fooled BULLS when the timing was right for a drop. We needed this reminder Friday, because MINERS WERE SET TO POP and People were asking, “What if this is…?” Or ” This is very Bullish, we need to just get in. ” And what if everyone was screaming on Twitter , “Last chance to buy JNUG before the next HUGE rally”. I felt that this reminder & Caution on that Friday pre-market pop was needed. GDX was up 40 cents in Pre-market.
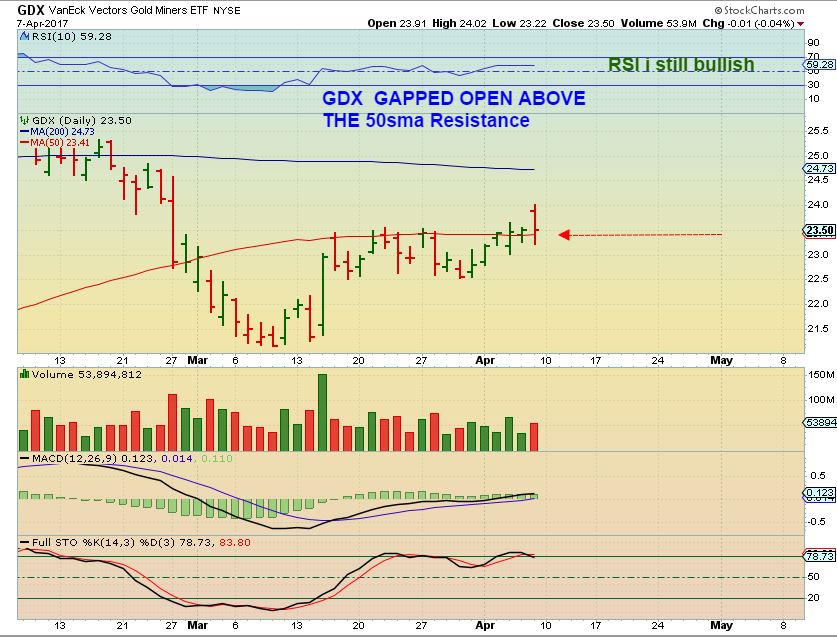
GDX- A 40 cent gap open occurred on Friday, yet GDX closed down 1 cent. It was a believable POP above the 50sma, but then it dropped. Yes, Monday it can still go higher, but that was disheartening for the Bulls and it is getting late as you know. Could that Gap open have just been a be a fake out to suck in more ‘longs’ and a 40 cents gap open to get shorts to cover in fear of a rally?
GDX – I see it this way , and this is called a ‘bearish rising wedge’ if it does not break out higher soon. We are late in the daily cycle and I’ve been cautioning about a possible bearish drop for a while now .
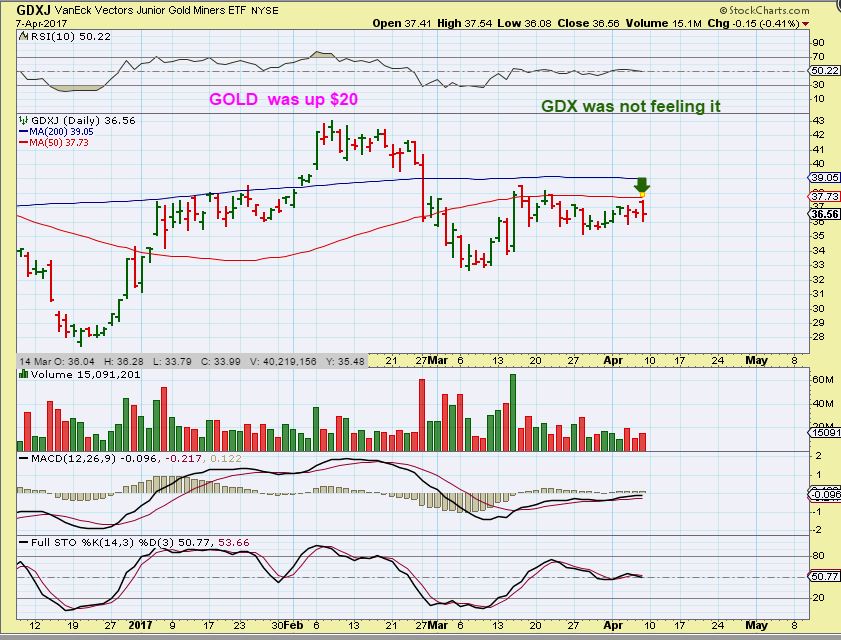
GDXJ – Even with Gold up $20 overnight after that attack on Syria, GDXJ did not break above the 50sma, and then it sold off on top of that. I have been going short at the 50sma and that bounces JDST between $12+ to $15+. As a small Cautionary note for the bears – Believe it or not, I still have a bullish MACD on GDX & GDXJ, but it is getting late for the Bulls to prove themselves. I think we are going to finally see a drop this week.
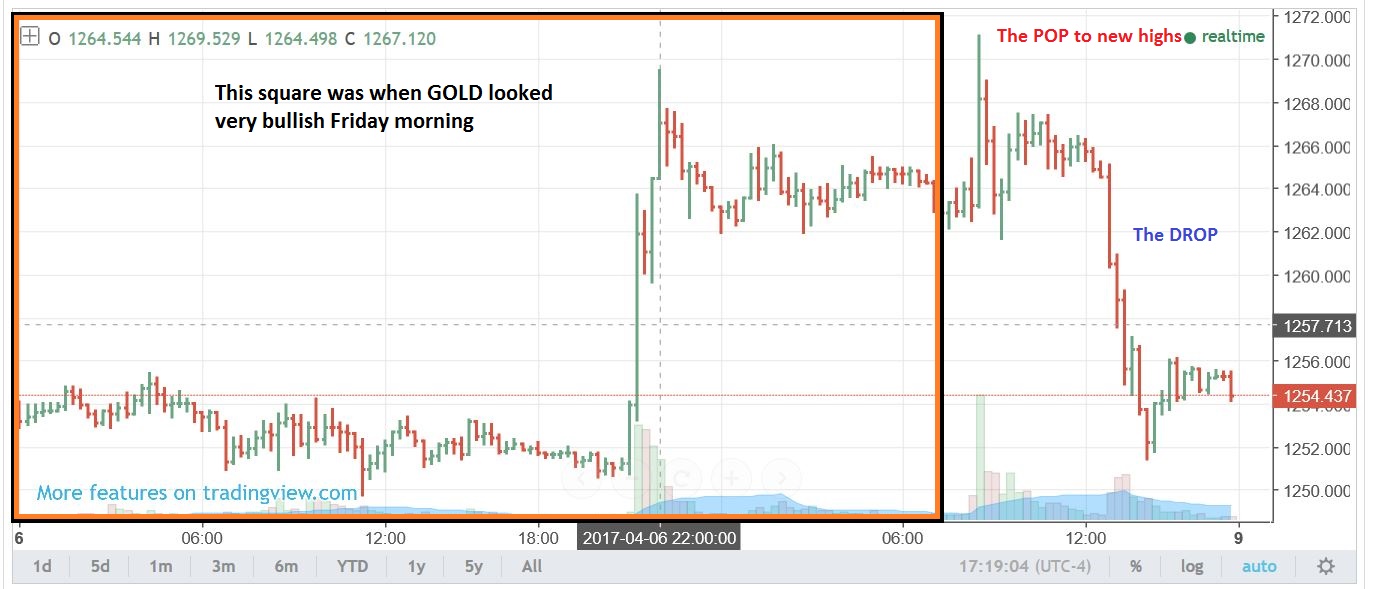
I drew this as the last chart in the Friday morning report. Gold broke to new highs finally above the 200sma, and was bull flagging. I showed here that GOLD could again break higher Friday to suck in the bulls, and then give it all up. Read the chart.
.
Gold did play out that way by the end of the day. This double break out to new highs really got the Bulls excited, and then dropped them off as it sold off into the close. Now we’ll see which was they can push this thing, but it seems that the path of least resistance is down at this point. 🙂
.
It has to be noted that Geopolitical tensions are rising, so things are remaining Jumpy and a bit choppy. North Korea is rising to the top of the list of rising tensions too. I dont want to be ‘afraid to trade’ just because of these possible events. In other words, I don’t want to not trade my set ups thinking …”if ‘something’ happened with N.Korea…” I cannot predict that, and there are always ‘things’ that can happen and markets do often climb ‘a wall of worry’. Let’s just say that at times it may be best to adjust your position sizes, Really think about how many positions should be traded at this time, How much should remain Cash on hand for future opportunities, and just adjust your trading, trade a bit differently than you normally may, based on the possible threat of choppiness in the future due to Geopolitical tensions. That is what I do under various circumstances. ADJUST YOUR RISK BY ADJUSTING YOUR TRADING TO THE CURRENT ENVIRONMENT. Being “ALL IN” with 30 stock trades currently in place in volatile markets is just risky, right? We can control our risk. Also, a military situation could take weeks to plan out & set up. It is possible that the next ICL comes about as tensions really begin to mount a month from now, who really knows? At this point my analysis is as stated above, with a dash of caution as we deal with a few unknowns and the current choppy volatility.
ENJOY YOUR SUNDAY EVENING AND THANKS FOR BEING HERE! 🙂
~ALEX
.
TRADES – Any trades in this choppy environment do have a bit of added risk, even if I say that they are ‘low risk set ups’. That only means that the downside likelihood is minimal where you would exit the trade if it goes against you, and upside potential is better if it follows through. Use caution & Stops when trading in our current TREND-LESS environment. Some may wish to just be patient and wait for a nice predictable trending move. The following 3 trade set ups look promising if they have the necessary follow through.
.
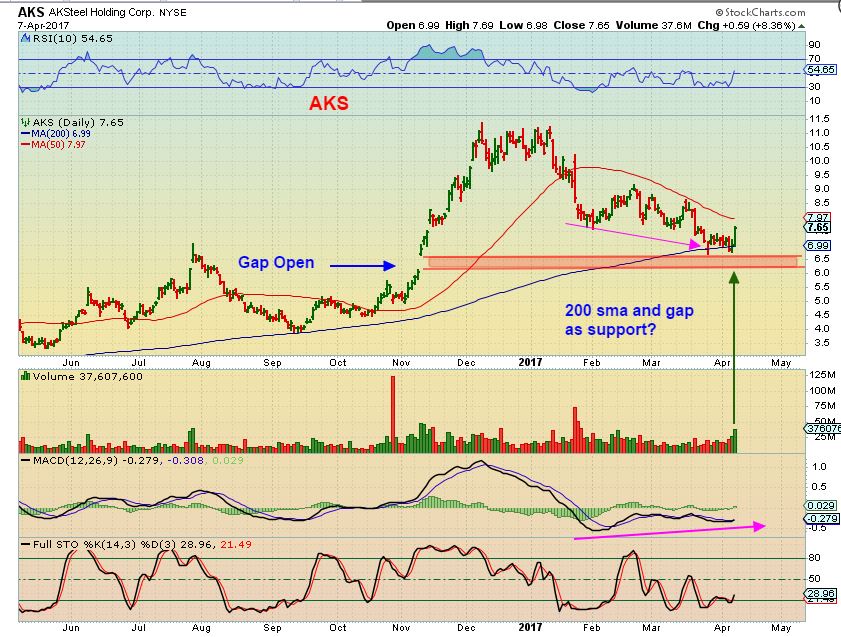
AKS– Some steel stocks bounced again on Friday, like AKS, X, STLD, and ZEUS. These have been very choppy lately too, making a short term trade difficult or frustrating,. Currently hovering above an open gap and bouncing off of the 200sma,the AKS set up saw a strong POP Friday. It looks good and can be considered lower risk with a stop below recent lows ( Although the possible gap fill remains a concern. A stop below the gap is a tad deep, so maybe buying a break above the 50sma adds confidence in a bullish potential?).
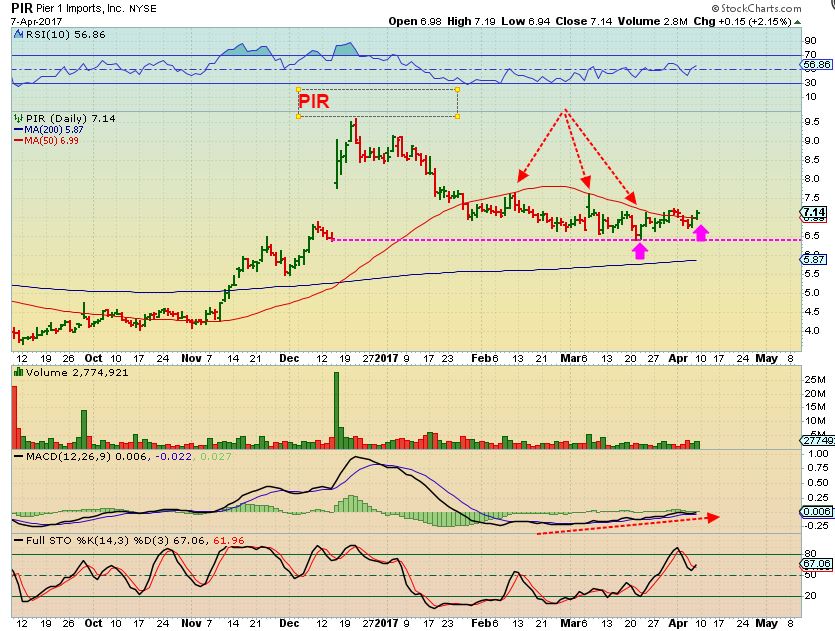
PEIR 1 IMPORTS – After a strong gap open on DECEMBER, it finally filled and is building a base. Both the 50sma and 200sma are lining up, and Friday price did get above the 50sma for the first time since Mid January. This base is the result of trying to strengthen in a choppy market, so again, this action could continue. It could be bought here or put on a watch list too.
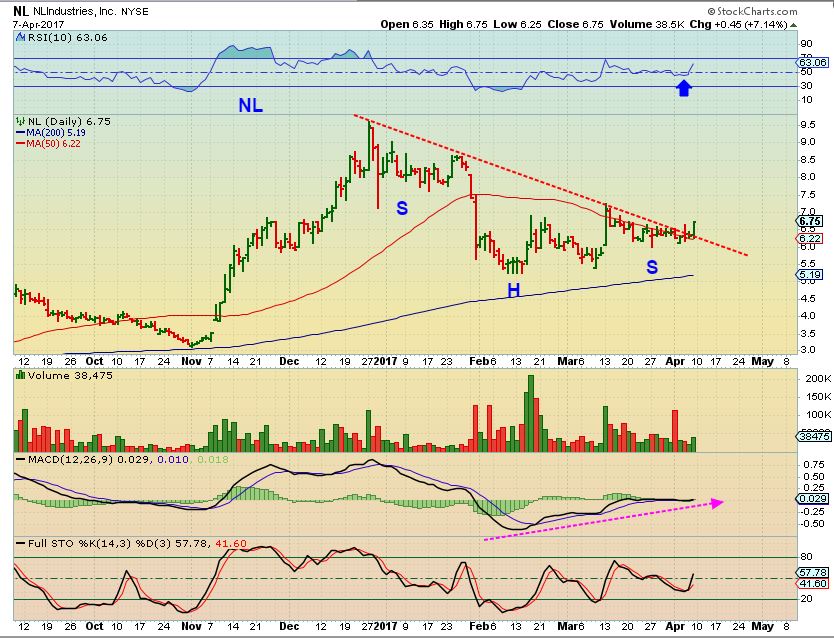
NL – NL broke from a downtrend and recovered the 50sma after a strong run off of the 200sma in November to January dropped into a consolidation period. It was a bit wide & choppy in February, but tightened up in March – April. It is a buy and can run like it did in November (or remain choppy, so keep that in mind).


Great report! I especially like your explanation of how to trade when geopolitical events may alter things.
Thx H50 – I always view the risk reward as something that includes current market condition. It is hard to make money when you are over invested in choppy markets.
accumulation long phase, imo. buy low.
buy ‘Lower’ 🙂
I agree with you. I believe that there will be a good entry for miners later in the week. The miners have already taken their lumps.
there’s the swing high in $gold late in the cycle. I’m actually hoping it holds and is the beginning of the end (3rd DC).
HELP: can anyone please tell me if they have received k-1 for USLV? Do they really provide k-1? I’m ready to file my tax. thanks.
I can’t remember. You should be able to call your broker and they can find out.
thanks. I’ve asked around and nobody seems really know. 🙂
Sweet! AGQ comes with a K-1 every year. Barf!
BTE lookn interesting …..
yes usually get it about now. Proshares are K 1
URRE, go time
I just bought URRE this morning – Uraniums do look good ( USEG, UEC, URG, DNN,, CCJ) URA = Setting up in bases
I know, on Friday I couldn’t believe how good they all looked. Bought CCJ, URA and URRE. Of course the downside is this is probably Russia/Syria, nuclear weapons driven : (
for the Canadians NXE !!!!!!!!
only retraced 50% from the top
so stronger than URA
.. and not before time.
already had URRE, but got some UUUU earlier today
I like UUUU pinched between the 50 sma and 200sma with the MACD rising.
I think you got a good entry
I just wish that they all had the volumes that they had in Jan & Feb, but it can pick up as they rise higher.
yeah.. its still a bit ‘will-they-won’t-they?’.. some im only in in half measures so far.
do we know what Ken’s thinking about them at the mo.. heading down?
I think he said not ready yet, more downside , last week.
Not sure if that changed with him , I think he was using E.W.
I see good set ups , just not so great in the volume department
i remember my little uranium exchange i had with him last week.. just wondering if he’s seen anything to change his EW opinions.
where are you Kenny Boy?
Yes, it could have changed for him
This is how I see it in URA – And many Uranium stocks are bullishly set up. That is why I bought.
Refresh
The 50 sma may offer resistance, but I’ll take a look at it when it gets there.
https://uploads.disquscdn.com/images/8028629686d2f896b0d434d0fe54e29622b3ccd18a293082d2c41d2d3c996d29.jpg
Hey SOG……URA:
I did add add to my long term position on Friday But not sure if the blue c wave is complete yet, if it breaks 15.94 I will feel more confident that Wave 2 is complete and will add again, although if it breaks 14.91 Before 15.94 I will add again at the bottom of wave 5 alt.
I hope this helps ? https://uploads.disquscdn.com/images/a10096661d1a417cdfcb09d1f0377a09c477ed702e0a248c59f008f23c2c9574.png
thx K
that abc of your could be a now-completed double zigzag, perhaps
Agree……
I would also like to see the PSAR below price as another positive that 14.91 might be the wave 2 low.
..nice.
😉
hpj lol
ffs.. what a bummer..
we should be on that rocket!
i feel like Alex and his CWEI
should come back to 3.57ish… dont u think? maybe? lol
perhaps.. but its so volatile.
think i missed that one now.. don’t wanna risk any plunges, buying in high
jnug / nugt are really strong.
FCEL, BLDP, PLUG, BWEN still moving along nicely as clean energy plays
CBAK hit the 200sma and is pulling back
CLNE may be setting up in a base
I hung on to my TMQ. Glad I did. Great to see Uranium moving again too.
I sold mine long ago when it just kept basing out – nice move out of that large consolidation.
Hope my UUUU joins in.
I wonder if that was the entire pull back in UGAZ & BOIL to the 10sma? I was hoping for a bit more
Same, I’m still holding DGAZ
aks pulling back on some volume, CLF hitting 200 MA
Nak working too today
Yes….now just keep going.
You’re all welcome. It went up b/c I sold Friday!!!
Hey Cason….you mentioned the other day that you would make some suggestions about hedging with options. I got really burned with them, but I still would like to hear what you have to say.
I’m off work later this week. I’ll dig up some good links/resources to share. You were probably using straight directional calls and puts. Which can be really tough. To hedge long positions you can use married puts and covered calls. And you do it in direct relation to the amount of long shares you have.
For example if you had 500 shares of GG, which is $7500 You can marry 5 each May monthly puts for $350 at .70 per. So you hedge a $7500 position for $350. That’s a max defined risk, you cannot lose more than the initial premium matter how high or low the stock went over next 6 weeks. The same protection in DUST would run you 1/3, or $2500 in capital. I’ll get you more details later. 🙂
Any thoughts on miners here?
I’m adding to my GDXS double short right here.
Still holding JDST and DUST.
Miners are leading to boredom. They should either go up or down. This is frustrating.
Chop, chop chop.
I endured about 18 months of chop in TQQQ from the summer of 2015 to the end of 2016. Sideways trading is no fun and can lead to losses if you set your stops too tight. I know, because I made that mistake a few times. Now I try to avoid sideways chop by sitting in cash, which is what I’m doing now.
Don’t I know and the geopolitical climate is creating uncertainty too.
I’m with you. I thought the setup for gold to drop into next low and market to raise out of DCL was there, but nothing is happening. Bored AND frustrated. I guess the positive side is at least I haven’t lost much while waiting, pretty much treading water.
Agree. We haven’t lost much as the move reversed sharply on the same day. Waiting patiently…..
Yeah, man I was sweating a bit on Friday AM. But I have seen these news pops sell off time and time again. Starting to get hard to stay patient.
My BTE and CPG doing well today.I am still a little bit under water on CPG. I didn’t stop out.
what happened to OWCP?
uraniums looking good
XLF looks toast
Could drag down general market? I’m trying to long the market here, but it sure isn’t paying off yet! Kinda thought we got our DCL, but it’s not clear yet to me for sure.
DE (following up on my short). Fun to trade the channel. https://uploads.disquscdn.com/images/c918e0c4f5064c9274068aa94f593c58f9a24b86436a4e190d36061801a1453d.png
very nice Frenchie … go man go .. ;o)
Merci Maria 🙂
just waiting for our shiny miners to ICL.
Yes thanks for the tip !
With DE and a 15min chart that’s only a 1-2% move. Would have to be a gigantic position to payout!
FYI: new MJ ETF traded in Toronto: HMMJ.TO Started trading last week, now up 18% in 4 days
http://www.marketwatch.com/story/positive-buzz-sends-first-marijuana-etf-sharply-higher-in-early-days-of-trading-2017-04-10
https://uploads.disquscdn.com/images/92f6e6c6179ab427018f7035563353346436beb8c69ae7ab6a2f6a0347f657b3.png
NATGAS weekly (and daily) showing almost perfect IHS…down we go?