
April 5 – Resistance
Wednesday when the Oil inventory report was released, Oil reacted to a resistance point. Later in the day, when the Fed Minutes were released, various markets also reacted to their resistance points.
.
NYA April 4th – I’ve been a bit cautious about the General Markets and pointed out the charts of the NYA & the XLF . Let’s take a look …
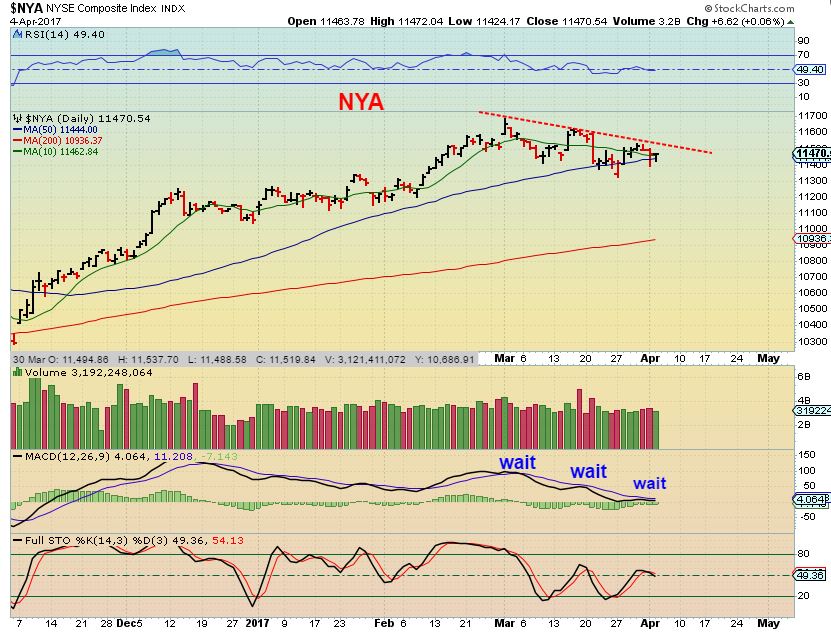
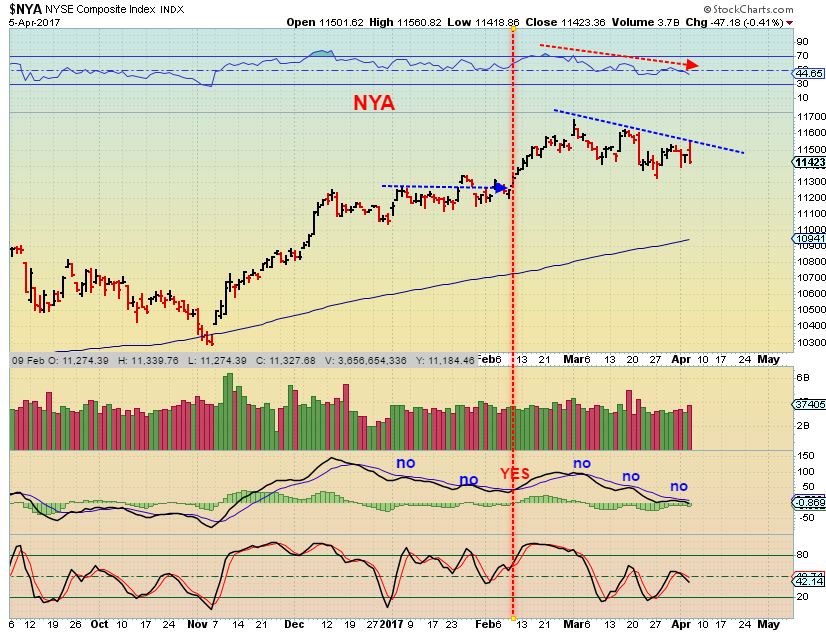
NYA APRIL 5th – The move higher has had weak divergence, and it was turned back again Wednesday at resistance.
XLF April 4th – For almost 2 weeks I have been pointing this out as a reason that I am not overly Bullish about the markets at this point. This needed to recover for me to feel a bit more comfortable going long.
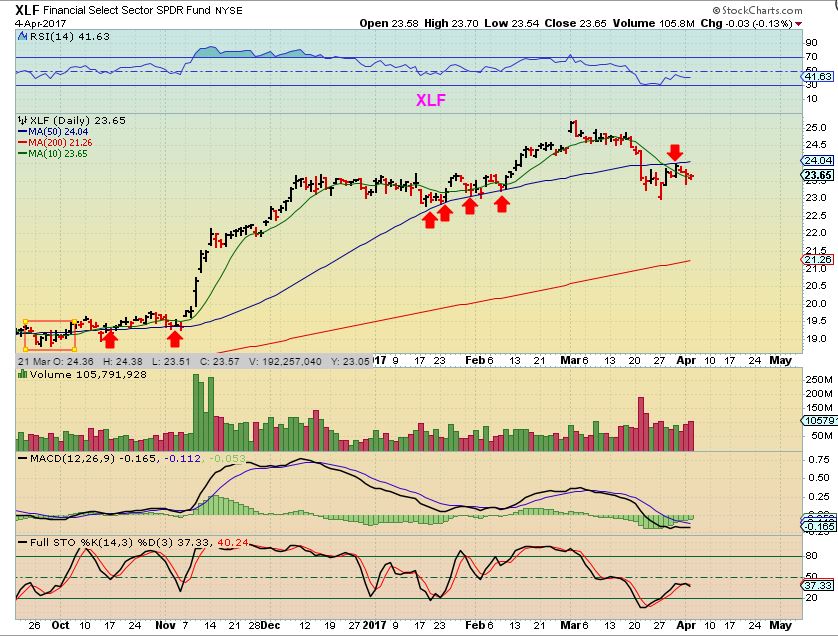
This was the XLF on Wednesday
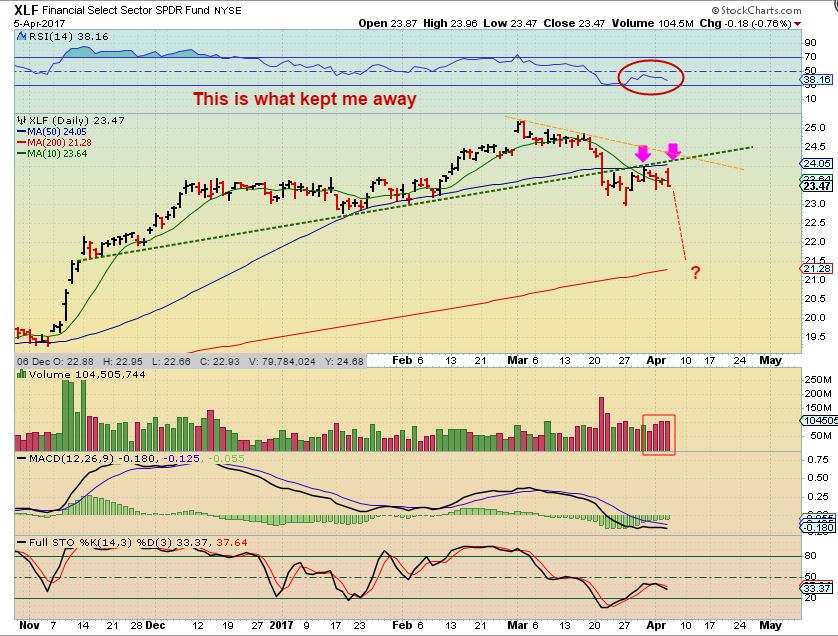
XLF April 5th – This possibility of a drop has kept me on the sidelines
XLF – And this is the big picture possibility. You can see the timestamp on the chart was at 11 a.m. when the markets were higher. I actually drew this for a friend that has asked to become a student of mine. I was pointing out that this could be a bear flag and a drop could follow.
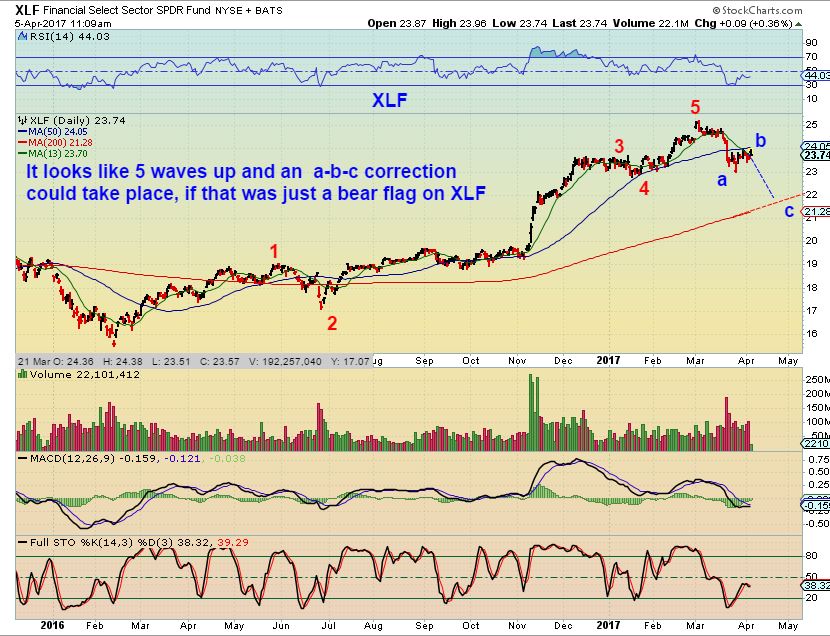
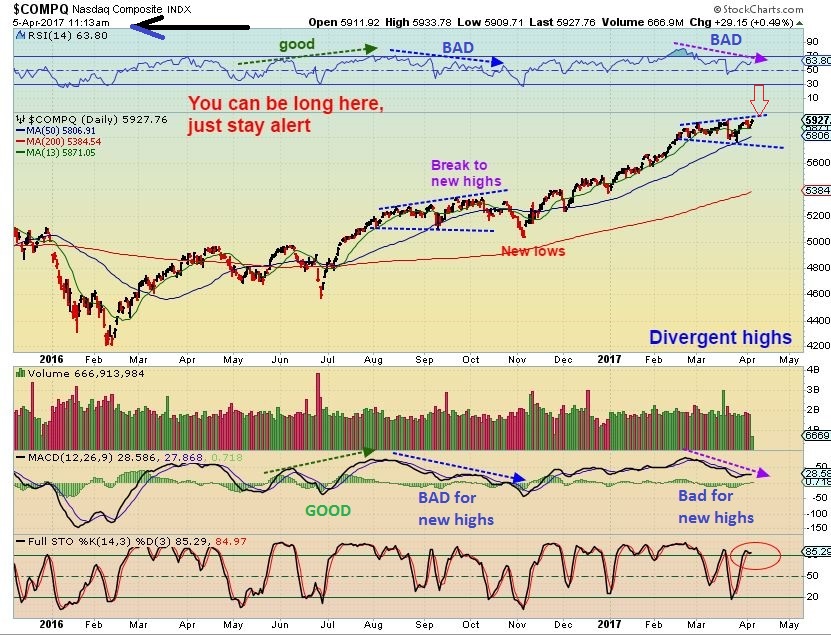
When I drew this at 11 a.m. for him, the NASDAQ was up 30 points and looked to be a solid break out. I was pointing out to him that this is a bad set up with weak divergence and megaphone patterns. I wrote that ‘you can be long here, just stay alert’, because price can climb that bull horn for a while, but this bigger picture looks weak until this changes.
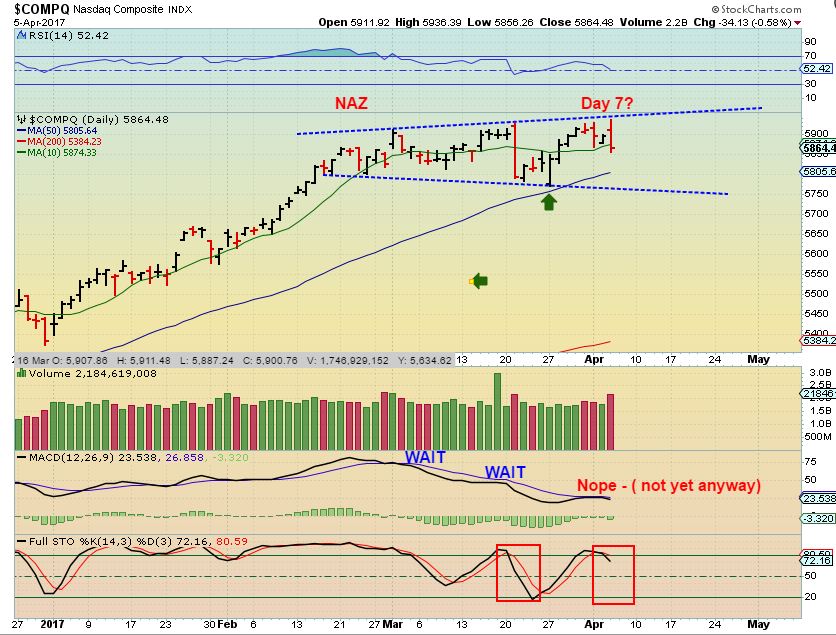
NAZ CLOSE UP – It sold off after the FED MINUTES right after tagging resistance. New highs and a lower MACD with no bullish cross.
Again, I haven’t been ‘recommending’ long positions until things resolved themselves, and they certainly haven’t yet. I was looking at charts of SOXS, TZA, TECS, SQQQ, etc etc and they look pretty good ( Short the market) , so I would be careful out there being long at this point.
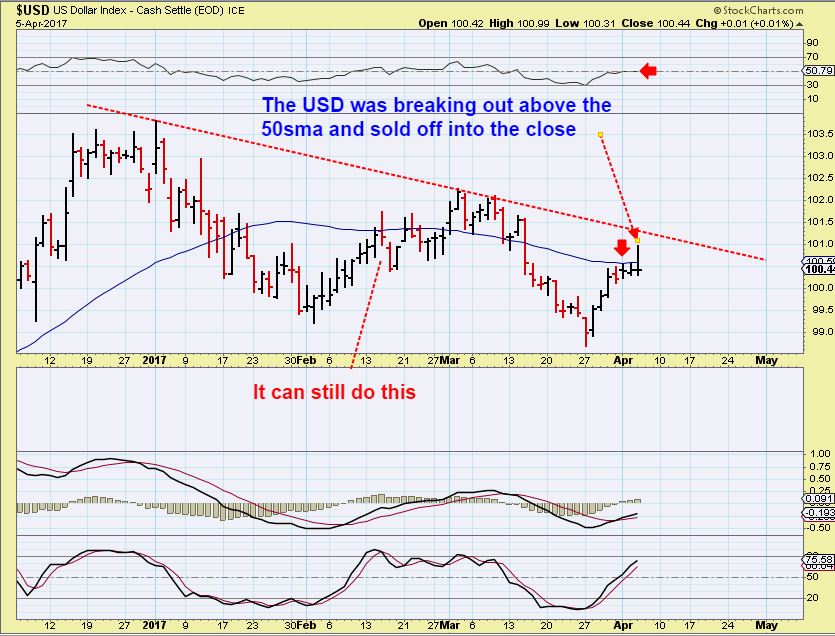
USD – If the USD does a small pullback here, Gold can pop and Miners can push to the 200sma as mentioned in prior reports. When we get to Gold & Miners you will see why I hate this current set up either ‘long’ or ‘short’ Miners. It is becoming a complex set up.
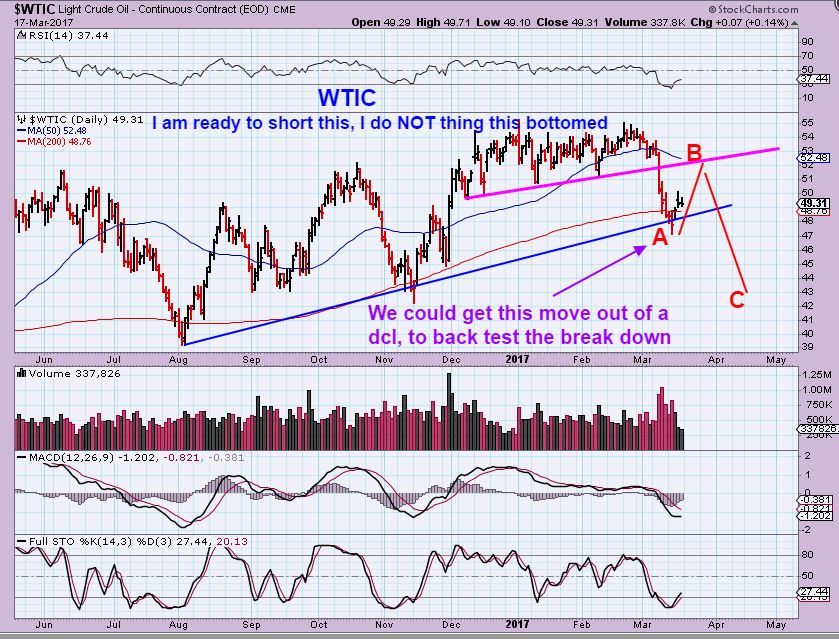
WTIC MARCH 17th – RIGHT FROM THE TIME THE LOWS WERE COMING IN, I WAS EXPECTING OIL TO RUN HIGHER AND POSSIBLY FAIL THERE AT THE $52 AREA. Then I thought that we could see an ICL in April.
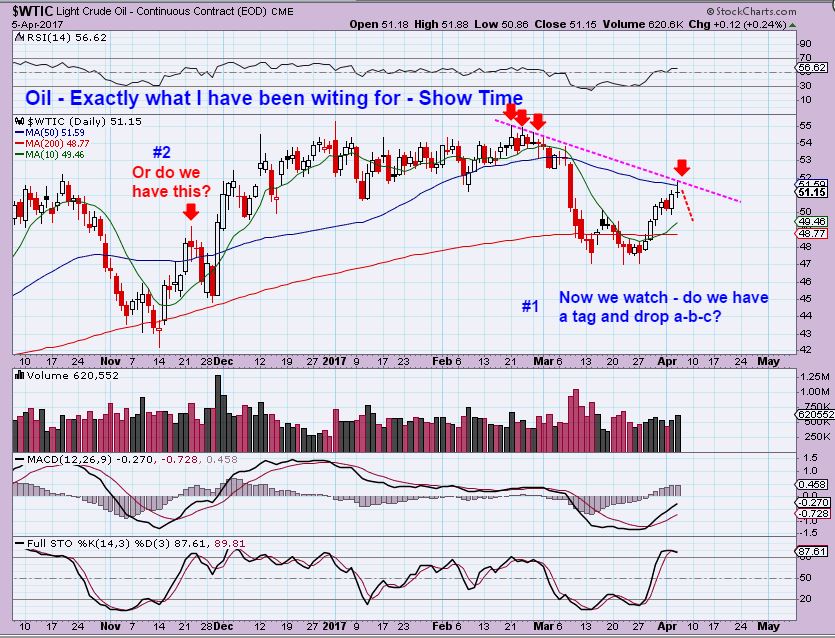
WTIC APRIL 5 – Oil tagged the 50sma near $52 and dropped Wednesday on the inventory report. Energy stocks surged higher and also rolled over midday. This is where we really see what we have, an ICL ahead of us, or an ICL at the double bottom already in place. Please read the chart #1 & #2 thoughts.
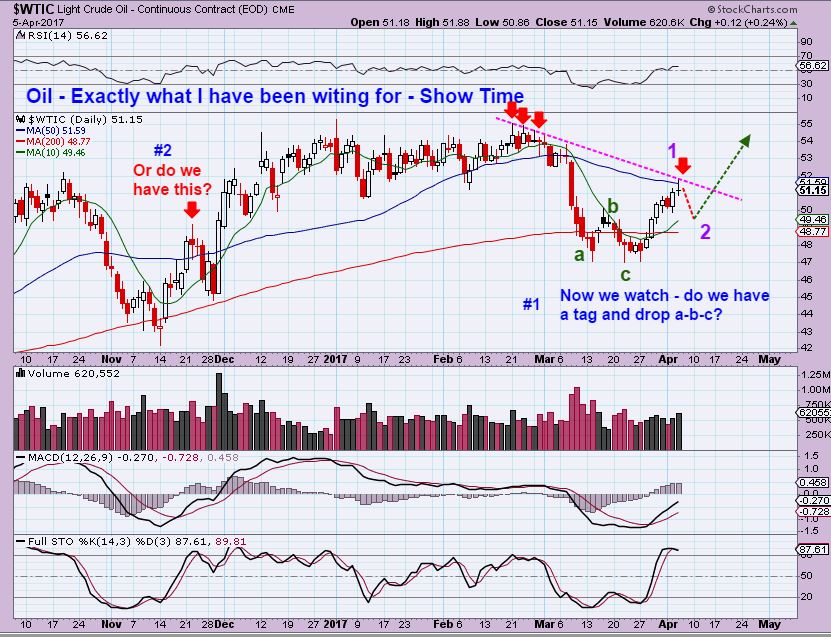
WTIC – A more Bullish view. Yesterdays report mentioned that some of the Energy stocks were really set up nicely and running well, so this becomes a possibility with ‘C’ being the ICL in place. Oil put in a new lower low a week after the initial low. The ENERGY STOCKS will be a buy the dip, so let’s look at the XLE…
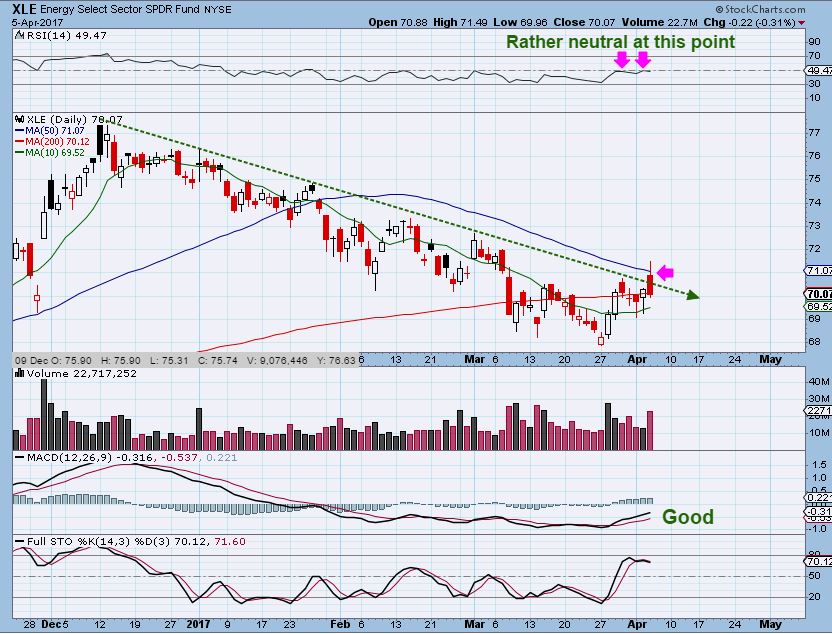
XLE – A break above the downtrend line, but the 50sma stalled it. I still like this set up, because many other Energy stocks that we were watching DID break above their 50sma. We will watch the pull back for possible entries, with the ‘timing’ depending on Oils future path.
.
GOLD & MINERS
.
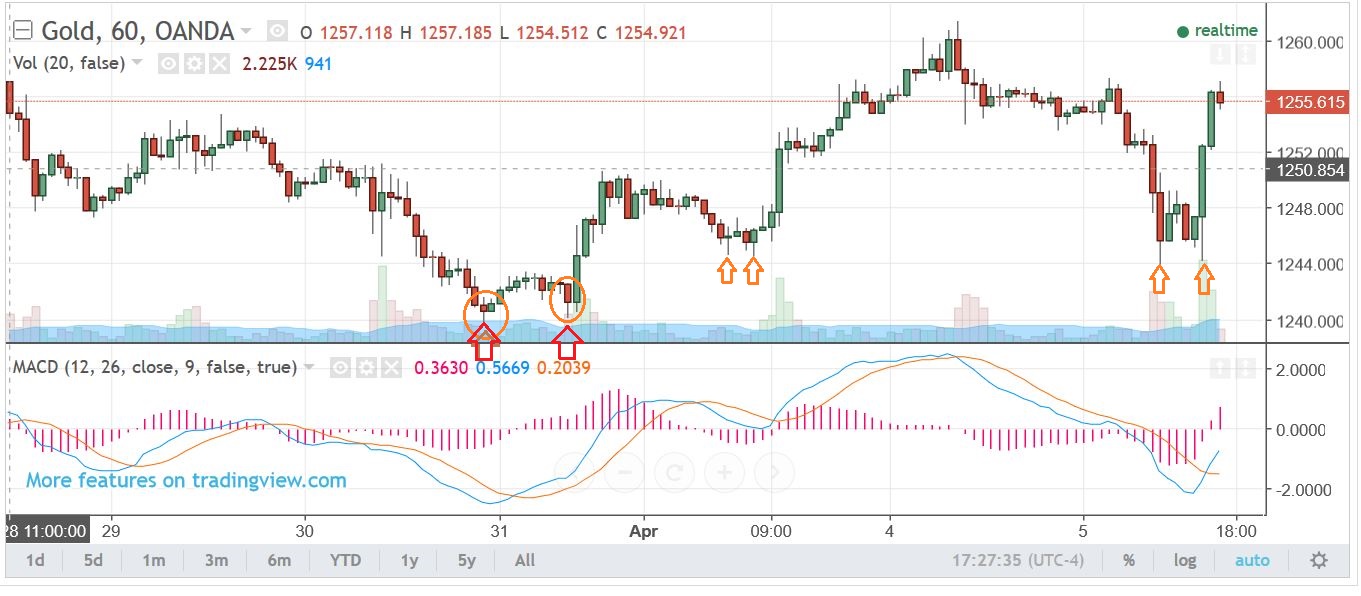
That drop after the FED MINUTES yesterday looked like another false drop to me. Gold keeps dropping into a double bottom and then the MACD crosses and price moves higher. That was pretty what happened again yesterday. I did not add to JDST, but his late in the 3rd daily cycle, I do not expect Gold to go much higher really. This late in a 3rd daily cycle, Gold may be too heavy to break out at this point. So let’s talk about the Miners.
MINERS – THIS IS BECOMING A COMPLEX CONSOLIDATION IN MINERS, AND I HATE THOSE BECAUSE THEY ARE DIFFICULT TO GO EITHER ‘LONG’ OR ‘SHORT’ AS YOU WILL SEE. LET ME SHOW YOU WHY…
,
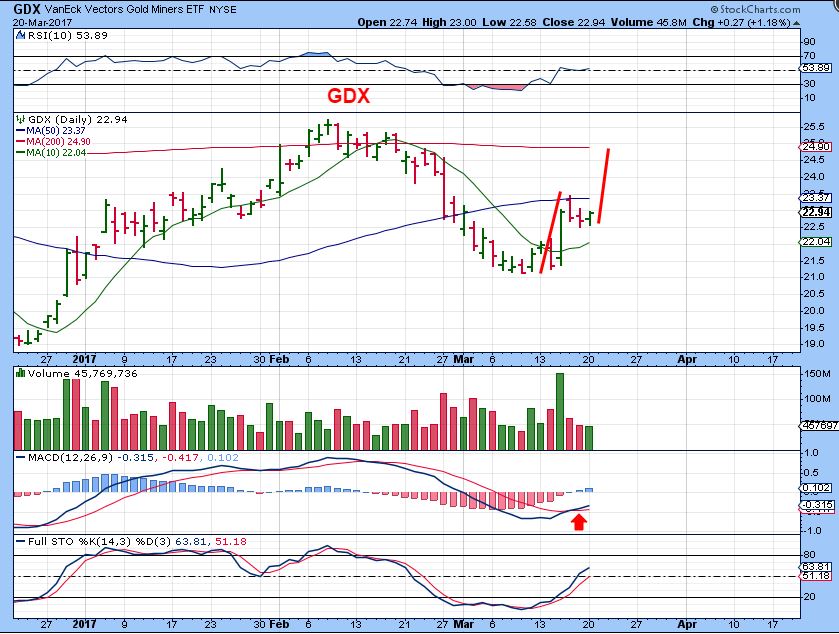
GDX MARCH 20 – I have been saying that 2 possibilities are there for Miners.
1. It could be a bull flag to the 200sma as shown, or
2. Continue to be held back at the 50sma ( I preferred this one eventually).
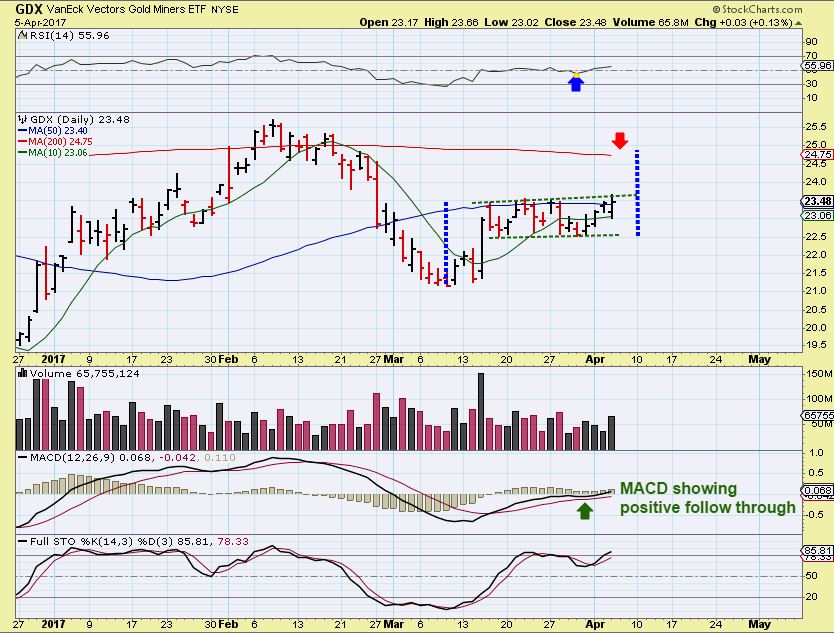
Now look at GDX weeks later. That is a very frustrating move for “Longs” or “Shorts” and who can make money on this set up so far? Now on Wednesday, GDX broke above the 50sma and then pulled back a bit, so I re-drew that chart aboves expectations again, after this multi-week consolidation. The Miners sold off quickly at the FED MINUTES and were bought up with strong volume just like Gold was, so it looked bullish again in the short term. That MACD has looked bullish the whole time, but that CAN fail, as you will see, and Miners CAN still just roll over.
THIS IS WHERE I WANT TO SHOW YOU THE COMPLEX PARTS OF THESE CONSOLIDATIONS, MAKING A LONG OR SHORT POSITION FRUSTRATING 🙁
GDX – Blue boxes – Notice that right before the big sell off in November, GDX also went sideways day after day and then POPPED- It looked like a real bullish run would start, BUT THEN DROPPED RAPIDLY. We have gone sideways for days ( I went short at the 50sma) and now it looks like it could POP to the 200sma and then drop again. The past 3 weeks has been quite frustrating for GDX / GDXJ longs or shorts, near impossible to make money.
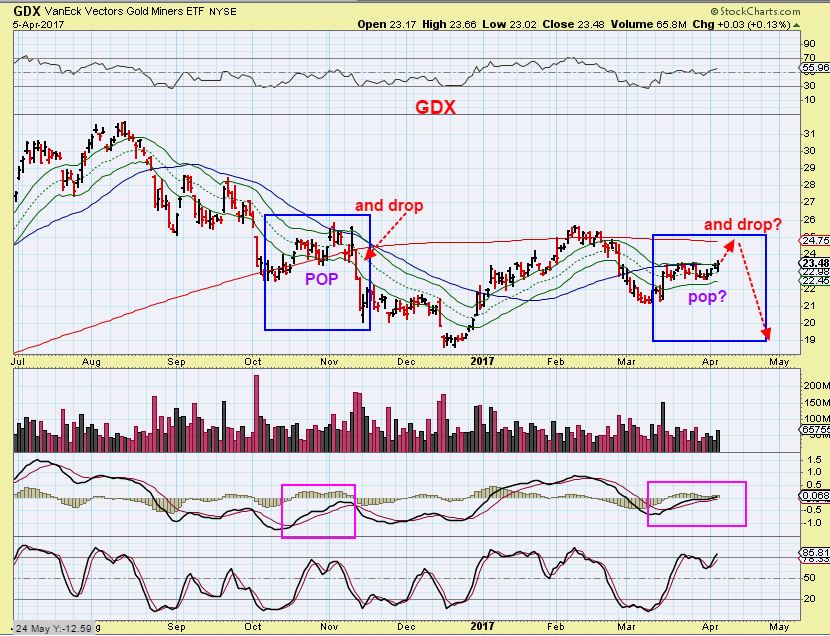
FOR MANY, the best thing to do is wait for that ICL. Being either long or short a GDX GDXJ trade has basically gone no where. No trend.
.
CHECK THIS OUT:
.
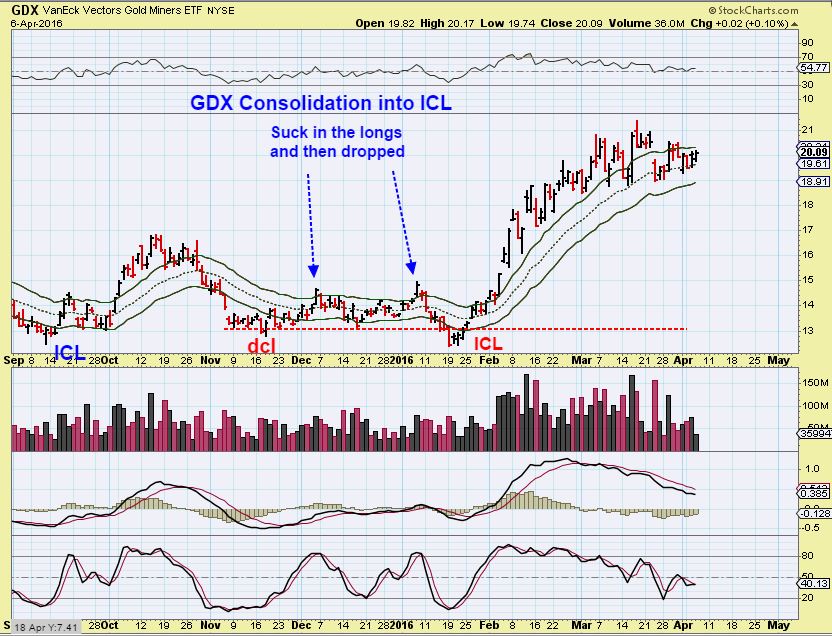
GDX – Now let me show you how frustrating this can really get. On the chart below, an ICL had occurred in September as shown, so one was due, but GDX just consolidated sideways for weeks & weeks. It even ran up and broke out in December sucking people in ‘Long’, and then dropping again.
THEN after a few more weeks of that , it really broke out in late December, BOOM! THIS WAS DUE FOR AN ICL THOUGH. How could that be, since no real ICL was visiblble?
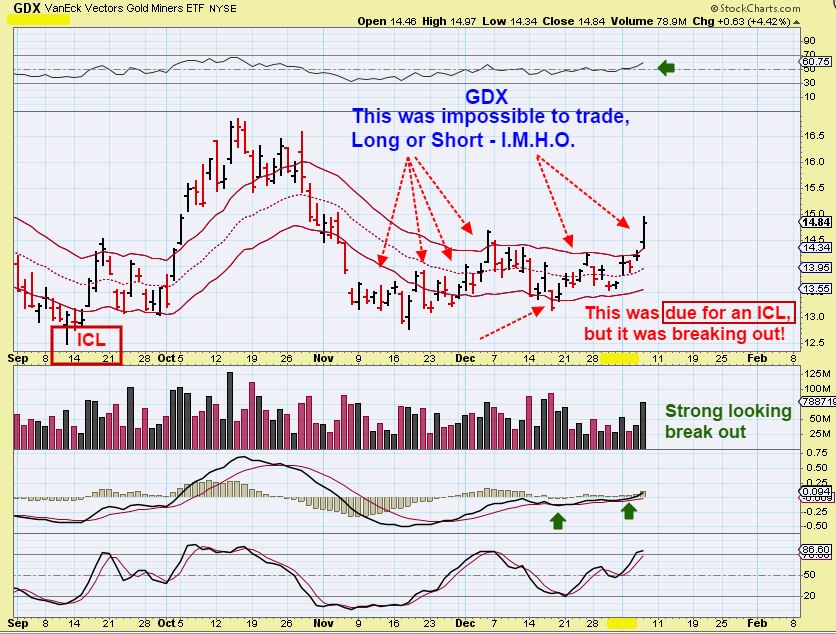
This was the 2 break outs above, when an ICL was still due. Yikes! It was an EVIL, DEVIOUS, RIDICULOUS SHAKE OUT ICL after the break out to new 1 month highs . Then we saw that strong run out of the ICL in Miners, but many refused to buy after that. We did NOT miss it here, we doubled and tripled our accounts in months. Well, I’m thinking that we are due for an ICL in April or MAY and we can catch another great run higher, but right now we have this complex consolidation and it is impossible to be ‘long’ or ‘short’ comfortably – for more than a day or two anyway. For some it is just best to be patient and Wait for the trending move out of an ICL.
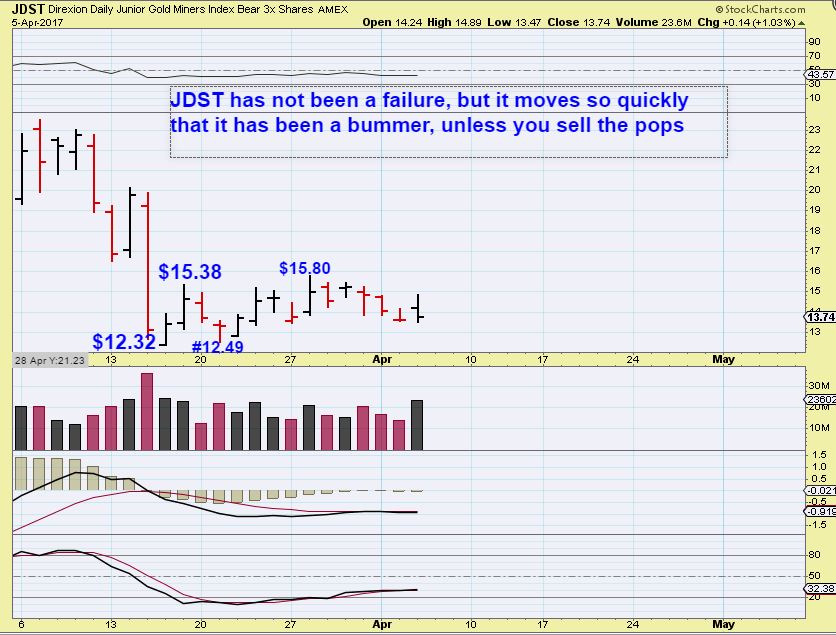
So how does the recent action translate in my JDST trade? Well, it has been moving from $12 to $15 to $12 to $15 , etc , but that is only good if you buy low and sell high. This has been a difficult trade and it is NOT recommended for everyone. Nor for many. I know that without a trending move, I am sick of it. I make gains and watch them fade over and over. If you do not scalp your trade and cash in quickly, the gains fade away so far. : )
Conclusion: It has been a bit frustrating at times just passing time inside of consolidations and choppy markets, but good things will come to those that remain patient. We have had some good short term trades in Energy, Pharma, and more, and we may have some good Energy set ups again if the Energy sector continues to pull back, too. All trades that I have been holding were very good shirt term trades out of good set ups, but holding on too long has given many gains back. I am lightly invested at this point.
So here is where we are at. I have made some money in NATGAS, SWN, OAS, CGIX, and a few others, but I have also lost some money trading other set ups by holding on too long. I also have made some nice gains and watched them evaporate in NAK, MACK, etc. Trade set ups that look proper are popping and then rolling over ( CLF, VALE, FNSR, etc). When this happens, I know that we are in choppy, volatile times, and this is NOT a real traders paradise. We are not trending. So far, this is not a time where you can buy a position and ride it for a few weeks (yet) , but I also know that the current situation in ENERGY and MINERS should lead to some excellent trades in the near future where we can buy & hold for a while. NATGAS may set up again too. That said, if you want to keep trading, KEEP POSITIONS SMALL and always use & honor mental or solid stops. It has been choppy and a bit frustrating.
Best wishes on your Thursday trading.
.
~ALEX
.
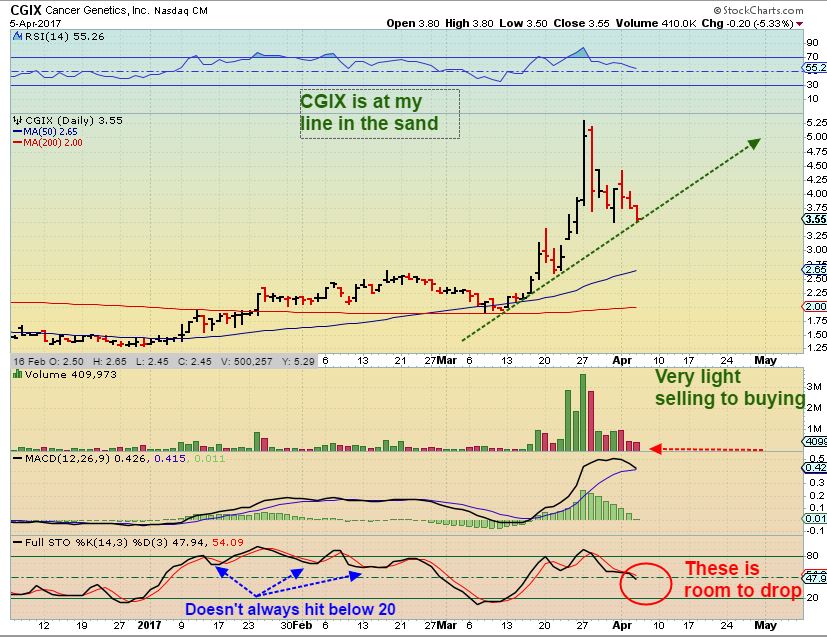
CGIX – This is my line in the sand. If the trend line doesn’t hold, I’ll be out. I sold OVAS , I still own MACK. Typo on the chart, “There is still room to drop” , and that bothers me, so I may exit this trade today, and save that Money for the low ICL in Miners.


MACK – Refresh
I am still holding it, but it is range bound at this point.
With NATGAS as the exception, all of the trade set ups mentioned here seem to be winners if you sold right after the pop, but unfortunate I was looking for more of a Pop & Run, kind of like what we saw in NATGAS, ENERGY STOCKS, and even CGIX.
These markets are choppy and difficult for the BUY & HOLD crowd until we start trending again. https://uploads.disquscdn.com/images/e06db6fcd7139d07427ec315464d469326c6d9948ef43697e4eaeb9f3faac8e3.jpg
Just to show how the MACK trade went. I was pointing out a possible break of the 50sma coming up, so I mentioned that I bought it at $3. with price right under the 50sma. It then POPPED and ran to $3.40. That is an excellent trade if I cashed in, but now it is $3.13. I’m up 13 cents on the trade and held on due to the 50sma. If it breaks, I’ll probably sell out at or near break even.
THAT is the choppy market affect. My set ups are working out, but only for the day trader/ scalpers. ENERGY trades worked out very well, but yesterdays reversal may have been a warning to sell short term & see about possibly buying a dip.
Even with GAINS OR LOSSES at this choppy time, I know that at an ICL in Miners, we can jump into some of those miners and possibly double our money or better. “There is always another trade”
Thanks Alex. I’ve been tempted to sell all non-core holdings and take six months off given the continuous process of getting in at the bottom, watching the trade rise and then fall within a day or two. Might still do that until a bottom in something becomes clear.
6 months from now is too long if you want to catch the next very profitable trades in Miners .
Also Energy may bottom soon if it is not in at this point.
The choppy trading comes in the consolidations and drops heading into the lows, and we are in that area now in Gold at a 3rd daily cycle, but ICLs can come at the end of a 3rd daily cycle ( or 4th) . This has been the difficult time, but I’m expecting it to end sooner than 6 months from now..
URRE tryin to climb back above the 50sma.. up 11% as i write
Although I have URA currently working on a C wave correction.
yup.. i have it in my head that URRE is still currently in the B of an ABC down from the top… and it wont be happy till we touch down to 1.50ish
Agree SOG on URRE.
Uranium not quite ready … yet, soon though.
Welcome back…MACK
That was a weird trading day Yesterday!
Yes, It almost lost me, but it slammed to the 50sma and held up so I’m still in this base.
I got stopped out of almost everything.
I’m pretty lightly invested right now. Other than the buy & hold attempts on MJ stocks from November
I still have JDST, CGIX, MACK , ( And I bought FCEL & BLDP when I saw PLUG, BLDP, and CBAK setting up. They are a different form of Energy.
I sold my NATGAS & SWN, OAS as good gains, NAK as both a gain & loss after a nice run up & back down. I added on the way up, so that part was a loss. Bought under the 200sma, that was a gain. Basically break even or maybe even a loss.
Sold OVAS for a loss.
CGIX, JDST, and MACK are currently gains …. for now., CHOP CHOP
I have a smattering of MACK. It’s giving it all back now
whatSaMatter … 😉
Funny 🙂
It keeps tagging that 50sma and bouncing…we just need it to gain some buyers on one of these bounces.
I do like that weekly base : )
Ok, since you wouldn’t comment on the SXE chart, maybe the HYGS chart? 🙂
lol
fyi.. he ignores me allllllllllllllll the time …
*guilt by association? ;o)
I am going to change my name to maybe Raj and use this pic, then maybe he’ll
Take me seriously https://uploads.disquscdn.com/images/1fe8498c4d4ec282a59b8ed67a610238eff011a69809a12b8f4bdfeff481cbad.jpg
oh man… daddy’s gonna beeee maaaddd…. (singing in a childlike tattletale voice) ha ha … 2nd day back and ur already gonna join me in time out?? LMAO
But “professionally” speaking Maria – look at SXE!
oh yes… my mind is always on SXE
very nice … ;o)
Whose Raj?
crystal’s naughty name
Actually that is a pic of Rajesh Jhunjhunwalla read this and weep $100!!!
http://moneyexcel.com/11499/rakesh-jhunjhunwala-portfolio-holdings
What’s his approach to trading, do you know?
He’s a buy and hold guy .., but in Indian companies so I think it’s almost impossible for us to replicate. Interesting though….
http://www.livemint.com/Money/r06HO0RUtK82ReZnxPzKwL/The-secret-of-Rakesh-Jhunjhunwalas-success.html
Hey RAJ, What can I do for you?? : )
Are you using the UPS slogan?
So what is it that attracted you to multii-billionaire chick-magnet, Raj J?
His girlish figure 😉
i like my girls with some meat on them too..
I’m sure you don’t mean in a Lady Gaga way #meatdress
indeed not 🙂
giggle… someone is all rested up and raring to go…. lol
Ha ha! I was expecting Bill to post next on this thread and say “a lady named Gaga?”
I thought that I did comment on SXE. It is a great chart, ride it if you own it, but it needs a pullback to enter with a lower risk of drawdown.
HYGS in interesting, but it usually trades on 20.000 volume. It has great days, but if it sells off, it could be tough to get out of ( just my personal take on it…many do trade low volume stocks. I have been stuck inside of them during sell offs in the past and learned my lesson. In a sell off once, I think there was a LINE of orders waiting to sell and not enough volume to fill the orders. I waited almost 10 minutes for my order to finally fill, and it sold a lot lower.
Thanks 🙂 I having a trailing stop now.
2 yr weekly chart of SXE is awesome, and could just keep running. Take a look at it if you get a chance.
Yes that’s what got me interested in the first place 🙂
Alex, wonderful review of GDX in its 2015/2016 bottoming process. I was one of those that bought in Sept., sold due to choppy, whipsaw action and missed the actual bottom in mid January (I was not a sub here at that time). I kicked myself for missing the move, but as you have shown here, it was very difficult to trade. Amazing analysis, Bro!
Thanks Rob…when I go through times like that ( I rode that horrible choppy consolidation for a while) it really seems to burn a place in my mind. Then I analyze it to try and learn from it, but honestly….if we saw GDX break out like that one in December right now- it would look real and who wouldn’t get fooled? Twitter would light up with all Gold Bulls declaring a break out, etc , but we’d be expecting an ICL and wondering if we missed one.
Tough stuff, but it is there to learn from I guess. 🙂
I’ve held GDX from 2014 with average price $23 all the way to $13. I just played dead, and planned for the worst case. Thank god, I didn’t know jnug at that time. But I just love GOLD.
Yes, the JNUG death machine goes to reverse split levels over & over & over…so the buy & hold investors can always have hope, but never real gains.
Timed correctly it is a blast, but short term only.
Holding since 2014 – You are a die hard investor 🙂
Good stuff Alex …. waiting for ICL…..
It is a long process at times, but SO worth the wait David 🙂 The ICL is the money maker.
It is often the best % gains in my account 2x per year. The rest is just adder funds & fill ( or losses in these chppy markets).
IMLFF a double in a week
Yeah making me sad, had already sold…hope someone is still in it!
Oh bummer! Ya I have mine- took off a 1/3 at .65 this am
Thanks, Ann.
I mean it has already doubled from last week. I’m exiting some.
Would like to see a close above .638, all time closing high. Then there is nothing but air above. But market is showing signs of cracking so may never get a crazy parabolic run. This happens all the time to me, find a winner, market rolls over and kills my fun : (
There is nothing but air this morning, unfortunately. 🙂
CGIX from the last chart in this report….has a small pop today, but I feel like just letting it go in these choppy markets to play it safe.I will not hold it if it breaks that rend line.
On spring break … CF is right about the market in general but certain stocks for some reason have my attention :). Look at the volume on CLF today – it’s getting interesting, I think ….
Oh and LTBR too …
Are you sure? I get no ticker with that.. GBR I’ve been watching though
Refresh …, I edited just after I posted, sorry. LTBR
Oh I recognize that ticker… Its DEAD to me 🙂
No, It looks good. I bought in Jan or sometime around then and got stopped out down near $1.05. Then it dropped & worked its way higher & took off like a gazelle. Shook me out , but it does look good.
I dont see a low risk entry though without a bigger pull back or more consolidation.
I still have it from about $1.10 🙂
Nice- easier to let it ride when you have an entry price well below current price
Alex. Where are you out of CGIX? Around 3.50?
DUST… a close above $29.95 would make things interesting again.
SO CGIX looks good today, but now I am seeing a possible pattern forming ( Wedge) That would lead it back down to the 200sma if it doesn’t break out from here ( It is at a down trend resistance line now).
I’m holding on for now
While we are waiting for energy to declare its intentions, there
is something interesting to consider. It is a ratio chart that I follow of
USO:OIL which has been pretty reliable for calling highs and lows. Not all
ratio charts are this useful, but I have found this one to be pretty useful,
especially over the past many months. You can see that when the ratio bottoms
and turns up, energy turns down (red vertical lines). And when the ratio tops
and turns down, energy turns up (green vertical lines).
Perhaps even more significant is that the ratio recently
broke out of a clean consolidation pattern to the upside, which, true to the
ratio’s behavior, timed the early March drop in energy (vertical purple line).
The ratio is in the process of back-testing the consolidation (red circle),
and, if it continues to be true to its pattern, this speaks strongly for an
impending breakdown in energy, once the ratio completes the backtest. As such,
this chart suggests that there is a favorable risk-reward entry point right
here and now for energy shorts. Again, not all ratio charts are this reliable,
but I have found that when a ratio chart breaks out from a clean well-developed
consolidation pattern and then back-tests it, it more often than not plays out
according to script.
https://uploads.disquscdn.com/images/a550a815637e98ea1b8b0b6de6ddb77fd9bf61ce37eff49b6c0ac2829af126ab.png
It is low risk to short at this point. Your ratio chart is lining up with my oil charts and my expectation. The break down of OIL happened, and I expected a back test of the 50sma and break down. That is when your ratio broke out and back tested…..so the tag of the WTIC trend line & 50sma area in my charts ( I’ll attach here). is where I would logically go short, because a break back above the 50sma would stop the short out. . A break above the 50sma is bullish.
In your chart, if the RATIO breaks out and then back tests, you then expect it to bounce & continue higher — if it falls back inside that pattern, that would be your stop & that would match breaking above the 50sma
I like it- they match up.
Attached is the chart that shows OIL tag that 50sma in the same back test. That would be the stop for shorts.
ONE THING THAT IS NOTEWORTHY – MANY ENERGY STOCKS BROKE ABOVE THEIR 50 SMA AND HAVE HELD THERE – They may be leading, but your chart wont show that aspect .
https://uploads.disquscdn.com/images/1106fcf0b876a2391743e58c4b2f3b3e0421b09335710d6d865369519867b891.jpg
Sold CGIX for a small loss.
Refresh- That might not be a bad thing…
I was hoping for a break out today, because if not, I think this “MIGHT” or “POSSIBLY COULD” drop to the 200sma and then move higher.
I am still holding because I bought it low, but of course I wish that I sold it on the initial run to $5 and got back in. 🙂
https://uploads.disquscdn.com/images/f4d27e47a8d05e2c7ff26c70611698524b00e4edfe3cafaa1584c9c1f8ac4069.jpg
Canadian mine OSK up from 2.2 in jan to 5.4 today and SVM also up 5 % today
I still have SVMLF [now] from years ago…nice to see it improving.
man….AKS & CLF really working that 200sma area
Alex,
I bought both this morning after being stopped out yesterday…. I’m hoping shakeout. Where would you put the stop? Today’s low?
thx
I would use todays low on AKS and the 200sma for clf if it were me.
thx
Thanks!
SGSVF SABINA moving strong today… i like this one!!
I saw that..its a nice chart.
Also AAU & SBGL seem healthier than the rest, and OCANF looks healthy.
Quite a mixed bag among the Miners
LTBR – undead!!!
I was just a bit too early on that one. It’s probably a future MACK too : )
You deserve the credit here as I’m in it due to your call…. and the same with DNR (Maria are you with me
On that one?)
selloff on news again
Interesting charts for a few shippers, and then a few others are horrible.
SALT, NMM ( looks ready now), SB, DSX.
DRYS!!! New lifetime ever low tonight. Oh my goodness!!
Hi Alex,
1st time posting, can u tell me about the chart of a Canadian Marijuana company AMFE
my limited experience says it looks good, I bought at 0.016 cents
Hi Strats – Nice to have you here.
Is it AMFIL TECH?
That chart actually looks like a very nice Cup and Handle on a 6 month daily. The strong volume today looks good, I think you have a winner.
It COULD or MIGHT back test this break out over time, or it may not, but right now it looks like a strong move. Nice catch.
yes it is Amfil Tech
I am gonna hold for a little more longer thanks for advice
I was going to just ride my purchase of CNAB, but I sold 1/2 today because it looks to be breaking down. I will ride the rest, since I did buy it lower.
ADHD – Keeps popping with volume, now Trying to cross the 50sma….DO I or DONT I??
These choppy markets are killing me
Just offloaded my CGIX and DNR. Small win and small loss so break even. About 85% cash. Wouldn’t mind a little dividend play or two while waiting. Surprised how some REITS are hanging in there or have gone up after the interest rate hikes.
Man CF … I originally had GDXJ in a “4” throwOver .. but it looks like it’s getting too big for the pattern .. i would have expected it to fall today… so I checked my alternate ‘bull’ and .. damn.. look how CLOSE it looks to the last leg up …
do you think this could happen …
https://www.tradingview.com/x/QlOxTyEB/
use this link … I cleaned it up and annotated it a bit better … sorry – that first link shows my bear pattern in the upper right corner .. i just dragged it out of the way,,,
https://www.tradingview.com/x/q9ADKwq5/
nevermind.. i see your GDX chart which looks similar .. lol oopsie… giggle
*If at first u don’t succeed, read the directions ………………………………………………..
miners have flat lined. I expect that change next week.
Up or down?
Jobs report at 0830 tomorrow morning may provide some “juice”?!
Tomahawks hit Syria. My JDST in the toilet!
And mine!
Alex and friends, reminder we have the Jobs Report tomorrow morning, 0830 Eastern.
Well there we go. Start lobbing a few missiles and everyone now wants to own gold! That’s one way to get through the 200-day avg.
I am NOT a fan of buying geopolitical black swan PMs. That was a possibility for gold back late summer 2014 messing with Syria. And that marked a high that stood for years!
The night is still young so anything can happen. I stated a couple of weeks ago that a burst higher in gold above the February highs accompanied by strength in the miners could be what the doctor ordered for the doubters to climb on board the bull train yet IMO this will be the “exact” time to turn bearish on the sector. Of course this means holding through until tomorrows close and this may too painful for those holding bearish positions.
Just like Alex said where bulls and bears can both lose money! Yes, seen this play out where an event gets buying that induces shorts to cover and then it reverses and we all lose.
Does make me sorry that I sold calls against my AG position to early. It will open firmly in the green for me tomorrow. 🙁
Absolutely chilling .. I was listening to NPR this afternoon. I thought it seemed too alarmist but tonight’s news makes me reconsider …..
http://www.npr.org/2017/04/06/522857262/u-s-military-leaders-are-worried-that-a-war-with-russia-could-start-by-accident
I picked up Harmony Gold in after hours and added it to my core. Heard a mine strike has ended and I like their dividend.
Took profits too early on that one.
Yeah, I tried it late last year and was stopped. But she was solid early in 2016. So would expect good things again from HMY.
Working on this now – Refresh
Cya in the morning 🙂
https://uploads.disquscdn.com/images/22a1e4767f4f3f0322c7b782cca6a82c64c8429beb2646235db882ad5d0beb8b.jpg
:o) looking forward to it …. go chartfreak .. go chartfreak .. it’s your birthday.. hava cupcake ;o)
yup…. head scratcher ;o)