
April 18th –
Something interesting taking place in the General Markets
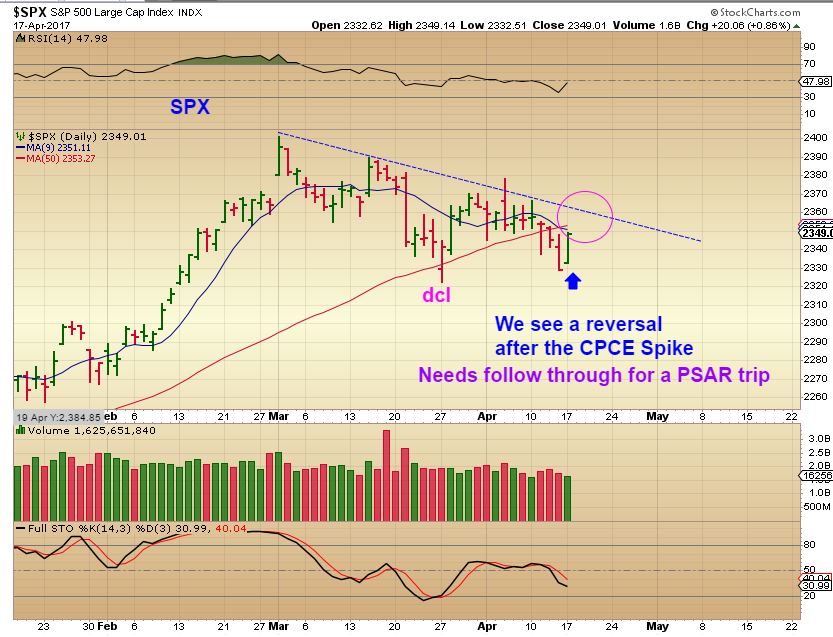
SPX – Here we see the ICL in November and 2 dcls that followed. Obviously the markets have been relatively strong, because those dips down into their dcls have been shallow. Over the last 2 weeks I mentioned concerns about the XLF and then the SPX broke below the 50sma last week. The ‘timing’ dictates that an ICL is coming due and since the XLF has been weak, so I would expect more of a dip now or soon. At this point, I’m actually noticing some interesting developments taking place here too, so let’s discuss that. Notice how the recent consolidation does look similar to the last one at the dcl…
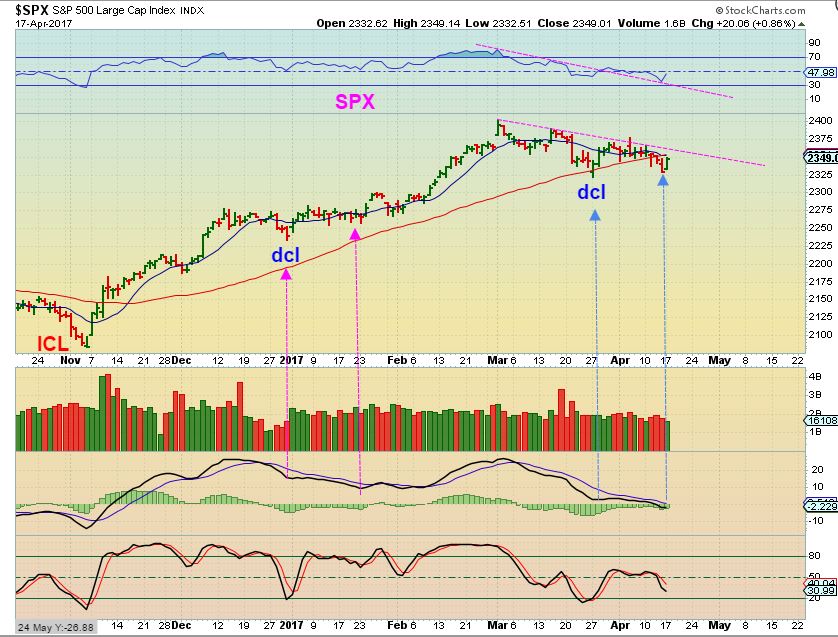
Note: That last dcl has not been broken and a break out here is not out of the question, and here is why.
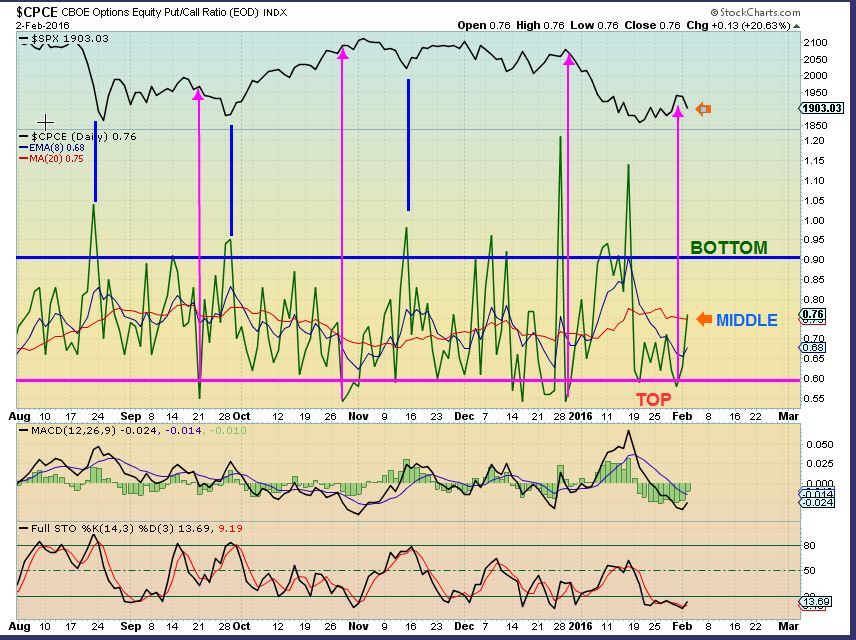
REVIEW OF A SHORT TERM INDICATOR : In past reports I have used the Put Call ratio as one way of seeing how negative sentiment is. I then pointed out ( On this Feb 2016 chart for example) how often a trade-able lows of some sort or a good bounce occurs in the SPX when the CPCE broke or spiked above that 90 – 1.00 mark. Please look at the chart below- Notice that those spikes often lead to lows and a bounce ( often near or at DCLs or ICLs). SPX is the top box, PUT / CALL is found in the middle box. Those spikes ( Blue lines) were pointed out as occurring at SPX lows.
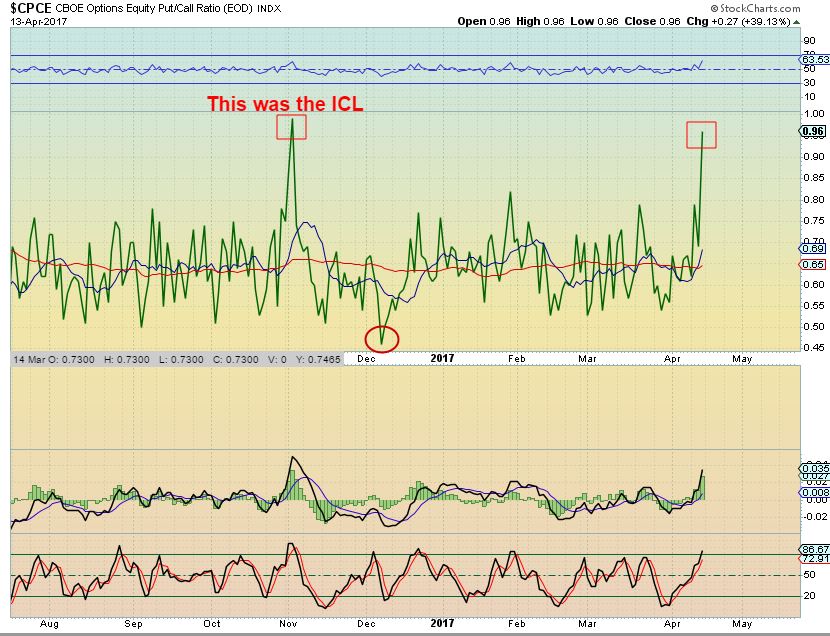
THURSDAY APRIL 13th – This spike actually occurred last week as the SPX broke below the 50sma. Was it marking a low? It is very interesting how bearish sentiment became when the 50sma was taken out, and it does usually indicate that the crowd (sentiment) is more bearish than expected. A bounce or low is usually close, so I wanted to say that SHORTING here would probably not work yet. As far as ‘going long’? I would personally wait for a break back above the 50sma and maybe even a break out as a sign of strength. Here is why.
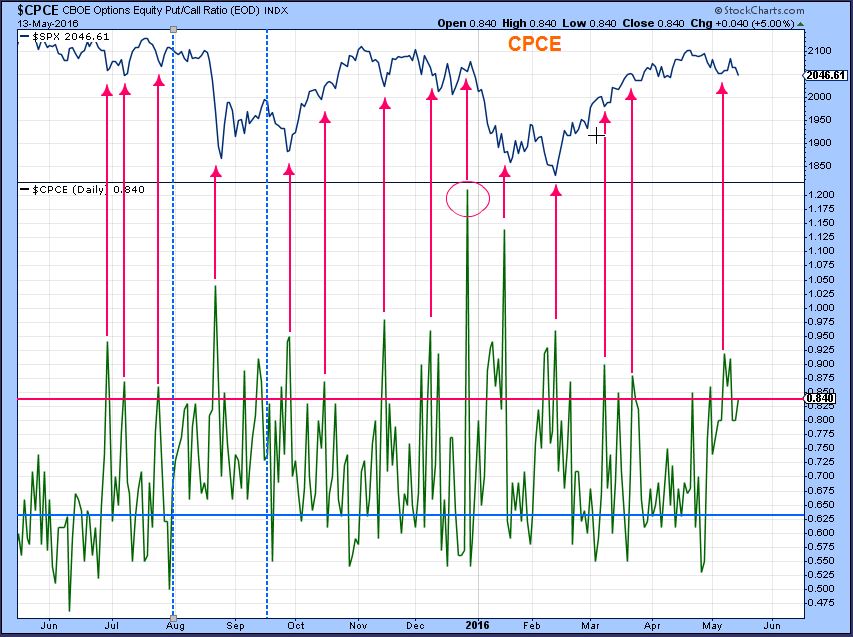
I used this chart last spring and again, spikes above 90 – 1.00 were often good trade able lows or at least a bounce, but do notice that some spikes were at ‘double bottom lows’ & markets sold off again after a small relief bounce . So I use it as a short term indicator, and I use it when the timing is right cycle-wise for a low. SPX did just put in a dcl and basically is due for a drop into an ICL soon, but the recent DCL may not quite be ready to roll over at this point.
SO again, SPX reversed higher yesterday ( or started to bounce) after that spike. Notice that I mentioned a PSAR trip on this chart? The next chart discusses that we need follow through for this to give me a buy, but it is very close .
SO using this indicator , I used to wait for a PSAR signal after a spike down below 1.00. Notice that the dip on this chart below 1.00 is RARE. INTERESTING – It usually comes around ICLs. We dipped there already with the small SPX drop. THAT is interesting and I need to study this further. The top box shows that the SPX often bottoms & we get a good bounce at a spike down below 1.00 and then a PSAR signal. So here, We do NOT have a PSAR signal change yet, but I do think the SPX would have one if it did recover the 50sma and break out. It almost looks like it marked an ICL at the last dcl. Notice that the last one was in NOV at the ICL, and then JULY before that.
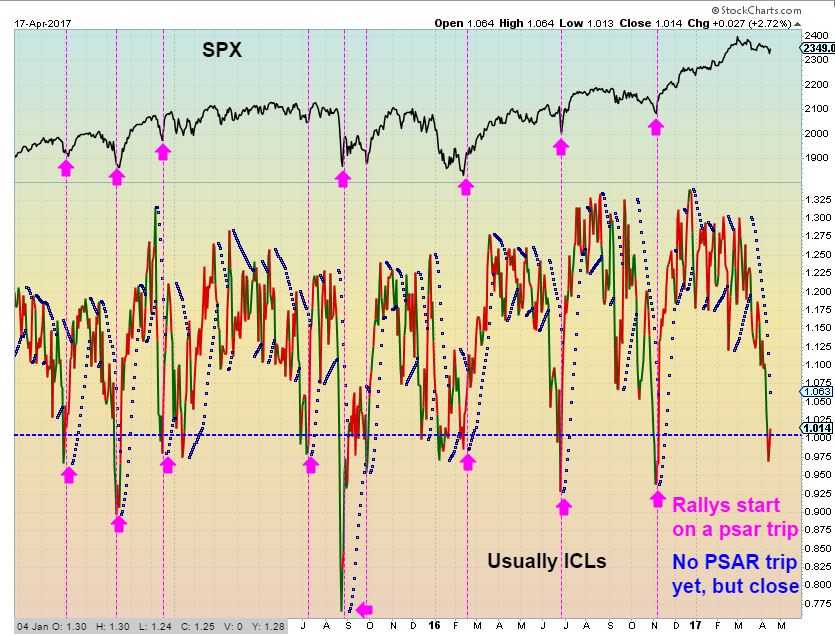
SO basically I am just trying to show that sentiment hit an extremely bearish point when the SPX broke below the 50sma, and many bought PUTS. The above chart spikes down and we get a PSAR TRIP usually at ICLS. At times when I see spikes like that, it is usually NOT a good time to short the markets. It is best to see if a new low is in place ( meaning that the last DCL will hold) and look for follow through upside. We could get a decent bounce or rally, and I’m still watching the XLF for signs too . It has broken down.
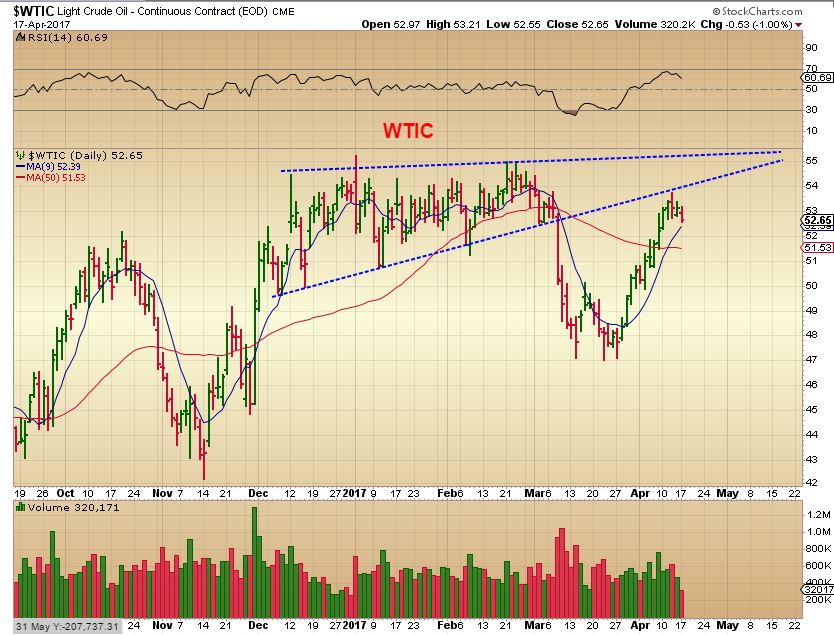
WTIC – So oil did rally upward and fulfill that back test that I was expecting, but that rally was strong enough that I personally am not shorting Oil here. It is pulling back and the 50sma may be the pull back target.
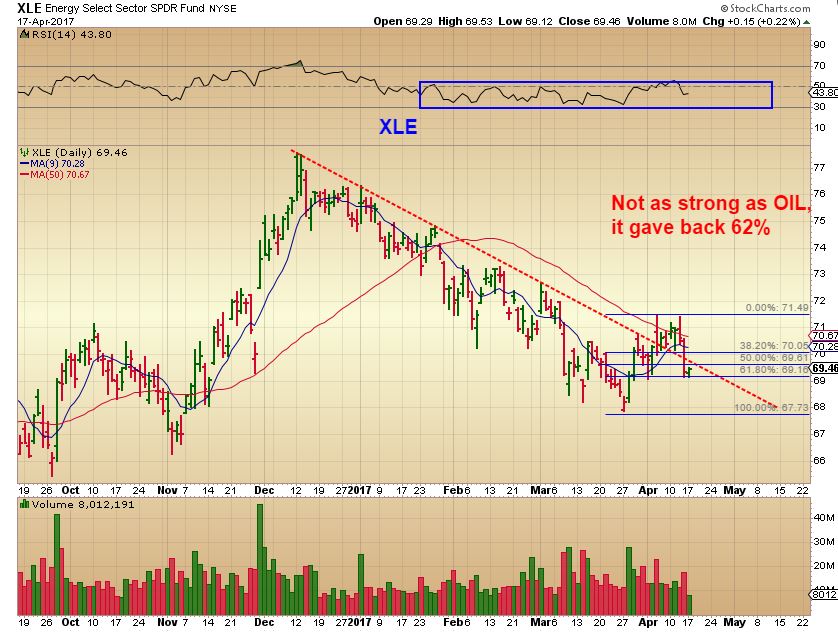
XLE – We had an ideal situation with ENERGY stocks ( XLE) as they broke above the 50sma and broke above down trending channels. Many have now pulled back more than expected and lost what could have been support ( their 50sma), so are Energy stocks possibly showing that OIL will pull back more than the 50sma? OILS RSI made it all the way to 70 (Strong) while the XLE barely cleared 50, so energy stocks really just need to now show a sign of strength or resilience before I re-enter one. They may do that if Oil just bounces around and consolidates.
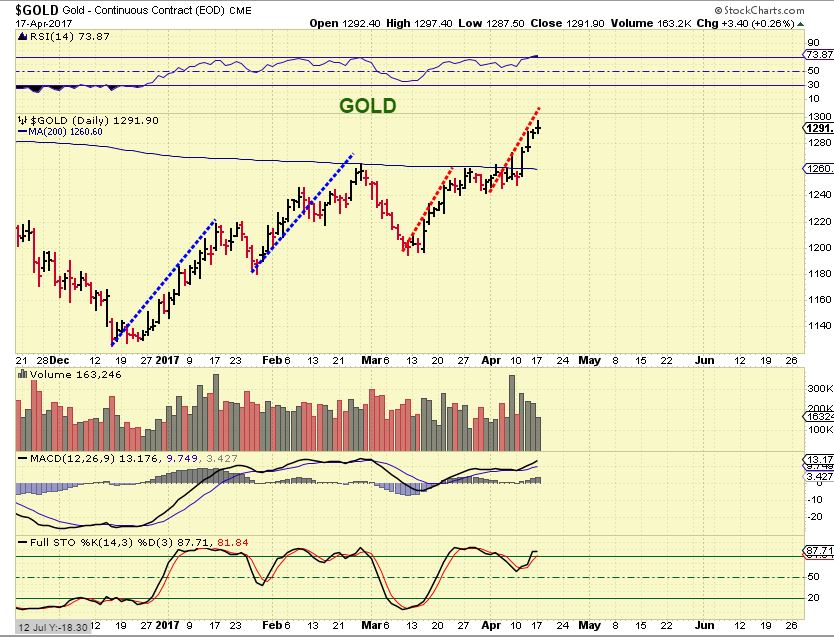
GOLD – Gold seems to be fulfilling an attempt to get to the $1300 mark. I DO expect Gold to drop into a dcl soon, but because Gold now has 3 right translated daily cycles, the next DCL may be around the 200 sma, and then we may get 1 more daily cycle ( This one L.T. ) and then a drop into the ICL later in MAY.
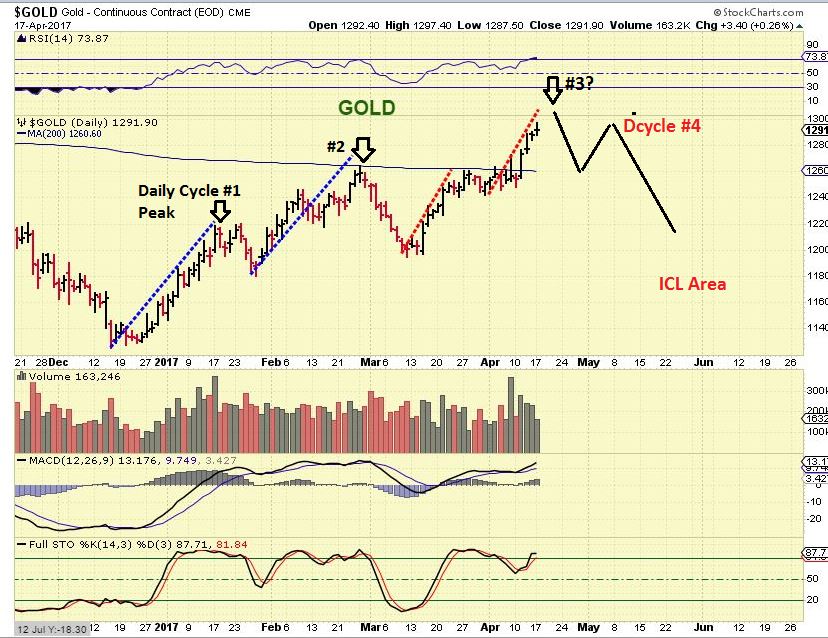
GOLD – Just to give you a visual, we have R.T. 1st, 2nd, 3rd daily cycles, and a 4th could put in a lower high and then give us a sentiment changing drop into an ICL. This is just a rough idea. GOLD has been stronger than the MINERS in this intermediate cycle.
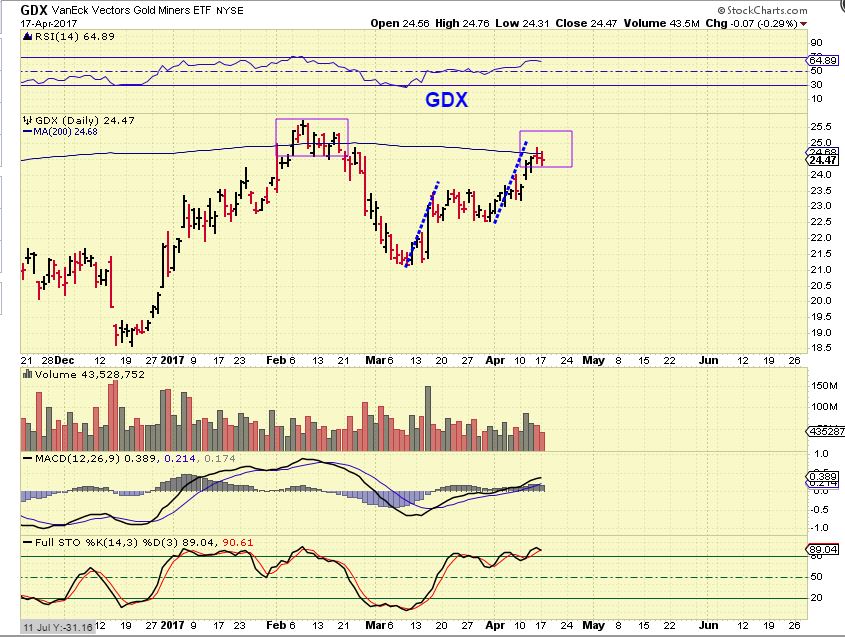
GDX – GDX is not above the Feb highs like Gold is. It is within a measured target area and could be peaking in this area as Gold finds its peak.
GDXJ 3:15 yesterday – is obviously way below the performance of Gold and the larger cap Miners. GDXJ started to break down as expected, at the 50sma. Some Juniors look healthy, others are breaking down now. Yes I’ve read the stories about GDXJ.
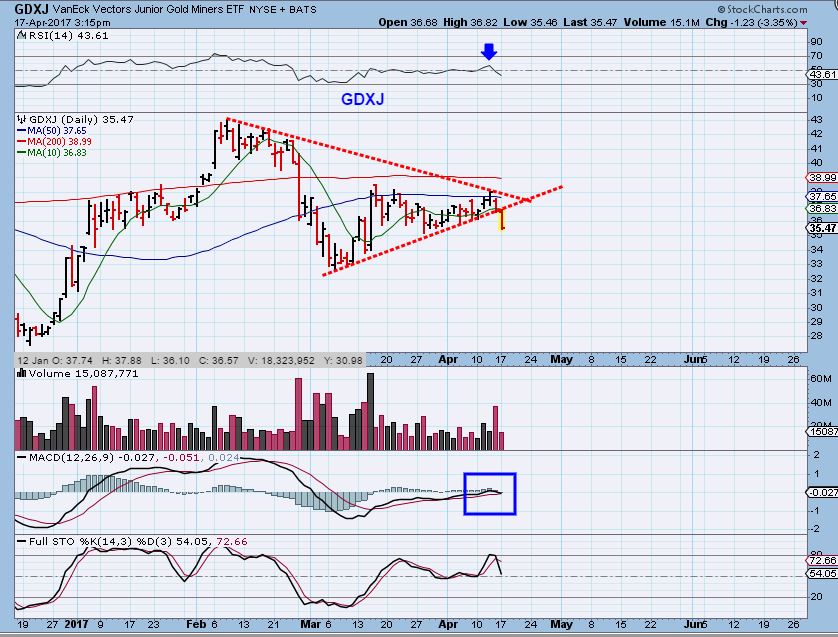
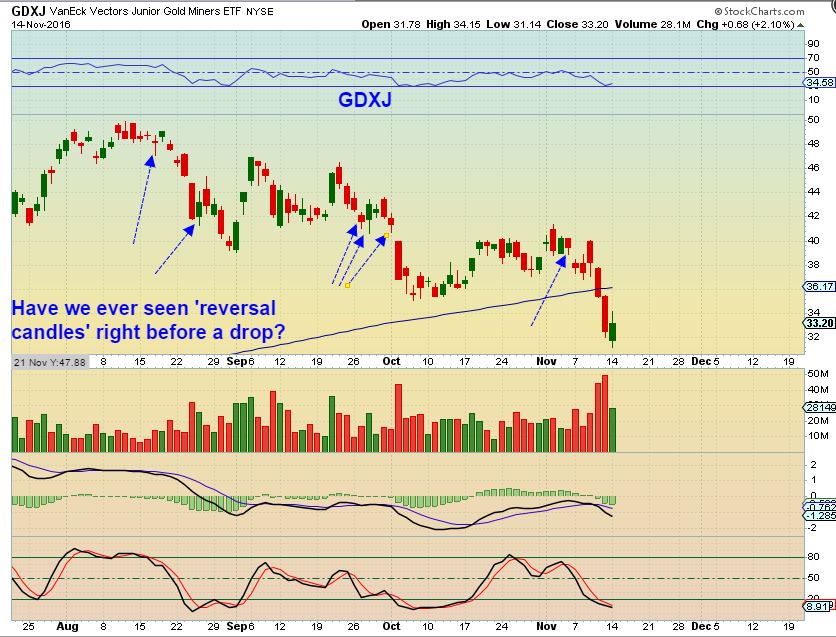
GDXJ – By the end of the day GDXJ put in a reversal candle, I was asked if GDXJ will now rally to catch up with GDX. No I dont think so. This chart shows that in the bear selling of last year, GDXJ peaked 2 times and then rolled over, similar to now, see the chart, and …
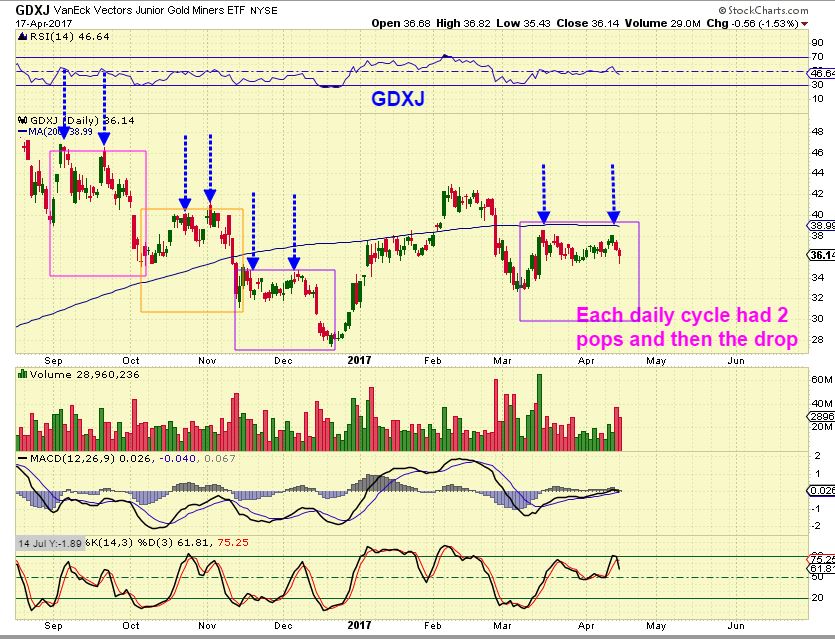
GDXJ had reversal candles then too, but it still rolled over when the “timing” was right. See the chart and also…
Many juniors are rolling over now that the ‘timing’ is getting late.
SO with precious metals, I think that the “Time” is just about up for this Intermediate run. GOLD wants to tag that $1300 area, we’ll see if it can do that. Cycle Timing dictates that a DCL is due and we are also getting into the timing for an ICL, a deeper sentiment changing low. I’m still holding a position short the GDXJ, and with the stories that everyone has been talking about, maybe the drop will be caused by a little panic selling, leading to a drop deeper than anticipated. The General markets are due for an ICL, but the recent DCL may hold and we may get a good bounce before it rolls over. Could the indicators be indicating that the recent DCL was really an ICL? I just don’t think that it fits the criteria, but if the markets were going to go parabolic in 2017, the dips would become more and more shallow. I dismiss this idea at this time due to the lack of recovery in the XLF, but will continue to monitor all things. We have plenty of time to see how this plays out, but anyone wanting to buy a recovery of the 50sma can put a stop under it as a low risk long attempt too. The choice is yours.
Recent pullbacks like we are seeing in Metals & Energy stocks (and should be about to experience in MINERS) can lead to good low risk buying set ups in the near future, so I am watching for that. Enjoy your Tuesday trading!
.


Thanks Alex. Any thoughts on natural gas?
It still looks like it could drop to the $3 area
I’m not sure if you are looking for an entry? Do you own it and are concerned? So thats what I see for now
The USD is dropping fairly sharply this morning, I’m surprised that GOLD didnt POP above $1300 at the same time.
Britain announced a snap election ….so pound is up US dollar down .
alex, PGH lost the 10 sma. Time to sell?
LA ex, that’s an airport, right? 🙂
Kind of a tough question. If that was your plan, yes.
The overall chart doesn’t look bad, it stalled at the 50sma and pulled back, but the MACD & RSI still seem to be rising or holding up. It’s a tough call, but if it doesnt recover the 10sma with todays bounce & that was your plan, then yes, you could sell for now.
Alex, thanks for the detailed analysis of SPX. I bot TQQQ yesterday based on the test of its 50 day SMA last Thursday and recovery yesterday. I’m front-running my charts a bit because I do NOT yet have a “buy” on my daily chart but I did have a “buy” on my hourly and 2-hour charts, and that combined with VIX apparently topping yesterday I figured it was worth a shot since I wanted to have my entry point as close to the 50 day SMA as possible. So I’m watching closely and I’m well aware that the stocks could quickly roll over and fall harder. Check out this MASSIVE bearish “signal candle” on the 15 min chart of SPY. It points to a possible slam down to around $226! All of the stock indices are still a “sell” right now on my charts, so I want to see a good reversal today/tomorrow.
https://uploads.disquscdn.com/images/ac532893023bdc55e6df28d06795eafca5751343a3667b00a5658c88190b2ecf.png
The long tails are back! Thanks for posting it Steve, I find this interesting. Let’s see if it predicts anything in the next 10 days or so.
interestingly, that is the area that I would look for an ICL on a weekly chart.
I know it seems like crazy tin foil hat stuff, but it’s surprising how often these hit. I will also point out that there was a similar massive long tail down candle for SPY on March 21 that has not hit … yet.
https://uploads.disquscdn.com/images/c0f7487c1efeae45c66236a4def50fcae9df4597fa8130412bdb6d786ec08a3a.gif
Fair and balanced observations!
Keep posting it, please. Thanks.
Alex, thoughts on this chart for ONCE? https://uploads.disquscdn.com/images/9ad8916070c2a346019dfa457e87b61eada83a150447cc594682e35cb29d8195.jpg
It’s a weekly chart, seems to be at a temp low, that price projection is a maybe.
Bio & Pharma stocks follow fundamentals & longer term I find them a bit less predictive if whatever they have in the works doesn’t pan out.
Its a little different Pharma. Its gene therapy. They have patents on the delivery method. They basically provide one time treatment to cure problems. They have a cure currently for some kinds of blindness. They have others set to release later this year. The problem is, how to charge for a 1 time treatment. Weekly %R is oversold, TSI crossing higher, Daily chart looks good as well. continuing higher lows indicate an uptrend. Lower BB looks to be support, set stop just below.
Yes- I like the daily chart too. Broke a recent downtrend and MACD looks good. MIGHT back test the 10sma
Sometimes GAPS fill, and at other times they are Power Gaps, that get tested but do not fill.
NAK tried to fill the gap today and ( SO FAR) Bounced off of the top of it, the 10sma on a daily chart.
This is how I am watching it, and on a 15 Minute chart the MACD is crossing up for the first time ( progress) , but it is not crossing up on the 30 minute chart yet. I added to my current position .
The point is that this looks like a normal pull back to the gap ( it still may fill later today) and it may be close to a short term low and then it could run higher again.
To be safe, one would wait for a break out from the downtrend, but this is also a low risk entry to add to a current position.
Refresh for 2 charts
https://uploads.disquscdn.com/images/f5a8affe37c1d0377e1fdf30a58d3b80d9d2d59af4e112ec34d6a7e4534b6c94.jpg
https://uploads.disquscdn.com/images/84432bd301feee3f5fd5d2caacbfbf8477c2a216f6a54433dda242e0c89f84e5.jpg
There is no break above that down trend line on the first chart ( 15 minute chart) , and that is usually the normal buy , but I often jump the gun 🙂
This update ( refresh) shows another possibility if that Gap does fill – for those patient ones 🙂
Click to enlarge
https://uploads.disquscdn.com/images/5847a9462cb7cd6c7234ef00c7905b112337233501e7511bb150f71a1bd7d15f.jpg
under 20 comments by lunchtime….THAT is the kind of markets that we have in front of us….
BOOOOOR – IIIIIIING!
No way, Im hanging on the edge of my portfolio, waiting for JDST to rocket and ONCE to move higher. My only two holdings right now.
I got back into JDST too. Seeing if I can make up for the loss I took in it earlier.
I’ve slowly increased my position. If we get a big move down into the DCL/ICL like we usually do, I’ll make up for the last 2 JNUG/JDST missed trades in a hurry. Done with this sideways boring stuff!! Let’s get this move on and over with!
My sentiments exactly!!
BO-RING!!!
I’m on vacation this week so was all set up to trade on the Beach like Maria. But there’s nothing to trade. So, time for a dip!
I am liking miners more and more. Call me crazy but I think they can move up from here.
I agree that Gold looks great, the chart has been bullish for weeks.
GDX looks ok, since it bounced off of the 10sma, but when Gold finally dips down, it should follow.
GDXJ = Many juniors looking Weak as shown in the report.
It is honestly an odd area right now.
Alex….. excellent report, I’m serious…. you are very gifted Alex.
Thanks God for your talent !!!
Again thanks Alex…..
Thanks Geurt –
It has been one exhausting market these days with all of this sideways chop in each sector.
Not a lot of people making money these days unless they buy before a POP & Sell immediately.
Tough times…. but they wont last forever –
I appreciate your kind words.
The sideways chop continues … I’m not liking the action so far in stocks. The day started out very promising, then sold off. Currently all the major index ETF’s have flipped back to a “buy” on my 15 min chart. Remains to be seen how the day ends. I was hoping for a strong “Turnaround Tuesday” like we had on March 28 after the dip on March 27. It could still happen, but the buyers need to come in strong at the end of the day. The last time TQQQ touched its 50 day SMA was December 30 and it then took off on a two month up trend. Was hoping to see similar action now. Tired to trading sideways.
JDST just broke out of the triangle on the 15 min. Waiting for the MACD cross for further confirmation and hoping to see gold move down into the close.
Stocks continue to be in a DOWN trend on my daily chart so I lightened up on my TQQQ, looks like it’s too early to get excited.
I’m looking at GOLD and the chart really does look good.
The USD is dropping fast
GDX looks a bit lack-luster compared to Gold
GDXJ looks weak , and then….
MINERS WEAK, GOLD STRONG….
Can anyone tell me what in the world is going on with DZZ??
Does this ETN predict the future or something?
Since 4-12-17 Gold is up $20 and JDST is up 18%.. I could see Gold reaching a double top at 1235 soon, then sliding into a DCL.
Did you mean a different number than $1235? You mean the election night high of $1337 maybe?
My bad, fat fingers. 1295, match the 4-16 high
Gotcha – I can see that too
yep and huge volume today, but also yesterday
fat finger? hard to belive
I got back out of JDST at break even. I can’t tell what’s going on.
I was looking at Dzz too no idea
GDXJ could back test the $37 area. MACD is rising on the short term time table ( 15 minute & 30 MINUTE) and on the daily chart the $37 area would be a trend line break back test as drawn here.
Then if we can ever get a gold top, GDXJ could drop quicker.
The thing that caught my eye was really the 15 minute and 30 minute time frame ( 5 day) where GDXJ MACD is now rising and crossed up. That could be short term temporary strength .
https://uploads.disquscdn.com/images/367f2f4c29e00c7476417c25ca707ec0dfc7544cd3ecc4559083d9b2ffab32d1.jpg
GS dropped almost 5%
Big volume too
Gold did not make a new high, in spite of the big drop in the dollar. Perhaps the top is in.
I was very surprised that Gold wasn’t up $20 with the USD down that much.
And with Gold up near the highs, Miners lagging wuite a bit. It does feel toppy, just a matter of time (Again ) 🙂
Alex, is this possible a coordinated effort? someone dropped a $3B gold futures contract this morning to hammer the gold when USD was dropping.
You can see that gold “wants” to go down, in the sense that during periods of the day when the dollar strengthens, gold goes down a lot (relatively speaking), while when the dollar weakens, it goes up relatively little. It is just biding its time for the dollar to bottom before it corrects, IMO.
Tug of war between bulls and bears, politics and geopolitics, and time.
USD creamed and gold up $6. As a guy still holding Jdst, I take solace in silver pulling back from 18.50.
Should the drop in USD be kneejerk and a usd rally ensue, I wonder if the corresponding drop in gold and silver will be of magnitudes higher than this pop.
I almost got “tired and worn down” out of my Jdst today.
I here ya Glenn – I am SOOOO tired of the lack of trades.
I cant find many progressive trades out there at this point, until we get a good trending move.
It definitely is tiring & boring
Hang in there though – timing is on our side.
I sold PGH. I didn’t like the action today, especially during the final hour. I am still in MACK though
PLG just cut off at the knees after bought deal. No irons in the fire either way here but I was looking at them for the next ICL. https://seekingalpha.com/news/3257749-platinum-group-metals-20m-bought-deal-financing-1_30-share?app=1&uprof=45&dr=1#email_link
This is insane. Personally I will stay away from PLG.