4-3-2017 Keep It Simple
I need to keep this report SIMPLE. Best wishes to me on that one…
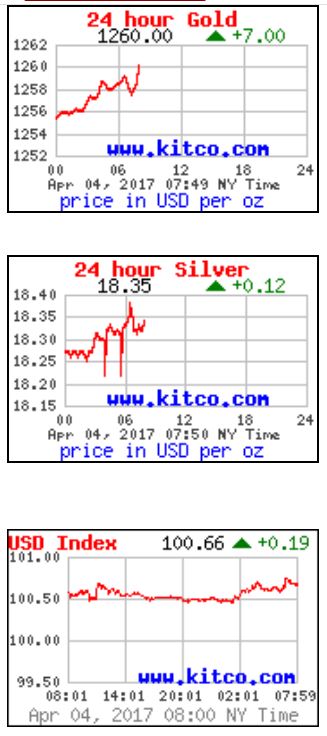
ALL EYES ON GOLD & THE USD THIS MORNING-
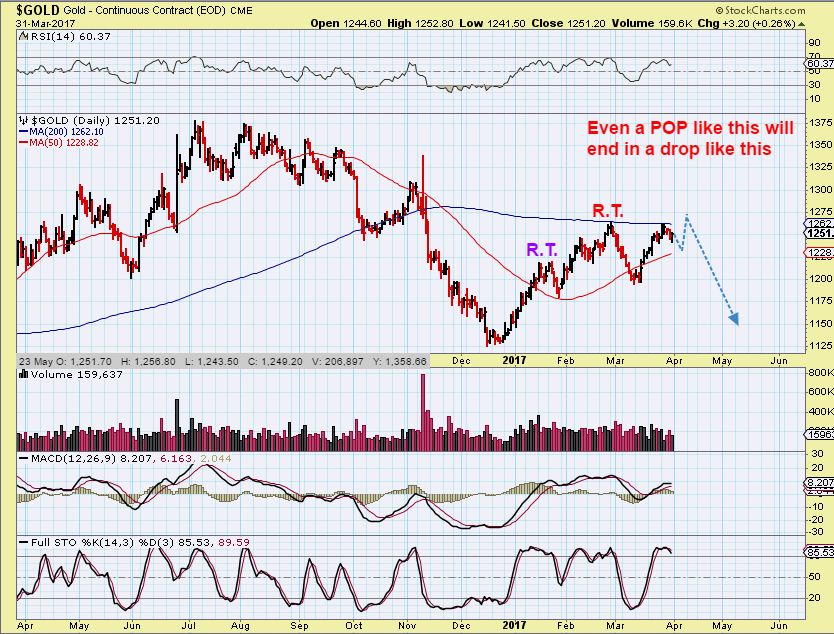
The 200sma is at $1262 and that has acted as resistance in the past few days (so far)
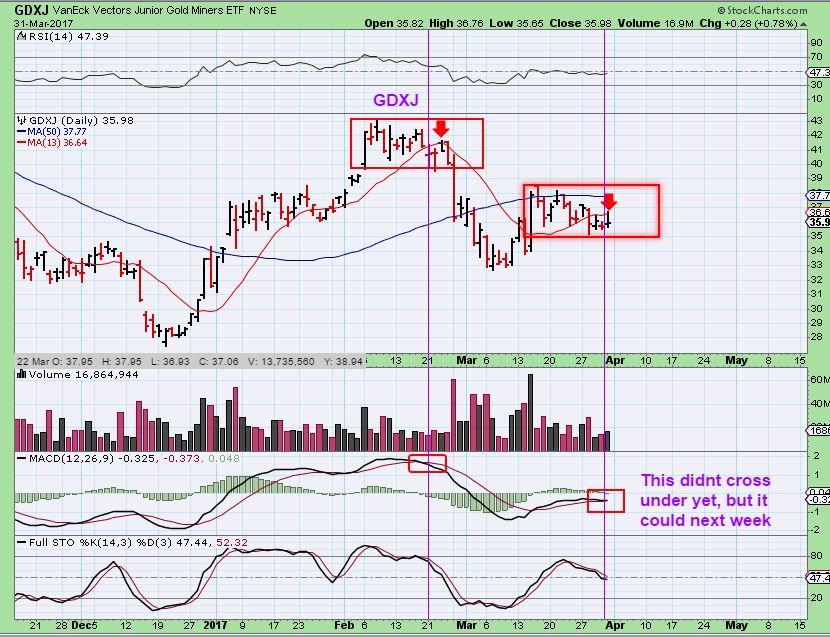
We need to look at the possibilities going forward, in harmony with the weekend reports expectations that GOLD & MINERS are in a 3rd daily cycle and time is getting late. Cycle Timing is getting late, but can GOLD & Miners still go higher? In the weekend report I did say that they could, but it seemed less likely. Monday had the Miners looking a bit more bullish, so we need to discuss this area again. I need to try to KEEP THIS SIMPLE, so I will try to do that by explaining each chart in basic terms.
.
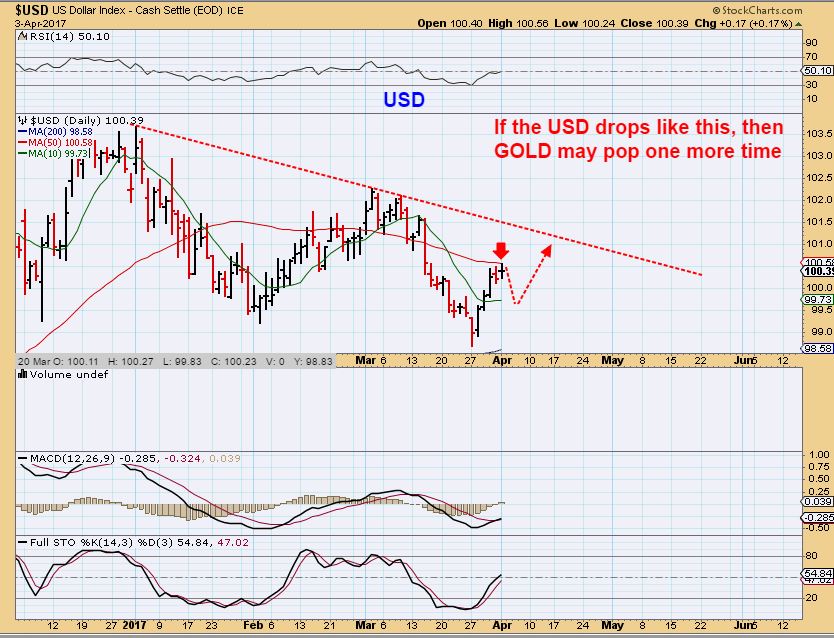
# 1 USD – If the USD pulls back at the 50sma, that would cause GOLD to run back up to the 200sma, and Miners could also react higher. This is still a short term move with ‘time’ limits. ( EDIT: The USD broke above the 50sma in pre-market). Gold continued toward the 200sma.
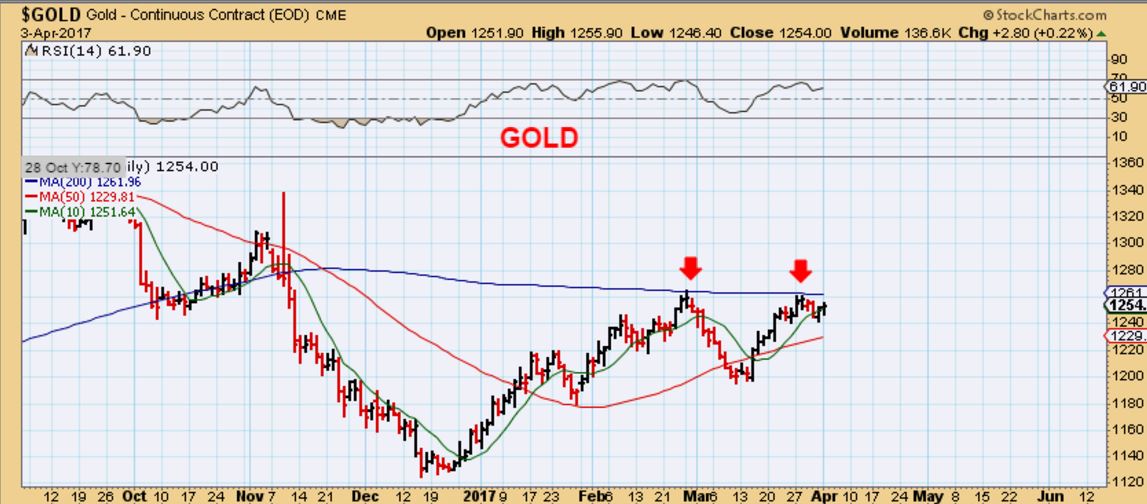
#2 GOLD – I drew this last Friday – The 200sma is at about $1262. A pop like this should still be short lived, but Gold did have 2 R.T. daily cycles and they can break to a 3rd daily cycle new high before rolling over. That is normal, but usually will not happen this late in a 3rd daily cycle. Gold MIGHT briefly break above the 200sma.
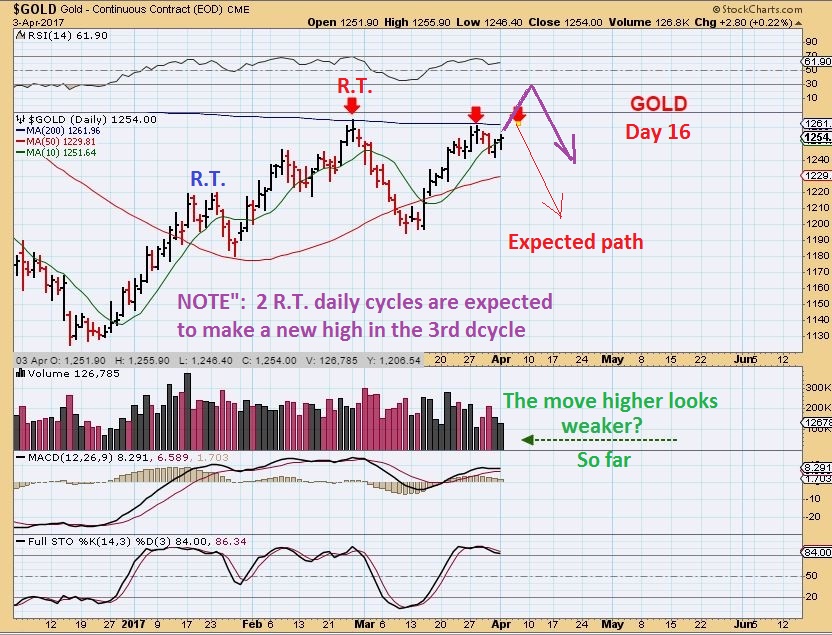
#3 GOLD – On day 16 I do NOT expect Gold to go a lot higher, but again it was R.T., so we could see a pop to new highs. Thankfully volume is weak at this point, and hopefully it stays that way. Please read the chart.
#4 GDX – $23.45 is the 50sma. I drew this Monday morning and a pop to the 50 or 200sma has always been possible, but since the Miners were L.T. in the 2nd daily cycle, it seemed unlikely. Now I have to wonder …
1. If the USD drops as shown above, would Miners pop like this?
2. As GOLD POPs to the 200sma, would Miners pop like this?
3. Will Miners exaggerate that move by Gold and jump to the 200sma? It has always been possible, so it had to be addressed. ( EDIT: PREMARKET GDX IS AT THE 50 SMA) Read on…
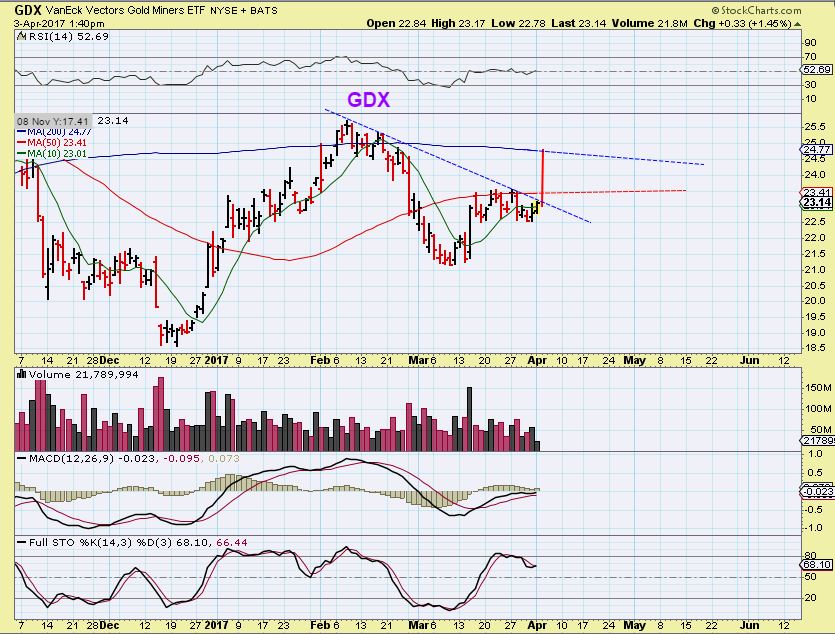
SIDENOTE: I have purchased JDST when GDX / GDXJ tagged the 50sma and that causes a cautionary ‘situation’ at this point. I have ALWAYS said here that I hate to recommend 3x ETFs to traders, because in my opinion when you trade 3X- you need to think 3 times as fast. USE A STOP OR LOCK IN GAINS is one answer. I have mentioned out loud that I am in JDST, so I know others follow me. I am still in JDST, but I bought in the $13’s and now I may have to sell if Miners rally here. What are my thoughts here?
I do not HAVE to sell, because I still think that JDST will be in the $20’s sometime in April. If it drops to $12 and then goes to $20, the pain is brief, BUT MOST CANNOT STOMACH THAT, and I am a trader playing safety first anyway, so …
A. I might sell if I see a rally unfold in Miners, to try to buy JDST back even lower ( near $12?).
B. Or I BUY JNUG & HEDGE UNTIL THE RALLY IS OVER. I hate doing this, but timing should make this brief.
One really should always protect a trade that doesn’t unfold as expected. It happens, so you run defense at that point. Those familiar with US Football can look at it as though “Someone intercepted the ball, now it is time to keep them from scoring against me”. You run defense ( Hedge or sell ) until we get the ball back. So I may sell or I may just buy JNUG to hedge a short rally in miners, etc. I may need to protect this set up, but it doesn’t mean that the final results have changed. I still expect that a 3rd daily cycle will roll over soon, we may just have unfinished upside business.
.
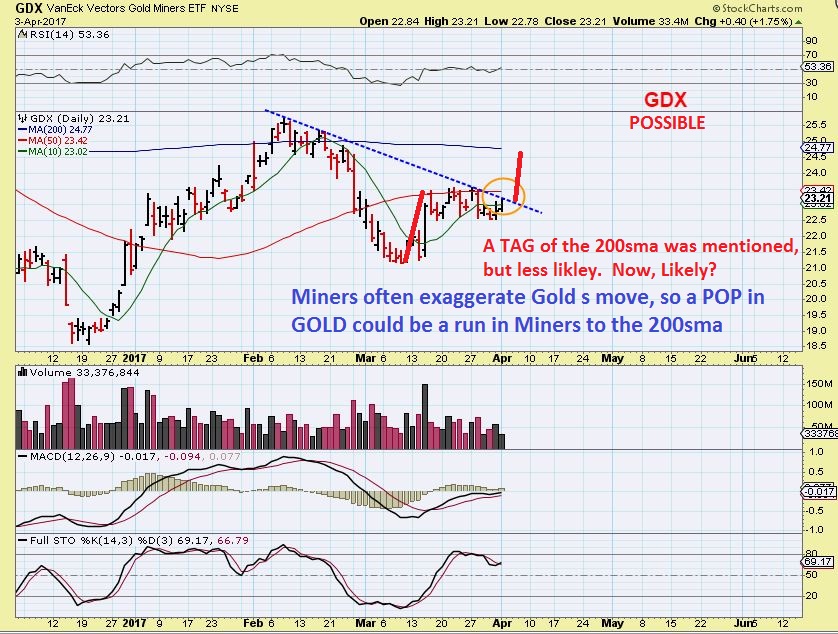
#5 GDX – So if GDX breaks the 50sma & tags the 200sma, it could look like this. I did mention the 200sma is ‘possible’ in most of the reports last week, but less likely timing wise. The JDST that I own would be dropped fairly quickly, right? NOTICE THAT The hard part is that GDX broke above the 50sma each time, and then closed below it. We may see that or it could run to that 200sma. The volume is weak, the MACD is bullish. That gives MIXED SIGNALS and Gold may hold the key.
#6 – This was in the weekend report. If Gold POPS and DROPS today, Miners still may not break this red box above the 50sma.
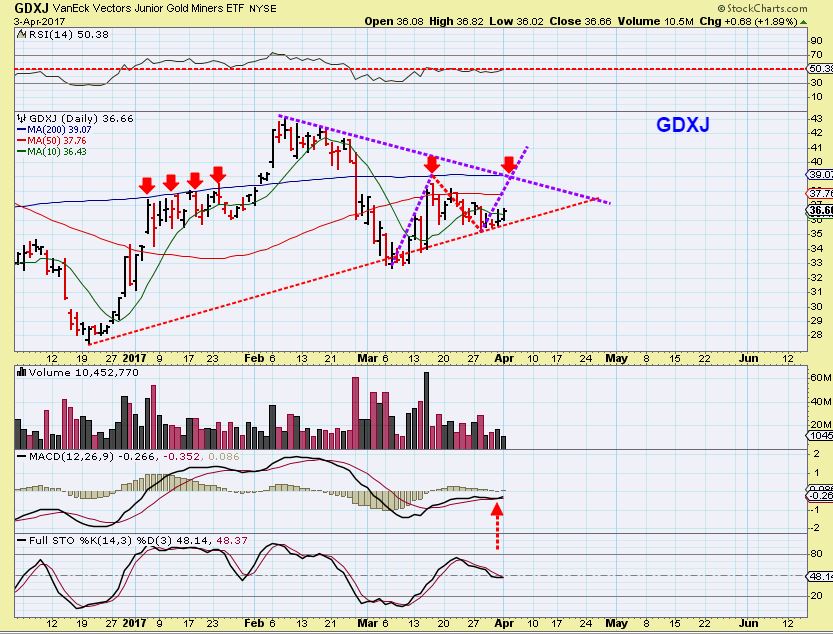
#7 GDXJ at 11 a.m. – At 11 Monday Morning I captured this chart trying to break out of this downtrend. I was pointing out our 2 targets at the 50 & 200 sma.
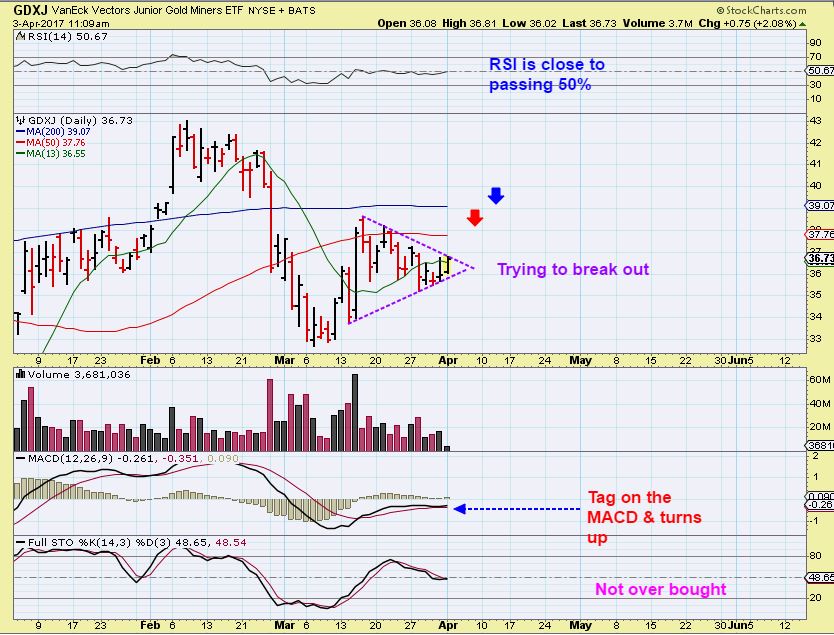
# 8 GDXJ at the close – It did NOT break from the triangle shown in the chart above, but if it does, the bigger pic resistance is where the purple downtrend line and the 200sma intersects. That is $39.07 and for those holding JDST, if that happens, that will hurt. Protection is key for active traders if this breaks out higher.
The above situation is why we start with ‘Starter positions’ and then we build on them. I can protect that JDST position for a few days with a JNUG purchase or just sell JDST and re-enter. I hate this situation- it’s certainly not the ideal outcome. When Gold pops, Miners often exaggerate that move, so Miners could run a bit higher. This needs to be monitored short term. The Long run outcome still remains the same.
.
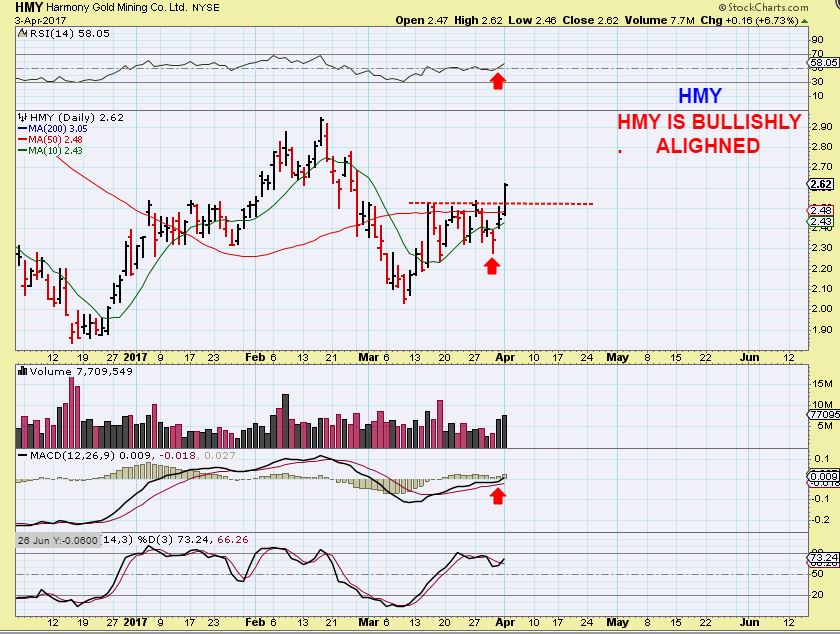
IS THIS A ‘TELL’? HMY looks exactly like the GDX chart to me, only it broke out with conviction Monday. Is this 1 day ahead of what GDX will do?
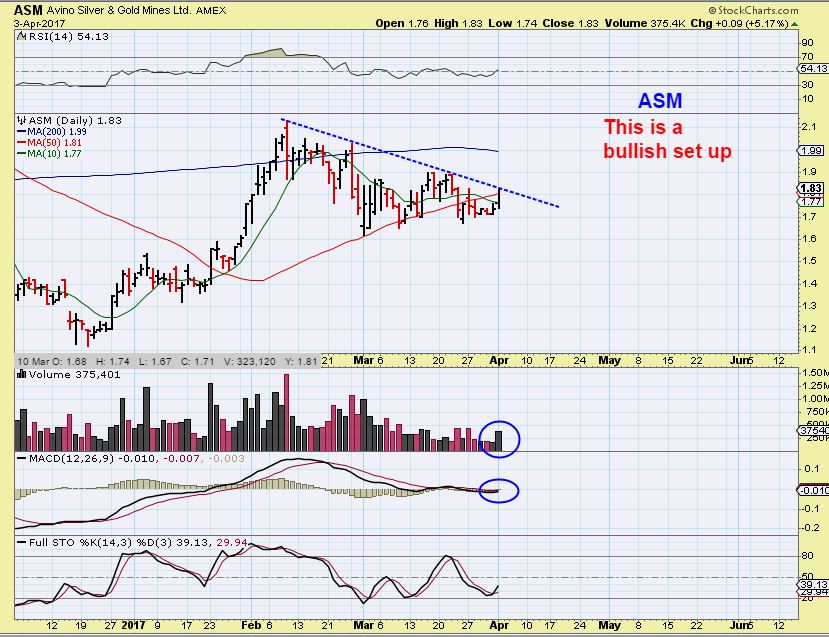
ASM also looks like it wants to break out, with volume swelling as it presses on a down trend line. So if we see individual Miners trying to break out, it could be a ‘tell’ that GDX or GDXJ may follow to the 200sma. It is a warning sign or a cautionary note for holders of Shorts of any kind.
That is where things stand at this point in the Precious Metals sector. Mondays move by Miners seems to have shifted the possible tag of the 200sma to a bit more likely. I have mentioned protection in this situation, but I would still expect a drop into a 3rd daily cycle and possibly even an 4th down to an ICL in May. Those simply waiting for the ICL are probably pretty happy right now, avoiding these choppy and volatile days. For active traders, we always need to protect our positions. It is a part of trading.
.
~ALEX
.
EXTRAS THOUGHTS
.
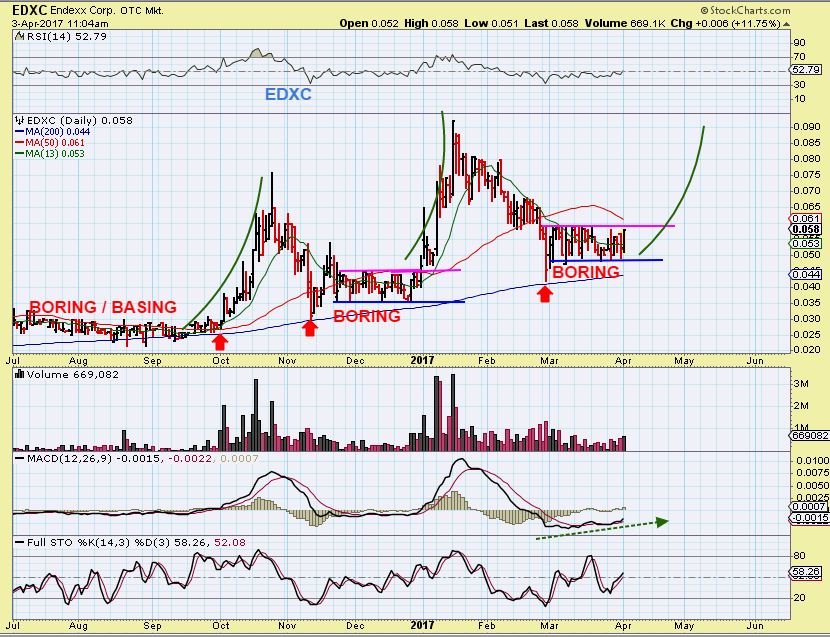
EDXC – Slow boring consolidations eventually broke out higher. EDXC is in a consolidation.
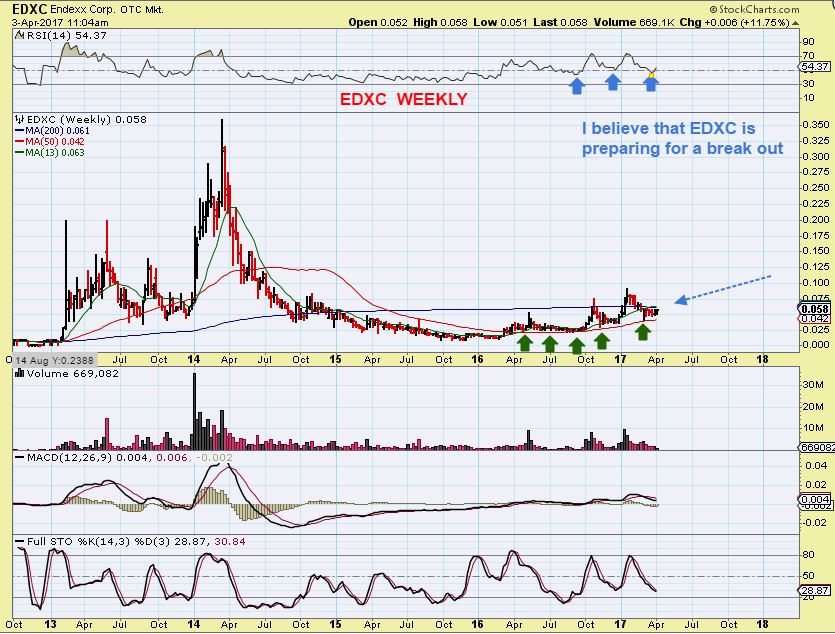
EDXC WEEKLY – Looks very good on a weekly chart. Twice it tagged the 50 wma, then consolidated, then ran higher.
LGCY – $2.29 WEEKLY CHART. Oversold and does look good.
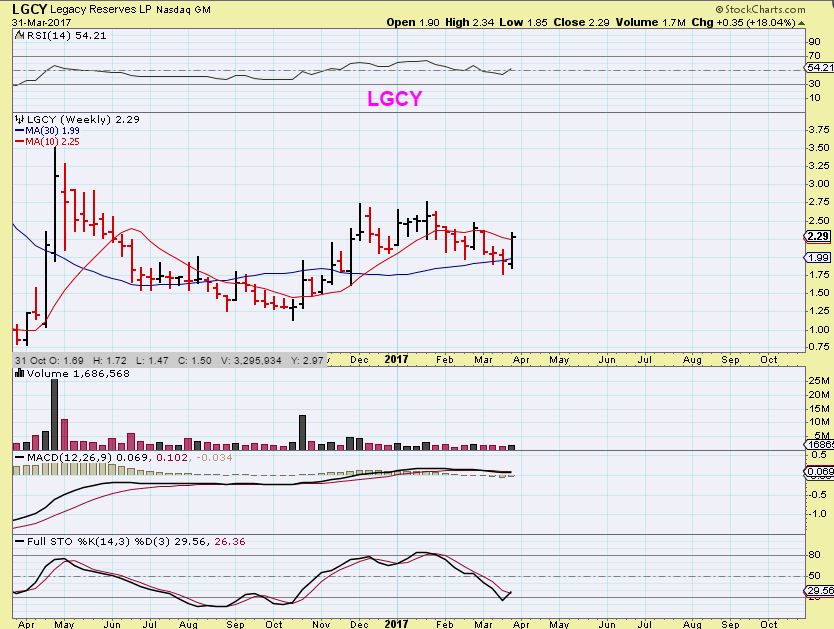
LGCY WEEKLY BIGGER PIC – $2.29 and I like this set up.
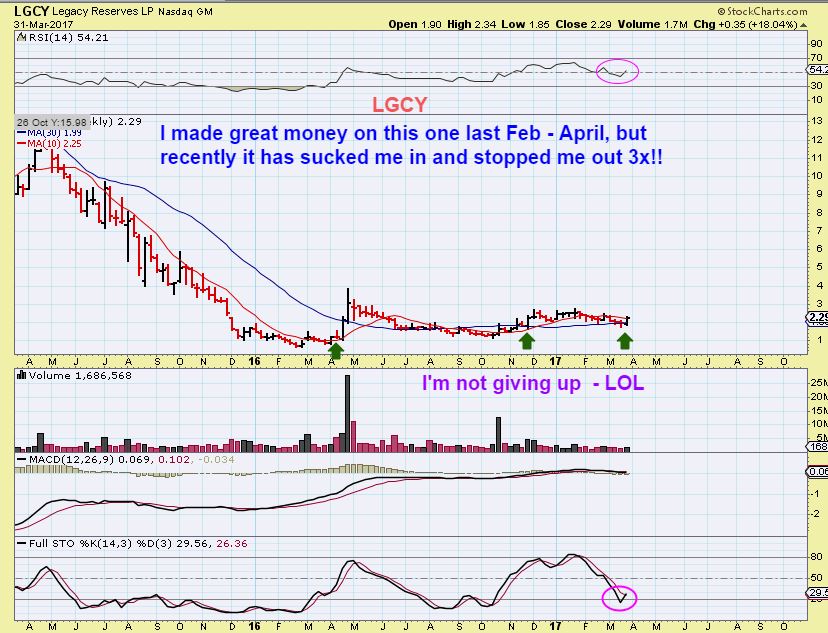
LGCY UPDATE – Monday it ran a tad hogher and I’m watching to see if it has follow through or will remain range bound.


Thanks Alex.
Nice job Alex!
Some days are easier than others : )
Right now I see GDX up only 22 cents & GDXJ still under the 50sma pre-market, and Gold shot up to the 200sma and is a little ‘all over the place’ struggling in that area, so we’ll have to see how things play out today.
This could be the perfect last chance to buy JDST, or the last chance to sell it for a small profit before it drops quickly during trading . JDST is at $13.50
SO FAR ( REFRESH) Gold is struggling to get through that 200sma and hold price.
https://uploads.disquscdn.com/images/74b9de8112cf58d4c22c553a02be93c9b39eddb7a2dd3e09f4e3d7d82494dbcb.jpg
I was thinking the same thing. IF I had more stomach, I would load up. But I don’t, so I’ll stay with what I have and see where JDST takes me today.
Brilliant report, Alex – even more so in the context of your recent reports
Thx Cal – I appreciate that – crazy point in time here. Tough to write some reports with so much going on.
This one was a bit tougher than others.
OK. Here I go again:). Humor me, Alex. Back in February of 2016 which was the last time gold broke the 200 day, it went up $120 from that point to about 1250 give or take, like a shot. Looking at the current set up, if we don’t pull back here there appears to be a lot of pent up energy as it continues to back and fill in this region such that gold could really move if it breaks free of 1260 congestion zone in earnest. I know I asked this question yesterday. Assume it makes a good move from here relatively soon, how would you use cycles to explain this? Call me stubbornly interested. Lastly, I know you compared the current set up with that of February where a sudden drop took place. Is this potentially starting to look more like the end of January instead where we bottomed out in the third week of January (similar to how we may have bottomed out in late March) and moved higher over the next 7-9 trading sessions? That would take us to early April and then spend the rest of the month into May declining into the ICL similar to what happened in January/February. Using cycles, plauable?
Sorry, I’ll have to try to read this later, really trying to watch the markets this a.m. and I read it 2 times and could quite grasp the question without looking at charts etc.
Understand. Table it. If things change you’ll explain at that time anyway. Besides, may be a moot point if things pan out the way you are leaning.
I think I see what you are asking now, it was kind of like 2 different questions.
So far I just see GOLD tagging that 200sma and GDX tagging that 50sma and it gets later into the daily cycle with each passing day. I expect a drop into a dcl sooner than later : )
Good enough. It WAS two different questions. The first was on cycles the second on the current set up and whether it looks more like the end of January rather than the end of February on GDX. My bad-I threw you off. Thanks Alex.
Crazy market in PM’s! FWIW, I have JDST as a “buy” and JNUG as a “sell” on my 15 min charts right now prior to the open, but that can change quickly once the “real” trading starts. Meanwhile, my TQQQ is down but it is a “buy” on my 15 min chart right now, so I expecting it to move up after the market opens. Good trading to all!
GOLD AT 9:44 a.m.
refresh
https://uploads.disquscdn.com/images/99a4459e2f8a627a695fed9107676d30b3bb25f60ac30e514ffcebbbbbc87422.jpg
Nice. I actually bot some JDST this morning based on my 15 min chart that I posted before the open and your bearish possibility for gold. Will be interesting to see how this plays out.
Thank-you very much Alex for your thoughts.
I really in the end report what you say: “What are my thoughts here”? etc…..
It leaves us open where your thoughts fit in our thoughts. You are a honest person, I really appreciated that from you. It leaves us with our own decisions !!!!!
Again….. a great Job Alex.
Thx Geurt – so far so good on the GOLD stopping at the 200sma and the Miners not running a lot higher
EXK & CDE and a few silver miners do look like they want to complete their moves , but they both dipped deeper , below their December lows, so they could just be recovering or playing catch up. They arent up near highs
UGAZ….drives me crazy….sold yesterday. Up 12%
Yep. Makes me furious.
I sold all of my UGAZ and SWN
Both look excellent today : )
Thanks for noting this…I followed and sold my SWN for a nice profit.
SWN bouncing back
Of course…I sold…LOL
I’m happy that it was for profit ( me too), but I sold mine and now I wished I didn’t.
SWN is tagging the 50sma and it could break out higher. I wanted to buy a dip but yesterday was a bit scary and today it looks great . These markets are choppy for sure.
As a friend of Bill W. for 32yrs, I appreciate your daily headings for your reports. I sometimes forget. 🙂 Thanks Alex.
Is that Wallace?
And I sometimes forget too.
Bill Wilson and Dr. Bob Smith in 1935 that I’m referring to. 🙂 They started something life saving called AA. 🙂
;O) NICE ….
William Wallace from Poly’s site? I remember him. What ever happened to him? He was truly excellent with moving averages.
Congrats Kenny!
Many thanks Hawaiifive0!! 🙂
FYI … just so I don’t sound like a “permabull” on TQQQ,I see some bearish signals on my daily chart today and it may have topped yesterday, so I am watching it very close and have it on a tight leash.
Watching TQQQ closely. The QQQ are pretty inflated. I’d like a good drop to enter
Yeah, I waited for MONTHS for a “good drop” in TQQQ to enter and literally slept through the “good drop” on March 27. Then I was chicken to buy on the March 28 follow through because I was hoping for a pullback to retest the March 27 low, or come close to it. At this point a tag of the 8 or 9 day EMA may the be best you can get. That’s what happened today before it rallied into the close. I’m looking at TQQQ as a long-term hold in my retirement accounts. It’s up 39% YTD. I could have dumped 100% of my retirement funds into TQQQ on January 3rd and forgotten about it and I’d be up more than I am today with all my in/out trading. I’m very bullish on stocks for the next few years, contrary to many traders who expect a big “crash” to be coming soon. I remember the mid to late 1990’s when many “stock market experts” were predicting that NASDAQ was about to crash. They were eventually right, but in the meantime they missed out on YEARS of massive gains by staying on the sidelines. IMO we are in a similar market now. Every day I read stories about how the market is going to crash very soon … but it keeps on chugging higher. I’m not blind, I’m watching the charts for signs of a “top” but right now TQQQ looks very bullish. Please remember that QQQ is more bullish than NASDAQ and NASDAQ is more bullish than the S&P 500. That’s why I like to play the TQQQ. A 3X stock index ETF is way less volatile than a 3X miner ETF because they (usually) move a lot slower than miners.
Any mysterious candles on gdxj?
I don’t see any major ones today in GDXJ, but there are a couple long tail candles for GDX today in the pre-market and the AH. https://uploads.disquscdn.com/images/c8f1ba108c937599a1aa166a9bae011e9d61016f9f03cf2af846a682bfb6ea95.png
Alex,
Thoughts on NAK…below 10dma……?
thx
Hey Curtis – I have no new thoughts.
My stop is below the 200sma because I entered there, you would need to know where yours is based on your entry .
Can it drop to the 200 sma ? Yes.
Can it break the 10sma and recover? Yes.
Can it break the 200sma and keep dropping? Yes.
I dont know why it is doing what it is doing, so I just have to know where my exit is based on my entry.
EGI bounced right on the middle of the weekly band as I thought it would. those bands can really be pretty good trading signals imo https://uploads.disquscdn.com/images/78d202b9a5a99719c5828a59f05fe43c8b674eb08697ff4b6a704705e75121d6.png
Not sure if you know this, but that middle line on a standard setting is the 20 sma.
If you add a 20sma to your chart with the BB, you’ll see it pretty clearly, it makes the dotted middle line solid : )
Good to know……
You can set it as well- 2,20 is 2 standard deviations with a 20SMA. I know some that use 1.8 as a tighter band. Just have to know your standard deviations and bell curve, sure you remember that from Stats!
Well, JDST is now green, volume dropping over the last week on JNUG.
anyone has SOXS?
yup… but has just gone sideways since i botted it
shall I stay? It’s kind of frustrating.
i’m staying in.. its started curling up now.. threatening to finally break higher
thanks. I’m just concern of the general market. If QQQ goes to the all time high, then….
this might comfort you.. daily chart of last 9months.
breakout from indicator triangle in last coupla days.
if it reverses back down, like November, im dumping it, and will consider myself all shook out.
https://uploads.disquscdn.com/images/66b3c56e609c1242cf5870ab16f3908455a93ff9017dc3dc81e64a24edbd347a.jpg
thanks, SonOfGud. I don’t read chart that well and just thought SOXX went too far. :), Please let me know when you exit.
Hoping OVAS bounces of the 50! MACK looing good, JDST looking good. I might have overstayed my welcome in PRAH. GUSH consolidating. CGIX flagging. Just thinking out loud! Guess what stocks I’m in.
I went ahead and took profits on boil this morning but thinking of hanging onto SWN for the long play. Mixed on what to do with the uranium plays.
I wish I held on to SWN…it is just ripping through that 50sma after a scary shake out type drop yesterday.
Best wishes on the ride higher – I like it : )
Im still holding SWN as well. Wish OVAS and CGIX would recover
CGIX still looks like NAK did last October – Dec to me. Many forget how big those swings were, but CGIX with a 13 sma kind of looks very similar to that time period to me.
Yes! Good stuff today. It’s called SWNning. *bort!*
Alex, thoughts on AGTK weekly, also URRE? They both kind of look like they’re forming bull flags on longer time frame
I like both – but I dont know what AGTK is, I’d have to look it up.
EDXC looks good Alex. Got a starter today. Good r/r
Seems that its just a matter of time. (Which lately, unfortunately, has been dragging in many ways & sectors ).
Yeah, I have just a bit and may add shortly.
Bot some JDST at vwap for protection. I can see shenanigans on the horizon
SDRL getting taken to the Woodshed this morning. Have not been in that one for a while now thank God.
That and NADL – I havent been buying the smaller ones this time around either
One thing i’ve realized over past year, is that those huge vertical short-covering +200%ers, off of the bottom, .. are usually wave 4(c), with a whole world of pain to follow, if you stay in.
Yeah, the ones that come after a 1:20 reverse split just to keep the hope alive. : )
TGC though… I like that ( And SHIP)
SHIP is a fine example.
that giraffe in Nov was a 4c.. and it looks like the little moonshot in last few days, is a lesser degree 4wave
Feels like the pm’s are ready to rollover. But that pesky silver keeps holding up.
Jdst looked pretty good under $14.00 most of the am.
Long the short;)
Gdx stronger than gdxj- right to the 50dma. I get to check out for the afternoon.
We will see where the chips fall.
yes, and it is also already at the 50sma, where GDXJ is lagging.
Pretty light volume so far on GDXJ too
CLF looking good here after I got stopped out of course…….
Smaller position for me so holding strong, giving it some room!
GOLD POSSIBILITY?
refresh
https://uploads.disquscdn.com/images/d3f56d7f893a6aed0ff9a96631a72a363a94745ae8264f5660c16b9da33dfe83.jpg
u see PLG … rut roe
Hmmm, Platinum. Maybe leading the way.
So far……………….NUTTIN
My MACK is almost offsetting my NAK – But not quite : (
my MACK is neutralizing my URRE.
Just got back to computer…shoot, MACK is down from what it was earlier in day…good time to add more if one wanted to?
Hi Alex,
Own a bit of MACK……would you add to it, or GCIX or OVAS on pullbacks? Where were good entries be for these? Any insight would be helpful.
Thanks
They’re all kind of tricky loose and wiggly – so it’s a tough call. MACK does look like it is set up at the top of the base to possibly break out and run soon, but it also an still just trade in a range ( range bound). I just bit the bullet and added yesterday inside of the base since my starting position was smaller than I wanted.
CGIX looks similar to NAK beofre or even VSTM Now, using the 13 sma. It looks like they just jump, consolidate to the 13 sma roughly, jump, consolidate, etc at this point.
GDXJ (per scenario 7) https://uploads.disquscdn.com/images/dc7ff5e1daa874dd4cf6a2ad2ac7f96f6b2b3070432891c33e9b4b0e8365d092.png
Just sold all my NAK – so those of you still holding be ready for a .50 move higher 🙂
You’re welcome!
Miners waiting on the Fed minutes to show the next move?
Thanks Mark! I thought it was going to have to be me stepping up to the plate and selling, but I’ll give it another day or two now : )
The NUGT 1 hour chart looks ripe to me….
RSI real close to overbought/slo stochs at very top of range…
Thoughts?
Stopped out of NAK! And MACK giving it all back. Come om GDXJ roll over!
Ditto _ And I own OVAS too.
Alex, is this retracement in MACK normal, or does it concern you?
It doesn’t concern me. It is in a base , and sellers probably sell at the top of the range and try to buy at the lows again, but one day it’ll pop and then they’ll chase and drive it higher.
nice. thx for the feedback. I did pick up a little at 3.08 after I sold, and after you mentioned you bought some.
Refresh- seems a bit early to Top here, but we’ll see. I’ve drawn it with continuation of base making, ot break out.
Again, it looks too early to top here
https://uploads.disquscdn.com/images/caf02c15757712fd6646058726d9c52e409b518cfec0f92d8fe11a6f2f07c1ba.jpg
so the full stoch is the ‘tell’. thx again.
CCJ is forming a nice bottom. I took a LEAP calls position. Very good r/r here
Yes! I like the action today.
Selling JASO here. SWN looks great! (Thanks for the reco Alex!) About to give up on GEVO, but not quite yet. Bored in NWGFF, but such a small position, still gonna be patient. And go little TINKA, go! *bort bort*
Man, missed the add in SWN yesterday – beauty today, I didn’t see until way late in the day!
ALEX! A lot of similarities here. Double top formed previously, had a pullback then moved higher. Looks the same right now. See the purple arrows for double tops. Note same TSI and STOC readings. https://uploads.disquscdn.com/images/ab7f9afb923290fb6dd957796fb8cc97d4415d4f78e7f92016eab5d60b5a5198.jpg
ALEX, what’s the cycle count in both cases?
He said this morning gold is day 16, 3rd daily cycle.
I was hoping to get Alex to compare the last double top cycle wise to the current one.
So, based on this a pullback in gold is a “buy” and not yet headed for the next daily cycle low, eh?
Actually, follow the gold candles. Gold previously dipped to 1243 relative to the current position. When I checked out the previous low, gold went higher on 2-27 but the miners went down drastically.
PURA has a good day today +32% (mj sector)
Uranium sector does not look to have bottomed yet….imo….soon though.
Watching FCX for an entry.
In Aspen for a few days….powder day. 🙂
Enjoy Aspen. Just came back from Crested Butte. Great snow