
4-19 The Calm Before The Storm
In yesterdays report, I was complaining about the boring ‘put you to sleep’ type of sideways action in the markets lately. Apparently that was the calm before the storm, because later that day we finally saw some pretty big changes take place all in one day. Something interesting occurred in the General markets, Oil had a big drop of almost 4% (!) and the selling in the many of the junior Miners that I had been pointing out picked up the pace too. Let’s take a look at the markets and discuss the recent developments.
.
SPX – Not a lot has changed here, but I’ve mentioned that I’m a bit concerned with the XLF . Now there are new threats to the General Markets. The SPX remains under the 50sma and threatens to break below the prior lows. A break down could lead to a good sell off, and a break out higher could lead to a decent rally, but it is getting late in the 3rd daily cycle, so upside may be limited the longer time goes on.
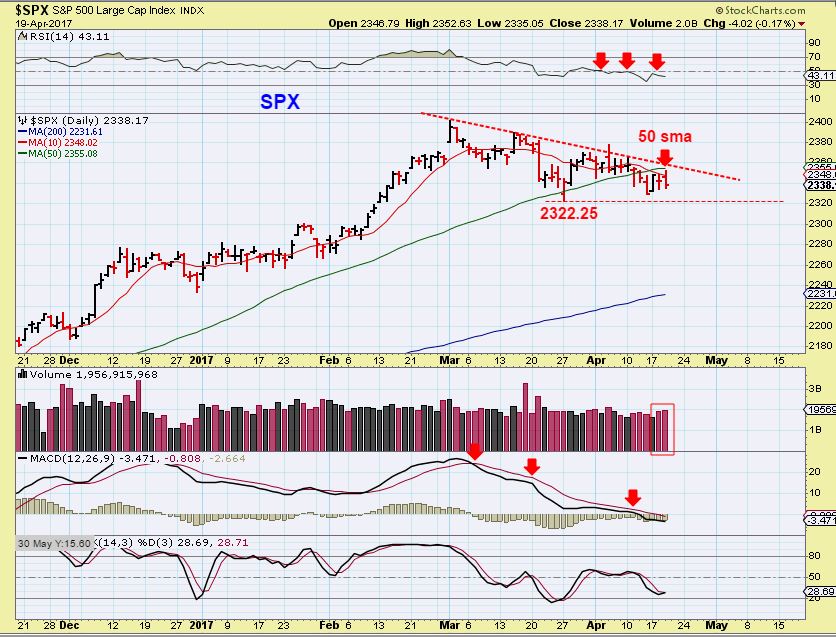
This is interesting though…
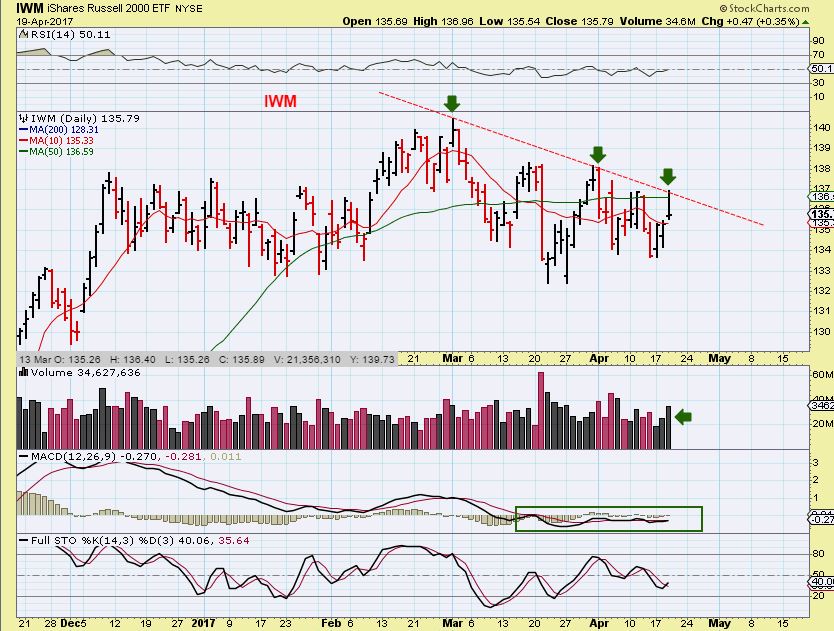
The IWM looked as though it was going to break out, but it was rejected too. Time will tell if this was an initial attempt at a future break out or a false rally. The chart actually looks to be improving, but now let me show you another concern…
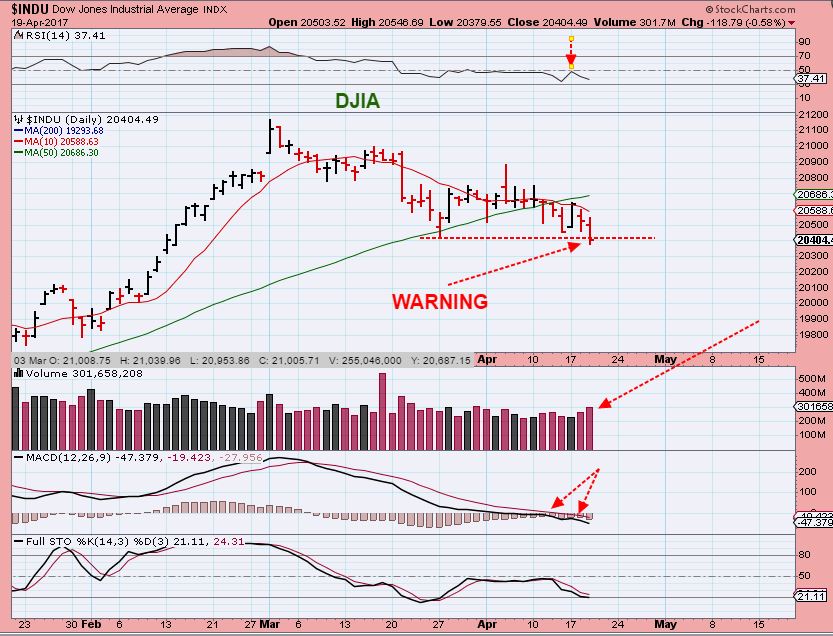
DJIA– THIS is a warning to me- The DOW has taken out its March lows and volume is increasing. I view this as a breakdown more than a shake out. I often use the NYA as a strong gauge for the markets, and it is also breaking down. This is a failure under the 50sma and can lead to accelerated selling. This consolidation has been a series of lower highs and lower lows.
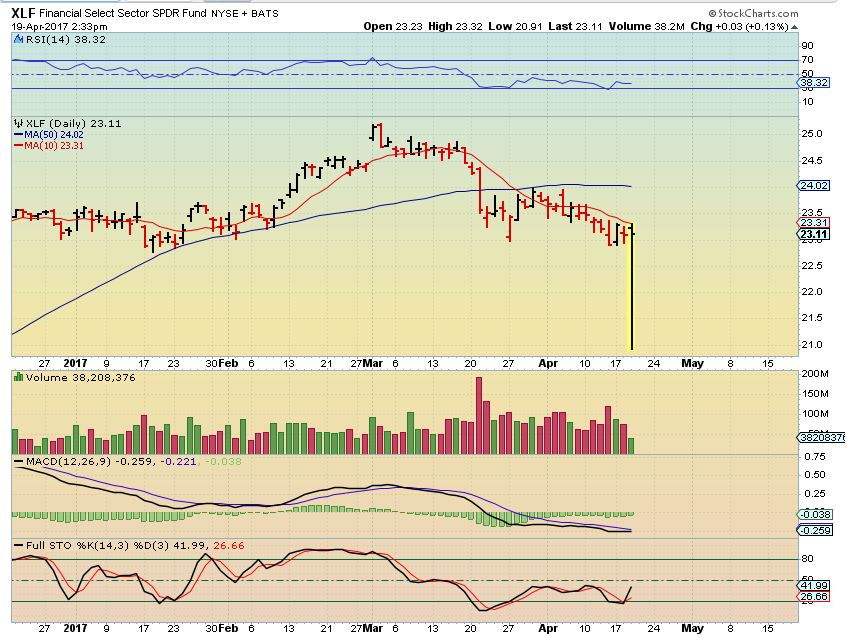
XLF – The XLF showed one of those phantom ‘spike downs’ at 2:30 in the afternoon ( it later disappeared). If these really are predictive, this would also indicate that the markets could be set up to drop.
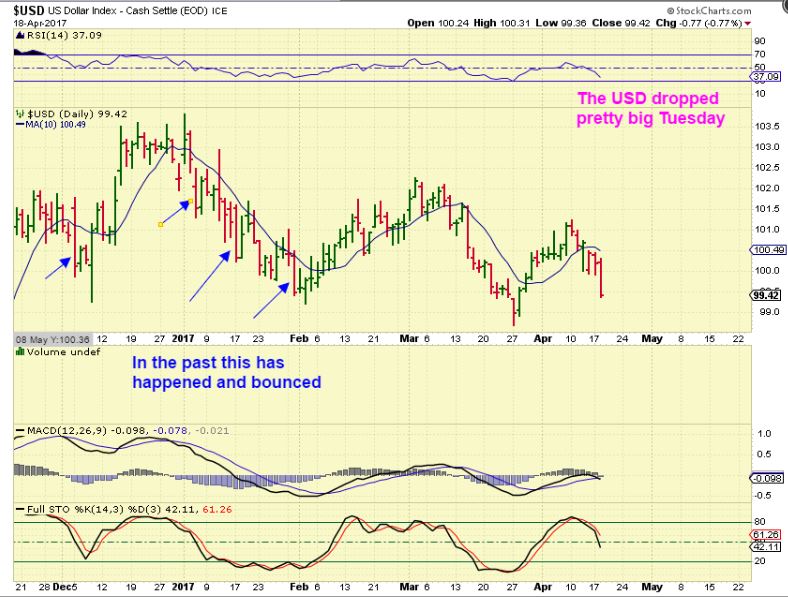
The USD dropped rapidly on Tuesday and I used this chart to show that in the past, a strong drop often was a 1 day event followed by a bounce. Wednesday, the USD did a little bounce higher just like these other times. The chart is currently inconclusive when it comes to bullishness or bearishness.
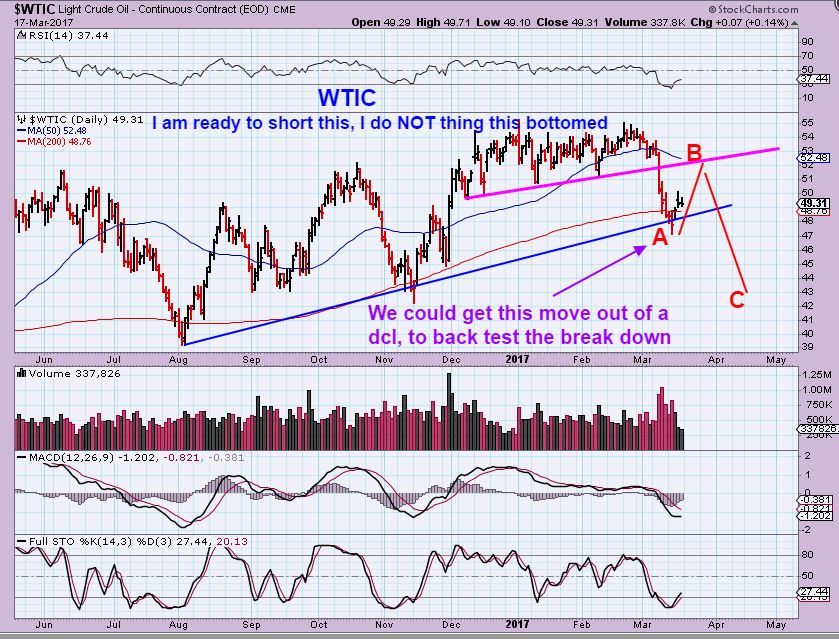
WTIC – The Story with OIL , a step – by – step review.
OIL SHORTS were at record levels and I originally expected a Drop, and back test of that trend line break, and a resumption of the drop into an ICL. using this and other charts over a month ago. I wanted to go short at the ‘B’ back test.
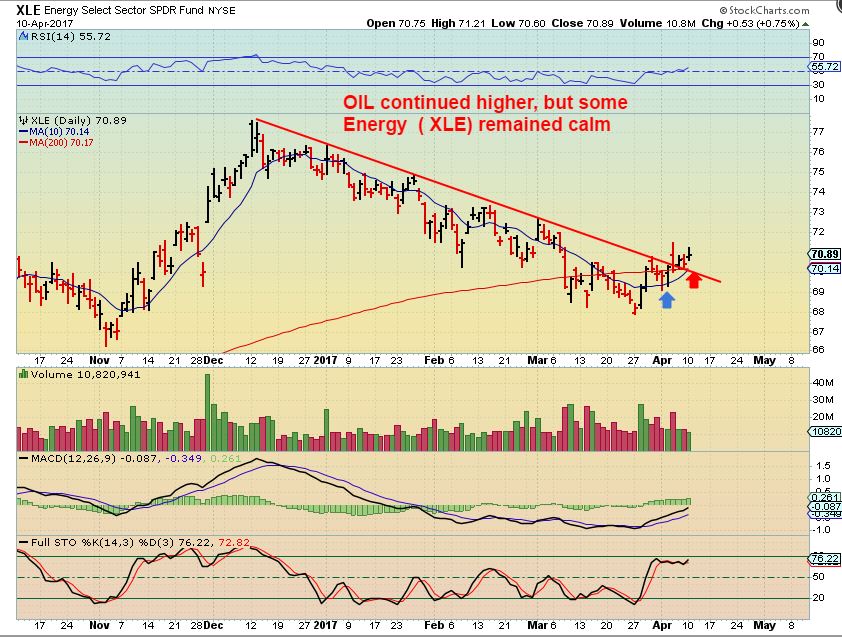
After OIL rallied to that “B” point, I noticed that the XLE & ENERGY STOCKS actually looked to be recovering. They broke over the 50sma and also broke downtrend line & channel. That said, I decided that I wouldn’t short Oil at the B point. This was the XLE recovery on April 10, and we viewed it along with LPI, OAS, SWN, MRO, WPX, etc etc .
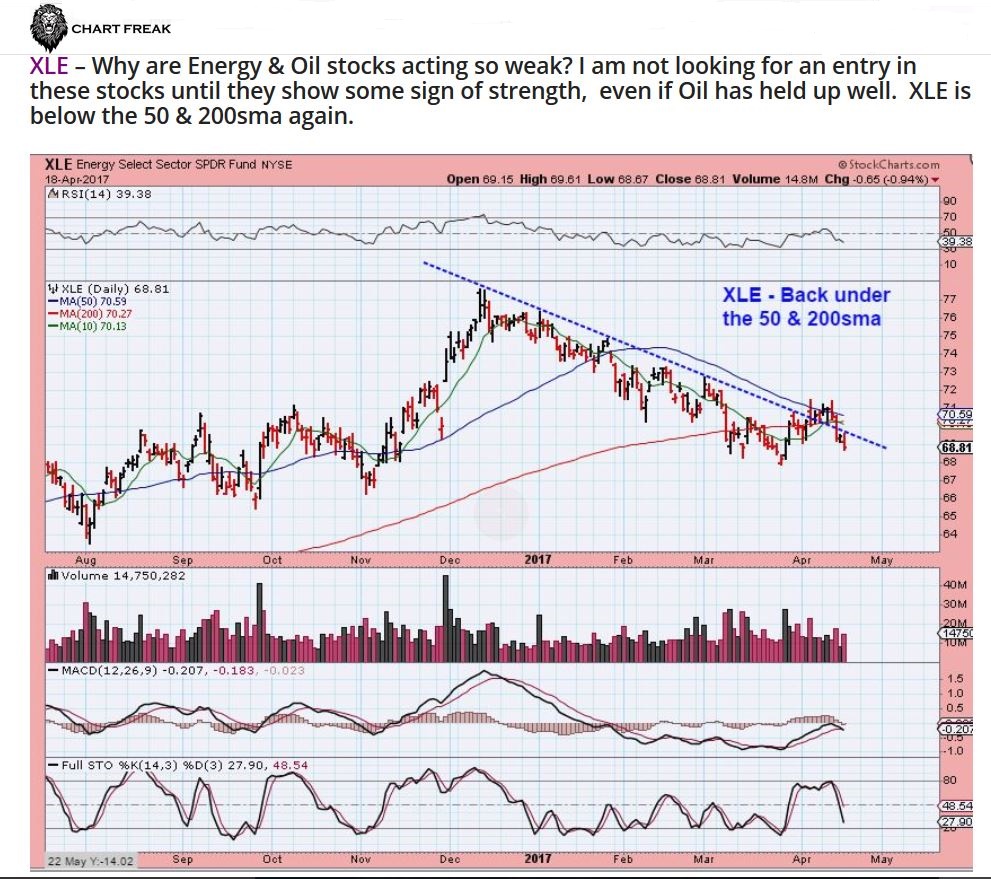
Recently, Those Energy stocks started to pull back again ( That is Normal), but when they broke back below the 50sma and started to look suspect, I mentioned concerns. I then said that I was NOT looking to buy Energy stocks on this pull back, and it seemed like something was wrong. When Energy stocks are leading the way lower and Oil was still at the highs, it was concerning. I posted this CHART & COMMENT in yesterdays report…
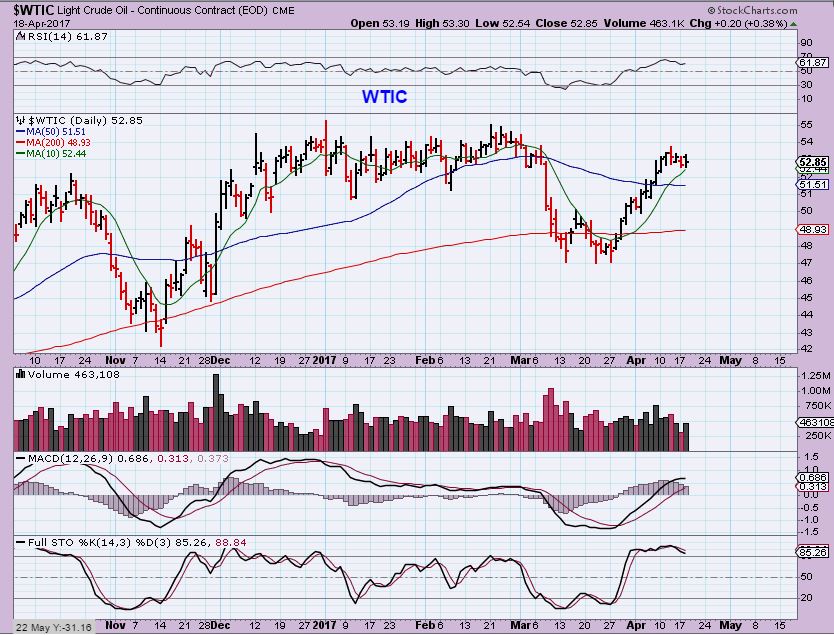
So also in yesterdays report, OIL looked strong. The Energy stocks had dropped back below the 50sma, so maybe I should have shorted Oil at the ‘B’ point when XLE broke down? This was Oil on Tuesday.
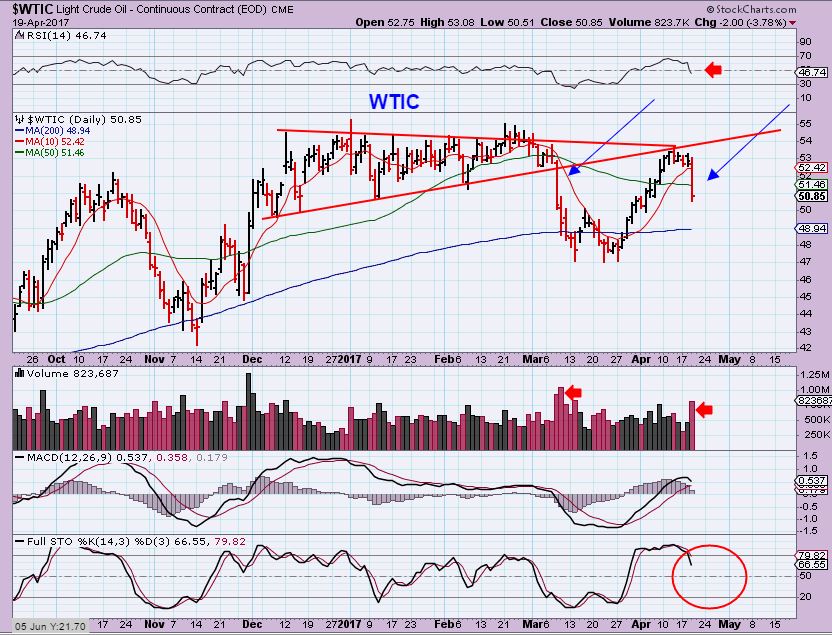
This is OIL on Wednesday, now following the Energy stocks. So far, Oil actually did exactly what I originally thought it might. It took so long to travel this path, that I had doubts. So what I am saying is that this may now drop to a lower low and give is the real ICL. I will be watching Energy stocks as this drop unfolds, because they may show signs of strength BEFORE oil bottoms, and the lows could be a great entry again, this time with a sustained move higher.
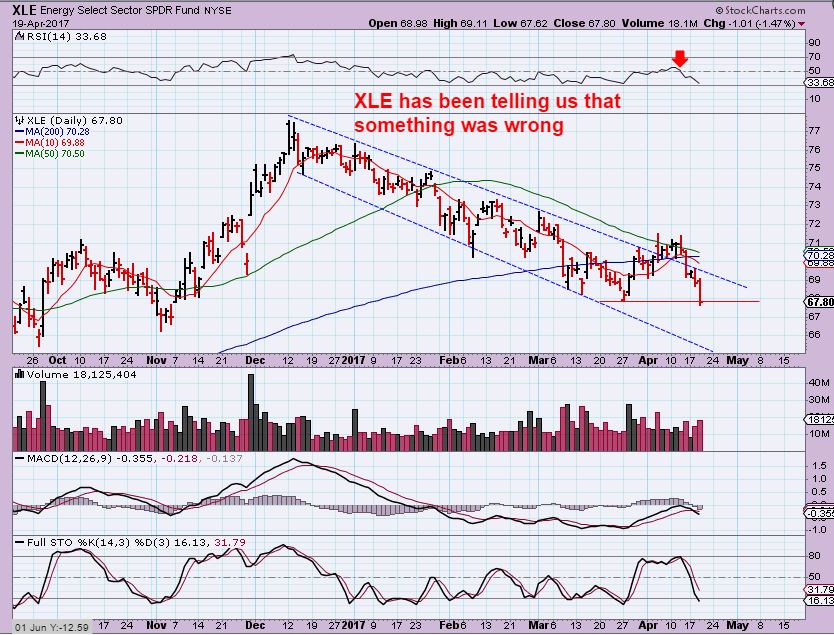
XLE – Leading the way lower, we now see that the XLE broke to new lows Wednesday. This may be indicating that OIL will do the same. We already see divergence at the lows in the MACD- that can be a good sign.
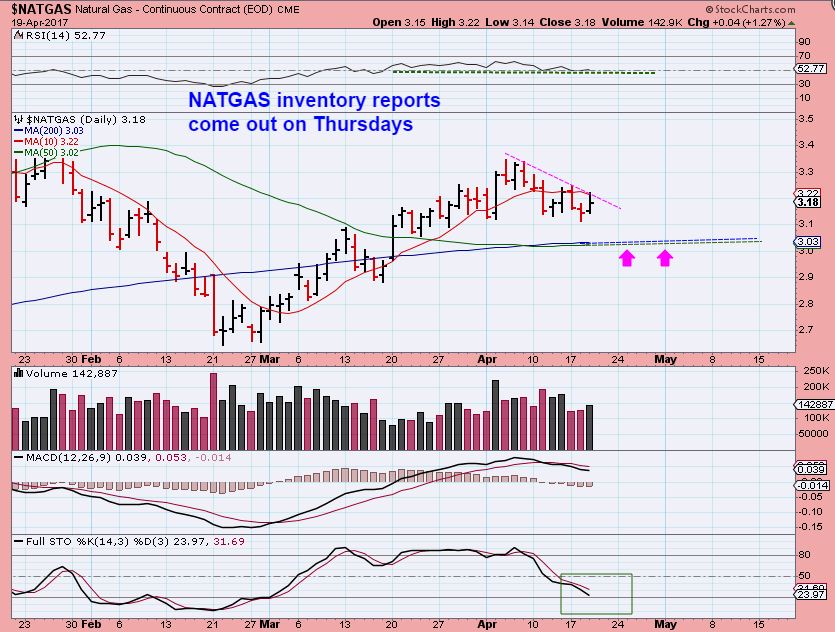
NATGAS – NATGAS inventories are released on Thursday morning. I expected a drop to a DCL at the support area of the 50 & 200sma that are now joined together. Inventories may cause that drop, or they may cause a break out. That could become day 2 of a new daily cycle if it closed above the 10sma and that down trend line. That is considered a low risk entry for the next ‘long Natgas’ trade.
GOLD & MINERS
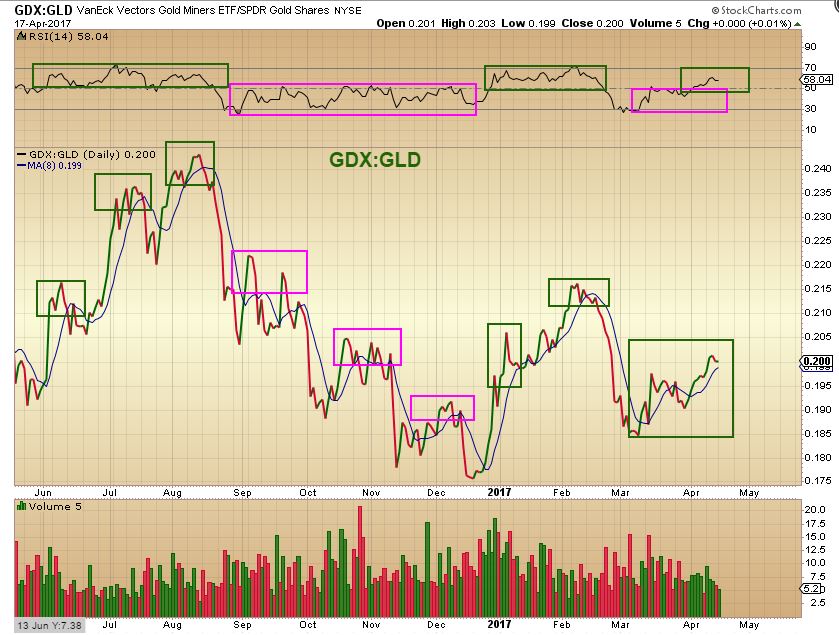
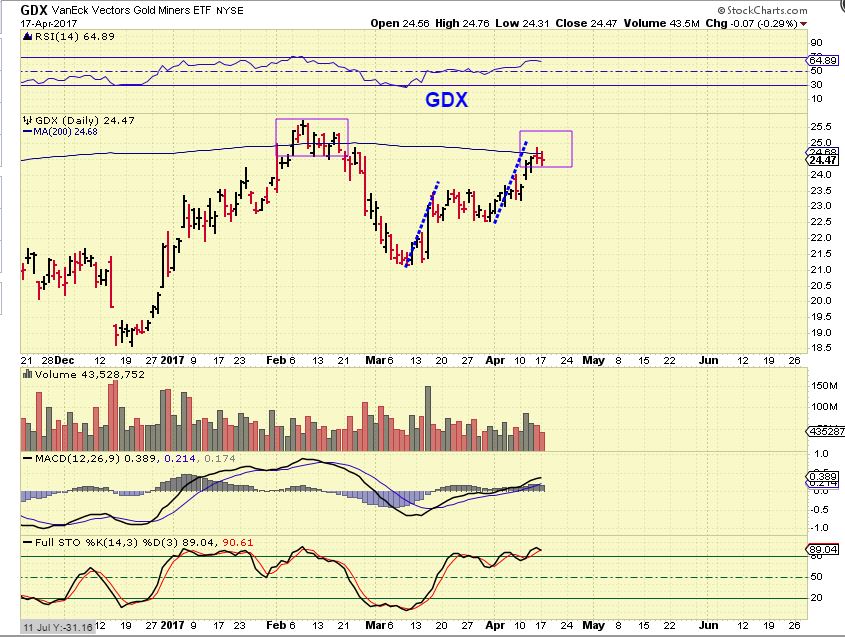
GDX: GLD APRIL 17 – This was curling down, showing that MINERS were starting to sell off ahead of GOLD. A cross down is a strong signal that selling has begun leading Miners into a dcl/Icl.
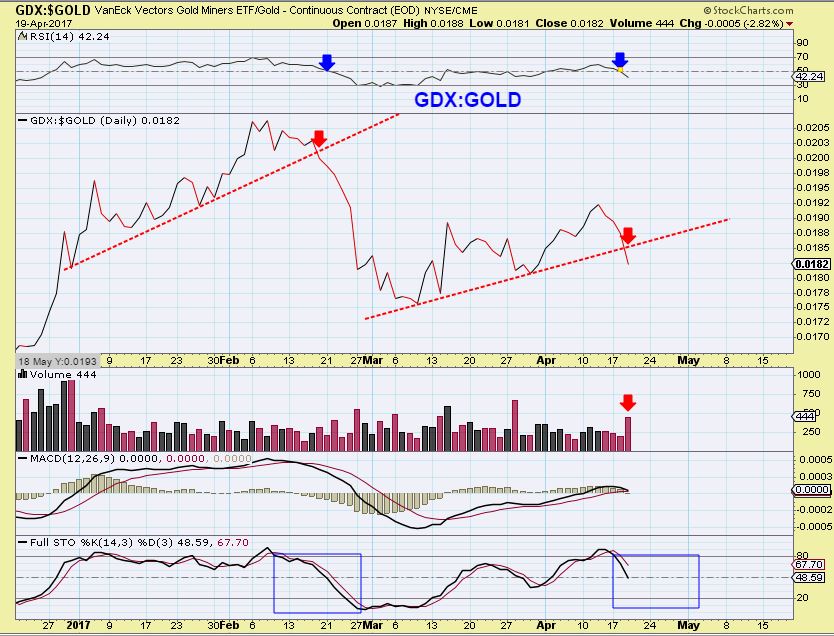
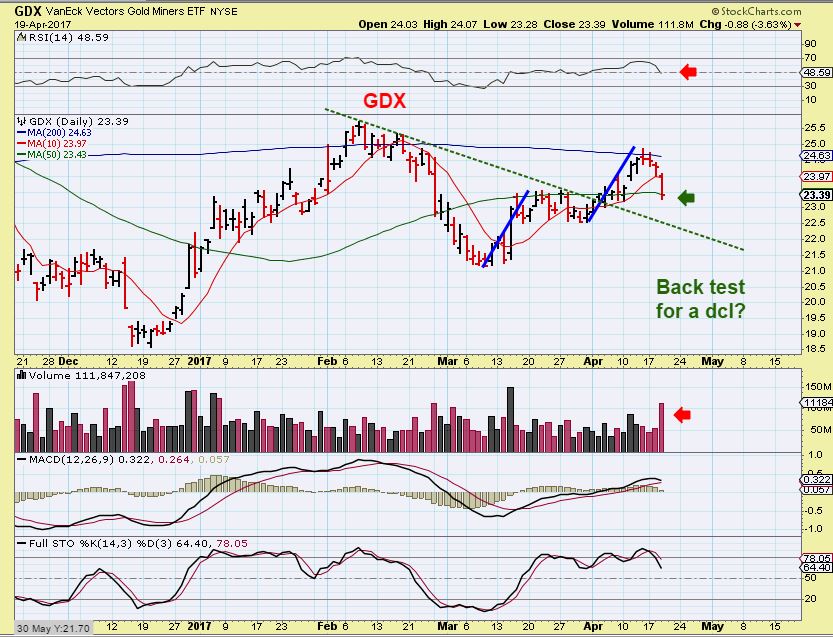
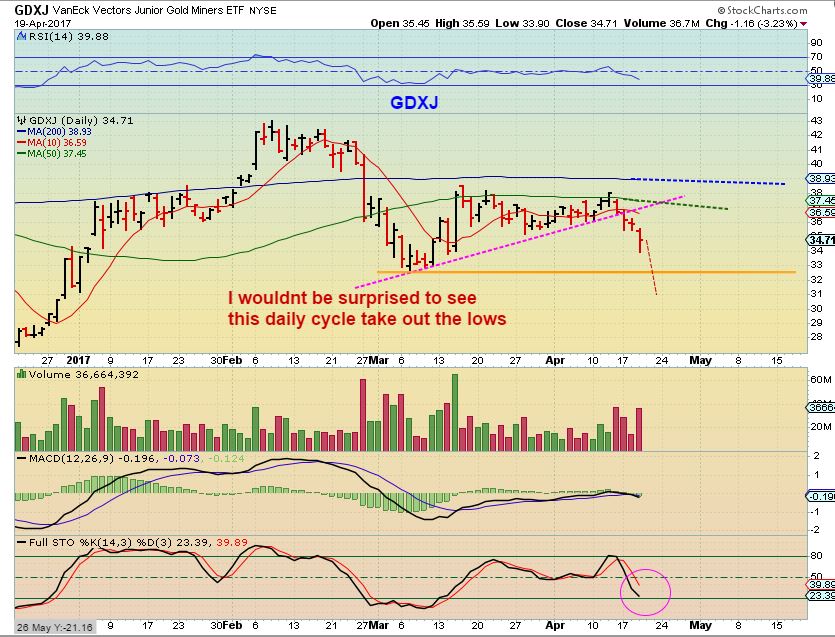
GDX: GOLD now with a simplified view – Miners are selling off and broke down below the uptrend line. Notice how this compares with the Feb sell off. If the selling is similar, we have more of a drop left in the move.
GOLD – This was GOLD on Monday. I used this chart to show that Gold was due for a top ‘timing wise’ and possibly completing this measured move near the $1300 area.
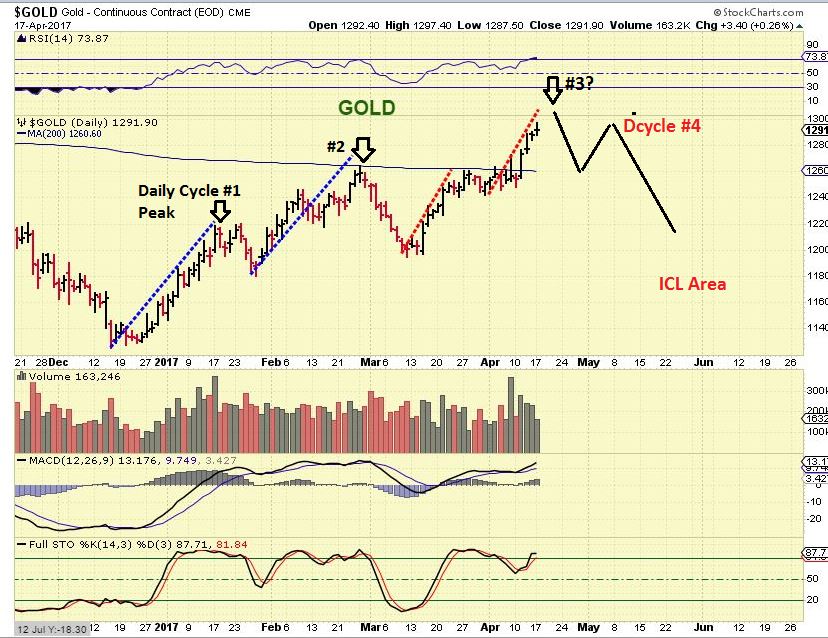
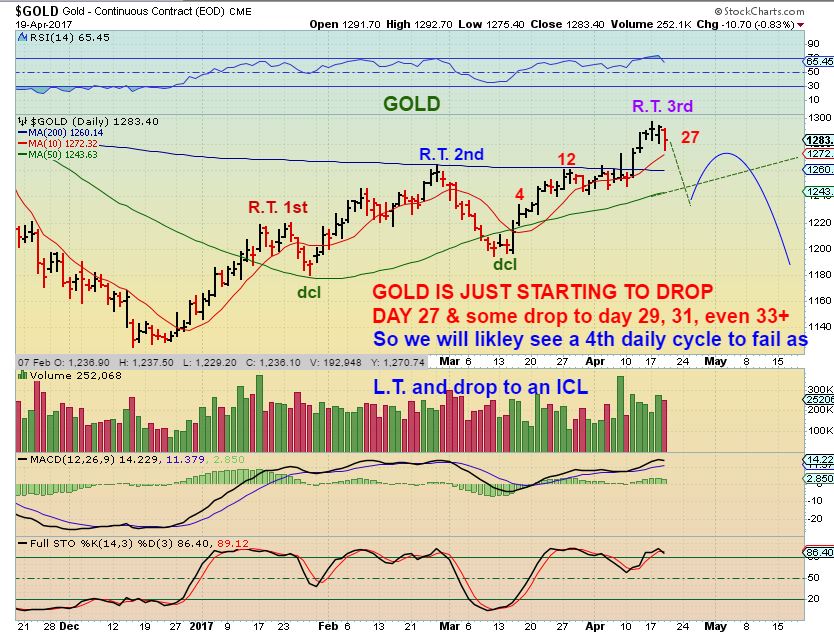
This is Gold now 2 days later , and it looks like the drop may have started with a swing high now in place. Please read the chart. What a strong rally in GOLD, but MINERS were strong out of the gate and weaker after a Feb peak. So Gold could seek out a 3rd daily cycle low, and then have a 4th daily cycle low into an ICL as shown.
MINERS have been weaker than GOLD, and I have been shorting GDXJ at the 50sma. It took an eternity for this trade in JDST to stop running from $12 .75 to $15+ and back, repeat, repeat, repeat. Lets review some charts from prior reports.
GDX MONDAY APRIL 17th – THE MEASURED MOVE COULD BE COMPLETE AT THE 200SMA
GDX WEDNESDAY – Measured move was the TOP. You can see that if this were to drop like it did in February, there could be plenty of downside left. That trend line doesn’t have to stop it.
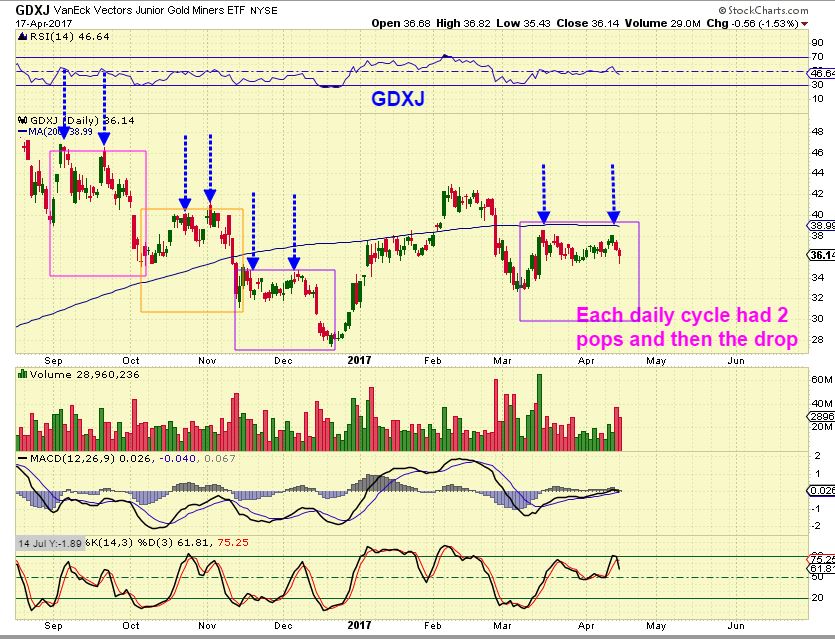
GDXJ MONDAY – I mentioned that prior daily cycles had double tops and then dropped. The timing was right and GDXJ was at that 50sma last Thursday & Friday.
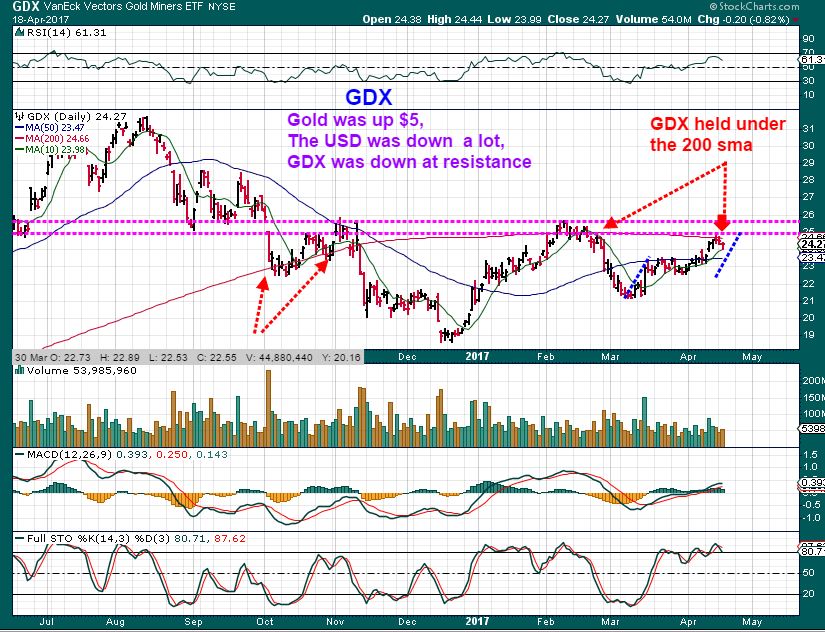
YESTERDAYS REPORT– These 2 charts pointed out that even though the USD dropped rapidly, Gold went higher, and MINERS sold off. TIMING was late in the daily cycle and we are due for a drop into a DCL. Again, That measured move was pointed out in blue. It was just a matter of TIME before GDX would sell down.
GDXJ – I even showed what a drop may look like in GDXJ if it drops, bounces in a 4th daily cycle, and then drops into an ICL later.
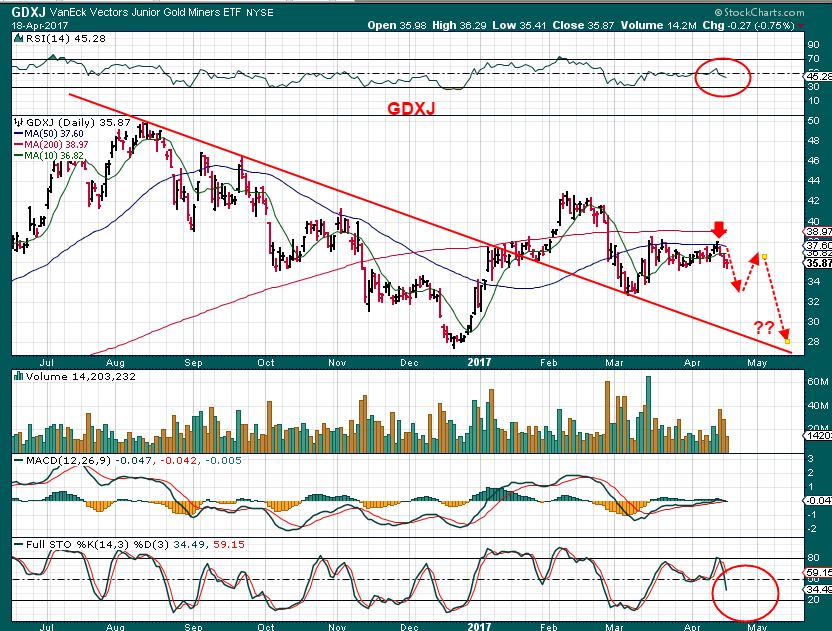
GDXJ – GDXJ dropped yesterday. Please look at the final days of the sell off in FEB into the lows. You do see that it was Down 1 day, up 1 day, down 1 day, up 1 day, etc etc etc into March, right? I have readers asking me if I think Miners will be down or up on Thursday & what about Friday? Look at this chart and you can gain some insight as to how they can act heading into the lows.
So I would say that our sleepy markets, with the day after day sideways choppiness, are finally moving in the right direction. It could have just been the calm before the storm, and the selling can continue for days. There may be bounces or reversal candles along the way, but it is not time to go long Miners when prices could be MUCH lower at the end of the 4th daily cycle low. Please believe me, if we are dropping into an ICL, miners can drop like they’re falling off of a cliff, no matter how good they may have looked over the past couple of weeks. These could break their Nov-Dec lows before the selling is completely finished.
The General Markets look precarious here with the DJIA and the XLF breaking below prior lows. I’m watching to see how this plays out, but it still looks like it wants to drop.
OIL started selling off in a big way Wednesday, and we’ll have to see if it drops and takes out the lows like the Energy stocks (XLE) just did. Energy stocks may start bottoming first in the near future, for those looking for an entry point.
NATGAS looks to be near its lows now and the inventory report at 10 a.m. today may push it one way or the other.
For those patiently waiting for an opportunity to go long Miners, that time is approaching in the coming weeks after this sell off finishes up. They always do very well after we get that ICL in place. You do not even need to catch THE LOWS to make a great profit, but we will enter at the lows or at least very close to those lows when it finally arrives. For those still short the Miners, they can bounce around and a dcl could also form and then it would be a week or two before the 4th daily cycle rolls over, so I’ll be monitoring that area going forward too. Enjoy your Thursday & Friday trading, and I will look to see if I can find a few short term trade ideas for active traders in a short Friday morning report.
.


Super report Alex!!!
Thanks Deshy
hey… where’s my thanks ….
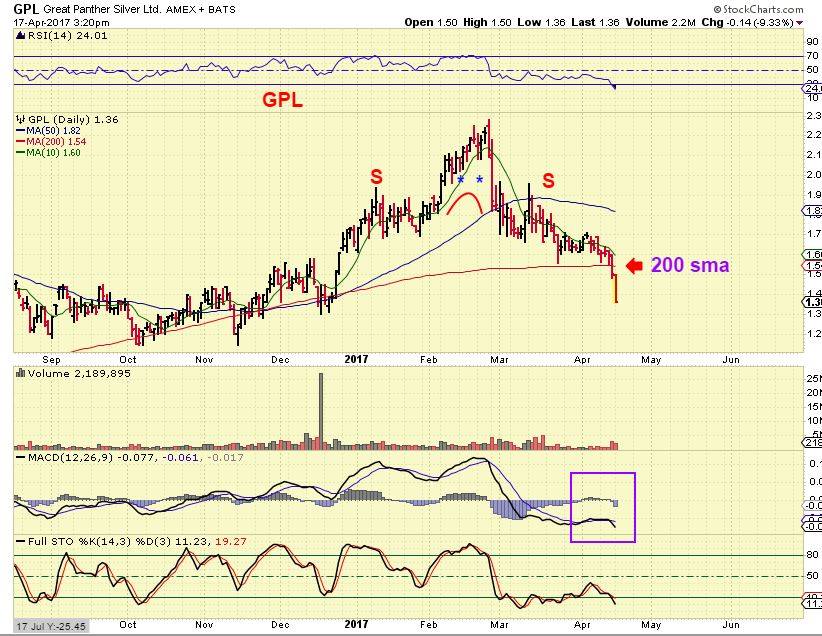
I thought you were talking to SOG about his GPL chart. Sorry
THANKS MAWEEYAH
Edit: So now I see that your comment was about 2 hrs before SOGS. You said , ” I know that guy” & I thought you meant in the GPL chart. I was away all morning…neeeed moooore coffeeee!
Great report as always! Stating the obvious funny how the PM section of the report is always at least 2/3 of the content – just shows how complex and difficult PMs are to trade 🙂 General markets and Oil the way for me!
This is true Zoli – true true !!
There is actually another underlying reason… It is the precious metals traders need for all the proof in the world, especially when geopolitical dangers exhist, they do NOT want to think that Miners can drop.
I dont mind, and I totally understand this thinking, but If I leave 1 question unanswered, If I dont explain every single detail under the sun…I get questions in the Precious metals.
With OIL – I cover which direction I expect…that satisfies the Oil guys & gals. I throw in a XLE chart & they see it as a bonus. – lol
General markets, I cover a few sectors, that crowd leans 1 way or the other happily. 🙂
Get to NATGAS – Traders there just want to know which direction is likely using 1 chart. 🙂
Then we get to the Precious metals. I do a GOLD, SILVER, GDX chart…and I get “What about GDXJ?” ” Did you notice the COT?” ” Have a look at the GDX:GLD – does that change your thinking?” “Have you seen the BPGDM? What does that tell you along with your other 9 charts?” Did you know that N.Korea is planning a nuclear test- how will that affect your charts? Etc etc etc – LOL
I am saying this in a joking manner, but I am dead serious. The precious metals traders have been fooled before, they’ve been caught on the wrong side. They LOVE TO GO ALL IN…they hate to trade small amounts, thus I think they dont trust it when they are long, they want to buy more whenever it is dropping, They need daily if not hourly updates , whenever GDX or GDXJ goes from red to green or green to red, etc etc . It is a LOT of work to convince a precious metals trader that exhibit A – B – & C are enough.
And I get it, I understand all of those feelings when trading it long or short, because I have trade that sector more than most other sectors too 🙂
when can we expect to read your memoires
I m sure you’ll have zillions of stories to tell : )
great report by the way !!!!
people should be honoured to have access to your newsletter and know how – think that is really, really underappreciated besides all the other great and good stuff you’re doing ! thanks for having me
Wow, Thanks Ray- thats very kind of you…
I’m slowly sharing those memories in each report. I had many painful memories when I first started out. Buying a break to a new high in a 3rd daily cycle long for example, because they charts look so bullish, only to ride a 4th & even a 5th daily cycle into an ICL weeks later.
The more I share, the less the readers have to experience it. 🙂
I agree with every word you said and as ray said I feel very lucky that I found your service a couple years ago and now making money consistently 🙂 I used to ride horses in my 20’s and for a while a had this horse that would get spooked of literally everything and buck me off multiple times a day – painful. Then I switched to a calmer, older horse and I was enjoying riding much more – you get my point 🙂 🙂
That’s a good story. lol
Riding full speed on a bucking bronco all the time would be exhausting.
Even a Calm steady horse can enter the race and run like lightning when an ICL lightning strike takes place. Gallop when you need to, cantor when you can, trot when the grounds call for it.
( We go a watch my 13 yr old niece when she enters local horse shows in the summer ) 🙂
Past big winners like TGB also getting smoked lately.
There are green shoots rising from the ashes.
Yes, when they are running ( TGB, CLF, VALE, CENX, and even many MINERS) they just seem like everyone wants them and they will never pull back.
Then when they start a pretty good correction / consolidation , it’s hard to imagine them being loved again. funny market psychology
cgix started moving,hope it continues
I still like it and own it, but it has been another semi – tough to hold stock. As a Biotech, this one burned me once long ago.
That said, I still added this morning to what I already own – I’ve been watching this one daily ( $3.85 – jumped in a tad after it started running higher).
made money on cbix, sold it and back in today
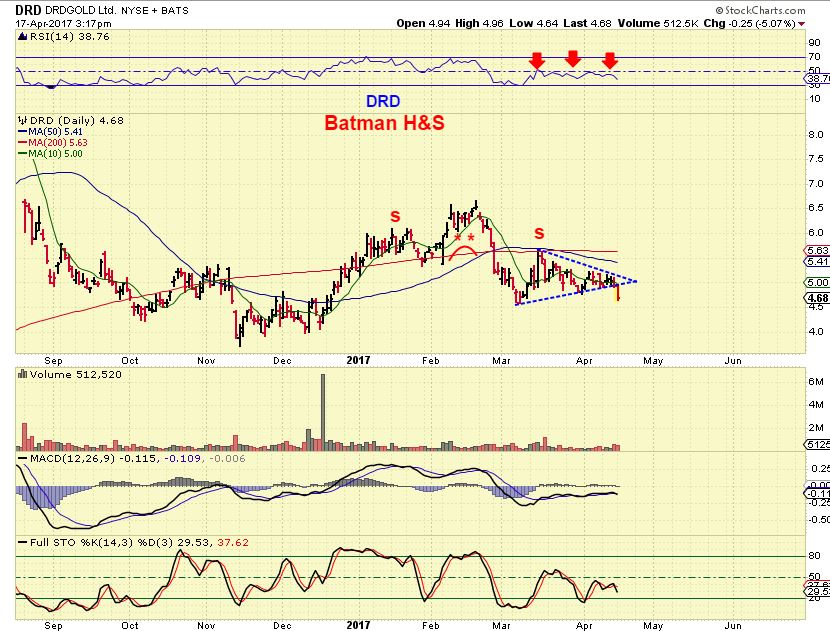
Bat-Man H&S and the sad face under the GPL chart? Hilarious!!
X, CLF, AKS, VALE? Are they gonna try something here?
I would be surprised to see markets, oil, gold, and miners all down for weeks. I would expect somebody to stabilize before too long. Possibly general equity markets? If they get kicked it’s usually a positive for alternative investments like oil, which I think is just a little bit less likely here.
Buying 1st tranche:
URA (added) …. uranium
REMX ……. rare earth metals
SID/GGB …… steel
URA MACD does show divergence and you can draw a trend line along the March April lows and be in a support area.
Best wishes!
5 waves down from the march highs also for ura….
steel is trying to bottom….
as is rare earth…..
Do you mean Feb highs?
STEEL – And I do like that ‘X’ landed on the 200sma and reversed, now in an oversold position.
Strong volume today too.
STLD held up pretty good through the selling too.
no march high at 16.77…top of my b wave.
yea i think steel is ready to bounce…..
Ok, march high, got it, thx
STLD had good earnings. X and AKS are next week I believe. Probably will be good as well.
AKS is a definite option for steel……nice bottoming chart.
AKS just filled a gap from way back in November. Wow.
Though I do really like the volume on X, it is still below the 10sma. I would wait for a little more confirmation or one might be stuck inside of a consolidation. .
Nice call on X, Ken!
Maybe you should be buying SID & GGB Bill
SHLO is another one to keep an eye on, ran like a gazelle last time. Formed a bit of a wedge after that last run up
I was tempted to grab some SID at the lows, but I was researching it a bit and I cant find earnings beyond Nov 14, 2016.
Need to dig deeper when I have time.
Quiet day again in CF-land, i see…
your GPL H&S was a bit sad, so i cheered him up.
(too much time on my hands as you can tell)
https://uploads.disquscdn.com/images/22977ceddffacba55153b191d143756dbaac542f1e8c2653a5bc62af48b602c8.jpg
refresh F5!!!
HA!!!
https://uploads.disquscdn.com/images/3434d18d61f0349fcb0736aedb3cfa2028dbdac8e4813387733895ead9b64635.gif
Oh My GOOODNESS!
I’m the victim of a John Travolta Head & Shoulders Photoshop – lol.
Alex Travolta h&s deluxe V2.0!
refresh F5
https://uploads.disquscdn.com/images/f770145411eaff8061157b984bd1837181d2e7298d0a9a00ade358496b37d7d3.gif
And both ‘s’ are in my hands. You are pretty talented SOG…
– now knock it off – : – )
🙂
im available for weddings & barmiztvahs.. very reasonable fees.
Do the words ‘Stayin Alive Stayin Alive…” keep running through your mind when you look at that chart? Suddenly it does in my mind
that was my inspiration.. but i had 2 ‘s’ to consider instead of Sat Night Fever single pointy hand
Funny..and impressive SOG! LOL
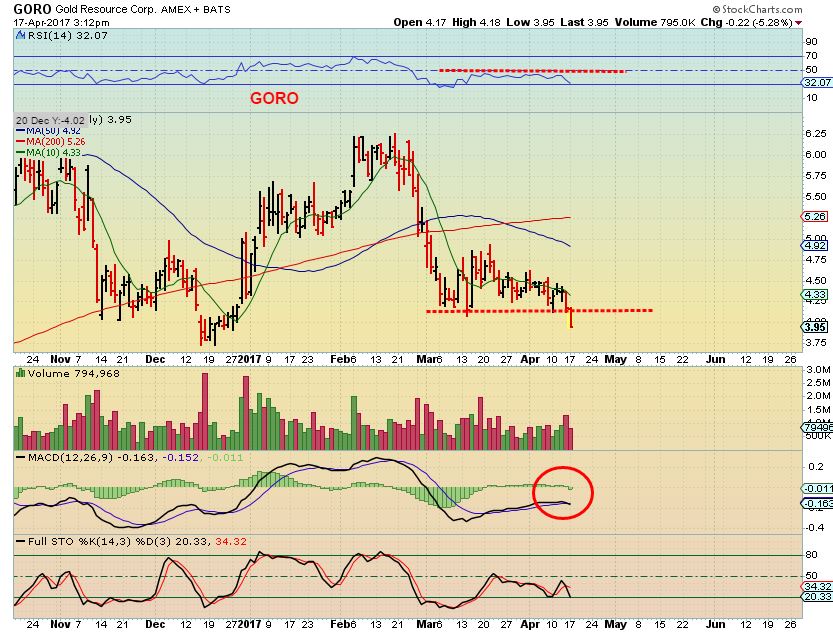
I know GORO is an example of what miner not to buy, but I can’t help it, I want some at 3.75. (glutton for punishment)
What is the reason, Ann? It seems that once below the 200SMA it could go to 3.00 before support.
Feels overdone to me. My preferred miner if I am going to stick my neck out.
TGB retraced to an important resistant line at 1.00 yesterday and is gaining nicely this morning, while still well above the 200 MA. If it can hold it might be a tell for HBM just above its 200 MA and WRN. In the past these copper miners, IMO, have preceded our gold and silver miners.
NASDAQ has been stronger than SPX, RUT, DJIA, etc and
TTWO is a pretty Bullish break out from a long consolidation. That is a good looking chart right off of the 50sma.
SMH should also be considered at these levels…..imo
I’ve been watching SOX, and was actually thinking that it might be a possible ‘short’ on a back test of the 50sma ( Which would have been SOXS for me), but it is trying to regain the 50sma , and SMH already did , so that could have been a shake out in semis if they do regain and hold above the 50.
i like SMH above the 50 sma……entered yesterday on the break of the 50 and 10 sma.
NAK could be doing a bullish engulfing on the daily chart…. GAP FINALLY FILLED
I mentioned that I added on Monday
alex, are you not concerned the impending ICL in gold/miners (which I agree with) will drag NAK down with it? I cut bait with it recently thinking that I could buy back in later at a much lower price than it is now…
Hi Danyo – It could, noo doubt, but the short answer is no I am not worried about it at this point, because for one thing, they also have many other “Metals” in their ground. The other thing is historical precedence.
SO If you take a look at charts of GDX & GDXJ and look at what they did October through December 2016
Now look at NAK October through December. 2016
Oct through December was a deep sell off for Miners ( ICL) – Nak rode higher on its own.
As I wrote the below comment, GDX started to sell off and so did NAK You jinxed me Danyo 🙂
haha nah it’s still holding up nicely!
cgix had a loss of .15 versus estimated loss of .22,that is why its moving
That’s odd. Have a look at this – I read this in March
http://www.marketwatch.com/story/cancer-genetics-inc-announces-record-revenue-for-fourth-quarter-and-full-year-2016-and-provides-2017-business-update-2017-03-23?siteid=bigcharts&dist=bigcharts
JDST BUY on a hrly at $16
Just talking out loud….
JDST ran from under $16 to $16.73 – now pulling back
So Now their is a SHORT TERM buy ( 1 hr chart, MACD CROSS) on GDXJ .
I’m not day trading between JNUG & JDST like this, but one can catch the moves intraday if one is fast.
I’m not taking this GDXJ ( Or JNUG) buy, and I’m still holding JDST –
I’m using daily charts and trading the cycle expectations. I still expect a dcl in the near future.
type in STOXLINE , put in cgix andgo down recent market news (cancer genetics releases qtr erns res beats est by .07
info on cgix is also on CERBAT GEM
hey conspiracy theorists.. lets hope this GDM ‘long tail’ doesn’t come to pass 🙂
https://uploads.disquscdn.com/images/072d406321198fe78a60ceaa313b6f1b0fd209eec6530d8f5c84533e6edef97d.jpg
Silver? What just happened, brother?
nothing new here, Cason. same old story. 🙂
nasdap go crazy
SPX above 50sma. Does this mean the general market make the breakout?
It does look pretty good, SPY made its way back up to the upper trend line.
NASDAQ has been holding up the entire time as the stronger area ( Tech Sector).
I would imagine that if the markets break out & run, Miners will dip further into their dcl ( Which is expected anyway).
Also watching for the USD to move higher if it can muster up the energy.
the President just said steel is a buy, anyone listen into that call
Yes, I did. Trump Trade is back on after being off last 6 weeks. Game on, Wayne. Game on, Garth!
CLF-y I knew you could do it!!
Hi all, mad busy, always lurking. I checked in yesterday. I think it might have been Bill who made the steel call yesterday, who ever it was I owe you a beverage! CLF !
THX DAZ
I thought it was KEN saying steel. Now EVERYONE is talking about it- I got 3 emails 🙂
Fridays report will be about…..? 🙂
CLF, X – swing is in place, not yet above 10-day. I can count 5 waves down in CLF from early Feb highs. First pullback could be bought with stop below recent lows.
SXC & SXCP have nice breaks here
wow… i guess…
I still really like the 3-D printer sectors weekly charts
DDD, SSYS, VJET
DEF, for example, just busted through 50SMA on daily. Might stalk an entry, not a fantastic entry point exactly this second.
I’m not seeing where DEF was below the 50sma today?
Auto-correct. That is soooo frustrating – and what I get for reading CF on mobile. DDD, of course. DEF has nothing to do with this conversation. Going to edit the above. I didn’t even know that auto-c got me until I got a Disqus notification on your reply. UGH!!
ahh, got it. Yes DDD & VJET caught my attention after SSYS .
Gold up a little, GDX up a little, GDXJ still struggling.
Gold hasnt even broken below the 10msa yet. When Gold finally rolls over and drops to a dcl, , It will be interesting to see if r GDXJ will REALLY drop hard, or it’ll be done with the selling ahead of time.
Yes – gold will just not give it up. I have felt for a little while now that the top was about to come off the equity markets once the geopolitical news settled down and the Trump team to generate a few positive headlines. Today may be the beginning of that, and the rising market will turn gold lower in my view….we’ll see.
Does the fact that gold can’t even move decisively below the 10 day sma suggest there is underlying strength and maybe the downside won’t be as much as you were initially expecting? While not strong, I don’t see the miners as being really weak on any time frame going back to December last year. Miners are weak than gold and miners usually lead, but that’s about it arguing for downside in my opinion. Not to mention everybody I know is looking to short or already short miners, despite supposedly overbought gold.
I suppose my point is this isn’t typical action, not when we were long, and not now that you are short. The moves are really not that large, thus maybe the downside isn’t that great either?
Yes, potentially it does. Remember, originally we were talking about gold back down to the 1140, 1180, or 1200 pivots. Now a DCL pullback might only give us 1245 or so. I’m with you, I want to go long. Just not yet. I’d prefer a pullback, then I get my shares on sale!
I have the same plan as you, lets hope we get lower prices, but I’m getting itchy to buy already.
NASDAQ up nicely.
Tammie, If you popped in to read today I am thinking of you and sending you a hug.
Hi Nancy – thank you so much. We had to go to my mom’s house today for some things and it was the hardest thing
in the world for me to do. I just wanted to run out of there – she wasn’t there and being there seemed so pointless. Still reeling over the sudden change…..:( 🙁 I appreciate you thinking of me. 🙂
uggh…. I’m so sorry…. power thru it girl….
thinking of you and sending good energy to help….
https://uploads.disquscdn.com/images/86d2f5c6cbb5f2f41f359390110257150c423a4e47a4a6fd60a4f8d0646bfdd3.png
Thanks, Maria – appreciate the good energy! 🙂
Tammie, “Be gentle on yourself”. Good advice. Women are caretakers [generally]…we put our children, famililies, others, etc. first usually. Just take time for YOU. Find some time/place alone and cry out the grief and loss. Say everything to your Mom you want to. It will help keep you strong. If you need someone not directly involved to vent to, fell free to email me: nancytheartist@yahoo.com. Hugs to you.